variations between financial ratios for evaluating
TRANSCRIPT
115
(115 - 136)RIC Ana Ježovita VARIATIONS BETWEEN FINANCIAL RATIOS FOR EVALUATING FINANCIAL...
VARIATIONS BETWEEN FINANCIAL RATIOS FOR EVALUATING FINANCIAL POSITION
RELATED TO THE SIZE OF A COMPANY
Ana Ježovita
Postdoctoral researcher, Ph.D. Faculty of Economics and business Zagreb J. F. Kennedy square 6, HR-10000 Zagreb
Article info: Paper category: Review
Received: 23.6.2015. Accepted: 10.11.2015.
JEL classification: M41
115

116
REVIEW OF INNOVATION AND COMPETITIVENESS VOLUME 1 | ISSUE 1 | 2015
ABSTRACT
The paper includes analysis of financial ratios for evaluating a financial position. It is possible to assess the financial position of a certain company by using and combining liquidity, solvency and activity ratios. Preferable values of financial ratios should be related to the different factors, including industry, geographical position, size of a company. For re-search purposes appropriate parametric and non-parametric statistics is used. The research includes analyzing differences between financial ratios related to the size of companies in Croatia. Obtained results of the conducted research shows existance of statistically sig-nificant differences between financial ratios for evaluating financial postition for different companies sizes.
Keywords: financial ratios, financial position, size of a company, analysis of variance, statistical differences

117
(115 - 136)RIC Ana Ježovita VARIATIONS BETWEEN FINANCIAL RATIOS FOR EVALUATING FINANCIAL...
1. INTRODUCTION
Shareholders, creditors and other stakeholders evaluate financial position of companies in order to assess its ability to efficiently perform its operations. Related to that, important part of business operations represents capability of companies to collect sufficient amount of cash to settle its current and long-term liabilities. Com-panies’ operations greatly depend on environment conditions and geographical area, competitive advantages, industry affiliation, and the size of a company. Stated above is determined by business cycle, structure of assets and financing sources, which results with various business strategies and goals of companies. Consequently, analysts should take into account specifics and characteristics of business operations of different companies. Important differentiation segment is the size of a company.
This paper includes an analysis whether the size of a company has impact on a value of financial ratios used for the financial position evaluation. From accounting point of view the financial position evaluation usually include liquidity, solvency and activity evaluation. A sample used within the research includes Croatian companies, from all business activities of non-financial business economy sector, divided into three size sectors.
2. THEORETICAL OVERVIEW
In order to obtain comprehensive evaluation of the financial position, various specificities and characteristics of a company should be taken into account. Gener-ally, analysis of business operations should include: analysis of economic environ-ment conditions and geographical area, analysis of the industry affiliation, analysis of specific features of analysed company, competitive advantages of a company, ap-plied accounting concepts, methods and standards, and the size of a company (Huff, Harper, 1999: 96).
“The ratio analysis must be understood in terms of accounting principles used and the business practices and the culture of the country” (Gibson, Financial State-ment Analysis 2011: 182). Those guidelines give to the analyst opportunity to com-pare business operations, of a certain company, with the industry and a business environment. Determining market position and defining competitive advantages of a certain company is facilitated if annual financial statements of companies are uni-formed and prepared by using the same rules and procedures. In addition to that, it is necessary to define key factors of differentiation between companies to obtain com-prehensive conclusions by using technics and procedures of the financial statements analysis. Horrigan (1968) in his paper concludes that the most often factors which are expected to increase the dispersion of financial ratios are: “industry classification, size of firm, cyclical conditions, seasonal conditions, geographical location, and ac-counting methods” (Horrigan 1965: 563).

118
REVIEW OF INNOVATION AND COMPETITIVENESS VOLUME 1 | ISSUE 1 | 2015
The most important factor, next to industry classification, which determines value of individual financial ratios, is the size of a company. “One of the basic func-tions of financial ratios is to deflate accounting data by size of firm; and therefore, most of the size-of-firm effect should be washed out by the ratios themselves” (Hor-rigan 1965: 565). “A single ratio by itself is not very meaningful. Accordingly, vari-ous comparisons to shed light on company performance can be used: intra-company comparisons covering two years for the same company, industry-average compari-sons based on average ratios for particular industries, intercompany comparisons based on comparisons with a competitor in the same industry” (Kimmel, Weygandt i Kieso 2011: 55). Structure of assets and sources of assets, can be differentiated with regard to the size of a company. Considering that fact, it is reasonable to research dif-ferences of chosen individual financial ratios related to the size of companies. Value of certain financial ratio in one company can represent stable financial position, and within other company can represent some difficulties within a business operations. Taking into account all stated, research objective includes determining existence of statistically significant differences of individual financial ratios of financial position related to the size of a company. Related to that the research hypothesis is designed:
Hypothesis: Average values of the most important financial ratios for evaluating financial position differ related to the size of a company.
“Financial analysis is the use of financial statements to analyse a company’s financial position and performance, and to assess future financial performance” (Subramanyam, Wild, 2009: 13). Financial statements analysis includes methods of using different items available in the annual financial statements for creating infor-mation for decision-making purposes. Financial statement analysis usually includes combining various instruments as vertical (common-size) and trend analysis of fi-nancial statements, cross-sectional analysis of chosen financial items, regression analysis which is used to identify relationships between variables, and using indi-vidual and synthetic financial ratios.
Interpreting obtained results represents the most important and inevitable step of the financial statements analysis. Wahlen, Baginski & Bradshaw (2011) effective finan-cial statement analysis shows as a three-legged stool based on identifying the economic characteristics of the industries in which a firm participates, describing the strategies that a firm pursues to differentiate itself from competitors as a basis for evaluating a firm’s competitive advantages and evaluating the financial statements, including the ac-counting concepts and methods that underlie them and the quality of the information they provide (Wahlen, Baginski, Bradshaw, 2011,: 2-3). From economic point of view, financial position, next to business efficiency, represents essential factor of corporate management, which ensures existence of the company on the market. It represents safety of invested equity and financial stability of a company (Žager, 2009: 21,31).
Financial stability of the company can be evaluated by using liquidity, solvency and activity financial ratios. Important part of the financial position assessment rep-

119
(115 - 136)RIC Ana Ježovita VARIATIONS BETWEEN FINANCIAL RATIOS FOR EVALUATING FINANCIAL...
resents evaluation of company’s ability to settle its current liabilities. For that pur-poses, liquidity and activity ratios can be used. On the other side, it is not possible to bypass importance of a company’s capability to manage and settle its long-term li-abilities. Evaluating company’s ability to settle is debt is conducted by using solvency ratios. To obtain comprehensive information about indebtedness quality, solvency ratios should be combined with profitability ratios.
Short-term and daily business operations require ability of the company to generate sufficient cash amount to settle due liabilities. In that context it is neces-sary to assess competence of the company to convert adequate amount of non-cash assets to cash needed for settling due liabilities on time. Related to that, liquidity can be evaluated using several degrees of liquidity including cash ratio, quick ratio, and current ratio. To achieve more extensive results of evaluation, it is necessary to assess how efficiently company uses its assets within business operations, i.e. activ-ity of the company should be evaluated. Commonly used activity ratios for evaluating the financial position of the company are total asset turnover, current asset turnover and accounts receivable turnover ratio. Adequate financial position assumes lower liquidity risk and greater financial stability of the company.
Cash ratio represents relationship of cash and current liabilities, indicating part of current liabilities that can be settle immediately. “The analyst seldom gives the cash ratio much weight when evaluating the liquidity of a firm because it is not realistic to expect a firm to have enough cash equivalents and marketable securi-ties to cover current liabilities” (Gibson, Financial Statement Analysis, 2011: 226). Besides, it is important to emphasize that cash often has a high volatility. “There exists suggestion that cash ratio has to be higher than current liabilities which due within a month” (Žager L., Sever Mališ, Financijski pokazatelji kao podloga za ocjenu kvalitete poslovanja, 2012: 65). It is important to notice that “a high cash ratio in-dicates that the firm is not using its cash to its best advantage; cash should be put to work in operations of the company” (Gibson, Financial Statement Analysis, 2011: 226). Conceptually, standard value of stated financial radio is between 0,1 and 0,3 (Tintor, 2009: 532), i.e. the company has to be capable to settle from 10% to 30% of total current liabilities in a moment of the balance sheet preparation. Compar-ing to cash ratio, longer-term liquidity is measured by using quick ratio. Quick ratio shows ability of the company to settle its current liabilities by using available quick cashable current assets. “It is common to emphasize that its value have to 1 or above, including conclusion that the company which wants to maintain normal liquidity have to have at least amount of quick cashable current assets in the amount of current liabilities” (Žager K., et al 2009: 249). According to numerous authors numerator of quick ratio includes amount of total current assets less inventory value (Wahlen, Baginski, Bradshaw, 2011; Gibson, Financial Statement Analysis, 2011; Orsag, 1997). Company’s inventory due to its characteristics, represents the least liquid form of current assets. Opposite to that, accounts receivable, by definition, represents as-

120
REVIEW OF INNOVATION AND COMPETITIVENESS VOLUME 1 | ISSUE 1 | 2015
sets that should be cashable in short time period, but the practice shows that is not always so. Fact that accounts receivable are not collected on time brings into question validity of inclusion those receivables into calculation of quick ratio. It is important to point out that quick ratio assumes “including in the numerator only those cur-rent assets the firm could convert quickly into cash, often interpreted as within 90 days” (Wahlen, Baginski, Bradshaw, 2011, 364). Activity ratios can be used to evalu-ate capability of the company to collect receivables on time, and by that it should be combined with liquidity ratios within the financial position evaluation. Current ra-tio is the most comprehensive liquidity ratio representing relationship of total cur-rent assets and total current liabilities. “The current ratio is a broad indicator of a company’s short-term financial position: a ratio of more than one indicates a surplus of current assets over current liabilities” (Holmes, Sugden, Gee, 2005: 109). “Ratio shows possibility to maintain certain level of solvency” (Orsag,1997: 209). “Current ratio normally should be greater than 2” (Žager, et al 2009: 249). Higher value of cur-rent assets represents lower liquidity risk and higher amount of liquidity reserves. Existence of liquidity reserves “represents additional guarantee that greater value of working capital will generate cash sufficient for debt settlement. This helps maintain capability to establish long-term debtor to creditor relationship and a business ac-tivity continuity” (Tintor, 2009: 536). Determining adequate value of current ratio should include several factors as: “the nature of the company’s business, the quality of the current assets, the imminence of current liabilities, the volatility of working capital requirements” (Holmes, Sugden, Gee, 2005: 109). Current assets structure is determined by industry of a company and quality of its business operations. “In general, the shorter the operating cycle, the lower the current ratio. The longer the operating cycle, the higher the current ratio” (Gibson, Financial Statement Analysis, 2011: 224).
Evaluating how efficient company uses its assets could be determined by activ-ity ratios analysis. “Activity ratios are known as turnover ratios calculated as a rela-tionship between revenues and average assets. They indicate the speed of assets cir-culation within a business” (Žager K., et al 2009: 251). “Activity ratios are also known as asset utilization ratios or operating efficiency ratios. This category is intended to measure how well a company manages various activities, particularly how efficiently it manages its various assets. Activity ratios are analysed as indicators of ongoing op-erational performance — how effectively assets are used by a company. Efficiency has a direct impact on liquidity, so some activity ratios are also useful in assessing liquid-ity” (Robinson, et al 2009: 278). There exists a whole set of activity ratios that can be used to evaluate the financial position of a company. Total turnover ratio includes total assets that company has available for its main business activities. According to that, total assets turnover ratio is calculated as a relationship of total revenues and total assets of the company. “The total assets turnover ratio measures the company’s overall ability to generate revenues with a given level of assets” (Robinson, et al 2009:

121
(115 - 136)RIC Ana Ježovita VARIATIONS BETWEEN FINANCIAL RATIOS FOR EVALUATING FINANCIAL...
283). Activity ratios should be as high as possible, although its value is mainly based on assets structure and business activity of a company. Usually companies with a high proportion of fixed assets has low value total assets turnover ratio which is consider-ably below 1, and opposite companies with greater proportion of current assets has higher total assets turnover ratio.
Solvency is defined as an ability of the company to settle its all liabilities by available cash, i.e. situation in which company’s assets exceeds total debt. (Anić, Goldstein n.d.). “Solvency refers to a company’s ability to fulfill its long-term debt obligations. Assessment of a company’s ability to pay its long- term obliga-tions (i.e., to make interest and principal payments) generally includes an in-depth analysis of the components of its financial structure” (Robinson, et al 2009: 288). Solvency ratios measure proportion between internal and external sources of fi-nancing. Structure of sources of financing is analysed by using static indebtedness ratios: debt-to-assets ratio, equity-to-assets ratio, debt-to-equity ratio. Higher proportion of external sources of financing represents higher static indebtedness of a company. Conservative rule of indebtedness margin is that debt value (external sources of financing) should not exceed value of owners’ equity (internal sources of financing) (Orsag, 1997: 208). It is fragmentaly to make conclusion on adequte sources of financing structure without taking into account additional information, as interest expenses and profitability ratios. Debt-to-assets ratio which represents indebtedness degree is calculated as relationship of total debt and total assets of a company. “It shows proportion of total assets of a company financed by using exter-nal sources of financing” (Orsag, 1997: 208). “Generally, higher debt means higher fi nancial risk and thus weaker solvency” (Robinson, et al 2009: 289). “The debt ratio should be compared with competitors and industry averages. Industries that have stable earnings can handle more debt than industries that have cyclical earn-ings” (Gibson, Financial Statement Analysis, 2011: 260). Solvency financial ratio derived from debt-to-assets ratio is equity-to-assets ratio which shows proportion of total assets financed by internal sources of financing (owner’s equity). The most important ratio of static indebtedness is debt-to-equity ratio which is calculated as relationship of total external and total internal sources of financing. In case where debt and equity are the same, value of debt-to-equity ratio is at preferred level of 1. Debt-to-equity ratio represents an excellent proxy in assessment of indebtedness quality. Dynamic indebtedness assumes evaluating ability of the company to cover its interest expenses by using interest coverage ratio, and on the other side, ability to repay its total debt by using indebtedness factor. Interest coverage ratio can be considered as one of the most important indebtedness ratio. “Interest coverage ra-tios indicate the number of times a firm’s income or cash flows could cover interest charges. For example, one common approach to the interest coverage ratio divides net income before interest expense and income taxes by interest expense” (Wahlen, Baginski, Bradshaw, 2011: 372). “Higher coverage, lower indebtedness” (Žager, et

122
REVIEW OF INNOVATION AND COMPETITIVENESS VOLUME 1 | ISSUE 1 | 2015
al 2009: 250). “A higher interest coverage ratio indicates stronger solvency, offer-ing greater assurance that the company can service its debt (i.e., bank debt, bonds, notes) from operating earnings” (Robinson, et al 2009: 290). High interest cov-erage shows ability of the company to use exteranl sources of financing more effi-ciently. Indebtedness factor “indicates the number of years necessary to repay total debt by using retained earnings and amortization and depreciation costs” (Žager, et al 2009: 250-251). Solvency ratios related to financial stability are coverage degree I and coverage degree II. Coverage degree I shows share of fixed assets financed by equity, and coverage degree II shows share of fixed assets financed by long-term sources of financing, either equity or long-term liabilities.
3. LITERATURE REVIEW
Wall (1919) found that “great ratio variation seemed to exist when samples from different geographical areas and samples from different industries were compared” (Lee Huff, Harper, Jr., Eikner, 1999: 96).
Gupta (1969) conducted the research about the effect of size, growth, and in-dustry of the financial structure of manufacturing companies. The paper does not include explicit examination of existance of differences on financial ratios related to the size of a company but examines patterns and variations of financial ratios re-lated to the size, growth, and industry of companies. For that purposes, author used indicators as asset utilization, leverage ratios, liquidity ratios, and profitability ratios. The part of the research related to the size of a companies shows following results. Generally observing, activity and leverage ratios has tendency to decrase as the size of company increases. Opposite to that, liquidity and profitability ratios increases with the incrase of the size of a company (Gupta, The Effect of Size, Growth, and Industry on the Financial Structure of Manufacturing Companies, 1969: 519). “The total debt to total asset ratio is found to be negatively related to size of the corporation” (Gupta, The Effect of Size, Growth, and Industry on the Financial Structure of Manufacturing Companies, 1969: 526). Smaller sized companies have lower current ratio and high-er inventory turnover ratio. “Smaller-sized corporations invariably tend to show a lower sales margin than the larger-sized corporations, (...) but smaller-sized corpo-rations tend to have greater total asset turnover” (Gupta, The Effect of Size, Growth, and Industry on the Financial Structure of Manufacturing Companies, 1969: 527).
Gupta & Huefner (1972) provided a study of financial ratios at macro level for broad industry classes in order to find correspondence between similar industries by using cluster analysis appling hierarchical clustering method. The research includes companies from 20 manufacturing industries according to Standard Industrial Clas-sification (SIC) coding system. The conducted analysis is based on six financial ratios (two liquidity ratios and four activity ratios). Authors decided to terminate the cluster analysis when three clusters were formed. Goal of the research was to “demonstrate

123
(115 - 136)RIC Ana Ježovita VARIATIONS BETWEEN FINANCIAL RATIOS FOR EVALUATING FINANCIAL...
that financial ratios can represent underlying industry characteristics, at least on a group-ordinal basis of measurement. They found that cluster analysis groupings of the ratio data correspond highly with both the judgmental classifications of econo-mists and with numerous qualitatively expressed economic characteristics of the in-dustries involved” (Gupta i Huefner, A Cluster Analysis Study of Financial Ratios and Industry Characteristics, 1972: 90).
Pinches and Mingo (1973) “examine the relationship between firm size and the ratings on outstanding debt issues of public firms and report a significant inverse relationship between bond ratings and size. Based on their results, they argue that larger firms have lower levels of risks and lower borrowing costs; consequently, they tend to rely more heavily on long-term debt financing than do smaller firms” (Os-teryoung, Constand, Nast, 1992: 35-36).
Walker and Petty (1979) conducted a research about the existence of differences between large and small public firms related to its liquidity, profitability, leverage, risk, and dividend policy. “Using a multiple discriminant analysis, they find that proxies for dividend policy, liquidity position, and profitability are the most power-ful discriminators between large and small public firms. Their results indicate that larger firms have greater liquidity and lower profitability than smaller firms” (Os-teryoung, Constand, Nast 1992: 37).
Marsh (1982) “addresses the size issue and argues that larger firms face lower issuance cost for long-term debt, and will thus rely more heavily on long-term debt” (Osteryoung, Constand , Nast,1992: 36).
McLeay & Fieldsend (1987) used the ordinary least squares as a more appropri-ate description that simple ratio model (McLeay, Fieldsend, 1987: 133). They ana-lyzed 15 financial ratios using sample of French companies groupt into three sectors and four size classes. The research results shown “that size and sector effects can vary considerably from one financial ratio to another” (McLeay, Fieldsend, 1987: 139). The research results shows “differences in the relationship of ratios as the size of the company changed. They also found evidence of differences in the ratios as the sam-ple was subdivided into sectors (e.g., spinning, weaving, and knitted goods)” (Huff, Harper, 1999: 96).
Osteryoung, Constand, & Nast (1992) examine the differences between finan-cial ratios of small private firms and large public firms which operates within large number of industry groups defined by authors. Main limitation of their research is the fact that data available for small private firms included precalculated financial ra-tios, which significantly narrows statistical analysis possibilities. The size proxy used within the research to classify companies was value added. Research includes exam-ining 13 different financial ratios including liquidity ratios, leverage ratios, activity ratios, profitability ratios, and miscellaneous expense ratios. “The results associated with the liquidity ratios (CR and QR) indicate that there is no difference between the average small firm liquidity and average large firm liquidity across the wide range
124
REVIEW OF INNOVATION AND COMPETITIVENESS VOLUME 1 | ISSUE 1 | 2015
of industries examined. (…)The results indicate that small firms have higher total leverage ratios and rely more heavily on short-term debt financing than large firms. (…) When the results associated with the activity ratios are considered, the total asset turnover (ATO) is significantly greater for small firms. (…) The comparison of the profitability ratios also suggests differences between large and small firms. Return on assets (ROA) ratio is greater for small firms than for large firms” (Osteryoung, Constand, Nast, 1992: 40-45).
Lee Huff, Harper, Jr., & Eikner (1999) had conducted a study of a comparison of liquidity and slovency measures for Small Companies versus Large Companies. To keep the analysis simple they used only two financial indicators, current ratio as a liquidity indicator, and debt ratio as a solvency indicator. The sample of 12.305 companies they devided into seven industry groups in accordance with the Stand-ard Industrial Classification (SIC) code, and into four size categories based on amount of total assets. “To determine whether systematic differences existed, the extreme categories (Small Companies versus Large Companies) were examined” (Lee Huff, Harper, Jr., Eikner 1999: 98). To test existance of difference of means authors used t-test, and in order to compare variances they used F-test. “The research findings strongly support the contention that systematic differences exist among liquidity and solvency measures for Small Companies versus Large Companies” (Huff, Harper, 1999: 104).
Philips, Volker, & Anderson (2009) was conducted the analysis of the cross-sectional variation of financial ratios related to different sizes of the company within retail and service sector. The research includes liquidity, activity, leverage and prof-itability ratios. A proxy used to determine the size of a company was total sales, ac-cording to which companies are devided into four size categories. To assess differ-ences in the means, t-test is used. “The largest and smallest firms exhibit significant differences in their respective liquidity, activity, leverage, and profitability ratios for firms in the retail sector. Service firms exhibited the strongest differences in their respective activity, debt and profitability ratios. Furthermore, an examination of the behavior of the metrics between retail and service firms of similar size showed sig-nificant differences. An important implication og these results is that size and sector need to be considered when using this data as a benchmarking tool” (Philips, Volker, Anderson, 2009: 6).
4. METHODOLOGY
Identifying average values of categories for certain variable provide opportunity to test if they significantly differ. Although those differences are easy to observe, it is important to determine if they are statistically significant. Important step in deter-mining statistically significant differences between variables includes determining which statistical method to use in order to test existence of those differences.
125
(115 - 136)RIC Ana Ježovita VARIATIONS BETWEEN FINANCIAL RATIOS FOR EVALUATING FINANCIAL...
In case when tested variable have more than two groups (categories), it is not pos-sible to use t-test. For that purposes, analysis of variance should be used. “The univari-ate techniques for analysing group differences are the t-test (two groups) and analysis of variance (ANOVA) for two or more groups” (Hair, Black, et al., Multivariate Data Analysis, A Global Perspective, 2010: 443). It is parametric test that imposes achieving numerous assumptions as variables independency, homogeneity of variances, and the most prominent, the normality of distribution. In case when assumptions are not meet, non-parametric statistics should be used (Larson-Hall 2010: 58). “The non-parametric alternative to a one-way ANOVA is the Kruskall-Wallis test” (Larson-Hall, 2010: 140). Although, Kruskall-Wallis test do not require existence of normal distribution, and it’s not as sensitive to extremes values of data, nevertheless it includes meeting the assump-tion of homogeneity of variance. The most important disadvantage of nonparametric tests against parameter is the quality of the obtained results. “The traditional trade-off in choosing a nonparametric test is a loss of power” (Kemp, Kemp, 2004: 301).
5. RESULTS
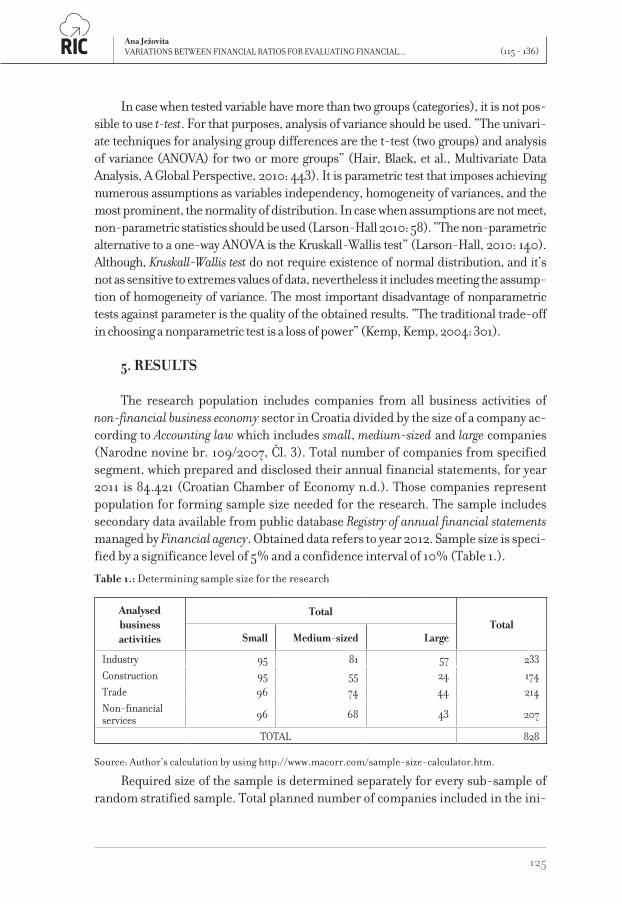
The research population includes companies from all business activities of non-financial business economy sector in Croatia divided by the size of a company ac-cording to Accounting law which includes small, medium-sized and large companies (Narodne novine br. 109/2007, Čl. 3). Total number of companies from specified segment, which prepared and disclosed their annual financial statements, for year 2011 is 84.421 (Croatian Chamber of Economy n.d.). Those companies represent population for forming sample size needed for the research. The sample includes secondary data available from public database Registry of annual financial statements managed by Financial agency. Obtained data refers to year 2012. Sample size is speci-fied by a significance level of 5% and a confidence interval of 10% (Table 1.).
Table 1.: Determining sample size for the research
Analysed business activities
TotalTotal
Small Medium-sized Large
Industry 95 81 57 233Construction 95 55 24 174Trade 96 74 44 214Non-financial services 96 68 43 207
TOTAL 828
Source: Author’s calculation by using http://www.macorr.com/sample-size-calculator.htm.
Required size of the sample is determined separately for every sub-sample of random stratified sample. Total planned number of companies included in the ini-

126
REVIEW OF INNOVATION AND COMPETITIVENESS VOLUME 1 | ISSUE 1 | 2015
tial sample was 828. By excluding extreme values from the sample, higher level of data homogeneity has been achieved. Table 2. shows descriptive statistics for calcu-lated individual financial ratios, and final number of companies included into fur-ther analysis per variable.
Table 2.: Descriptive statistics of the financial ratios
Variable n %n Mean Median Variance Standard deviation
Cash ratio 527 63,11 0,03 0,01 0,00 0,03Quick ratio 702 84,07 0,60 0,52 0,22 0,47Current ratio 690 82,63 1,03 0,97 0,48 0,69Financial stability coefficient 753 90,18 0,62 0,65 0,40 0,63
Debt-to-assets ratio 757 90,66 0,69 0,71 0,13 0,36
Equity-to-assets ratio 764 91,50 0,30 0,29 0,13 0,37
Debt-to-equity ratio 528 63,23 1,00 0,85 1,90 1,38
Interest Coverage Ratio 424 50,78 1,17 1,20 3,23 1,80
Indebtedness Factor 573 68,62 1,40 0,99 17,94 4,24
Degree of Coverage I 555 66,47 0,61 0,60 0,43 0,66
Degree of Coverage II 481 57,60 1,02 0,99 0,28 0,53
Total assets turnover 758 90,78 0,88 0,79 0,55 0,74
Current assets turnover 726 86,95 1,71 1,62 1,47 1,21
Receivables turnover 646 77,37 3,33 3,13 5,71 2,39
Accounts Receivable turnover
522 62,51 4,54 4,13 8,74 2,96
Inventory turnover 425 50,90 6,14 4,95 21,97 4,69
Accounts Payable turnover 547 65,51 5,07 4,48 12,01 3,47
Source: Author’s calculation by using StatSoft Statistica 12.
According to obtained results Croatian companies are able to pay on average 2,5% of their current liabilities in cash. There are no evident differences between the values of cash ratio related to different sizes of companies. Evaluating liquidity by cash ratio represents extremely conservative point of view (Gibson, 2011: 226).

127
(115 - 136)RIC Ana Ježovita VARIATIONS BETWEEN FINANCIAL RATIOS FOR EVALUATING FINANCIAL...
Table 3.: Descriptive statistics of the financial ratios taking into account the size of a company
Financial ratioThe size of a company
Small Medium-sized Large TOTAL
Cash ratioAS 0,024 0,026 0,026 0,025
N 229 284 114 527
Quick ratio AS 0,519 0,672 0,639 0,598
N 308 243 151 702
Current ratioAS 0,912 1,151 1,074 1,029
N 304 235 151 690
Financial stability coefficient
AS 0,363 0,792 0,902 0,619N 344 255 154 753
Debt-to-assets ratioAS 0,730 0,667 0,647 0,690
N 326 266 165 757
Equity-to-assets ratioAS 0,267 0,313 0,346 0,301
N 327 271 166 764
Debt-to-equity ratioAS 0,583 1,325 1,314 1,001
N 229 184 115 528
Interest Coverage Ratio
AS 1,085 1,190 1,233 1,172N 118 199 107 424
Indebtedness FactorAS 0,487 2,370 1,834 1,404
N 262 198 113 573
Degree of Coverage IAS 0,508 0,654 0,673 0,613
N 176 230 149 555
Degree of Coverage IIAS 0,915 1,057 1,060 1,016
N 143 192 146 481
Total assets turnoverAS 0,806 0,960 0,913 0,883
N 332 268 158 758
Current assets turnover
AS 1,292 2,031 2,068 1,706N 327 256 143 726
Receivables turnoverAS 2,580 3,925 3,909 3,331
N 284 239 123 646
Accounts Receivable turnover
AS 3,635 5,153 5,154 4,542N 210 210 102 522
Inventory turnoverAS 4,493 6,358 8,019 6,135
N 146 172 107 425
Accounts Payable turnover
AS 4,280 5,175 6,400 5,073N 221 210 116 547
Source: Author’s calculation by using StatSoft Statistica 12.
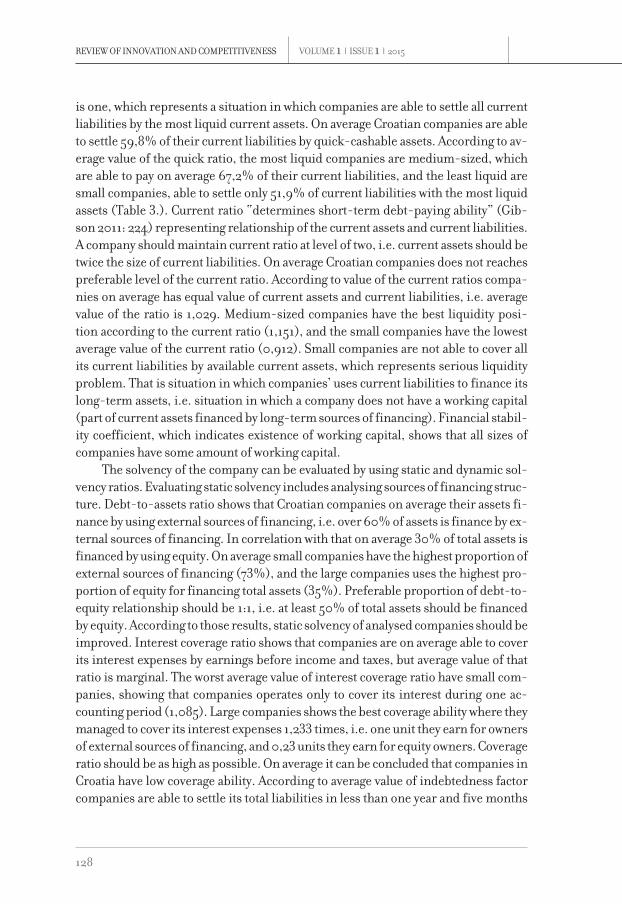
A more inclusive liquidity ratio is quick ratio which includes the most liquid as-sets as cash, current financial assets and receivables. Preferable value of quick ratio
128
REVIEW OF INNOVATION AND COMPETITIVENESS VOLUME 1 | ISSUE 1 | 2015
is one, which represents a situation in which companies are able to settle all current liabilities by the most liquid current assets. On average Croatian companies are able to settle 59,8% of their current liabilities by quick-cashable assets. According to av-erage value of the quick ratio, the most liquid companies are medium-sized, which are able to pay on average 67,2% of their current liabilities, and the least liquid are small companies, able to settle only 51,9% of current liabilities with the most liquid assets (Table 3.). Current ratio “determines short-term debt-paying ability” (Gib-son 2011: 224) representing relationship of the current assets and current liabilities. A company should maintain current ratio at level of two, i.e. current assets should be twice the size of current liabilities. On average Croatian companies does not reaches preferable level of the current ratio. According to value of the current ratios compa-nies on average has equal value of current assets and current liabilities, i.e. average value of the ratio is 1,029. Medium-sized companies have the best liquidity posi-tion according to the current ratio (1,151), and the small companies have the lowest average value of the current ratio (0,912). Small companies are not able to cover all its current liabilities by available current assets, which represents serious liquidity problem. That is situation in which companies’ uses current liabilities to finance its long-term assets, i.e. situation in which a company does not have a working capital (part of current assets financed by long-term sources of financing). Financial stabil-ity coefficient, which indicates existence of working capital, shows that all sizes of companies have some amount of working capital.
The solvency of the company can be evaluated by using static and dynamic sol-vency ratios. Evaluating static solvency includes analysing sources of financing struc-ture. Debt-to-assets ratio shows that Croatian companies on average their assets fi-nance by using external sources of financing, i.e. over 60% of assets is finance by ex-ternal sources of financing. In correlation with that on average 30% of total assets is financed by using equity. On average small companies have the highest proportion of external sources of financing (73%), and the large companies uses the highest pro-portion of equity for financing total assets (35%). Preferable proportion of debt-to-equity relationship should be 1:1, i.e. at least 50% of total assets should be financed by equity. According to those results, static solvency of analysed companies should be improved. Interest coverage ratio shows that companies are on average able to cover its interest expenses by earnings before income and taxes, but average value of that ratio is marginal. The worst average value of interest coverage ratio have small com-panies, showing that companies operates only to cover its interest during one ac-counting period (1,085). Large companies shows the best coverage ability where they managed to cover its interest expenses 1,233 times, i.e. one unit they earn for owners of external sources of financing, and 0,23 units they earn for equity owners. Coverage ratio should be as high as possible. On average it can be concluded that companies in Croatia have low coverage ability. According to average value of indebtedness factor companies are able to settle its total liabilities in less than one year and five months

129
(115 - 136)RIC Ana Ježovita VARIATIONS BETWEEN FINANCIAL RATIOS FOR EVALUATING FINANCIAL...
by using retained earnings, depreciation and amortization. In addition to that, small companies are able to repay its total liabilities on average within half year, and medi-um-sized companies within two years and four months. Croatian companies covers on average 61,3% of their fixed assets by equity, and the highest share of internal sources of financing used for fixed assets has large companies (67,3%). Adding long-term debt equity, on average companies finance their all fixed assets by long-term sources of financing, implying existence of working capital. The most unfavourable value of degree of Coverage II has small companies. On average only 91,5% of fixed assets is finances by long-term sources of financing, which means that almost 10% of fixed assets is financed by current liabilities, implying existence of financial sta-bility problems. Next to liquidity and solvency ratios, for financial position assess-ment, activity ratios should be used. Activity ratio can be used for evaluation of ef-ficiency of using available sources of financing, with the objective to assess essential level of liquidity. The highest efficiency of total assets has medium-sized companies which turnover 96% of their total assets within one accounting period. The less ef-ficient in using its total assets are small companies which turnovers 80,6% of their total assets. Current assets turnover gives valuable information in evaluating overall liquidity of the company. On average companies turnover 1,7 times its current assets within one accounting period. Comparing current assets turnover with current ratio, it can be concluded that on average companies in Croatia have liquidity problems, due to low level of working capital and very slow operating cycle. Essential problem is visible with small companies where current liabilities are not covered with current assets, and they turnover only 1,29 times its current assets within one accounting period. Analysing receivables and account receivables turnover it can be seen that companies on average turnover its receivables 3,33 times, and account receivables 4,54 times. According to those results, on average companies are able to collect its account receivables for less than 90 days, implying that its value can be included in evaluating quick liquidity. Companies manage to turnover its inventories 6,14 times per accounting period, where the most efficient are large companies which turnover its inventory over 8 times. Companies on average pay its account payables 5 times per accounting period. By using account receivables turnover, inventory turnover and account payable turnover, cash gap can be calculated. On average companies in Croa-tia has cash gap of 68 days. The most effective are medium-sized companies with 58 days, and the less effective are small companies with 96 days of cash gap. That means that small companies have to ensure additional sources of financing for 96 day due to existing gap.

130
REVIEW OF INNOVATION AND COMPETITIVENESS VOLUME 1 | ISSUE 1 | 2015
Table 4.: Levene’s Test for Homogeneity of Variances according to the size of a company
MS EFFECT
MS ERROR F-ratio p-value Degrees of
freedom
Observed power
(Alpha = 0,05)
Cash ratio 0,000324 0,000256 1,264436 0,283259 2, 524 0,057608Quick ratio 0,024136 0,072125 0,334637 0,715713 2, 699 0,940237Current ratio 0,412813 0,167657 2,462241 0,085996 2, 687 0,955998Financial stability coefficient
0,792256 0,142076 5,576284 0,003945 2, 750 1,000000
Debt-to-assets ratio 0,776719 0,041821 18,57263 0,000000 2, 754 0,546761
Equity-to-assets ratio 0,638090 0,047097 13,54841 0,000002 2, 761 0,407024
Debt-to-equity ratio 3,174578 0,669734 4,740058 0,009116 2, 525 0,999977
Interest Coverage Ratio 1,823538 1,383975 1,317609 0,268877 2, 421 0,078352
Indebtedness Factor 20,59270 6,885914 2,990555 0,051049 2, 570 0,996845
Degree of Coverage I 0,906702 0,149537 6,063412 0,002484 2, 552 0,608294
Degree of Coverage II 0,648097 0,108999 5,945900 0,002814 2, 478 0,631447
Total assets turnover 2,914545 0,168917 17,25426 0,000000 2, 755 0,604090
Current assets turnover 4,342687 0,436277 9,953978 0,000054 2, 723 1,000000
Receivables turnover 15,46542 1,672321 9,247875 0,000110 2, 643 0,999999
Accounts Receivable turnover
1,216599 2,700736 0,450469 0,637578 2, 519 0,999749
Inventory turnover 7,089873 6,702394 1,057812 0,348133 2, 422 0,999910
Accounts Payable turnover
44,11200 3,880282 11,36825 0,000015 2, 544 0,999013
Source: Author’s calculation by using StatSoft Statistica 12.
The analysis of statistical power, which shows “the probability that a statistical test will identify a treatment’s effect if it actually exists” (Hair, Black, et al., Multivari-ate Data Analysis, A Global Perspective, 2010: 463), shows that majority of variables has adequate, or near adequate statistical power, except for the cash ratio for which statistical power is only sufficient (Table 4.). The statistical power is considered as sufficient if its value is above 0,50 or it is adequate in case when its value is over 0,80.

131
(115 - 136)RIC Ana Ježovita VARIATIONS BETWEEN FINANCIAL RATIOS FOR EVALUATING FINANCIAL...
From the aspect of the size of a company a total of seven analysed variables meet the assumption of homogeneity of variance, including: cash ratio, quick ratio, current ratio, interest coverage ratio, indebtedness factor, accounts receivable turnover ra-tio, inventory turnover ratio. Seven individual financial ratios, taking into account the size of a company, for which homogeneity of variances has been met, has p-value greater than given significance level. Nevertheless, two of seven analysed variables where the assumption of homogeneity of variance is met, doesn’t have sufficient sta-tistical power of 0,50 (cash ratio and interest coverage ratio). Considering the fact that statistical power is not condition for using parametric tests, conclusions will take into account that factor. For the remaining variables, statistical power is adequate and its over 0,80. To ensure and verify results of the research obtained by using para-metric statistics, non-parametric statistics is also used. Analysis of variances is used for seven variables that have met assumption of homogeneity of variances. For the same variables, non-parametric Kruskal-Wallis test is used, in order to expand re-sults and compare conclusions.
For variables with high statistical power, statistically significant differences re-lated to the size of a company are found. In case where statistical power is low, sta-tistically significant differences are not identified. It is important to emphasise that parametric and non-parametric statistics results give the same conclusions, except for cash ratio where differences are not found.
The greatest number of ratios used for evaluating financial position revealed statistically significant differences in relation to the size of a company. These sta-tistically significant differences were not found for the cash ratio and the interest coverage ratio.
Table 5.: Existance of statisticaly significant differences of financial ratios for evaluating financial position in relation to the size of a company
Financial ratios Degrees of freedom
Observed power (Alpha=0,05) A-NOVA Kruskal-Wallis
ANOVA
Cash ratio 2, 524 0,057608 no differences differencesQuick ratio 2, 699 0,940237 differences differencesCurrent ratio 2, 687 0,955998 differences differencesInterest Coverage Ratio 2, 421 0,078352 no differences no differences
Indebtedness Factor 2, 570 0,996845 differences differences
Accounts Receivable turnover
2, 519 0,999749 differences differences
Inventory turnover 2, 422 0,999910 differences differences
Source: Author’s calculation by using StatSoft Statistica 12.

132
REVIEW OF INNOVATION AND COMPETITIVENESS VOLUME 1 | ISSUE 1 | 2015
Financial ratios where differences are not found are those for which the ob-served statistical power is 0,058 and 0,078 according to what likelihood to detect existence of potential statistically significant differences related to the size of a com-pany, is at the level of 5,8% and 7,8%, which is very low (Table 5.). Remaining fi-nancial ratios, with detected statistically significant differences (quick ratio, current ratio, indebtedness factor, account receivables turnover ratio and inventory turnover ratio), have statistical power in range of 0,94 and 0,99, what is more than adequate, respecting what, it can be concluded that obtained results are representative. Con-sidering all stated, it can be concluded that individual financial ratios for evaluating financial position, for Croatian companies that prepared and enclosed their annual financial statements for year 2012, are statistically significant different taking into account the size of a company, and by that, the research hypothesis can be accepted.
6. CONCLUSION
Financial statements analysis includes methods of using different items from annual financial statements for creating information for decision-making purposes. For evaluating business quality by using financial statements analysis it is important to take into account factors that have influence to the values of the financial ratios. Some of those factors are environment conditions and geographical area, competi-tive advantages, industry affiliation, and the size of a company. The conducted re-search isolates the size of a company as differentiation factor for evaluating financial position by using liquidity, solvency and activity financial ratios. Results obtained by the research shows existence of statistically significant differences of financial ratios for evaluating financial position related to the size of a company. As a result of the research, stakeholder should respect specifics of companies, like the size, within fi-nancial position evaluation and decision-making process.

133
(115 - 136)RIC Ana Ježovita VARIATIONS BETWEEN FINANCIAL RATIOS FOR EVALUATING FINANCIAL...
REFERENCES
Anić, Vladimir, and Ivo Goldstein. Pretraživanje rječničke baze. Novi Liber. n.d. http://hjp.novi-liber.hr/index.php?show=search (accessed September 11, 2014)
Croatian Chamber of Economy, n.d. http://www1.biznet.hr/HgkWeb/do/extlogon?lang=hr_HR (accessed April 10, 2014)
Friedlob, George T., and Lydia L. F. Schleifer., “Essentials of Financial Analysis”, (New Jersey: John Wiley & Sons, Inc., 2003)
Gibson, Charles H., “Financial Statement Analysis”, 12th. ed. (Canada: South-Western, Cengage Learning, 2011)
Financial Statement Analysis. 12th. Canada: South-Western, Cengage Learning, (2011)
Gupta, Manak C., and Ronald J. Huefner., “A Cluster Analysis Study of Financial Ratios and Industry Characteristics., Journal of Accounting Research 10, no. 1 (1972): 77-95
Gupta, Manak C., “The Effect of Size, Growth, and Industry on the Financial Structure of Manufacturing Companies”, The Journal of Finance 24, no. 3 (1969): 517-529
Hair, Joseph F., Jr., William C. Black, Barry J. Babin, and Rolph E. Anderson. Multivariate Data Analysis, A Global Perspective. 7th. (New Jersey: Pearson Education, Inc., 2010)
Hair, Joseph F., Jr., et al, “Multivariate Data Analysis”, A Global Perspective. 7th. ed. (New Jersey: Pearson Education, Inc., 2010)
Holmes, Geoffrey, Alan Sugden, and Paul Gee., “Interpreting Company Reports and Accounts”, 9th. ed. (Harlow: Pearson Education Limited, 2005)
Horrigan, James O., “Some Empirical Bases of Financial Ratio Analysis”, Accounting Review 40, no. 3 (1965): 558-568
Kemp, Steven M., and Sid Kemp., “Business Statistics Demystified”, (New York: McGraw-Hill, 2004)
Kimmel, Paul D., Jerry J. Weygandt, and Donald E. Kieso., “Accounting Tools for Business Decision Making”,4th. ed. (Hoboken: John Wiley & Sons, Inc., 2011)
Larson-Hall, Jenifer., “A Guide to Doing Statistics in Second Language Research Using SPSS”, (New York: Routledge, 2010)
Lee Huff, Patricia, et al, “Are there differences in liquidity and solvency measures based on company size?”, American Business Review 17, no. 2 (1999): 96-106
McLeay, Stuart, and Susan Fieldsend. “Sector and Size Effects in Ration Analysis: An Indirect Test of Ratio Proportionality.”, Accounting and Business Research 17, no. 66 (1987): 133-140
Narodne novine. Zakon o računovodstvu. br. 109/2007. http://narodne-novine.nn.hr/ (accessed 09 04, 2013)
Orsag, Silvije, “Vrednovanje poduzeća”, (Zagreb: Infoinvest d.o.o., 1997)
Osteryoung, Jerome, et al, “Financial Ratios in Large Public and Small Private Firms”, Journal of Small Business Management 30, no. 3 (1992): 35-46
Philips, Michael D., John X. Volker, and Steven J. Anderson. “A Behavioral Comparison of Financial Ratios for Different Size Privately-held retail and Service Businesses”, Journal of Behavioral Studies in Business 1 (2009): 1-7
134
REVIEW OF INNOVATION AND COMPETITIVENESS VOLUME 1 | ISSUE 1 | 2015
Robinson, Thomas R., et al, “International Financial Statement Analysis”, (New Jersey: John Wiley & Sons, Inc., 2009)
Subramanyam, K. R., and John J. Wild., “Financial Statement Analysis”, 10th. ed. (New York: McGraw-Hill/Irwin, 2009)
Tintor, Janko, “Poslovna analiza”, (Zagreb: Masmedia, 2009)
Wahlen, James M., et al, “Financial Reporting, Financial Statement Analysis, and Valuation: A Strategic Perspective”, 7th. ed. (Mason: South-Western Cengage Learning, 2011)
Žager K., Katarina, et al, “Analiza financijskih izvještaja”, 2. prošireno izdanje, (Zagreb: Masmedia, 2009)
Žager L., Lajoš, and Sanja Sever, “Analiza financijskih izvještaja pomoću financijskih pokazatelja”, Računovodstvo i financije 55, no. 3 (2009): 44-51
Žager L., Lajoš, and Sanja Sever Mališ, “Financijski pokazatelji kao podloga za ocjenu kvalitete poslovanja”, Računovodstvo i financije 58, no. 2 (2012): 60-70

135
(115 - 136)RIC Ana Ježovita VARIATIONS BETWEEN FINANCIAL RATIOS FOR EVALUATING FINANCIAL...
APPENDIX1: Individual financial ratios used in the research
Financial ratio Numerator Denominator
Cash Ratio Cash Current LiabilitiesQuick ratio Current Assets - Inventory Current LiabilitiesCurrent ratio Current Assets Current Liabilities
Financial stability coefficient Fixed Assets Shareholders’ Equity + Long Term Liabilities
Debt-to-assets ratio Total Liabilities Total AssetsDebt-to-equity ratio Shareholders’ Equity Total AssetsDebt-to-capital ratio Total Liabilities Shareholders’ Equity
Interest Coverage Ratio Gross income + Financial Expenses Financial Expenses
Indebtedness Factor Total Liabilities Retained earnings + Depreciation and Amortization
Degree of Coverage I Shareholders’ Equity Fixed Assets
Degree of Coverage II Shareholders’ Equity + Long Term Liabilities Fixed Assets
Total assets turnover Total revenues Total AssetsCurrent assets turnover Total revenues Current AssetsReceivables turnover Sales (revenue) ReceivablesAccounts Receivable turnover Sales (revenue) Accounts ReceivableInventory turnover Expenses from Operations InventoryAccounts Payable turnover Expenses from Operations Accounts Payable
Source: (Žager L., Sever, Analiza financijskih izvještaja pomoću financijskih pokazatelja 2009).
