vascular quality today –nsqip, uhc, and svs/vqi at
TRANSCRIPT

4/18/2013
1
Vascular Quality Today – NSQIP, UHC, and SVS/VQI at Stanford
Ronald L. Dalman MDChief, Vascular Surgery
Associate Director for Quality and Outcome AssessmentCardiovascular Health
• ACS – National Surgery Quality Improvement Program (NSQIP) • University Hospital Consortium (UHC)• SVS/M2S Vascular Quality Initiative • Most commonly audited procedures? (Birkemayer 2010)
• 4/30 categories accounted for 72% of complications• LE arterial reconstruction – 29%• Abdominal aortic reconstruction – 20%• LE amputation – 16%• Carotid endarterectomy – 8%
What is Vascular Quality Today?Depends on Measurement Method…
Mortality (NSQIP)(2006-2008)
2010 Quality Improvement and Patient Safety ScorecardMortality Rate
SHC UHC SHC SHC UHC SHC SHC UHC SHC SHC UHC SHCUHC Product Line Overall Median Rank Overall Median Rank Overall Median Rank Overall Median RankCardiothoracic Surgery 0.97 0.93 55/91 0.92 0.92 51/101 1.05 0.95 70/103 0.58 0.92 9/108Gastroenterology 0.93 0.98 41/91 0.85 0.88 45/101 0.79 0.92 40/106 0.66 0.81 26/109Gynecology 0.00 0.64 1/91 0.00 0.00 1/101 0.00 0.00 8/84 0.00 0.00 16/88Kidney/Pancreas Transplant 0.00 0.00 1/79 4.72 0.00 67/86 0.00 0.00 N/A 0.00 0.00 23/60Lung Transplant 0.00 0.00 1/38 0.00 0.00 1/38 0.00 0.00 6/33 0.00 0.00 5/32Otolaryngology 1.64 0.70 73/91 0.44 0.78 32/101 0.53 0.85 29/87 0.00 0.66 7/91Vascular Surgery 1.06 0.91 54/91 0.65 0.92 30/101 0.33 0.94 12/93 0.00 0.92 2/97Cardiology 0.92 0.97 33/91 1.02 0.87 74/101 1.02 0.91 77/106 0.73 0.83 37/109Gynecology/Oncology 0.00 0.68 1/96 0.58 0.65 45/101 0.47 0.85 21/82 0.62 0.72 36/85Liver Transplant 0.42 1.06 12/56 0.43 0.78 20/59 0.00 0.68 7/46 0.80 0.79 23/44Medicine General 1.05 1.00 53/91 0.93 0.94 50/101 0.92 0.98 44/106 0.92 0.89 61/109Medical Oncology 1.02 0.94 59/91 0.87 0.82 63/101 1.07 0.91 81/106 0.95 0.81 77/109Neurology 0.83 0.93 29/91 0.74 0.89 19/101 0.78 0.93 21/106 0.82 0.84 50/109Neurosurgery 0.65 0.96 11/91 0.70 0.86 28/101 0.59 0.93 12/105 0.72 0.89 29/109Orthopedics 0.79 1.00 30/91 0.58 0.82 28/101 0.97 0.91 63/102 0.80 0.77 57/107Plastic Surgery 0.00 0.88 1/91 0.00 0.71 1/101 0.00 0.65 10/68 0.69 0.63 44/74Rheumatology 0.00 0.77 1/91 0.84 0.74 58/101 0.74 0.68 55/98 0.89 0.74 64/101Spinal Surgery 0.00 0.77 1/91 0.61 0.76 43/101 0.97 0.85 52/86 0.83 0.86 43/89Surgery General 0.79 1.00 24/91 0.61 0.88 5/101 0.75 0.91 25/106 0.67 0.85 28/109Trauma 0.46 0.94 16/91 0.62 0.95 13/101 0.54 0.95 10/90 0.76 0.88 30/94BMT 0.56 0.89 19/66 0.92 0.96 31/65 1.00 1.05 30/61 1.01 0.85 43/62Heart Transplant or Implant 1.21 0.94 49/66 1.44 0.88 61/75 1.43 0.86 43/47 1.50 0.74 47/50Surgery Oncology 0.83 0.92 41/91 0.64 0.79 39/101 0.67 0.75 33/87 1.20 0.74 81/90Urology 0.34 0.83 19/91 0.64 0.87 34/101 1.99 0.96 93/101 1.07 0.76 81/103Ventilator Support 0.82 0.97 23/91 0.67 0.90 9/101 1.05 0.91 79/105 1.02 0.88 87/109
0.88 0.95 30/91 0.82 0.90 32/101 0.90 0.93 44/102 0.83 0.86 50/107
O/E Ratio
Overall Performance RankingsLower Is Better
O/E Ratio2007 2008 Jul, 2008 - Jun, 2009
O/E RatioApril 2009-March 2010
O/E Ratio
Mortality (UHC)2007-2010

4/18/2013
2
Observed/Expected(O/E) Index Trends (UHC)(2006-2010)
5
Vascular Performance (UHC) Current
6
Target of O/E= Under 1 11/13 quarters showed an O/E rate of under 1; the last three quarters are also under the desired target.
• Division = Discharge MD Division• Data Source: University Healthcare Consortium (UHC)
CVH Produce Line (UHC) Current
7
CVH Core Measures Current
8

4/18/2013
3
Individual Process/Outcome Score Individual “Score”
Public Reporting (stanfordhospital.org/cardiovascularhealth) What is “Value” in Health Care?

4/18/2013
4
224 Centers, 44 States + Ontarioas of 3/1/2013
SVS Vascular Quality Initiative (VQI) SVS Vascular Quality Initiative (VQI)
Total Procedures Captured (as of February 28, 2013) 80,861
Carotid Endarterectomy 22,247
Carotid Artery Stent 2,835
Endovascular AAA Repair 8,295
Open AAA Repair 3,694
Peripheral Vascular Intervention 23,955
Infra-Inguinal Bypass 11,780
Supra-Inguinal Bypass 3,443
Thoracic and Complex EVAR 965
Hemodialysis Access 3,210
SVS Vascular Quality Initiative (VQI)
0%4%8%
12%16%20%24%28%32%36%
**************
Wound Infection Rate after Infra-Inguinal Bypass Procedure Observed and Expected by Centers
4,081 patient procedures, January 2010 December 2012Observed Expected
Overall rate Wound InfectionVQI = 3.6%AUC = 0.65
VQI Centers
adjusted for: skin preperation, ankle/brachial systolic pressure index, transfusion, length of procedure
Significantly higher than expected:* p<0.05**p<0.01
SVS Vascular Quality Initiative (VQI)
4/18/2013
5
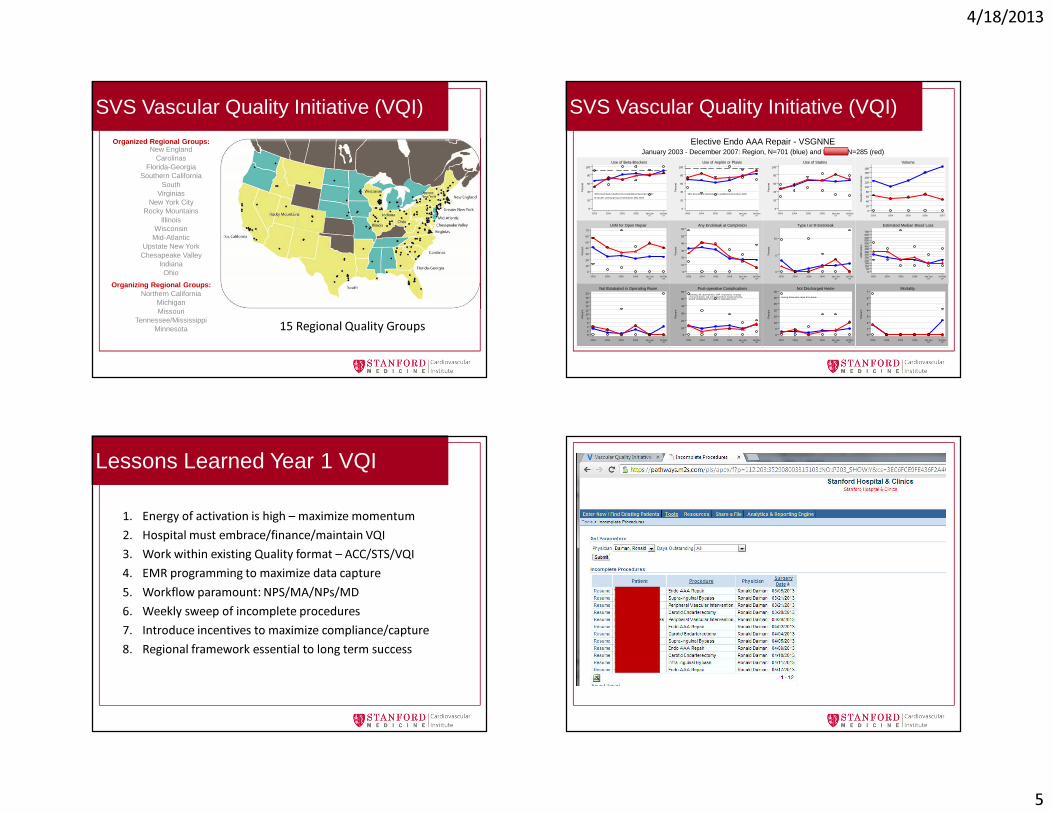
SVS Vascular Quality Initiative (VQI)
Organized Regional Groups:New England
CarolinasFlorida-Georgia
Southern CaliforniaSouth
VirginiasNew York City
Rocky MountainsIllinois
WisconsinMid-Atlantic
Upstate New YorkChesapeake Valley
IndianaOhio
Organizing Regional Groups:Northern California
MichiganMissouri
Tennessee/MississippiMinnesota 15 Regional Quality Groups
SVS Vascular Quality Initiative (VQI)
90% benchmark (dashed line) established November 2003
B-blocker working group presentations May 2004
0
20
40
60
80
100
Per
cent
2003 2004 2005 2006 Jan-Jun07
Jul-Dec07
Use of Beta-Blockers
95% benchmark (dashed line) established November 2006
0
20
40
60
80
100
Per
cent
2003 2004 2005 2006 Jan-Jun07
Jul-Dec07
Use of Aspirin or Plavix
0
20
40
60
80
100
Per
cent
2003 2004 2005 2006 Jan-Jun07
Jul-Dec07
Use of Statins
0
20
40
60
80
100
120
140
160
180
Num
ber
of p
roce
dure
s
2003 2004 2005 2006 2007
Volume
0
10
20
30
40
50
60
70
Per
cent
2003 2004 2005 2006 Jan-Jun07
Jul-Dec07
Unfit for Open Repair
0
10
20
30
40
50
60
Per
cent
2003 2004 2005 2006 Jan-Jun07
Jul-Dec07
Any Endoleak at Completion
0
5
10
Per
cent
2003 2004 2005 2006 Jan-Jun07
Jul-Dec07
Type I or III Endoleak
050
100150200250300350400450500550600650700
Mill
imet
ers
2003 2004 2005 2006 Jan-Jun07
Jul-Dec07
Estimated Median Blood Loss
0
2
4
6
8
10
12
14
16
18
20
Per
cent
2003 2004 2005 2006 Jan-Jun07
Jul-Dec07
Not Extubated in Operating RoomBleeding, MI, dysrhythmia, CHF, respiratory, changeof renal function, leg ischemia/emboli, bowel ischemia,wound complication or return to operating room
0
10
20
30
40
50
60
Per
cent
2003 2004 2005 2006 Jan-Jun07
Jul-Dec07
Post-operative Complications
Among those who came from home
0
5
10
15
20
25
30
35
Per
cent
2003 2004 2005 2006 Jan-Jun07
Jul-Dec07
Not Discharged Home
0
1
2
3
4
5
6
7
Per
cent
2003 2004 2005 2006 Jan-Jun07
Jul-Dec07
Mortality
January 2003 - December 2007: Region, N=701 (blue) and DHMC, N=285 (red)Elective Endo AAA Repair - VSGNNE
Lessons Learned Year 1 VQI
1. Energy of activation is high – maximize momentum2. Hospital must embrace/finance/maintain VQI3. Work within existing Quality format – ACC/STS/VQI4. EMR programming to maximize data capture5. Workflow paramount: NPS/MA/NPs/MD6. Weekly sweep of incomplete procedures7. Introduce incentives to maximize compliance/capture8. Regional framework essential to long term success
4/18/2013
6
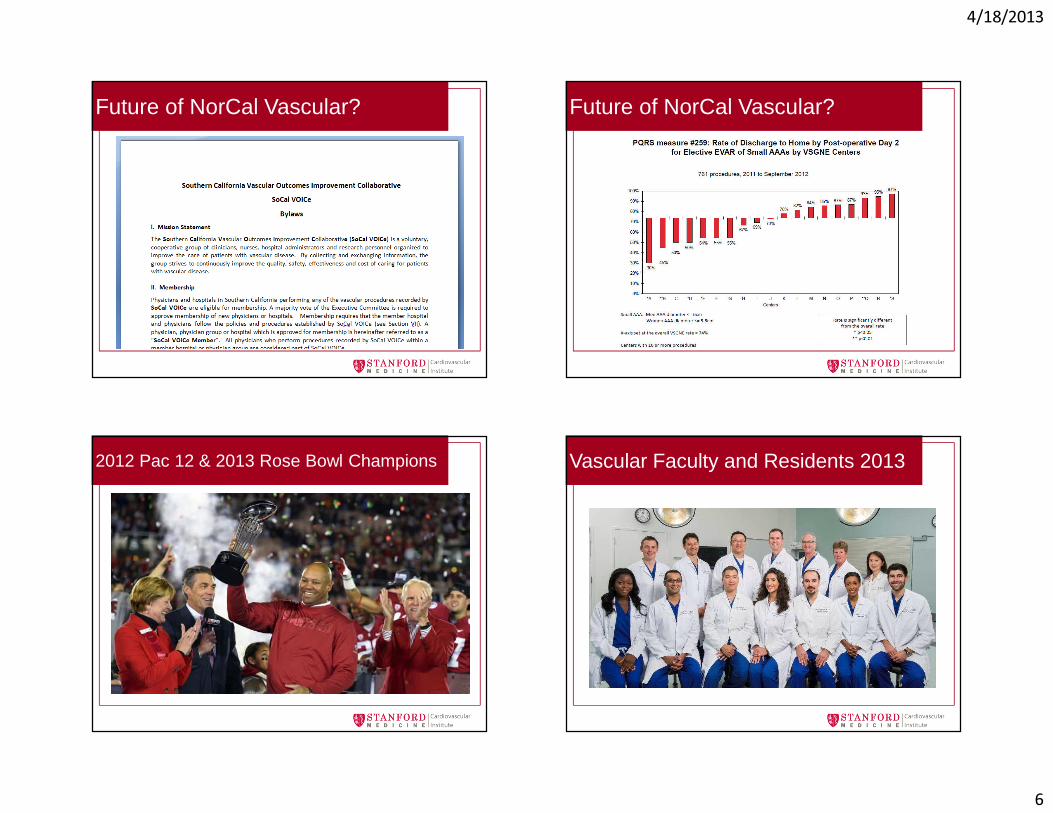
Future of NorCal Vascular? Future of NorCal Vascular?
2012 Pac 12 & 2013 Rose Bowl Champions Vascular Faculty and Residents 2013

4/18/2013
7
NSQIP Performance Current
The Odds Ratio column shows that Vascular performance has been under target of 1 in majority of the categories. Area of highest improvement= AAA Pneumonia

4/18/2013
8
Disclosures
CarolusExelixisGenentechMedtronicPfizerNovartisWL GoreMedtronicCook Medical
Vascular Surgery wRVUs 2005-2012
20,447 20,091
23,491
27,78926,015
32,621 33,21935,572
0
5,000
10,000
15,000
20,000
25,000
30,000
35,000
40,000
FY2005 FY2006 FY2007 FY2008 FY2009 FY2010 FY2011 FY2012