vegetation communities and edaphic relationships along a
TRANSCRIPT
Papers and Proceedings of the Royal Society of Tasmania, Volume 153, 2019 61
VEGETATION COMMUNITIES AND EDAPHIC RELATIONSHIPS ALONG A TYPICAL COASTAL SALTMARSH TO WOODLAND GRADIENT IN EASTERN TASMANIA
by John Aalders, Peter McQuillan and Vishnu Prahalad
(with five text-figures and six tables)
Aalders, J., McQuillan, P. & Prahalad, V. 2019 (14:xii). Vegetation communities and edaphic relationships along a typical coastal saltmarsh to woodland gradient in eastern Tasmania. Papers and Proceedings of the Royal Society of Tasmania 153: 61–74. https://doi.org/10.26749/rstpp.153.61 ISSN 0080-4703. Geography and Spatial Sciences, School of Technology, Environments and Design, University of Tasmania, Private Bag 78, GPO, Hobart, Tasmania 7001, Australia (JA*, PM, VP). *Author for correspondence. Email: [email protected]
Saltmarsh soils impose harsh selection pressures on vegetation resulting in characteristic plant communities. For our study of the effect of edaphic factors on vegetation we chose Long Point in Moulting Lagoon, Tasmania’s largest saltmarsh, which is dominated by a diverse assemblage of halophytic succulents and graminoids. Three transects were established to sample variations in vegetation along the gradient from saltmarsh to woodland. Soil samples were analysed for summer and winter moisture, pH, and electrical conductivity (EC); a mixed summer and winter sample from each point was analysed for soil organic matter (SOM) and carbon. Additionally, a particle size analysis was carried out on all summer samples. Aspects of soil characteristics were aligned to classified vegetation groups and elevation. Moisture, pH, EC, SOM and carbon were all negatively correlated with elevation; the saltmarsh zone displaying higher levels of all variables than those in the adjacent woodland zone. Clay content decreased and sand content increased from the marine margin of the saltmarsh zone to the woodland zone. Within the saltmarsh zone, soil moisture, EC and carbon had highest values in the low marsh area, with values decreasing towards the upper marsh area. This study deepens our understanding of the roles various edaphic factors play in the floristic composition of coastal saltmarshes. Key Words: Edaphic factors, elevation, soil carbon, soil-vegetation relations, zonation, coastal saltmarsh.
INTRODUCTION
Saltmarshes are defined by plant species that are adapted to a harsh environment characterised by high salinity, regular to intermittent inundation, as well as exposure to fluctuating temperatures, winds and waves (Adam 1990, Bridgewater & Cresswell 2003, Saintilan 2009a, Prahalad et al. 2015). Within this distinctive ecological habitat, the spatial distribution of plants is organised into characteristic communities arranged in a sequence or zonation determined by fine-scale changes in a broad array of local environmental variables (Long & Mason 1983, Silvestri et al. 2005). Many authors have described saltmarsh vegetation communities at different spatial scales, from continental (in Australia: Bridgewater & Cresswell 1999, 2003, Saintilan 2009a) to local (in Tasmania: Kirkpatrick & Glasby 1981, Prahalad et al. 2011; in Victoria: Boon et al. 2015).
At a local ecological scale, attention has been largely focussed on the distribution and patterns of variation in vegetation (Adam 2002), often with limited reference to the range of edaphic factors including salinity, moisture, pH, soil organic matter (SOM) and carbon (Snow & Vince 1984, Vince & Snow 1984, Álvarez-Rogel et al. 2000, Huckle et al. 2000, Silvestri et al. 2005, Anisfeld 2012). During the past two decades, with an increasing focus on conservation and restoration, a renewed global interest in saltmarsh soils has emerged (Anisfeld 2012, Burden et al. 2013, Kelleway et al. 2016). In the Australian context, except for the pioneering work by Clarke & Hannon (1967, 1969, 1970), the focus of most recent studies has been on sedimentary dynamics (Rogers et al. 2013) or carbon content of saltmarsh soils (Kelleway et al. 2016). Little
attention has been given to the range of other edaphic factors generally considered in soil-vegetation relations (Huckle et al. 2000, Landi & Angiolini 2015). As a consequence, the determinants of fine-scale zonation in Australian saltmarsh vegetation remain poorly understood. There is also a paucity of studies on the tolerance of Australian saltmarsh plants to variations in soils, with implications for conservation and restoration (Adam 2009).
Australia, by global standards, has only a small extent of its coastline occupied by saltmarshes: approximately 16,000 km2 (Saintilan & Adam 2009). They are generally limited to the southeast of the continent, including Tasmania, with small areas in the southwest of Western Australia (Chapman 1974, Saintilan 2009a). Fairweather (1990) noted that Australian saltmarshes had received the least attention of all marine habitats and their ecological values were largely ignored. Nevertheless, during the past decade a growing appreciation of the value of saltmarshes and a realisation that predicted climate change and sea-level rise will impact saltmarshes directly, has led to increased research in this challenging environment (Saintilan 2009b). This has culminated in the “Subtropical and Temperate Coastal Saltmarsh Community” being recently listed in the ‘vulnerable’ category of the Australian Government’s Environment Protection and Biodiversity Conservation Act 1999 (Threatened Species Scientific Committee 2013).
Tasmania has about 58.6 km2 of coastal saltmarshes, principally located on the east coast and Flinders Island, the north coast and the far northwest including King Island (Prahalad & Kirkpatrick 2019). Although only a small proportion of the Australian total, Tasmania features the highest diversity of saltmarsh vegetation communities
62 John Aalders, Peter McQuillan and Vishnu Prahalad
(Saintilan 2009a, 2009b). Pioneering Tasmanian saltmarsh research was conducted by Curtis & Somerville (1947) at Boomer Bay on the Tasman Peninsula. Other early work focused on intertidal ecology, principally with respect to algae (Guiler 1949, 1952), and the distribution, mapping and vegetation of saltmarshes (Kirkpatrick & Glasby 1981). Work on the benthic fauna, vegetation and soil factors continued sporadically in the 1980s and 1990s (Wong et al. 1993, Richardson & Mulcahy 1996, Richardson et al. 1997, 1998). Gouldthorpe (2000) researched the impacts of drainage and grazing on Derwent River marshes and a recent study identified changes in the extent and community composition of southeast Tasmanian saltmarshes (Prahalad et al. 2011). The real and projected impacts of climate change have also received recent attention (Mount et al. 2010, Prahalad et al. 2015, Prahalad & Kirkpatrick 2019). Nevertheless, there are no Tasmanian studies with detailed field measurements that focus on the interactions of saltmarsh soils and vegetation.
The present study aims to redress this shortcoming by investigating and detailing the relationships between vegetation and a broad array of edaphic factors along a saltmarsh to woodland gradient at a site in eastern Tasmania. Specifically, we ask: (i) what vegetation communities are present in our study site as identified by classification methods?; (ii) what local edaphic factors are likely to influence the presence and distribution of identified vegetation communities?; (iii) how do edaphic factors vary between saltmarsh and the adjacent woodland zone?; (iv) how do edaphic factors vary with elevation and reflect the vegetation community composition along a saltmarsh to woodland gradient? We therefore endeavour to provide a deeper understanding of the edaphic factors that require consideration from a coastal saltmarsh conservation and restoration perspective.
METHODS
Study location
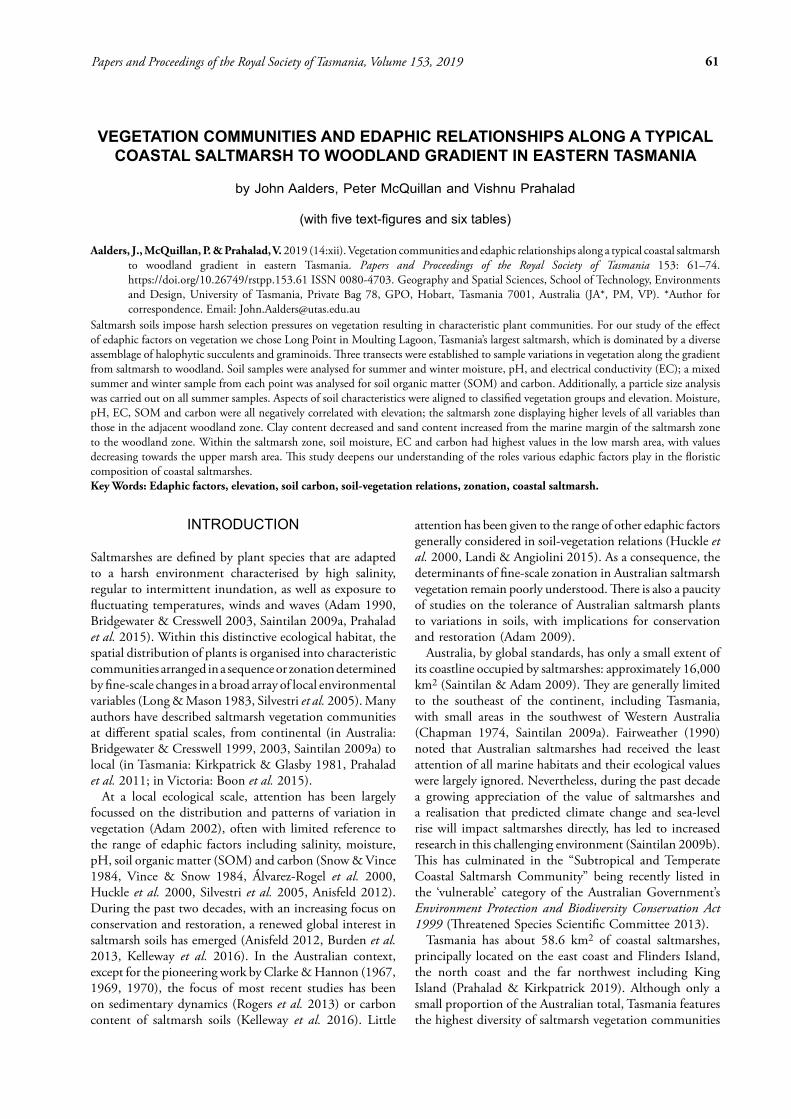
Long Point is on the western shore of Moulting Lagoon, an internationally listed Ramsar site located in eastern Tasmania (fig. 1, Prahalad & Kriwoken 2010). The Lagoon is a wave-dominated estuary with a low-energy central basin that is rimmed by expansive intertidal environments and a coastal parallel barrier (Harris et al. 2002, Heap et al. 2004). The tidal regime is semi-diurnal with a microtidal range of 1.2 metres. The current mean annual rainfall is 590 mm, the mean annual maximum temperature is 18.5 °C and the mean annual minimum temperature is 9.4 °C. Long Point occupies a largely intertidal area of 386 ha made up of the largest contiguous saltmarsh patch in Tasmania (359 ha; Prahalad & Kirkpatrick 2019); the balance is coastal grassland and woodland. The land is privately owned by the Tasmanian Land Conservancy (TLC) and managed for conservation purposes (Prahalad & Kriwoken 2010). The peninsular site is bisected by a central stabilised sand dune varying from 5 to 20 m in elevation which divides the saltmarsh into western
and eastern sections. A dolerite ridge defines the extreme southern margin of the site. Fluvial processes have played a major role in the formation of Long Point’s topographic framework with the underlying grey silts deposited during the Holocene (Kiernan 2013).
The site is characterised by extensive, low-lying saltmarsh dominated by succulent herbs and shrubs, primarily Sarcocornia spp. along with Disphyma crassifolium and Tecticornia arbuscula. The saline graminoids are dominated by Gahnia filum and Austrostipa stipoides. The lowland grasslands and woodland contain native (e.g., Pteridium esculentum), and introduced (e.g., Ulex europaeus) plants and with overstorey species such as Acacia mearnsii in the woodland areas (Kingdom 2008). Vegetation communities on the site, particularly the saltmarsh section, are generally well-defined. Here, the saltmarsh vegetation has been broadly classified under the Tasmanian Vegetation Monitoring and Mapping Program (TASVEG 3.0, version 2013) as ASS (saline succulent herbland), ARS (saline sedgeland/rushland). The grassland and woodland vegetation are classified as GPL (lowland Poa grassland) and NBA (Bursaria–Acacia woodland/grassland), and the sand dune classified as DVG (Eucalyptus viminalis woodland) and FRG (regenerating cleared land) (Harris & Kitchener 2005, Department of Primary Industries, Parks, Water and Environment 2014). The succulent herbland and saline
FIG. 1 — Long Point study location with key physical and geomorphological features noted. The transect lines R, Y and G were derived from the 47 individual sampling points. The saltmarsh extent is denoted by the polygon and the woodland areas occupy the sand dune, sand ridge and the dolerite ridge. Base data from the LIST, © State of Tasmania.

63Vegetation communities and edaphic relationships in eastern Tasmania
grasslands were used for sheep grazing prior to acquisition by the TLC in 2005, resulting in the presence of a number of introduced plant species.
Sampling design
Sampling of vegetation and soil was conducted along three transects established across Long Point. Two transects (R and Y) were orientated west to east and traversed the sand dune. The third transect (G) tracked in a southerly direction incorporating the sand ridge and ended on the dolerite ridge. Transect locations and direction were determined by the profile of the landform and originally positioned to capture as much environmental variation as possible across the elevation gradient (table 1, also see fig. 1).
The boundaries of vegetation communities at Long Point are visually discernible based on the dominance of two or three species within each community and this was used as the basis for allocating individual sampling points along each transect. Sampling points were positioned towards the centre of each vegetation community to avoid the influence of edge effects. Along each transect, a sampling point was located every time the vegetation community composition changed. This allowed for an increased sample size with multiple samples collected from similar vegetation communities across the study area. At each sampling point, a modified Braun–Blanquet cover-abundance method was applied with a 1×5 m quadrat at right angles to the transect to estimate the quantity of each species in a vegetation community in a single scale which incorporates both cover and abundance (Mueller-Dombois & Ellenberg 1974, Moore & Chapman 1986). This method ascribes an ordered numerical value to the crown cover percentage of individual species as follows:1 = < 1%, 2 = 1–5%, 3 = 5–25%, 4 = 25–50%, 5 = 50–75% and 6 = > 75%
Due to the overlapping cover of some species, the total cover for each sample plot may exceed 100% (Moore & Chapman 1986) and this was a common outcome at Long Point. The nomenclature, classification and current status (endemic, introduced etc.) of plant species conforms to de Salas & Baker (2018). All sampling points (n = 47) were
assessed in April 2013 and reassessed in January 2014 to account for summer annuals.
Three replicate soil samples to a depth of 10 cm were taken at each sampling point. The sampling depth was chosen to include the root zone. The summer soil sampling was conducted in January 2013, with a follow-up winter soil sampling in July 2013. The winter soil sampling regime was conducted to document changes in soil moisture content, pH and EC due to seasonal changes in precipitation and evaporation at the site.
At each sampling point, surface elevation was measured using a real-time kinematic survey with geodetic grade GPS receivers. A base station was set up on a 4th order Survey Control Point located on Grange Hill near Long Point using a Leica 1200 GPS and a radio transmitter. A Leica 1200 Rover GPS was used to measure each sampling point (n = 47) at 1 second epochs for 20 seconds. The accuracy of these points relative to the base station was ±20 mm horizontally and ±50 mm vertically.
Laboratory analyses
Soil from each sample was air-dried in a fume hood using only fan-forced air to prevent mould growth or any changes to the characterisation of the soil. Once dried, the samples, minus any obvious plant material, were passed through a 2 mm sieve. The dry-sieved fraction was packaged in seal-top plastic bags, labelled and stored. The analysis of the summer and winter soil samples for moisture content and soil chemistry (pH and EC), and of the combined samples for soil organic matter, followed Rayment & Lyons (2011). As salinity and EC have a close relationship (Hazelton & Murphy 2007), EC was used as a proxy for salinity in this study. The analysis for total carbon was conducted using an ELTRA® CS 2000 Carbon Sulfur Determinator. The standard procedure for carbon analysis in the ELTRA, as detailed in the operating manual, was followed. A particle size analysis (PSA) was carried out on each of the combined soil samples to classify the soil texture at each sampling point. The analysis was based on the density method which involves the Bouyoucos hydrometer procedure (Day 1965, Sur & Kukal 1992, Loveland & Whalley 2000).
TABLE 1 — Transect attributes at Long Point, Moulting Lagoon, Tasmania
Transect Description Length (m)
Sampling points (n)
R Northern transect through Gum Tree Hole which crosses the sand dune twice either side of the lunette; sand dune has a woodland-dominated vegetation cover. Saltmarsh vegetation is extensive on either side of the sand dune and around Gum Tree Hole.
995 14
Y Middle transect through Round Hole after crossing the sand dune; vegetation either side of the dune is dominated by graminoids (some introduced). Saltmarsh vegetation is extensive either side of the sand dune and around Round Hole.
1215 17
G Southern transect which crosses the low east/west sand ridge and is dominated by bracken; it traverses beside Opening Hole and ends on the dolerite ridge. This transect had two unavoidable bends due to impenetrable gorse cover present at the time of establishment.
1320 16
Totals 3530 47
64 John Aalders, Peter McQuillan and Vishnu Prahalad
Statistical analyses
To characterise the distinct vegetation communities present in the study area, vegetation data from the 47 sampling points were grouped by cluster analysis incorporating the Ward linkage method from the vegan package in R (Oksanen 2013). The analysis used data trimmed to cover-abundance values of 3–6 to distinguish vegetation groups. Cover-abundance values of 1 and 2 (i.e., values < 5%) were excluded as they unduly confounded the cluster analysis (Wildi 2013). The preferred grouping of the data was determined through a whole-evidence approach that included a statistical analysis of cover data, a visual appraisal and first-hand knowledge of the site (Wildi 2013). Non-metric multidimensional scaling (nMDS) was then used to explore the relationship between the sampling points and the six groups. The standard TASVEG 3.0 vegetation community groups for saltmarsh were used to relate to, and compare with, the six groups derived for this study.
Indicator species emerge through an analysis of occurrence or abundance values from a set of sampled points and the classification of the same points into site groups, which may represent vegetation communities. The indicator species analysis was carried out in the R package indicspecies using the indicator value function (indval) (De Cáceres 2013).
Data from edaphic factors were plotted against the elevation profile of each transect to display broad response patterns. The mean values from the summer and winter analysis of pH, EC and moisture were plotted to emphasise seasonal differences, while the outcome of SOM, carbon and the texture elements were plotted as percentages.
Soil data from each sampling point were aligned to the vegetation groups — ASS(a), ASS(b), ARS, GSL (lowland grassy sedgeland), GPL(sr) and GPL(dr) — using multivariate methods in the vegan package in R. Boxplots were used to summarise the spread of the data differences between group means and were examined using analysis of variance (ANOVA). The post hoc Tukey’s Honestly Significant Difference (HSD) test was used to identify those groups that differed significantly from each other for each soil factor. The relationship between edaphic factors was tested using the correlation function in R to help identify predictor variables that would be useful tools in the future. Soil texture analysis was carried out in the R package soiltexture (Moeys 2014). The results of PSA for each sample along with the average for each vegetation group were plotted on the standard USDA/FAO triangular texture diagram as recommended by Minasny & McBratney (2001), to summarise the soil texture classification for each sampling point.
RESULTS
Vegetation communities
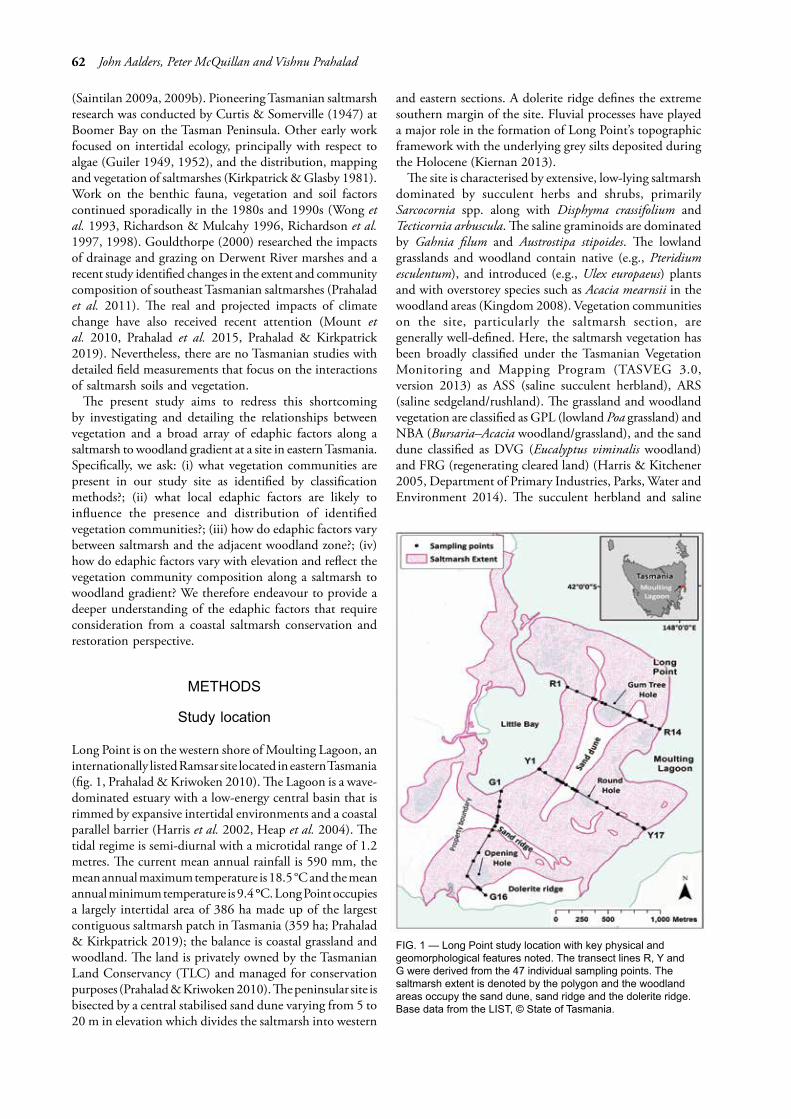
Cluster analysis of the vegetation data identified six distinct vegetation communities present in the study area (fig. 2). Based on the dendrogram of the three defined saltmarsh vegetation communities, two groups at Long Point fell into the saline succulent herbland (ASS) code, one that was wholly dominated by Sarcocornia quinqueflora and/or S. blackiana, the other dominated by T. arbuscula, S. quinqueflora
FIG. 2 — Dendrogram of 47 sampling points from transects R, Y and G (see fig. 1) clustered by Ward linkage method into six groups based on vegetation communities differentiated to a level of 16% dissimilarity. Groups have been assigned TASVEG 3.0 codes (see table 2 for group descriptions) as follows: (named from left to right) ASS(a), ASS(b), GPL(sr), GPL(dr), GSL and ARS.
65Vegetation communities and edaphic relationships in eastern Tasmania
and/or S. blackiana and D. crassifolium. These two groups were annotated ASS(a) and ASS(b) respectively. The split in ASS was justified by vegetation structure (height) as observed on the ground. The third group represented saline sedgeland/rushland dominated by Juncus kraussii and G. filum which is consistent with the TASVEG community coded as ARS.
The ecotone zones and woodland mapped as GSL were dominated by Lomandra longifolia and to a lesser extent Lepidosperma concavum, with tall shrubs such as A. mearnsii and Bursaria spinosa. Lowland grasslands, represented by code GPL, were split into two groups (fig. 2), GPL(sr) and GPL(dr), to represent the on-ground variation noted in the vegetation community. GPL(sr) captured vegetation dominated by Pteridium esculentum and J. kraussii, while GPL(dr) included areas dominated by tussocks of Poa labillardierei. Group descriptions are provided in table 2.
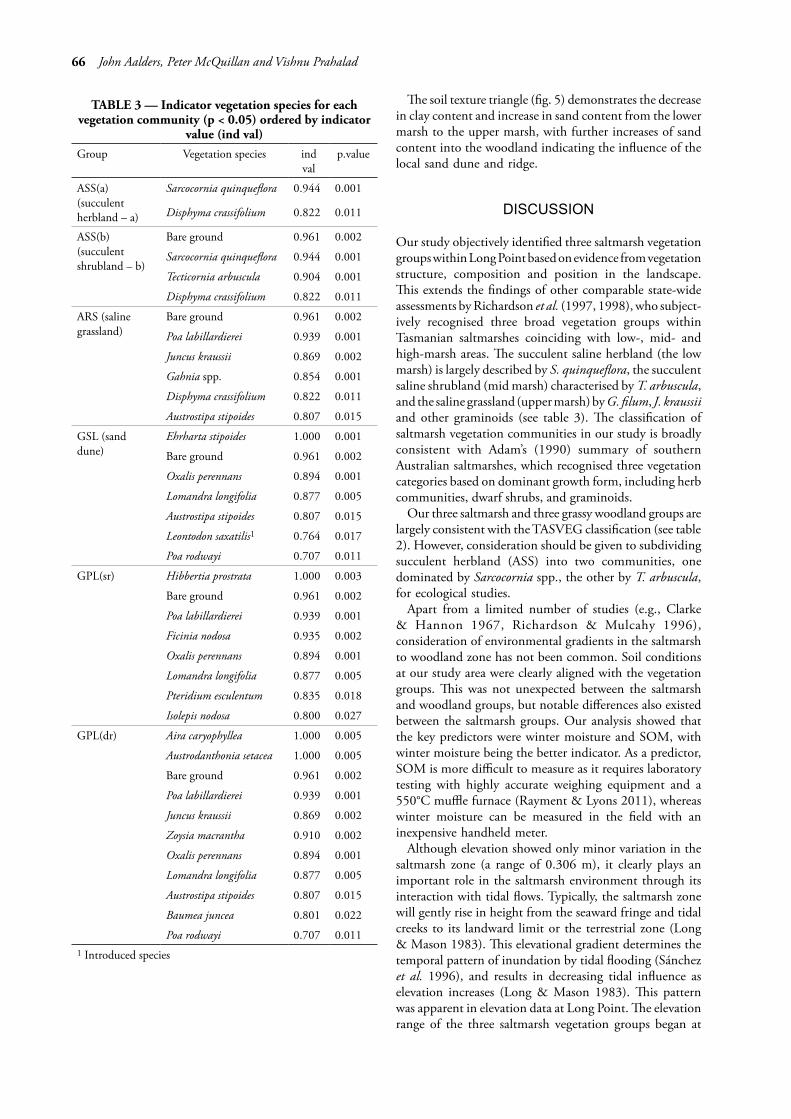
The results of the indicator species analysis are listed in table 3 highlighting vegetation taxa for which p < 0.05. At Long Point, D. crassifolium was a significant indicator species (p < 0.02) in all three saltmarsh groups. Similarly, S. quinqueflora was highly significant in groups ASS(a) and ASS(b) (p < 0.001) but was also evident in ARS as a groundcover species, although in much reduced extent. Similarly, A. stipoides was found on the sand dune (GSL) and dolerite ridge (GPL(dr)) as well as the saline grasslands (ARS) (p < 0.015).
Soil characteristics and edaphic relationships
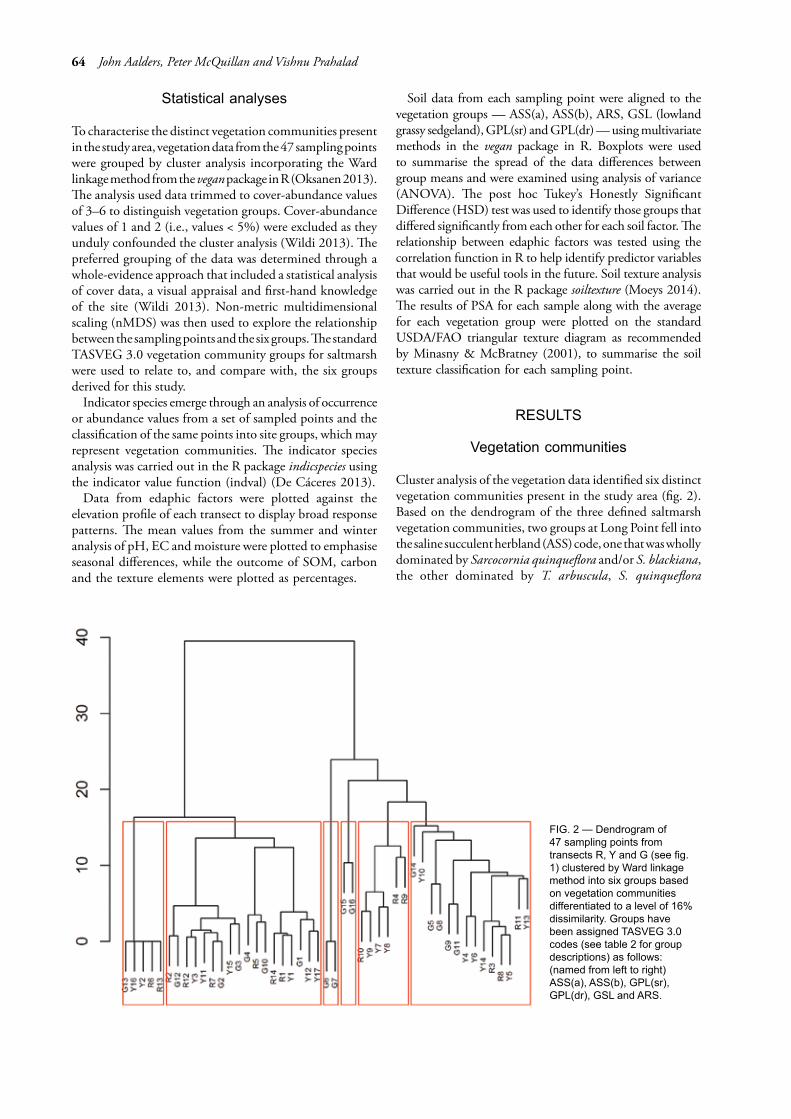
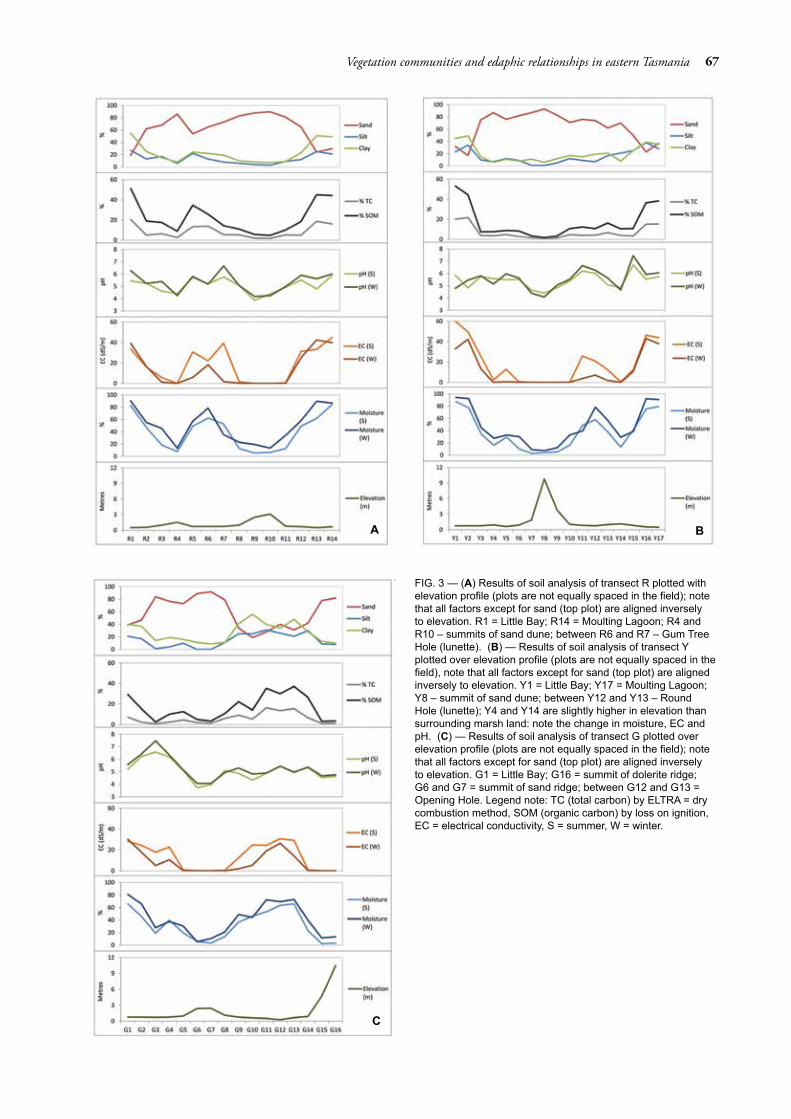
Soil data for each transect are summarised in figure 3A–C. The elevation measured across the study area ranged from 0.21 m to greater than 10 m above mean sea level (see lowest panel in fig. 3A–C). Within the saltmarsh, elevation ranged from 0.21 m to 0.84 m. The elevation of the woodland zone ranged from 1 m to greater than 10 m. Summer moisture and EC, winter moisture and EC, carbon and SOM were all strongly inversely related to elevation. Small changes in elevation had a marked impact on moisture and EC. Similarly, although to a lesser extent, summer and winter pH were negatively correlated with elevation. The response
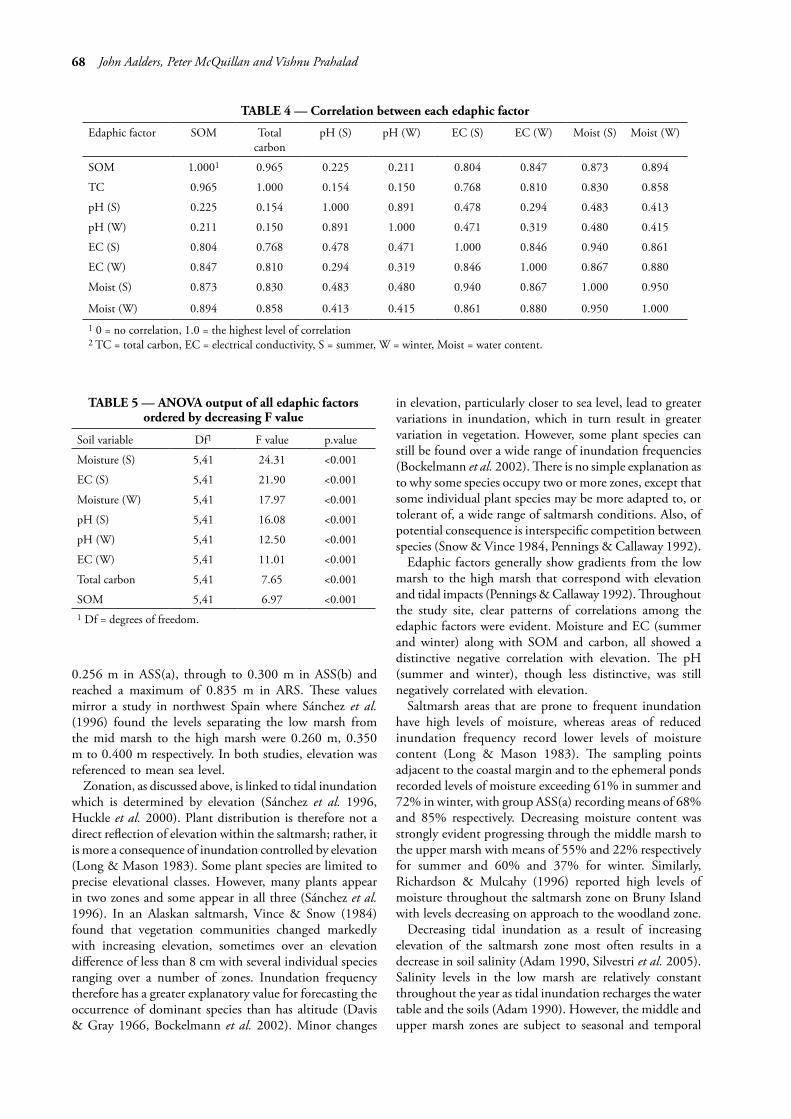
of pH may be aligned more to a combination of elevation and vegetation community structure. Texture was affected by landscape position, including elevation. Sand content was positively correlated with elevation. In contrast, silt and clay content were negatively related to elevation and sand content. The strength of the correlation (table 4) between each variable showed that SOM and winter moisture have the highest correlation with the remaining edaphic factors. SOM shows very little correlation with pH in summer and winter, but strong correlation with the remaining factors. Winter moisture displayed moderate correlation with summer and winter pH, with strong correlation with the remaining factors.
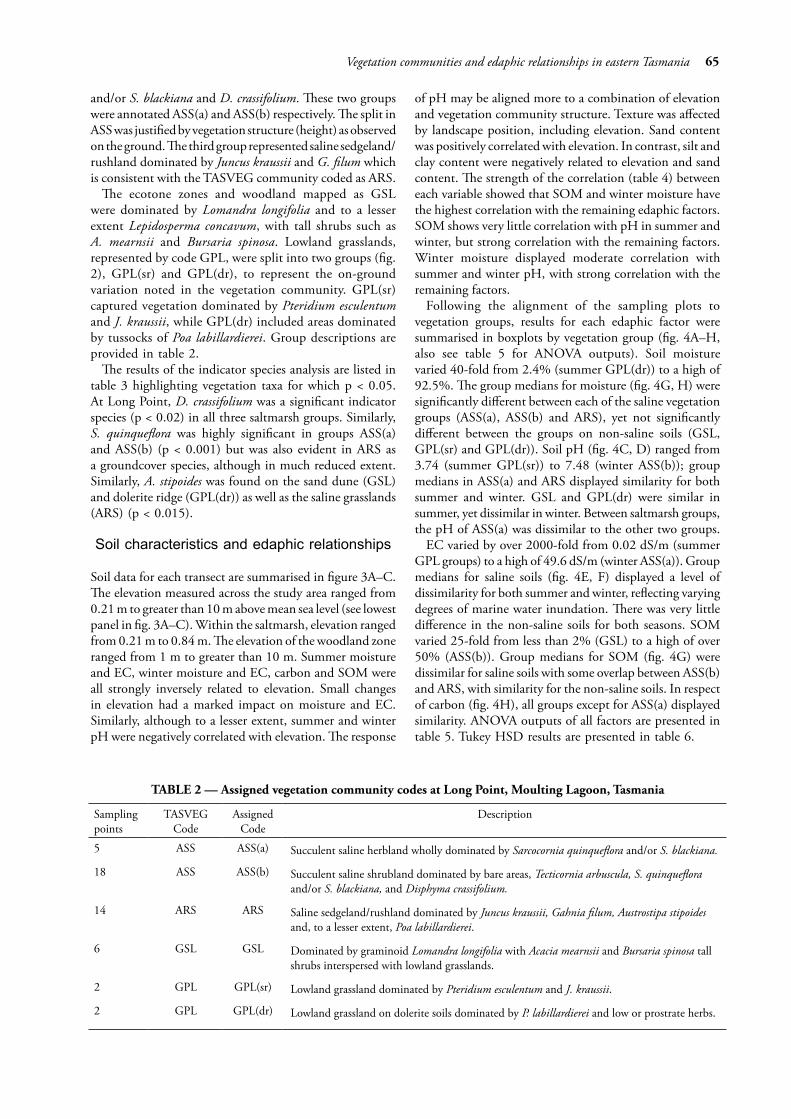
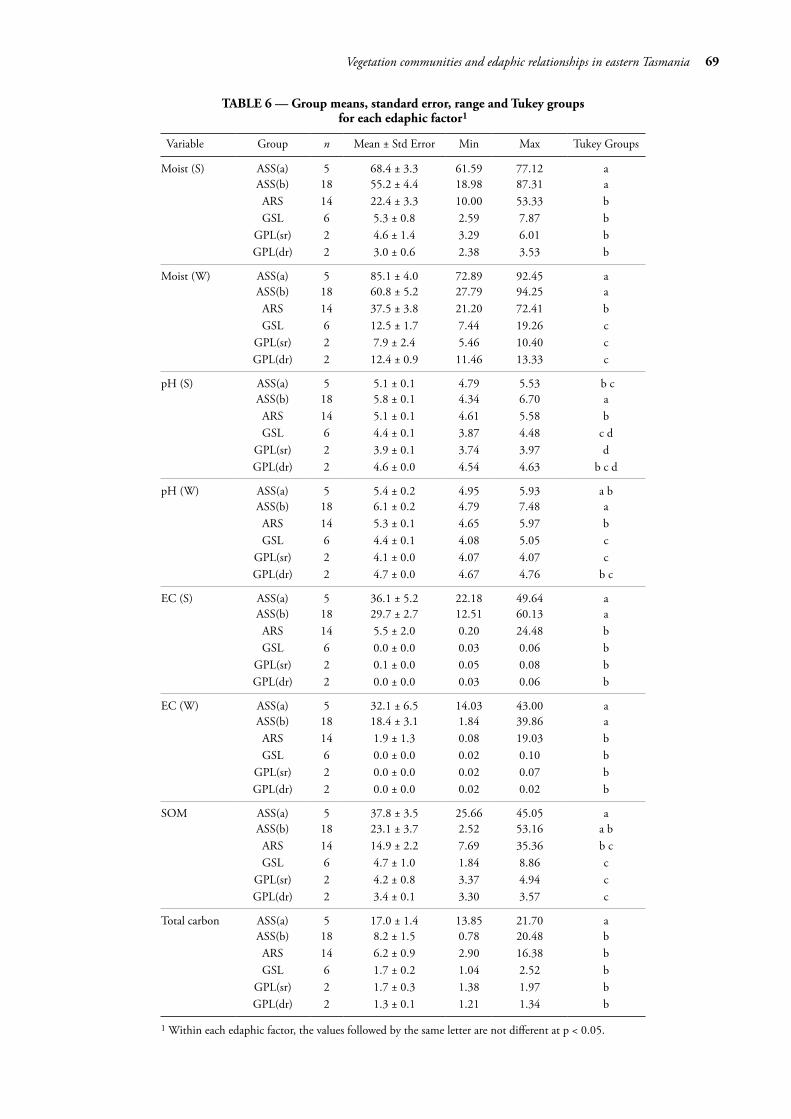
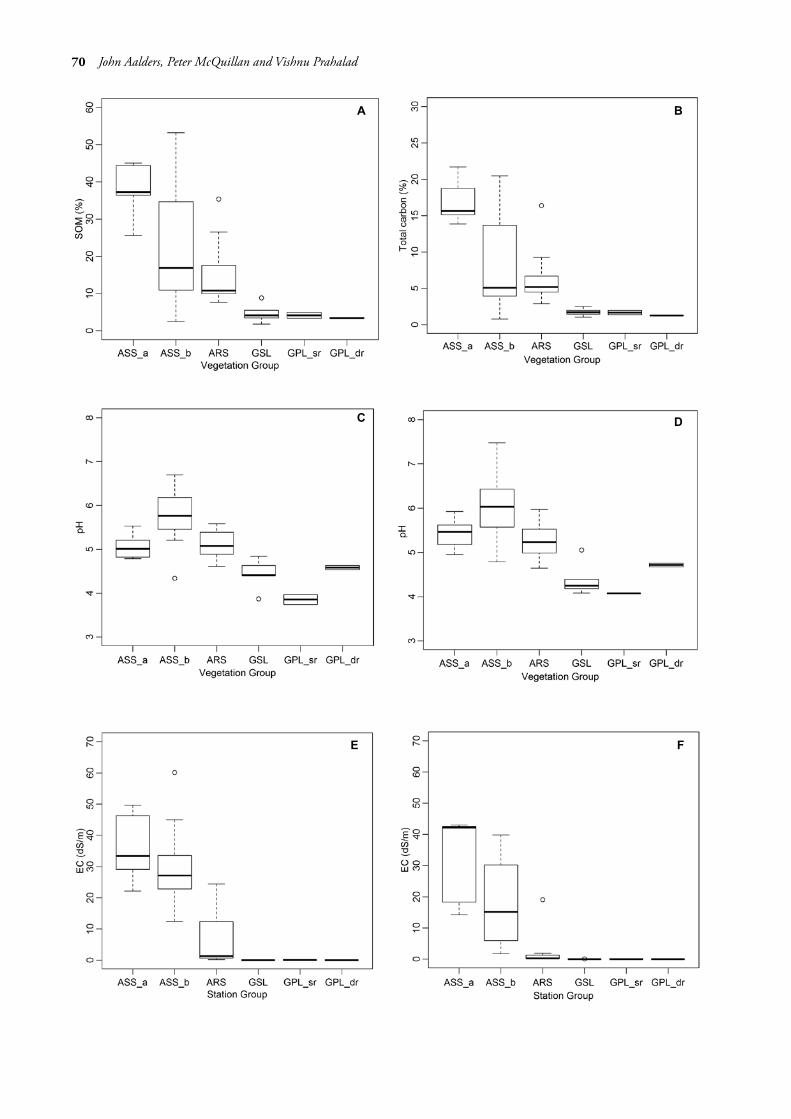
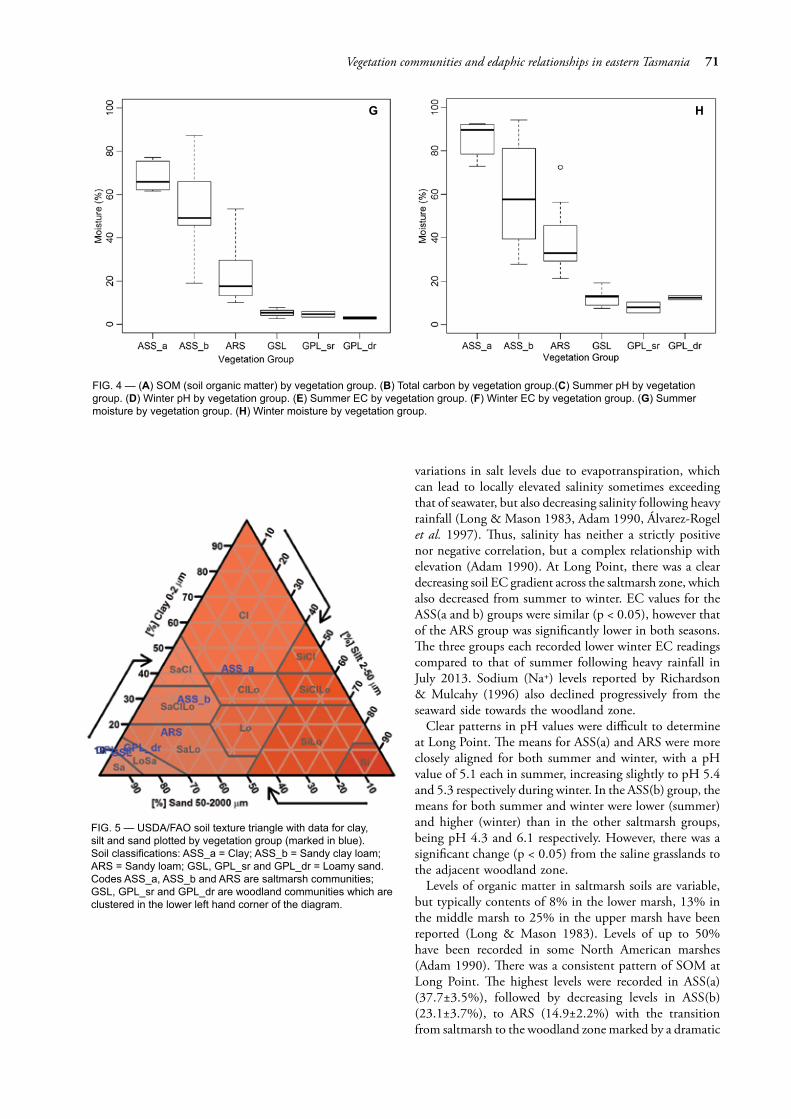
Following the alignment of the sampling plots to vegetation groups, results for each edaphic factor were summarised in boxplots by vegetation group (fig. 4A–H, also see table 5 for ANOVA outputs). Soil moisture varied 40-fold from 2.4% (summer GPL(dr)) to a high of 92.5%. The group medians for moisture (fig. 4G, H) were significantly different between each of the saline vegetation groups (ASS(a), ASS(b) and ARS), yet not significantly different between the groups on non-saline soils (GSL, GPL(sr) and GPL(dr)). Soil pH (fig. 4C, D) ranged from 3.74 (summer GPL(sr)) to 7.48 (winter ASS(b)); group medians in ASS(a) and ARS displayed similarity for both summer and winter. GSL and GPL(dr) were similar in summer, yet dissimilar in winter. Between saltmarsh groups, the pH of ASS(a) was dissimilar to the other two groups.
EC varied by over 2000-fold from 0.02 dS/m (summer GPL groups) to a high of 49.6 dS/m (winter ASS(a)). Group medians for saline soils (fig. 4E, F) displayed a level of dissimilarity for both summer and winter, reflecting varying degrees of marine water inundation. There was very little difference in the non-saline soils for both seasons. SOM varied 25-fold from less than 2% (GSL) to a high of over 50% (ASS(b)). Group medians for SOM (fig. 4G) were dissimilar for saline soils with some overlap between ASS(b) and ARS, with similarity for the non-saline soils. In respect of carbon (fig. 4H), all groups except for ASS(a) displayed similarity. ANOVA outputs of all factors are presented in table 5. Tukey HSD results are presented in table 6.
TABLE 2 — Assigned vegetation community codes at Long Point, Moulting Lagoon, Tasmania
Sampling points
TASVEG Code
Assigned Code
Description
5 ASS ASS(a) Succulent saline herbland wholly dominated by Sarcocornia quinqueflora and/or S. blackiana.
18 ASS ASS(b) Succulent saline shrubland dominated by bare areas, Tecticornia arbuscula, S. quinqueflora and/or S. blackiana, and Disphyma crassifolium.
14 ARS ARS Saline sedgeland/rushland dominated by Juncus kraussii, Gahnia filum, Austrostipa stipoides and, to a lesser extent, Poa labillardierei.
6 GSL GSL Dominated by graminoid Lomandra longifolia with Acacia mearnsii and Bursaria spinosa tall shrubs interspersed with lowland grasslands.
2 GPL GPL(sr) Lowland grassland dominated by Pteridium esculentum and J. kraussii.
2 GPL GPL(dr) Lowland grassland on dolerite soils dominated by P. labillardierei and low or prostrate herbs.
66 John Aalders, Peter McQuillan and Vishnu Prahalad
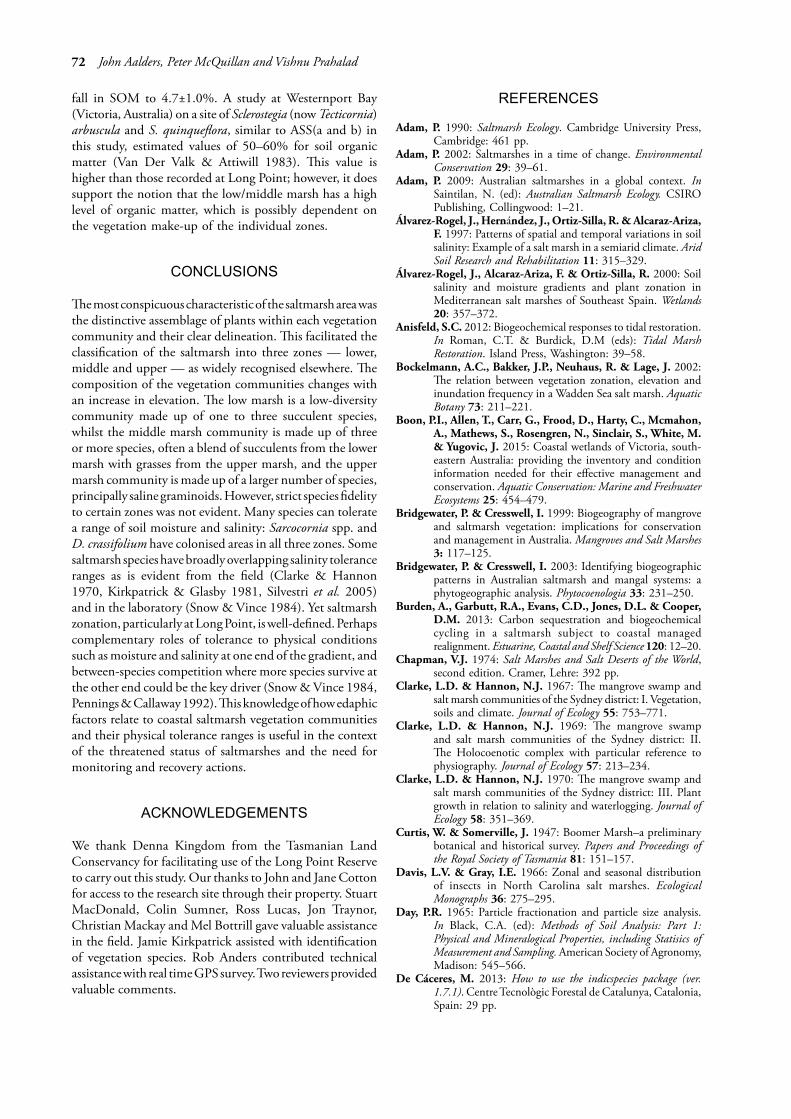
The soil texture triangle (fig. 5) demonstrates the decrease in clay content and increase in sand content from the lower marsh to the upper marsh, with further increases of sand content into the woodland indicating the influence of the local sand dune and ridge.
DISCUSSION
Our study objectively identified three saltmarsh vegetation groups within Long Point based on evidence from vegetation structure, composition and position in the landscape. This extends the findings of other comparable state-wide assessments by Richardson et al. (1997, 1998), who subject-ively recognised three broad vegetation groups within Tasmanian saltmarshes coinciding with low-, mid- and high-marsh areas. The succulent saline herbland (the low marsh) is largely described by S. quinqueflora, the succulent saline shrubland (mid marsh) characterised by T. arbuscula, and the saline grassland (upper marsh) by G. filum, J. kraussii and other graminoids (see table 3). The classification of saltmarsh vegetation communities in our study is broadly consistent with Adam’s (1990) summary of southern Australian saltmarshes, which recognised three vegetation categories based on dominant growth form, including herb communities, dwarf shrubs, and graminoids.
Our three saltmarsh and three grassy woodland groups are largely consistent with the TASVEG classification (see table 2). However, consideration should be given to subdividing succulent herbland (ASS) into two communities, one dominated by Sarcocornia spp., the other by T. arbuscula, for ecological studies.
Apart from a limited number of studies (e.g., Clarke & Hannon 1967, Richardson & Mulcahy 1996), consideration of environmental gradients in the saltmarsh to woodland zone has not been common. Soil conditions at our study area were clearly aligned with the vegetation groups. This was not unexpected between the saltmarsh and woodland groups, but notable differences also existed between the saltmarsh groups. Our analysis showed that the key predictors were winter moisture and SOM, with winter moisture being the better indicator. As a predictor, SOM is more difficult to measure as it requires laboratory testing with highly accurate weighing equipment and a 550°C muffle furnace (Rayment & Lyons 2011), whereas winter moisture can be measured in the field with an inexpensive handheld meter.
Although elevation showed only minor variation in the saltmarsh zone (a range of 0.306 m), it clearly plays an important role in the saltmarsh environment through its interaction with tidal flows. Typically, the saltmarsh zone will gently rise in height from the seaward fringe and tidal creeks to its landward limit or the terrestrial zone (Long & Mason 1983). This elevational gradient determines the temporal pattern of inundation by tidal flooding (Sánchez et al. 1996), and results in decreasing tidal influence as elevation increases (Long & Mason 1983). This pattern was apparent in elevation data at Long Point. The elevation range of the three saltmarsh vegetation groups began at
TABLE 3 — Indicator vegetation species for each vegetation community (p < 0.05) ordered by indicator
value (ind val)Group Vegetation species ind
valp.value
ASS(a) (succulent herbland – a)
Sarcocornia quinqueflora 0.944 0.001
Disphyma crassifolium 0.822 0.011
ASS(b) (succulent shrubland – b)
Bare ground 0.961 0.002
Sarcocornia quinqueflora 0.944 0.001
Tecticornia arbuscula 0.904 0.001
Disphyma crassifolium 0.822 0.011
ARS (saline grassland)
Bare ground 0.961 0.002
Poa labillardierei 0.939 0.001
Juncus kraussii 0.869 0.002
Gahnia spp. 0.854 0.001
Disphyma crassifolium 0.822 0.011
Austrostipa stipoides 0.807 0.015
GSL (sand dune)
Ehrharta stipoides 1.000 0.001
Bare ground 0.961 0.002
Oxalis perennans 0.894 0.001
Lomandra longifolia 0.877 0.005
Austrostipa stipoides 0.807 0.015
Leontodon saxatilis1 0.764 0.017
Poa rodwayi 0.707 0.011
GPL(sr) Hibbertia prostrata 1.000 0.003
Bare ground 0.961 0.002
Poa labillardierei 0.939 0.001
Ficinia nodosa 0.935 0.002
Oxalis perennans 0.894 0.001
Lomandra longifolia 0.877 0.005
Pteridium esculentum 0.835 0.018
Isolepis nodosa 0.800 0.027
GPL(dr) Aira caryophyllea 1.000 0.005
Austrodanthonia setacea 1.000 0.005
Bare ground 0.961 0.002
Poa labillardierei 0.939 0.001
Juncus kraussii 0.869 0.002
Zoysia macrantha 0.910 0.002
Oxalis perennans 0.894 0.001
Lomandra longifolia 0.877 0.005
Austrostipa stipoides 0.807 0.015
Baumea juncea 0.801 0.022
Poa rodwayi 0.707 0.0111 Introduced species
67Vegetation communities and edaphic relationships in eastern Tasmania
FIG. 3 — (A) Results of soil analysis of transect R plotted with elevation profile (plots are not equally spaced in the field); note that all factors except for sand (top plot) are aligned inversely to elevation. R1 = Little Bay; R14 = Moulting Lagoon; R4 and R10 – summits of sand dune; between R6 and R7 – Gum Tree Hole (lunette). (B) — Results of soil analysis of transect Y plotted over elevation profile (plots are not equally spaced in the field), note that all factors except for sand (top plot) are aligned inversely to elevation. Y1 = Little Bay; Y17 = Moulting Lagoon; Y8 – summit of sand dune; between Y12 and Y13 – Round Hole (lunette); Y4 and Y14 are slightly higher in elevation than surrounding marsh land: note the change in moisture, EC and pH. (C) — Results of soil analysis of transect G plotted over elevation profile (plots are not equally spaced in the field); note that all factors except for sand (top plot) are aligned inversely to elevation. G1 = Little Bay; G16 = summit of dolerite ridge; G6 and G7 = summit of sand ridge; between G12 and G13 = Opening Hole. Legend note: TC (total carbon) by ELTRA = dry combustion method, SOM (organic carbon) by loss on ignition, EC = electrical conductivity, S = summer, W = winter.
A B
C
68 John Aalders, Peter McQuillan and Vishnu Prahalad
TABLE 4 — Correlation between each edaphic factor
Edaphic factor SOM Total carbon
pH (S) pH (W) EC (S) EC (W) Moist (S) Moist (W)
SOM 1.0001 0.965 0.225 0.211 0.804 0.847 0.873 0.894
TC 0.965 1.000 0.154 0.150 0.768 0.810 0.830 0.858
pH (S) 0.225 0.154 1.000 0.891 0.478 0.294 0.483 0.413
pH (W) 0.211 0.150 0.891 1.000 0.471 0.319 0.480 0.415
EC (S) 0.804 0.768 0.478 0.471 1.000 0.846 0.940 0.861
EC (W) 0.847 0.810 0.294 0.319 0.846 1.000 0.867 0.880
Moist (S) 0.873 0.830 0.483 0.480 0.940 0.867 1.000 0.950
Moist (W) 0.894 0.858 0.413 0.415 0.861 0.880 0.950 1.0001 0 = no correlation, 1.0 = the highest level of correlation2 TC = total carbon, EC = electrical conductivity, S = summer, W = winter, Moist = water content.
TABLE 5 — ANOVA output of all edaphic factors ordered by decreasing F value
Soil variable Df1 F value p.value
Moisture (S) 5,41 24.31 <0.001
EC (S) 5,41 21.90 <0.001
Moisture (W) 5,41 17.97 <0.001
pH (S) 5,41 16.08 <0.001
pH (W) 5,41 12.50 <0.001
EC (W) 5,41 11.01 <0.001
Total carbon 5,41 7.65 <0.001
SOM 5,41 6.97 <0.0011 Df = degrees of freedom.
0.256 m in ASS(a), through to 0.300 m in ASS(b) and reached a maximum of 0.835 m in ARS. These values mirror a study in northwest Spain where Sánchez et al. (1996) found the levels separating the low marsh from the mid marsh to the high marsh were 0.260 m, 0.350 m to 0.400 m respectively. In both studies, elevation was referenced to mean sea level.
Zonation, as discussed above, is linked to tidal inundation which is determined by elevation (Sánchez et al. 1996, Huckle et al. 2000). Plant distribution is therefore not a direct reflection of elevation within the saltmarsh; rather, it is more a consequence of inundation controlled by elevation (Long & Mason 1983). Some plant species are limited to precise elevational classes. However, many plants appear in two zones and some appear in all three (Sánchez et al. 1996). In an Alaskan saltmarsh, Vince & Snow (1984) found that vegetation communities changed markedly with increasing elevation, sometimes over an elevation difference of less than 8 cm with several individual species ranging over a number of zones. Inundation frequency therefore has a greater explanatory value for forecasting the occurrence of dominant species than has altitude (Davis & Gray 1966, Bockelmann et al. 2002). Minor changes
in elevation, particularly closer to sea level, lead to greater variations in inundation, which in turn result in greater variation in vegetation. However, some plant species can still be found over a wide range of inundation frequencies (Bockelmann et al. 2002). There is no simple explanation as to why some species occupy two or more zones, except that some individual plant species may be more adapted to, or tolerant of, a wide range of saltmarsh conditions. Also, of potential consequence is interspecific competition between species (Snow & Vince 1984, Pennings & Callaway 1992).
Edaphic factors generally show gradients from the low marsh to the high marsh that correspond with elevation and tidal impacts (Pennings & Callaway 1992). Throughout the study site, clear patterns of correlations among the edaphic factors were evident. Moisture and EC (summer and winter) along with SOM and carbon, all showed a distinctive negative correlation with elevation. The pH (summer and winter), though less distinctive, was still negatively correlated with elevation.
Saltmarsh areas that are prone to frequent inundation have high levels of moisture, whereas areas of reduced inundation frequency record lower levels of moisture content (Long & Mason 1983). The sampling points adjacent to the coastal margin and to the ephemeral ponds recorded levels of moisture exceeding 61% in summer and 72% in winter, with group ASS(a) recording means of 68% and 85% respectively. Decreasing moisture content was strongly evident progressing through the middle marsh to the upper marsh with means of 55% and 22% respectively for summer and 60% and 37% for winter. Similarly, Richardson & Mulcahy (1996) reported high levels of moisture throughout the saltmarsh zone on Bruny Island with levels decreasing on approach to the woodland zone.
Decreasing tidal inundation as a result of increasing elevation of the saltmarsh zone most often results in a decrease in soil salinity (Adam 1990, Silvestri et al. 2005). Salinity levels in the low marsh are relatively constant throughout the year as tidal inundation recharges the water table and the soils (Adam 1990). However, the middle and upper marsh zones are subject to seasonal and temporal
69Vegetation communities and edaphic relationships in eastern Tasmania
TABLE 6 — Group means, standard error, range and Tukey groups for each edaphic factor1
Variable Group n Mean ± Std Error Min Max Tukey Groups
Moist (S) ASS(a) 5 68.4 ± 3.3 61.59 77.12 aASS(b) 18 55.2 ± 4.4 18.98 87.31 aARS 14 22.4 ± 3.3 10.00 53.33 bGSL 6 5.3 ± 0.8 2.59 7.87 b
GPL(sr) 2 4.6 ± 1.4 3.29 6.01 bGPL(dr) 2 3.0 ± 0.6 2.38 3.53 b
Moist (W) ASS(a) 5 85.1 ± 4.0 72.89 92.45 aASS(b) 18 60.8 ± 5.2 27.79 94.25 aARS 14 37.5 ± 3.8 21.20 72.41 bGSL 6 12.5 ± 1.7 7.44 19.26 c
GPL(sr) 2 7.9 ± 2.4 5.46 10.40 cGPL(dr) 2 12.4 ± 0.9 11.46 13.33 c
pH (S) ASS(a) 5 5.1 ± 0.1 4.79 5.53 b cASS(b) 18 5.8 ± 0.1 4.34 6.70 aARS 14 5.1 ± 0.1 4.61 5.58 bGSL 6 4.4 ± 0.1 3.87 4.48 c d
GPL(sr) 2 3.9 ± 0.1 3.74 3.97 dGPL(dr) 2 4.6 ± 0.0 4.54 4.63 b c d
pH (W) ASS(a) 5 5.4 ± 0.2 4.95 5.93 a bASS(b) 18 6.1 ± 0.2 4.79 7.48 aARS 14 5.3 ± 0.1 4.65 5.97 bGSL 6 4.4 ± 0.1 4.08 5.05 c
GPL(sr) 2 4.1 ± 0.0 4.07 4.07 cGPL(dr) 2 4.7 ± 0.0 4.67 4.76 b c
EC (S) ASS(a) 5 36.1 ± 5.2 22.18 49.64 aASS(b) 18 29.7 ± 2.7 12.51 60.13 aARS 14 5.5 ± 2.0 0.20 24.48 bGSL 6 0.0 ± 0.0 0.03 0.06 b
GPL(sr) 2 0.1 ± 0.0 0.05 0.08 bGPL(dr) 2 0.0 ± 0.0 0.03 0.06 b
EC (W) ASS(a) 5 32.1 ± 6.5 14.03 43.00 aASS(b) 18 18.4 ± 3.1 1.84 39.86 aARS 14 1.9 ± 1.3 0.08 19.03 bGSL 6 0.0 ± 0.0 0.02 0.10 b
GPL(sr) 2 0.0 ± 0.0 0.02 0.07 bGPL(dr) 2 0.0 ± 0.0 0.02 0.02 b
SOM ASS(a) 5 37.8 ± 3.5 25.66 45.05 aASS(b) 18 23.1 ± 3.7 2.52 53.16 a bARS 14 14.9 ± 2.2 7.69 35.36 b cGSL 6 4.7 ± 1.0 1.84 8.86 c
GPL(sr) 2 4.2 ± 0.8 3.37 4.94 cGPL(dr) 2 3.4 ± 0.1 3.30 3.57 c
Total carbon ASS(a) 5 17.0 ± 1.4 13.85 21.70 aASS(b) 18 8.2 ± 1.5 0.78 20.48 bARS 14 6.2 ± 0.9 2.90 16.38 bGSL 6 1.7 ± 0.2 1.04 2.52 b
GPL(sr) 2 1.7 ± 0.3 1.38 1.97 bGPL(dr) 2 1.3 ± 0.1 1.21 1.34 b
1 Within each edaphic factor, the values followed by the same letter are not different at p < 0.05.
70 John Aalders, Peter McQuillan and Vishnu Prahalad
A B
C D
E F
71Vegetation communities and edaphic relationships in eastern Tasmania
FIG. 4 — (A) SOM (soil organic matter) by vegetation group. (B) Total carbon by vegetation group.(C) Summer pH by vegetation group. (D) Winter pH by vegetation group. (E) Summer EC by vegetation group. (F) Winter EC by vegetation group. (G) Summer moisture by vegetation group. (H) Winter moisture by vegetation group.
G H
variations in salt levels due to evapotranspiration, which can lead to locally elevated salinity sometimes exceeding that of seawater, but also decreasing salinity following heavy rainfall (Long & Mason 1983, Adam 1990, Álvarez-Rogel et al. 1997). Thus, salinity has neither a strictly positive nor negative correlation, but a complex relationship with elevation (Adam 1990). At Long Point, there was a clear decreasing soil EC gradient across the saltmarsh zone, which also decreased from summer to winter. EC values for the ASS(a and b) groups were similar (p < 0.05), however that of the ARS group was significantly lower in both seasons. The three groups each recorded lower winter EC readings compared to that of summer following heavy rainfall in July 2013. Sodium (Na+) levels reported by Richardson & Mulcahy (1996) also declined progressively from the seaward side towards the woodland zone.
Clear patterns in pH values were difficult to determine at Long Point. The means for ASS(a) and ARS were more closely aligned for both summer and winter, with a pH value of 5.1 each in summer, increasing slightly to pH 5.4 and 5.3 respectively during winter. In the ASS(b) group, the means for both summer and winter were lower (summer) and higher (winter) than in the other saltmarsh groups, being pH 4.3 and 6.1 respectively. However, there was a significant change (p < 0.05) from the saline grasslands to the adjacent woodland zone.
Levels of organic matter in saltmarsh soils are variable, but typically contents of 8% in the lower marsh, 13% in the middle marsh to 25% in the upper marsh have been reported (Long & Mason 1983). Levels of up to 50% have been recorded in some North American marshes (Adam 1990). There was a consistent pattern of SOM at Long Point. The highest levels were recorded in ASS(a) (37.7±3.5%), followed by decreasing levels in ASS(b) (23.1±3.7%), to ARS (14.9±2.2%) with the transition from saltmarsh to the woodland zone marked by a dramatic
FIG. 5 — USDA/FAO soil texture triangle with data for clay, silt and sand plotted by vegetation group (marked in blue). Soil classifications: ASS_a = Clay; ASS_b = Sandy clay loam; ARS = Sandy loam; GSL, GPL_sr and GPL_dr = Loamy sand. Codes ASS_a, ASS_b and ARS are saltmarsh communities; GSL, GPL_sr and GPL_dr are woodland communities which are clustered in the lower left hand corner of the diagram.
72 John Aalders, Peter McQuillan and Vishnu Prahalad
fall in SOM to 4.7±1.0%. A study at Westernport Bay (Victoria, Australia) on a site of Sclerostegia (now Tecticornia) arbuscula and S. quinqueflora, similar to ASS(a and b) in this study, estimated values of 50–60% for soil organic matter (Van Der Valk & Attiwill 1983). This value is higher than those recorded at Long Point; however, it does support the notion that the low/middle marsh has a high level of organic matter, which is possibly dependent on the vegetation make-up of the individual zones.
CONCLUSIONS
The most conspicuous characteristic of the saltmarsh area was the distinctive assemblage of plants within each vegetation community and their clear delineation. This facilitated the classification of the saltmarsh into three zones — lower, middle and upper — as widely recognised elsewhere. The composition of the vegetation communities changes with an increase in elevation. The low marsh is a low-diversity community made up of one to three succulent species, whilst the middle marsh community is made up of three or more species, often a blend of succulents from the lower marsh with grasses from the upper marsh, and the upper marsh community is made up of a larger number of species, principally saline graminoids. However, strict species fidelity to certain zones was not evident. Many species can tolerate a range of soil moisture and salinity: Sarcocornia spp. and D. crassifolium have colonised areas in all three zones. Some saltmarsh species have broadly overlapping salinity tolerance ranges as is evident from the field (Clarke & Hannon 1970, Kirkpatrick & Glasby 1981, Silvestri et al. 2005) and in the laboratory (Snow & Vince 1984). Yet saltmarsh zonation, particularly at Long Point, is well-defined. Perhaps complementary roles of tolerance to physical conditions such as moisture and salinity at one end of the gradient, and between-species competition where more species survive at the other end could be the key driver (Snow & Vince 1984, Pennings & Callaway 1992). This knowledge of how edaphic factors relate to coastal saltmarsh vegetation communities and their physical tolerance ranges is useful in the context of the threatened status of saltmarshes and the need for monitoring and recovery actions.
ACKNOWLEDGEMENTS
We thank Denna Kingdom from the Tasmanian Land Conservancy for facilitating use of the Long Point Reserve to carry out this study. Our thanks to John and Jane Cotton for access to the research site through their property. Stuart MacDonald, Colin Sumner, Ross Lucas, Jon Traynor, Christian Mackay and Mel Bottrill gave valuable assistance in the field. Jamie Kirkpatrick assisted with identification of vegetation species. Rob Anders contributed technical assistance with real time GPS survey. Two reviewers provided valuable comments.
REFERENCES
Adam, P. 1990: Saltmarsh Ecology. Cambridge University Press, Cambridge: 461 pp.
Adam, P. 2002: Saltmarshes in a time of change. Environmental Conservation 29: 39–61.
Adam, P. 2009: Australian saltmarshes in a global context. In Saintilan, N. (ed): Australian Saltmarsh Ecology. CSIRO Publishing, Collingwood: 1–21.
Álvarez-Rogel, J., Hernández, J., Ortiz-Silla, R. & Alcaraz-Ariza, F. 1997: Patterns of spatial and temporal variations in soil salinity: Example of a salt marsh in a semiarid climate. Arid Soil Research and Rehabilitation 11: 315–329.
Álvarez-Rogel, J., Alcaraz-Ariza, F. & Ortiz-Silla, R. 2000: Soil salinity and moisture gradients and plant zonation in Mediterranean salt marshes of Southeast Spain. Wetlands 20: 357–372.
Anisfeld, S.C. 2012: Biogeochemical responses to tidal restoration. In Roman, C.T. & Burdick, D.M (eds): Tidal Marsh Restoration. Island Press, Washington: 39–58.
Bockelmann, A.C., Bakker, J.P., Neuhaus, R. & Lage, J. 2002: The relation between vegetation zonation, elevation and inundation frequency in a Wadden Sea salt marsh. Aquatic Botany 73: 211–221.
Boon, P.I., Allen, T., Carr, G., Frood, D., Harty, C., Mcmahon, A., Mathews, S., Rosengren, N., Sinclair, S., White, M. & Yugovic, J. 2015: Coastal wetlands of Victoria, south-eastern Australia: providing the inventory and condition information needed for their effective management and conservation. Aquatic Conservation: Marine and Freshwater Ecosystems 25: 454–479.
Bridgewater, P. & Cresswell, I. 1999: Biogeography of mangrove and saltmarsh vegetation: implications for conservation and management in Australia. Mangroves and Salt Marshes 3: 117–125.
Bridgewater, P. & Cresswell, I. 2003: Identifying biogeographic patterns in Australian saltmarsh and mangal systems: a phytogeographic analysis. Phytocoenologia 33: 231–250.
Burden, A., Garbutt, R.A., Evans, C.D., Jones, D.L. & Cooper, D.M. 2013: Carbon sequestration and biogeochemical cycling in a saltmarsh subject to coastal managed realignment. Estuarine, Coastal and Shelf Science 120: 12–20.
Chapman, V.J. 1974: Salt Marshes and Salt Deserts of the World, second edition. Cramer, Lehre: 392 pp.
Clarke, L.D. & Hannon, N.J. 1967: The mangrove swamp and salt marsh communities of the Sydney district: I. Vegetation, soils and climate. Journal of Ecology 55: 753–771.
Clarke, L.D. & Hannon, N.J. 1969: The mangrove swamp and salt marsh communities of the Sydney district: II. The Holocoenotic complex with particular reference to physiography. Journal of Ecology 57: 213–234.
Clarke, L.D. & Hannon, N.J. 1970: The mangrove swamp and salt marsh communities of the Sydney district: III. Plant growth in relation to salinity and waterlogging. Journal of Ecology 58: 351–369.
Curtis, W. & Somerville, J. 1947: Boomer Marsh–a preliminary botanical and historical survey. Papers and Proceedings of the Royal Society of Tasmania 81: 151–157.
Davis, L.V. & Gray, I.E. 1966: Zonal and seasonal distribution of insects in North Carolina salt marshes. Ecological Monographs 36: 275–295.
Day, P.R. 1965: Particle fractionation and particle size analysis. In Black, C.A. (ed): Methods of Soil Analysis: Part 1: Physical and Mineralogical Properties, including Statisics of Measurement and Sampling. American Society of Agronomy, Madison: 545–566.
De Cáceres, M. 2013: How to use the indicspecies package (ver. 1.7.1). Centre Tecnològic Forestal de Catalunya, Catalonia, Spain: 29 pp.
73Vegetation communities and edaphic relationships in eastern Tasmania
de Salas, M.F. & Baker, M.L. 2018: A Census of the Vascular Plants of Tasmania, including Macquarie Island. Tasmanian Herbarium, Tasmanian Museum and Art Gallery, Hobart: 156 pp.
Department of Primary Industries, Parks, Water and Environment 2014: The LIST Maps, http://maps.thelist.tas.gov.au/listmap/app/list/map (accessed 23 March 2014).
Fairweather, P.G. 1990: Ecological changes due to our use of the coast: research needs versus effort. Proceedings of the Ecological Society of Australia 16: 71–77.
Gouldthorpe, J.J. 2000: The Effects of Drainage and Grazing on Saltmarsh Environments on South-east Tasmania. Unpublished BSc (Honours) thesis, School of Geography and Environmental Studies, University of Tasmania, Hobart.
Guiler, E.R. 1949: The intertidal ecology of Tasmania. Papers and Proceedings of the Royal Society of Tasmania 83: 135–201.
Guiler, E.R. 1952: The nature of intertidal zonation in Tasmania. Papers and Proceedings of the Royal Society of Tasmania 86: 31–62.
Harris, P., Heap, A., Bryce, S., Porter-Smith, R., Ryan, D. & Heggie, D. 2002: Classification of Australian clastic coastal depositional environments based upon a quantitative analysis of wave, tidal, and river power. Journal of Sedimentary Research 72: 858–870.
Harris, S. & Kitchener, A. 2005: From Forest to Fjaeldmark: Descriptions of Tasmania’s Vegetation. Department of Primary Industries, Parks, Water and Environment, Hobart: 432 pp.
Hazelton, P.A. & Murphy, B.W. 2007: Interpreting Soil Test Results: What Do All The Numbers Mean? CSIRO Publishing, Collingwood: 152 pp.
Heap, A.D., Bryce, S. & Ryan, D.A. 2004: Facies evolution of Holocene estuaries and deltas: a large-sample statistical study from Australia. Sedimentary Geology 168: 1–17.
Huckle, J.M., Potter, J.A. & Marrs, R.H. 2000: Influence of environmental factors on the growth and interactions between salt marsh plants: effects of salinity, sediment and waterlogging. Journal of Ecology 88: 492–505.
Kelleway, J.J., Saintilan, N., Macreadie, P.I. & Ralph, P.J. 2016: Sedimentary factors are key predictors of carbon storage in SE Australian saltmarshes. Ecosystems 19: 865–880.
Kiernan, K. 2013: A Preliminary Intrepretation of Landscape Evolution at Long Point (Tasmania). Unpublished report to the School of Geography and Environmental Studies, University of Tasmania, Hobart: 3 pp.
Kingdom, D. 2008: Long Point Moulting Lagoon, Swansea: Reserve Management Plan. Unpublished report to the Tasmanian Land Conservancy, Lower Sandy Bay: 52 pp.
Kirkpatrick, J.B. & Glasby, J. 1981: Salt Marshes in Tasmania: Distribution, Community Composition and Conservation. Department of Geography, University of Tasmania, Hobart: 65 pp.
Landi, M. & Angiolini, C. 2015: Soil-plant relationships in Mediterranean salt marshes across dune-cultivated land gradient. Journal of Coastal Research 31: 588–594.
Long, S.P. & Mason, C.F. 1983: Saltmarsh Ecology. Blackie & Sons, Glasgow: 160 pp.
Loveland, P.J. & Whalley, W.R. 2000: Particle size analysis. In Smith, K.A. & Mullins, C.E. (eds): Soil and Environmental Analysis. Marcel Dekker, New York: 281–314.
Minasny, B. & McBratney, A.B. 2001: The Australian soil texture boomerang: a comparison of the Australian and USDA/FAO soil particle-size classification systems. Australian Journal of Soil Research 39: 1443–1451.
Moeys, J. 2014: The Soil Texture Wizard: R Functions for Plotting, Classifying, Transforming and Exploring Soil Texture Data, https://cran.r-project.org/web/packages/soiltexture/soiltexture.pdf (accessed 30 June 2014).
Moore, P.D. & Chapman, S.B. 1986: Methods in plant ecology. In Goldsmith, F.B., Harrison, C.M. & Morton, A.J. (eds):
Description and Analysis of Vegetation, second edition. Blackwell Scientific Publications, Oxford: 437–524.
Mount, R.E., Prahalad, V.N., Sharples, C., Tilden, J., Morrison, B., Lacey, M., Ellison, J., Helman, J. & Newton, J. 2010: Circular Head Coastal Foreshore Habitats: Sea Level Rise Vulnerability Assessment: Final Project. Unpublished report to Cradle Coast NRM. Blue Wren Group, School of Geography and Environmental Studies, University of Tasmania, Hobart: 221 pp.
Mueller-Dombois, D. & Ellenberg, H. 1974: Aims and Methods of Vegetation Ecology. John Wiley & Sons, New York: 547 pp.
Oksanen, J. 2013: Multivariate Analysis of Ecological Communities in R: Vegan Tutorial, http://cc.oulu.fi/~jarioksa/opetus/metodi/vegantutor.pdf (accessed 21 July 2014).
Pennings, S.C. & Callaway, R.M. 1992: Salt marsh plant zonation: the relative importance of competition and physical factors. Ecology 73: 681–690.
Prahalad, V.N. & Kriwoken, L.K. 2010: Implementation of the Ramsar Convention on Wetlands in Tasmania, Australia. Journal of International Wildlife Law and Policy 13: 205–239.
Prahalad, V. & Kirkpatrick, J.B. 2019: Saltmarsh conservation through inventory, biogeographic analysis and predictions of change: case of Tasmania, south-eastern Australia. Aquatic Conservation: Marine and Freshwater Ecosystems 29: 717–731.
Prahalad, V.N., Kirkpatrick, J.B. & Mount, R.E. 2011: Tasmanian coastal saltmarsh community transitions associated with climate change and relative sea level rise 1975–2009. Australian Journal of Botany 59: 741–748.
Prahalad, V., Sharples, C., Kirkpatrick, J. & Mount, R. 2015: Is wind-wave fetch exposure related to soft shoreline change in swell-sheltered situations with low terrestrial sediment input? Journal of Coastal Conservation 19: 23–33.
Rayment, G.E. & Lyons, D.J. 2011: Soil Chemical Methods – Australasia. CSIRO Publishing, Collingwood: 495 pp.
Richardson, A.M.M. & Mulcahy, M.E. 1996: The distribution of talitrid amphipods (Crustacea) on a salt marsh in Southern Tasmania, in relation to vegetation and substratum. Estuarine, Coastal and Shelf Science 43: 801–817.
Richardson, A.M.M., Swain, R. & Wong, V. 1997: The crustacean and molluscan fauna of Tasmanian saltmarshes. Papers and Proceedings of Royal Society of Tasmania 131: 21–30.
Richardson, A.M.M., Swain, R. & Wong, V. 1998: Relationship between the crustacean and molluscan assemblages of Tasmanian saltmarshes and the vegetation and soil conditions. Marine and Freshwater Research 49: 785–799.
Rogers, K., Saintilan, N., Howe, A.J. & Rodríguez, J.F. 2013: Sedimentation, elevation and marsh evolution in a southeastern Australian estuary during changing climatic conditions. Estuarine, Coastal and Shelf Science 133: 172–181.
Saintilan, N. 2009a: Biogeography of Australian saltmarsh plants. Austral Ecology 34: 929–937.
Saintilan, N. 2009b: Distribution of Australian saltmarsh plants. In Saintilan, N. (ed): Australian Saltmarsh Ecology. CSIRO Publishing, Collingwood: 23–39.
Saintilan, N. & Adam, P. 2009: Preface. In Saintilan, N. (ed): Australian Saltmarsh Ecology. CSIRO Publishing, Collingwood: ix–xi.
Sánchez, J., Izco, J. & Medrano, M. 1996: Relationships between vegetation zonation and altitude in a salt-marsh system in northwest Spain. Journal of Vegetation Science 7: 695–702.
Silvestri, S., Defina, A. & Marani, M. 2005: Tidal regime, salinity and salt marsh plant zonation. Estuarine, Coastal and Shelf Science 62: 119–130.
Snow, A.A. & Vince, S.W. 1984: Plant zonation in an Alaskan salt marsh: II. An experimental study of the role of edaphic conditions. Journal of Ecology 72: 669–684.
Sur, H. & Kukal, S. 1992: A modified hydrometer procedure for particle size analysis. Soil Science 153: 1–4.

74 John Aalders, Peter McQuillan and Vishnu Prahalad
Threatened Species Scientific Committee 2013: Subtropical and Temperate Coastal Saltmarsh Conservation Advice. Department of Sustainability, Environment, Water, Population and Communities, Canberra: 92 pp.
Van Der Valk, A.G. & Attiwill, P.M. 1983: Above- and below-ground litter decomposition in an Australian salt marsh, Australian Journal of Ecology 8: 441–447.
Vince, S.W. & Snow, A.A. 1984: Plant zonation in an Alaskan salt marsh: I. Distribution, abundance and environmental factors. Journal of Ecology 72: 651–667.
Wildi, O. 2013: Data Analysis in Vegetation Ecology, second edition. John Wiley & Sons, Chichester: 330 pp.
Wong, V., Richardson, A.M.M. & Swain, R. 1993: The Crustaceans and Molluscs of Tasmanian Saltmarshes. Zoology Department, University of Tasmania: 95 pp.
(accepted 11 November 2019)