vehicle-based detection of changes in bridge condition · the bridge deflection test facility...
TRANSCRIPT

© AREMA 2015 1
Vehicle-Based Detection of Changes in Bridge Condition
Anna M. Rakoczy, Ph.D. Transportation Technology Center, Inc.
55500 DOT Rd Pueblo, CO 81001
Telephone: 719-584-0782
Duane Otter, Ph.D., P.E. Transportation Technology Center, Inc.
55500 DOT Rd Pueblo, CO 81001
Telephone: 719-584-0594
Word Count: 7,250
ABSTRACT
Transportation Technology Center, Inc. is investigating the feasibility of using vehicle-based systems to detect changes in bridge condition. A single vehicle-based system offers the potential to assist with the inspection of hundreds or thousands of railroad bridges, as opposed to a structural health monitoring system that is captive to a single structure. The paper describes development work and a series of tests using various existing track inspection vehicles in an attempt to detect weak stringers and pier elevation changes in short-span trestle bridges. Initial exploratory testing was performed in revenue service. Developmental testing was performed at the Bridge Deflection Test Facility (BDTF) at the Transportation Technology Center, which provides adjustable bridge strength and geometry conditions. The BDTF facilitates evaluation, development, and calibration of onboard systems for detection of bridge anomalies.
Pilot testing using the Association of American Railroads’ Track Loading Vehicle demonstrated the feasibility of the concept. Recent work includes testing of several additional existing systems including track geometry cars, track modulus and deflection systems, and an accelerometer-equipped instrumented freight car. The results of the testing indicate the following preliminary conclusions:
All three types of systems (geometry, deflection, acceleration-based) are capable of detecting changes in pier elevations.
Track geometry cars vary in their ability to detect weak stringers and weak spans, depending on weight and axle spacing.
The track deflection systems distinguished weaker spans during the test.
For all systems, historical data from past runs is recommended for comparison and trending.
1. INTRODUCTION
In an effort to provide better indications of bridges in need of maintenance or more detailed inspection, Transportation Technology Center, Inc. (TTCI) has been investigating the potential for using onboard technology to detect bridge impairment or changes in bridge behavior. The motivations for developing such a technology are twofold. First, bridges often show behavior under dynamic train loading that is difficult to observe otherwise. Second, an onboard system has the potential to provide observations for hundreds of bridges, as opposed to a structural health monitoring system that is fixed and capable of monitoring only a single bridge during a short period.
In recent years, several railroad industry bridge experts have noted that the location of bridges and/or bridge approaches can sometimes be observed in onboard data, such as track geometry measurements. Various onboard methods have been proposed to measure bridge response. This study investigated the potential use of existing onboard systems to detect bridge defects or significant changes in track support conditions provided by a bridge, focusing on the short span trestle type bridge. Short span trestle bridges built with steel, concrete, or timber spans are common railway bridges in North America. The research focused on detecting weak bridge stringers and changes in pier elevations in short trestle bridges (1, 2).
2. EARLY REVENUE SERVICE TESTING
Research into this topic began with TTCI working in conjunction with BNSF Railway. BNSF provided to TTCI a variety of information for selected lines including track geometry, locomotive vehicle-track interaction (VTI) exceptions, and GPS coordinates of bridges. In addition, the TTCI instrumented freight

© AREMA 2015 2
car and Track Loading Vehicle (TLV) were run over selected lines. The most promising data came from the TLV.
The TLV data showed vertical displacement signatures with wavelengths corresponding to the 14-foot span length of many short span trestles. However, without wayside measurements and a full characterization of each structure, it was difficult to determine exactly what the responses indicated. It became apparent that to continue this work further, an adjustable bridge structure was needed to provide ground truthing, calibration, and evaluation capabilities for vehicles that might provide onboard detection for changes in bridge condition. This led to the design and construction of just such a bridge at the Transportation Technology Center (TTC) near Pueblo, Colorado.
3. BRIDGE DEFLECTION TEST FACILITY DESIGN AND CONSTRUCTION
The Bridge Deflection Test Facility (BDTF) was designed based on an open-deck T-rail or rail stringer bridge. TTCI engineers in conjunction with BNSF engineers began with a standard plan once used by the Atchison Topeka & Santa Fe Railway. The plan was modified so that all the rail stringer spans were simple spans rather than semi-continuous, because the behavior of the test bridge would likely be easier to predict and control. For similar reasons, it was determined that an open-deck rather than a ballast deck would be preferable. Adjustable geometry is provided by custom shims which support only selected rails at each pier cap (Figure 1). In its nominal condition, all six stringers of a chord are supported. To simulate a stringer in weakened condition, only three of the stringers are supported by 1-inch shims at each end. The remaining three stringers will only be engaged if the deflection exceeds 1 inch.
FIGURE 1. Illustrations of BDTF Normal Conditions (top) and Weakened Condition (bottom)
The BDTF is a 42-foot, 3-span, T-rail trestle. It can also be configured to provide variable pier geometries by using shims. The BDTF was constructed using re-purposed materials such as second-hand 136 RE rail as stringers, and precast concrete guideway panels as foundation elements. The BDTF is located on a lightly used section of track, so it is not subjected to high levels of degradation as might be experienced at the Facility for Accelerated Service Testing. By installing the BDTF on a lightly used section of track, the bridge conditions should remain nearly constant for years of use as a calibration and evaluation facility.
4. TLV FEASIBILITY TESTING
In 2012, TTCI performed tests with several onboard systems at the BDTF at the TTC. Three vehicles with onboard measurement systems were operated over the BDTF to determine their feasibility for use in onboard bridge condition assessment. The data was gathered using the following systems:
• Instrumented locomotive (The instrumented locomotive is equipped with a sensor package that is intended to monitor vehicle-track interaction conditions. It is primarily an accelerometer-based system, similar to those used in revenue service, but capable of reporting full-time rather than only for exceptions.)
• Instrumented freight car (The instrumented freight car is equipped with a sensor package similar to that on the locomotive.)
• TLV dynamic track deflection measurement system • Track geometry system (mounted on TLV)
© AREMA 2015 3
The instrumented locomotive and instrumented freight car measurements were primarily acceleration-based measurements, which have proven valuable in finding relatively short wavelength defects, especially related to rail surface conditions. These systems are relatively low cost, rugged, and have the potential to provide high availability and wide coverage. The TLV used vertical loading to provide measurements related to track deflection and stiffness under various loads. The TLV track geometry system provided the measurements of track surface, alignment, cross level, gage, and related parameters.
In summary, the TLV track geometry data provided a good indication of low bridge approaches and a slight indication of a weakened stringer. The deflection measurement by the TLV under a center truck load of 40 kips per wheel clearly and correctly identified weak bridge stringers. This testing demonstrated that it is indeed possible to detect some bridge deficiencies using vehicle-based detection systems. The rail surface measurement from the track geometry system was able to identify low bridge approaches and changes in track surface over a bridge. Both deflection measurements under load, as well as some track geometry parameters, appeared to be valuable components of an onboard bridge impairment detection system.
5. RECENT TESTING
In 2014, several additional systems were tested: a track deflection measuring system and track geometry on Federal Railroad Administration’s (FRA) DOTX 218 (also called T-18) test vehicle, a track geometry on a lightweight passenger car, an accelerometer-equipped instrumented freight car (3, 4), and a track deflection measuring system on a conventional hopper car (5, 6).
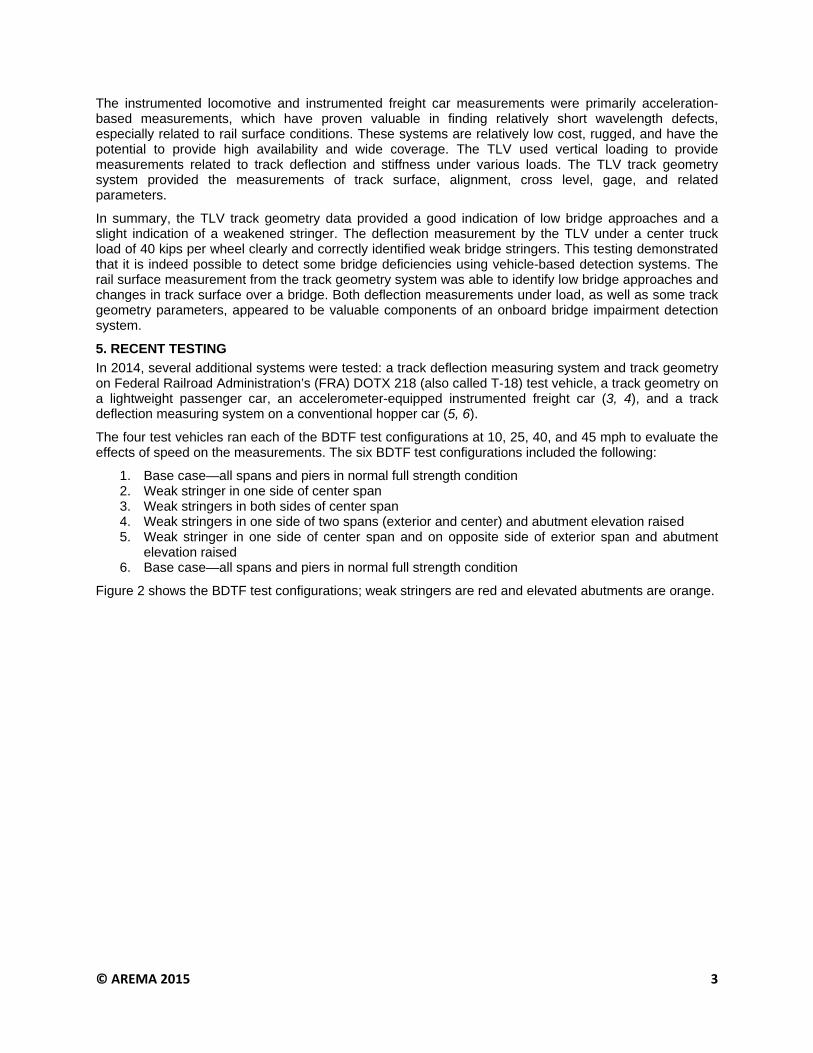
The four test vehicles ran each of the BDTF test configurations at 10, 25, 40, and 45 mph to evaluate the effects of speed on the measurements. The six BDTF test configurations included the following:
1. Base case—all spans and piers in normal full strength condition 2. Weak stringer in one side of center span 3. Weak stringers in both sides of center span 4. Weak stringers in one side of two spans (exterior and center) and abutment elevation raised 5. Weak stringer in one side of center span and on opposite side of exterior span and abutment
elevation raised 6. Base case—all spans and piers in normal full strength condition
Figure 2 shows the BDTF test configurations; weak stringers are red and elevated abutments are orange.
© AREMA 2015 4
FIGURE 2. Illustrations of BDTF Test Conditions
5.1 Recent Testing – Track Deflection Measuring System
Testing on BDTF with T-18
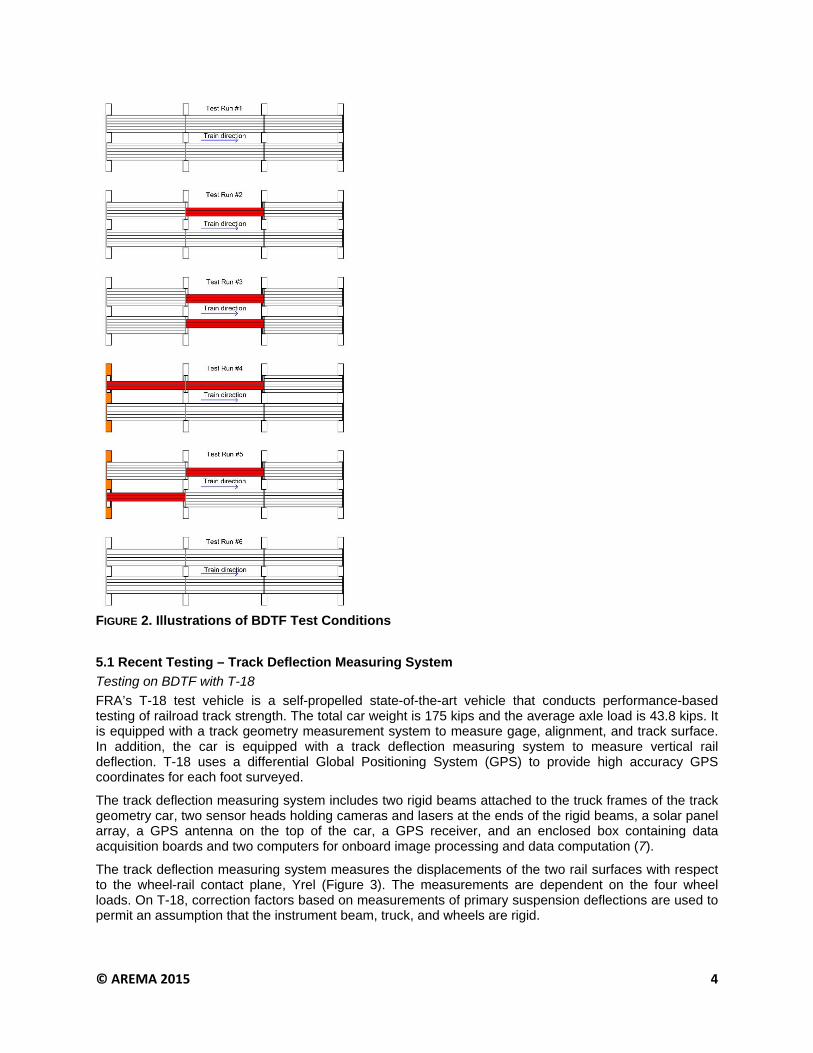
FRA’s T-18 test vehicle is a self-propelled state-of-the-art vehicle that conducts performance-based testing of railroad track strength. The total car weight is 175 kips and the average axle load is 43.8 kips. It is equipped with a track geometry measurement system to measure gage, alignment, and track surface. In addition, the car is equipped with a track deflection measuring system to measure vertical rail deflection. T-18 uses a differential Global Positioning System (GPS) to provide high accuracy GPS coordinates for each foot surveyed.
The track deflection measuring system includes two rigid beams attached to the truck frames of the track geometry car, two sensor heads holding cameras and lasers at the ends of the rigid beams, a solar panel array, a GPS antenna on the top of the car, a GPS receiver, and an enclosed box containing data acquisition boards and two computers for onboard image processing and data computation (7).
The track deflection measuring system measures the displacements of the two rail surfaces with respect to the wheel-rail contact plane, Yrel (Figure 3). The measurements are dependent on the four wheel loads. On T-18, correction factors based on measurements of primary suspension deflections are used to permit an assumption that the instrument beam, truck, and wheels are rigid.
© AREMA 2015 5
FIGURE 3. Scheme of Track Deflection Measuring System Measurements (8)
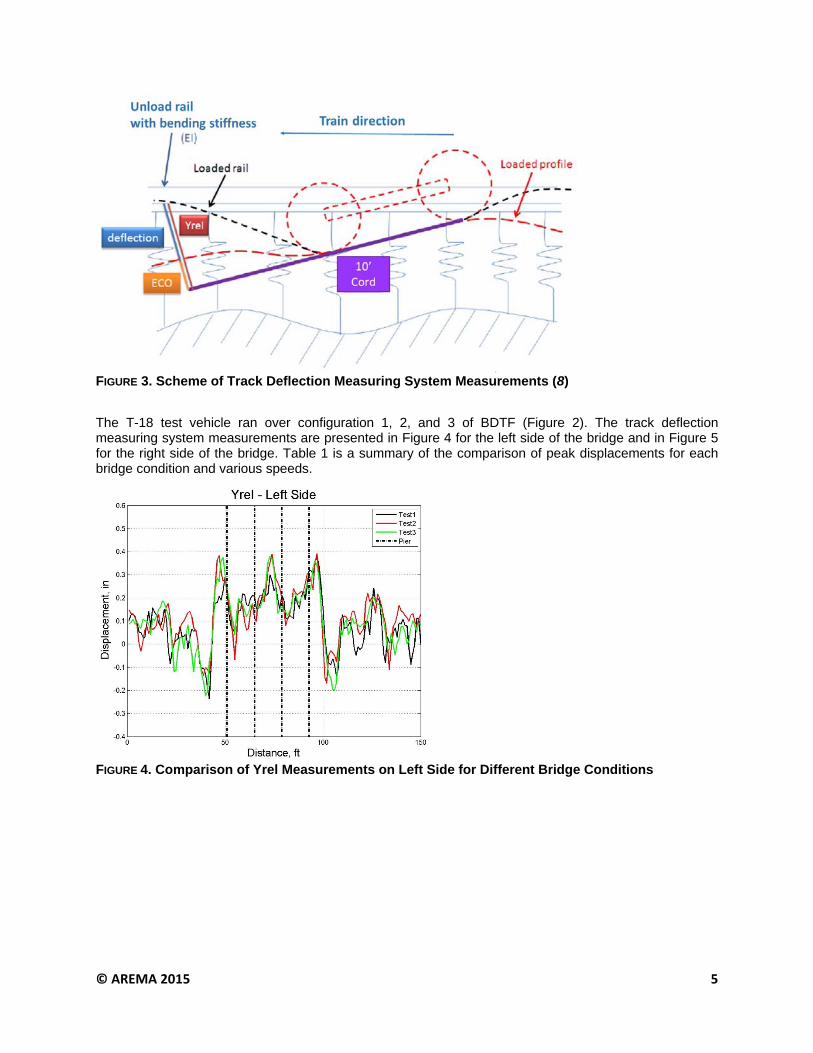
The T-18 test vehicle ran over configuration 1, 2, and 3 of BDTF (Figure 2). The track deflection measuring system measurements are presented in Figure 4 for the left side of the bridge and in Figure 5 for the right side of the bridge. Table 1 is a summary of the comparison of peak displacements for each bridge condition and various speeds.
FIGURE 4. Comparison of Yrel Measurements on Left Side for Different Bridge Conditions
© AREMA 2015 6
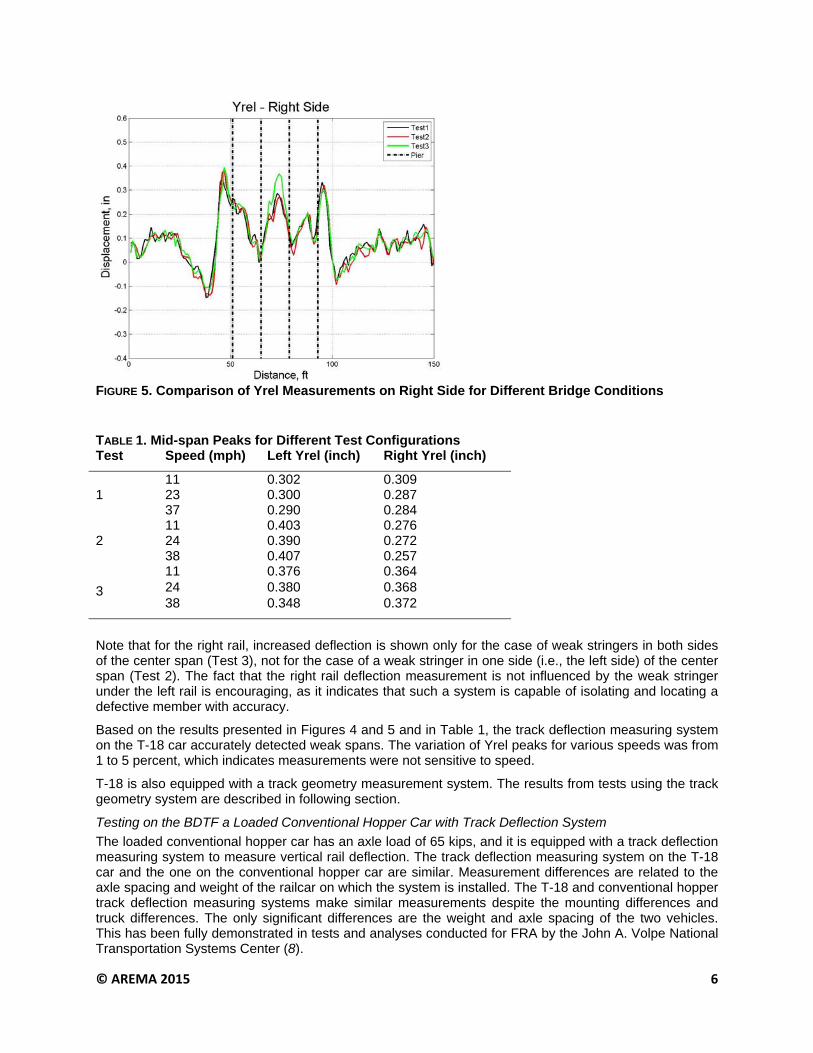
FIGURE 5. Comparison of Yrel Measurements on Right Side for Different Bridge Conditions
TABLE 1. Mid-span Peaks for Different Test Configurations Test Speed (mph) Left Yrel (inch) Right Yrel (inch)
1 11 0.302 0.309 23 0.300 0.287 37 0.290 0.284
2 11 0.403 0.276 24 0.390 0.272 38 0.407 0.257
3
11 0.376 0.364 24 0.380 0.368 38 0.348 0.372
Note that for the right rail, increased deflection is shown only for the case of weak stringers in both sides of the center span (Test 3), not for the case of a weak stringer in one side (i.e., the left side) of the center span (Test 2). The fact that the right rail deflection measurement is not influenced by the weak stringer under the left rail is encouraging, as it indicates that such a system is capable of isolating and locating a defective member with accuracy.
Based on the results presented in Figures 4 and 5 and in Table 1, the track deflection measuring system on the T-18 car accurately detected weak spans. The variation of Yrel peaks for various speeds was from 1 to 5 percent, which indicates measurements were not sensitive to speed.
T-18 is also equipped with a track geometry measurement system. The results from tests using the track geometry system are described in following section.
Testing on the BDTF a Loaded Conventional Hopper Car with Track Deflection System
The loaded conventional hopper car has an axle load of 65 kips, and it is equipped with a track deflection measuring system to measure vertical rail deflection. The track deflection measuring system on the T-18 car and the one on the conventional hopper car are similar. Measurement differences are related to the axle spacing and weight of the railcar on which the system is installed. The T-18 and conventional hopper track deflection measuring systems make similar measurements despite the mounting differences and truck differences. The only significant differences are the weight and axle spacing of the two vehicles. This has been fully demonstrated in tests and analyses conducted for FRA by the John A. Volpe National Transportation Systems Center (8).

© AREMA 2015 7
Figure 6 shows vertical rail deflection (Yrel measurements) from the left side of the system and Figure 7 shows measurements from the right side of the system.
FIGURE 6. Yrel Measurements on Left Side for Different Bridge Conditions
FIGURE 7. Yrel Measurements on Right Side for Different Bridge Conditions
Both figures show variation between different test conditions. During Tests 4 and 5, the approaches of the bridge and the support conditions are different than the base case (Test 6). Also, for the right middle span, the increased deflection is shown only for the case of weak stringer on both sides (Test 3), but on the left middle span, all cases have increased deflection except the base condition (Test 6).
The variations of maximum deflection are presented in Figure 8 for the left spans and Figure 9 for the right spans. For both figures, the peaks on span 3 are constant over all test cases. Span 2 on the left side has larger peaks for all cases besides the base condition, whereas on the right side only Test 3 has a larger deflection. Span 1 on the left side has larger peaks for Tests 4 and 5, whereas on the right side the difference is not very clear. The influence of bad approach and support conditions on the abutment definitely affects the deflection of the first span.

© AREMA 2015 8
At higher speeds the freight-car-mounted track deflection measuring system can still detect weak stringers, but the conditions are less distinguishable. The accuracy may be related to the sample rates or to the dynamic interaction between the car and the bridge. Therefore, lower speeds are recommended for detecting bridge impairment conditions with the track deflection measuring system on the conventional hopper car.
FIGURE 8. Comparison of Span-Peaks Based on the Yrel Measurements on Left Side for Different Bridge Conditions
FIGURE 9. Comparison of Span-Peaks Based on the Yrel Measurements on Right Side for Different Bridge Conditions
5.2 Recent Testing – Track Geometry Systems
Testing on BDTF with T-18
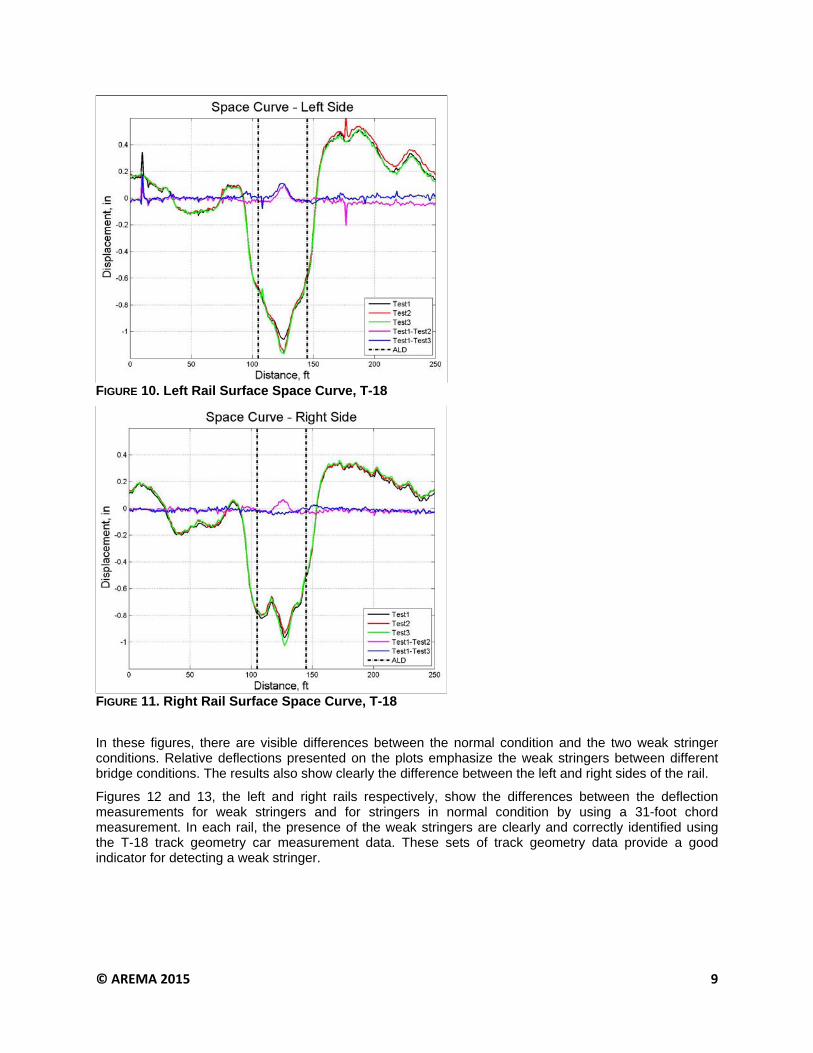
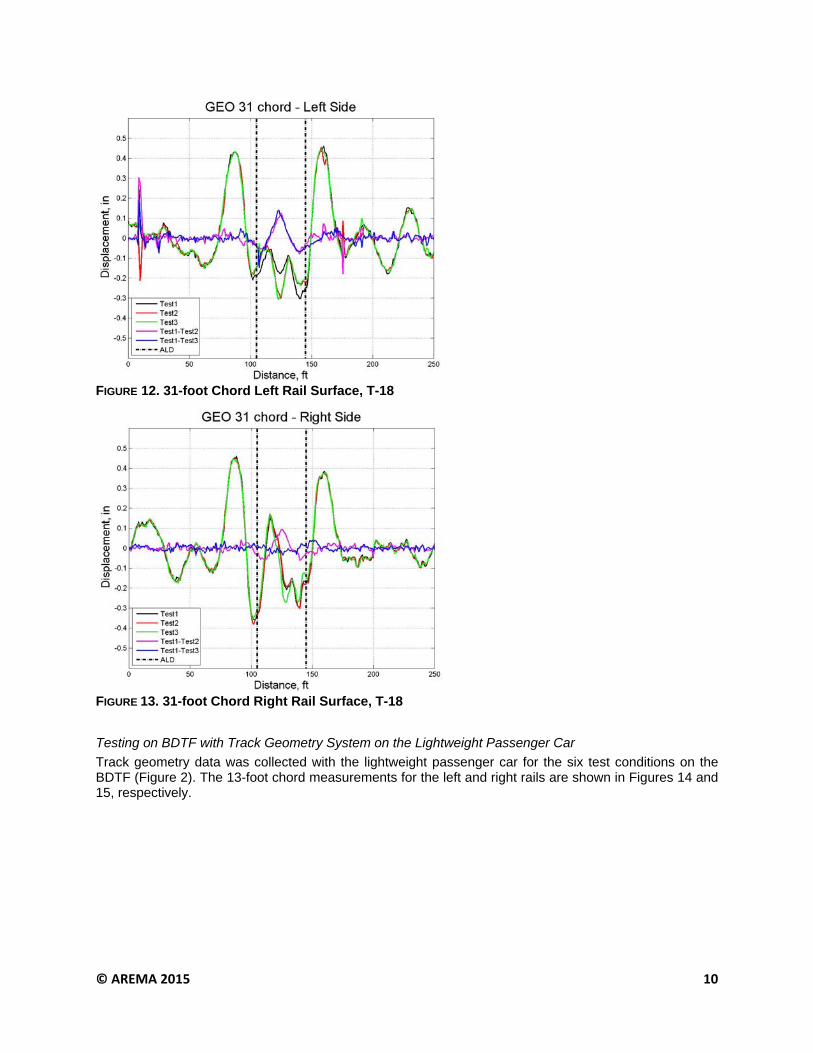
Using the T-18, track geometry data was collected for the first three test conditions on the BDTF. The rail surface space curve measurements for the left and right rails are shown in Figures 10 and 11, respectively. The surface data shows the location of the test bridge and the low approaches.
0
0.1
0.2
0.3
0.4
0.5
Span #1 Span #2 Span #3
[in]
Left side - 25 mph
Test #2 Test #3 Test #4 Test #5 Test #6
0
0.1
0.2
0.3
0.4
0.5
Span #1 Span #2 Span #3
[in]
Right side -25 mph
Test #2 Test #3 Test #4 Test #5 Test #6
© AREMA 2015 9
FIGURE 10. Left Rail Surface Space Curve, T-18
FIGURE 11. Right Rail Surface Space Curve, T-18
In these figures, there are visible differences between the normal condition and the two weak stringer conditions. Relative deflections presented on the plots emphasize the weak stringers between different bridge conditions. The results also show clearly the difference between the left and right sides of the rail.
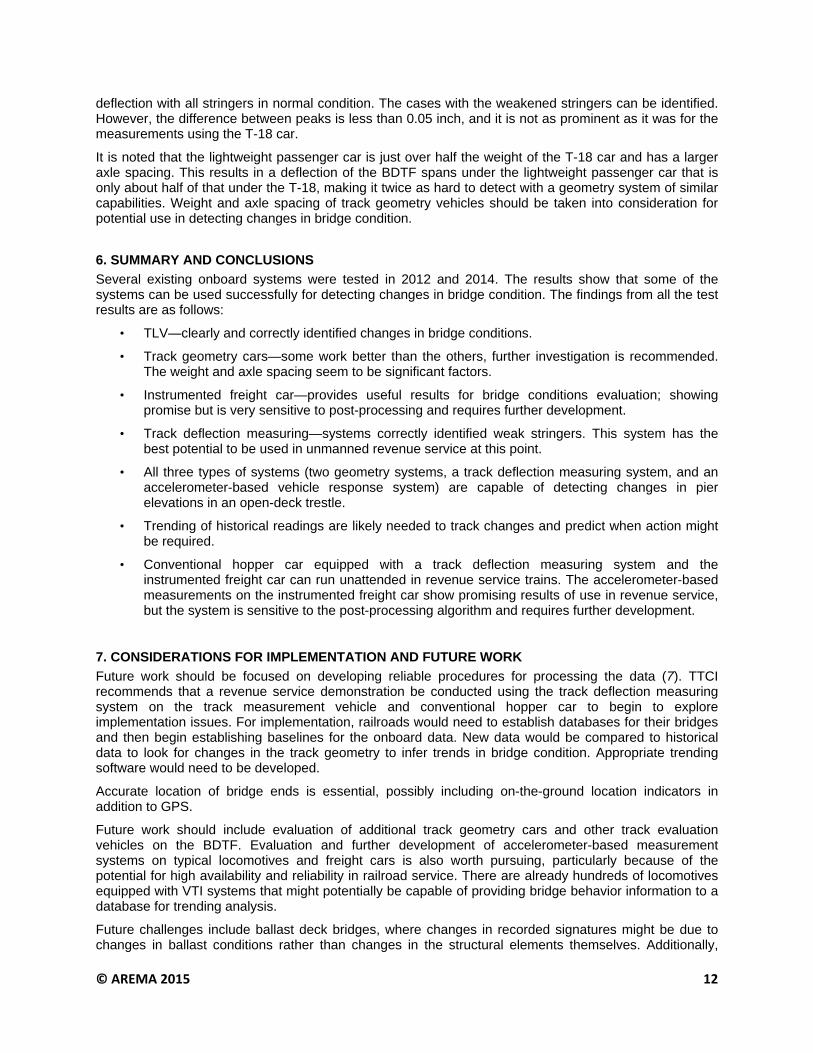
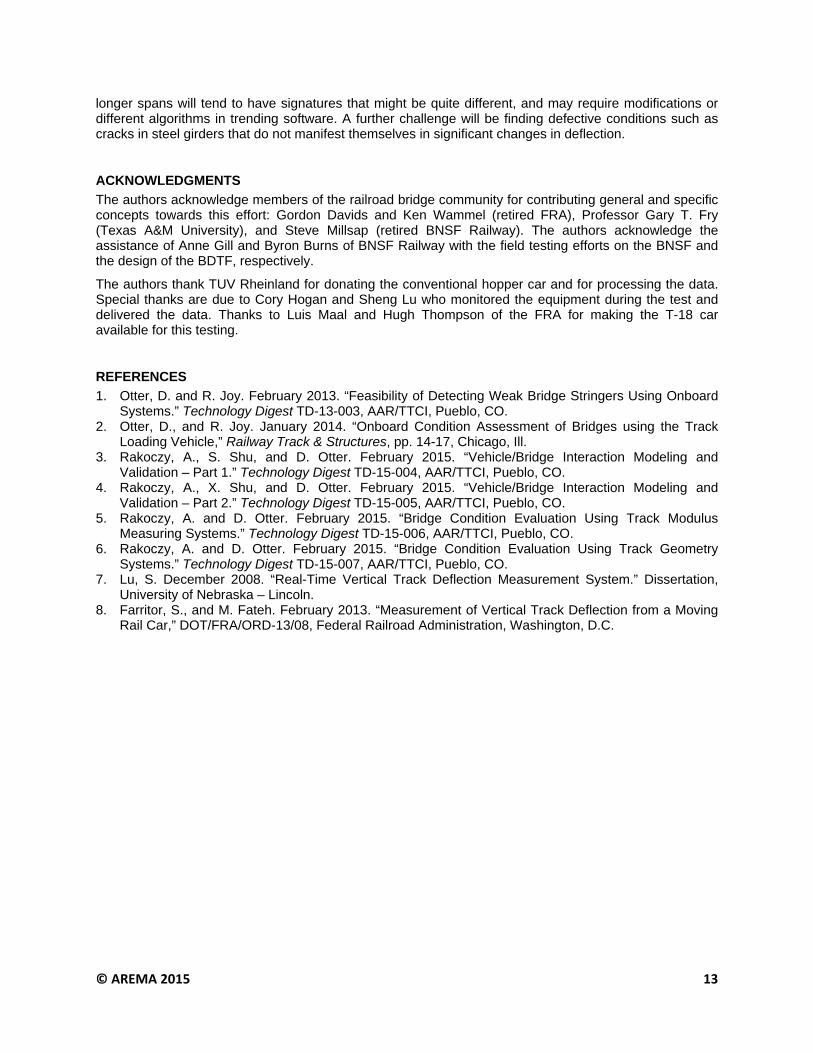
Figures 12 and 13, the left and right rails respectively, show the differences between the deflection measurements for weak stringers and for stringers in normal condition by using a 31-foot chord measurement. In each rail, the presence of the weak stringers are clearly and correctly identified using the T-18 track geometry car measurement data. These sets of track geometry data provide a good indicator for detecting a weak stringer.
© AREMA 2015 10
FIGURE 12. 31-foot Chord Left Rail Surface, T-18
FIGURE 13. 31-foot Chord Right Rail Surface, T-18
Testing on BDTF with Track Geometry System on the Lightweight Passenger Car
Track geometry data was collected with the lightweight passenger car for the six test conditions on the BDTF (Figure 2). The 13-foot chord measurements for the left and right rails are shown in Figures 14 and 15, respectively.

© AREMA 2015 11
FIGURE 14. 13-foot Chord Left Rail Surface, Lightweight Passenger Car
FIGURE 15. 13-foot Chord Right Rail Surface, Lightweight Passenger Car
The surface data clearly shows the location of the test bridge and the low approaches. The track geometry data also effectively shows geometric defects in a bridge’s supports, such as the uplift of one side of a pier. This can be useful for detecting if a pier has settled unevenly to one side or has settled uniformly.
These figures show some visible differences between the normal condition and the two weak stringer conditions from the lightweight passenger car track geometry measurements, but these differences are not as clear as was noted above for the track geometry measurements from the T-18 car. However, the lightweight passenger car only weighs 95 kips, or about half as much as the T-18 car.
Based on track geometry data from the lightweight passenger car, it is possible to detect BDTF Conditions 4 and 5 in which the abutment was elevated 1 inch.
At distance of 230 feet (the center of the bridge), the deflection under load is higher for the cases of a weak center span (both stringers, Test 3) and a weak stringer (left rail only, Test 2), as compared to the
© AREMA 2015 12
deflection with all stringers in normal condition. The cases with the weakened stringers can be identified. However, the difference between peaks is less than 0.05 inch, and it is not as prominent as it was for the measurements using the T-18 car.
It is noted that the lightweight passenger car is just over half the weight of the T-18 car and has a larger axle spacing. This results in a deflection of the BDTF spans under the lightweight passenger car that is only about half of that under the T-18, making it twice as hard to detect with a geometry system of similar capabilities. Weight and axle spacing of track geometry vehicles should be taken into consideration for potential use in detecting changes in bridge condition.
6. SUMMARY AND CONCLUSIONS
Several existing onboard systems were tested in 2012 and 2014. The results show that some of the systems can be used successfully for detecting changes in bridge condition. The findings from all the test results are as follows:
• TLV—clearly and correctly identified changes in bridge conditions.
• Track geometry cars—some work better than the others, further investigation is recommended. The weight and axle spacing seem to be significant factors.
• Instrumented freight car—provides useful results for bridge conditions evaluation; showing promise but is very sensitive to post-processing and requires further development.
• Track deflection measuring—systems correctly identified weak stringers. This system has the best potential to be used in unmanned revenue service at this point.
• All three types of systems (two geometry systems, a track deflection measuring system, and an accelerometer-based vehicle response system) are capable of detecting changes in pier elevations in an open-deck trestle.
• Trending of historical readings are likely needed to track changes and predict when action might be required.
• Conventional hopper car equipped with a track deflection measuring system and the instrumented freight car can run unattended in revenue service trains. The accelerometer-based measurements on the instrumented freight car show promising results of use in revenue service, but the system is sensitive to the post-processing algorithm and requires further development.
7. CONSIDERATIONS FOR IMPLEMENTATION AND FUTURE WORK
Future work should be focused on developing reliable procedures for processing the data (7). TTCI recommends that a revenue service demonstration be conducted using the track deflection measuring system on the track measurement vehicle and conventional hopper car to begin to explore implementation issues. For implementation, railroads would need to establish databases for their bridges and then begin establishing baselines for the onboard data. New data would be compared to historical data to look for changes in the track geometry to infer trends in bridge condition. Appropriate trending software would need to be developed.
Accurate location of bridge ends is essential, possibly including on-the-ground location indicators in addition to GPS.
Future work should include evaluation of additional track geometry cars and other track evaluation vehicles on the BDTF. Evaluation and further development of accelerometer-based measurement systems on typical locomotives and freight cars is also worth pursuing, particularly because of the potential for high availability and reliability in railroad service. There are already hundreds of locomotives equipped with VTI systems that might potentially be capable of providing bridge behavior information to a database for trending analysis.
Future challenges include ballast deck bridges, where changes in recorded signatures might be due to changes in ballast conditions rather than changes in the structural elements themselves. Additionally,
© AREMA 2015 13
longer spans will tend to have signatures that might be quite different, and may require modifications or different algorithms in trending software. A further challenge will be finding defective conditions such as cracks in steel girders that do not manifest themselves in significant changes in deflection.
ACKNOWLEDGMENTS
The authors acknowledge members of the railroad bridge community for contributing general and specific concepts towards this effort: Gordon Davids and Ken Wammel (retired FRA), Professor Gary T. Fry (Texas A&M University), and Steve Millsap (retired BNSF Railway). The authors acknowledge the assistance of Anne Gill and Byron Burns of BNSF Railway with the field testing efforts on the BNSF and the design of the BDTF, respectively.
The authors thank TUV Rheinland for donating the conventional hopper car and for processing the data. Special thanks are due to Cory Hogan and Sheng Lu who monitored the equipment during the test and delivered the data. Thanks to Luis Maal and Hugh Thompson of the FRA for making the T-18 car available for this testing.
REFERENCES
1. Otter, D. and R. Joy. February 2013. “Feasibility of Detecting Weak Bridge Stringers Using Onboard Systems.” Technology Digest TD-13-003, AAR/TTCI, Pueblo, CO.
2. Otter, D., and R. Joy. January 2014. “Onboard Condition Assessment of Bridges using the Track Loading Vehicle,” Railway Track & Structures, pp. 14-17, Chicago, Ill.
3. Rakoczy, A., S. Shu, and D. Otter. February 2015. “Vehicle/Bridge Interaction Modeling and Validation – Part 1.” Technology Digest TD-15-004, AAR/TTCI, Pueblo, CO.
4. Rakoczy, A., X. Shu, and D. Otter. February 2015. “Vehicle/Bridge Interaction Modeling and Validation – Part 2.” Technology Digest TD-15-005, AAR/TTCI, Pueblo, CO.
5. Rakoczy, A. and D. Otter. February 2015. “Bridge Condition Evaluation Using Track Modulus Measuring Systems.” Technology Digest TD-15-006, AAR/TTCI, Pueblo, CO.
6. Rakoczy, A. and D. Otter. February 2015. “Bridge Condition Evaluation Using Track Geometry Systems.” Technology Digest TD-15-007, AAR/TTCI, Pueblo, CO.
7. Lu, S. December 2008. “Real-Time Vertical Track Deflection Measurement System.” Dissertation, University of Nebraska – Lincoln.
8. Farritor, S., and M. Fateh. February 2013. “Measurement of Vertical Track Deflection from a Moving Rail Car,” DOT/FRA/ORD-13/08, Federal Railroad Administration, Washington, D.C.

© AREMA 2015 14

© AREMA 2015 15
A R E M A 2 0 1 5 A N N U A L C O N F E R E N C E
Minneapolis, MN | October 4-7, 2015
Vehicle-Based Detection for Bridges
• Motivation and Introduction
• Early Revenue Service Testing
• Bridge Deflection Test Facility (BDTF)
• Test Results from Various Vehicles
• Path Forward
A R E M A 2 0 1 5 A N N U A L C O N F E R E N C E
Minneapolis, MN | October 4-7, 2015
Motivation and Introduction• Vehicle-based detection commonly used for
railroad infrastructure (rail flaw, track geometry)
• Single vehicle to inspect thousands of bridges versus structural health monitoring system captive to one bridge
A R E M A 2 0 1 5 A N N U A L C O N F E R E N C E
Minneapolis, MN | October 4-7, 2015
Motivation and Introduction• Bridges sometimes show behavior under dynamic
train loading that is otherwise hard to observe
• Difficult to coordinate getting inspector and train at bridge at desired specific time
A R E M A 2 0 1 5 A N N U A L C O N F E R E N C E
Minneapolis, MN | October 4-7, 2015
Motivation and Introduction
• Many have observed bridges or approaches in onboard data, typically track geometry
• Initial focus on common short span trestles
– Changes in stringer displacements
– Changes in pier elevations
A R E M A 2 0 1 5 A N N U A L C O N F E R E N C E
Minneapolis, MN | October 4-7, 2015
Early Revenue Service Testing• TTCI working with BNSF on lines near Pueblo
• Locomotive vehicle/track interaction (VTI) Data
• TTCI instrumented freight car (IFC)
• Track geometry data
• AAR Track Loading Vehicle (TLV)
A R E M A 2 0 1 5 A N N U A L C O N F E R E N C E
Minneapolis, MN | October 4-7, 2015
Early Revenue Service Testing• Best indications from TLV• 14-foot wavelengths corresponding to span lengths• Wayside data needed to determine causes• Pointed to need for a facility
that provides– Calibration– Evaluation– Ground truth

© AREMA 2015 16
A R E M A 2 0 1 5 A N N U A L C O N F E R E N C E
Minneapolis, MN | October 4-7, 2015
Bridge Deflection Test Facility
• Built on lightly used track at TTC for minimal wear
• 42 feet long (3 spans of 14 feet each)
• Design adapted from ATSF T-rail span
• Shims to change
– Pier top elevations
– Stringer participation
A R E M A 2 0 1 5 A N N U A L C O N F E R E N C E
Minneapolis, MN | October 4-7, 2015
Bridge Deflection Test Facility
• Stringers In Full Strength Condition
• Stringers In “Weakened” Condition
A R E M A 2 0 1 5 A N N U A L C O N F E R E N C E
Minneapolis, MN | October 4-7, 2015
Feasibility Test with AAR TLV
• First test used AAR TLV to determine if concept was feasible
• Center load axle used
A R E M A 2 0 1 5 A N N U A L C O N F E R E N C E
Minneapolis, MN | October 4-7, 2015
Feasibility Test with TLV
• TLV Identified Weakened Stringers
A R E M A 2 0 1 5 A N N U A L C O N F E R E N C E
Minneapolis, MN | October 4-7, 2015
Tests with Existing Systems
• TLV is a research tool, not a production test vehicle
• Desire to use existing systems if possible
• Three types of systems offer promise
– Track geometry cars
– Dynamic track deflection measurement systems
– Accelerometer-based systems (VTI, IFC)
A R E M A 2 0 1 5 A N N U A L C O N F E R E N C E
Minneapolis, MN | October 4-7, 2015
Tests with Existing Systems• Sample Test Configurations For BDTF
– Base case for control
– Weakened stringers
– Changes in pier elevations
– Various combinations
© AREMA 2015 17
A R E M A 2 0 1 5 A N N U A L C O N F E R E N C E
Minneapolis, MN | October 4-7, 2015
Tests with Existing Systems• Dynamic Track Deflection Measurements
– Most like TLV loaded track deflection system
– Typically used for ballast and subgrade studies
– System on FRA T-18 track inspection car
– System on revenue service hopper
– Freight car version runs unattended
A R E M A 2 0 1 5 A N N U A L C O N F E R E N C E
Minneapolis, MN | October 4-7, 2015
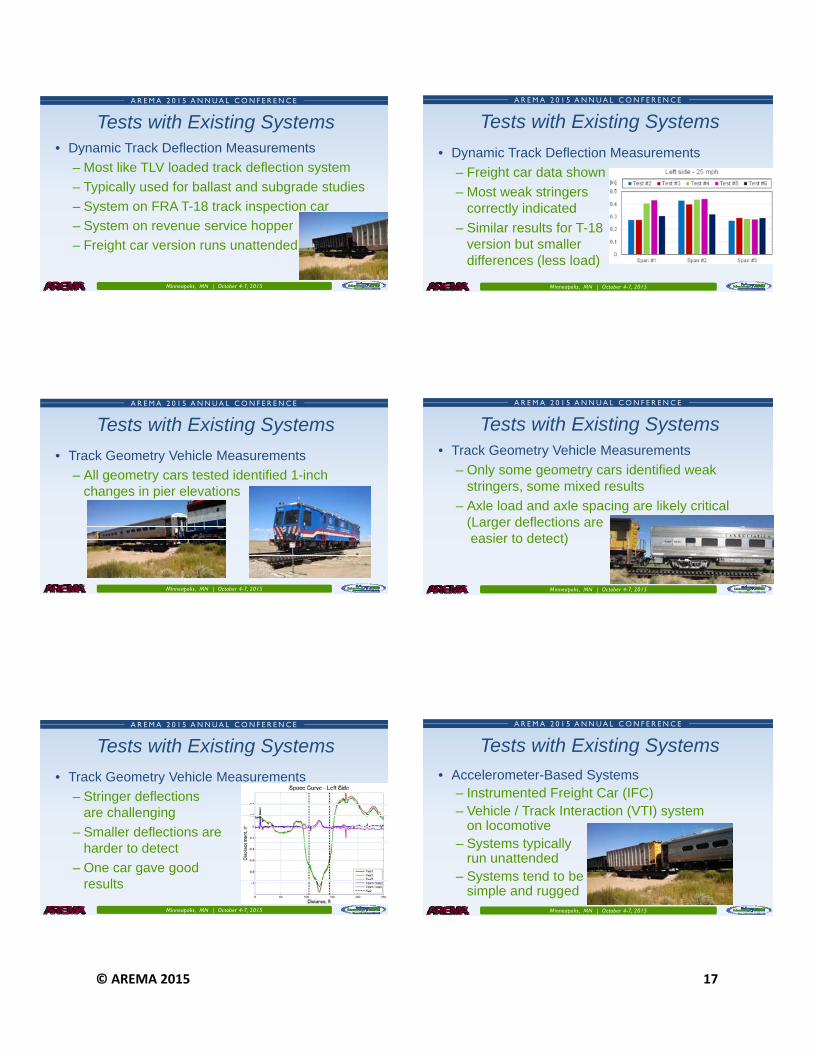
Tests with Existing Systems
• Dynamic Track Deflection Measurements
– Freight car data shown
– Most weak stringers correctly indicated
– Similar results for T-18version but smallerdifferences (less load)
A R E M A 2 0 1 5 A N N U A L C O N F E R E N C E
Minneapolis, MN | October 4-7, 2015
Tests with Existing Systems
• Track Geometry Vehicle Measurements
– All geometry cars tested identified 1-inch changes in pier elevations
A R E M A 2 0 1 5 A N N U A L C O N F E R E N C E
Minneapolis, MN | October 4-7, 2015
Tests with Existing Systems• Track Geometry Vehicle Measurements
– Only some geometry cars identified weak stringers, some mixed results
– Axle load and axle spacing are likely critical(Larger deflections areeasier to detect)
A R E M A 2 0 1 5 A N N U A L C O N F E R E N C E
Minneapolis, MN | October 4-7, 2015
Tests with Existing Systems
• Track Geometry Vehicle Measurements
– Stringer deflectionsare challenging
– Smaller deflections areharder to detect
– One car gave goodresults
A R E M A 2 0 1 5 A N N U A L C O N F E R E N C E
Minneapolis, MN | October 4-7, 2015
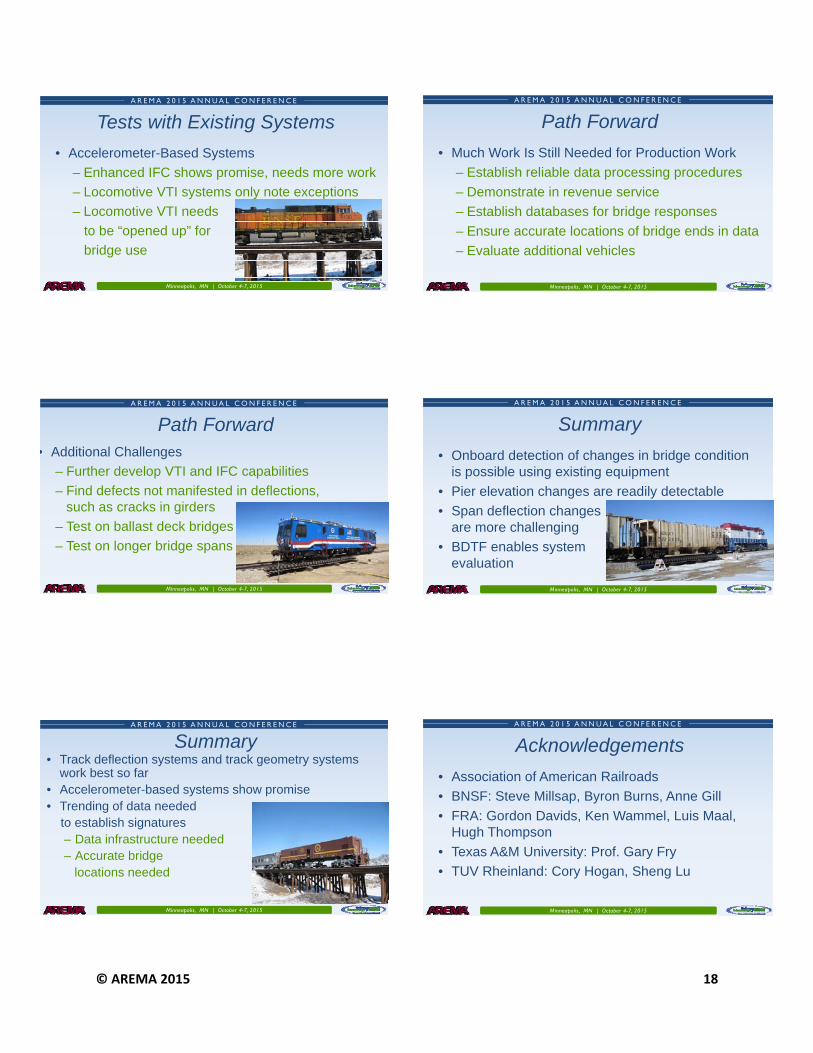
Tests with Existing Systems
• Accelerometer-Based Systems– Instrumented Freight Car (IFC)– Vehicle / Track Interaction (VTI) system
on locomotive– Systems typically
run unattended– Systems tend to be
simple and rugged
© AREMA 2015 18
A R E M A 2 0 1 5 A N N U A L C O N F E R E N C E
Minneapolis, MN | October 4-7, 2015
Tests with Existing Systems
• Accelerometer-Based Systems
– Enhanced IFC shows promise, needs more work
– Locomotive VTI systems only note exceptions
– Locomotive VTI needs
to be “opened up” for
bridge use
A R E M A 2 0 1 5 A N N U A L C O N F E R E N C E
Minneapolis, MN | October 4-7, 2015
Path Forward
• Much Work Is Still Needed for Production Work
– Establish reliable data processing procedures
– Demonstrate in revenue service
– Establish databases for bridge responses
– Ensure accurate locations of bridge ends in data
– Evaluate additional vehicles
A R E M A 2 0 1 5 A N N U A L C O N F E R E N C E
Minneapolis, MN | October 4-7, 2015
Path Forward• Additional Challenges
– Further develop VTI and IFC capabilities
– Find defects not manifested in deflections, such as cracks in girders
– Test on ballast deck bridges
– Test on longer bridge spans
A R E M A 2 0 1 5 A N N U A L C O N F E R E N C E
Minneapolis, MN | October 4-7, 2015
Summary
• Onboard detection of changes in bridge condition is possible using existing equipment
• Pier elevation changes are readily detectable
• Span deflection changesare more challenging
• BDTF enables systemevaluation
A R E M A 2 0 1 5 A N N U A L C O N F E R E N C E
Minneapolis, MN | October 4-7, 2015
Summary• Track deflection systems and track geometry systems
work best so far• Accelerometer-based systems show promise• Trending of data needed
to establish signatures– Data infrastructure needed– Accurate bridge
locations needed
A R E M A 2 0 1 5 A N N U A L C O N F E R E N C E
Minneapolis, MN | October 4-7, 2015
Acknowledgements
• Association of American Railroads
• BNSF: Steve Millsap, Byron Burns, Anne Gill
• FRA: Gordon Davids, Ken Wammel, Luis Maal, Hugh Thompson
• Texas A&M University: Prof. Gary Fry
• TUV Rheinland: Cory Hogan, Sheng Lu