vehicle edition - fleet management weekly
TRANSCRIPT

WORKFORCE MOBILITY BENCHMARK REPORT:
VEHICLE EDITION
2017


CONTENTSINTRODUCTION 2
KEY FINDINGS 3
MARKET CHALLENGES 4
METHODOLOGY 6 Respondents by Industry 7 Respondents by Annual Revenue 7 Respondents by Organization Size 7 Vehicle Program Type 8
VEHICLE PROGRAM POLICY 9 Insurance Verification 10 Safe Driving Incentives 11 Motor Vehicle Record (MVR) Checks 11 DUI/DWI Risks 11
APPS IN THE MOBILE WORKFORCE 12 Impact of Using Mobile Mileage Capture 12
COST BENCHMARKS BY PARTICIPANT 13 Average Direct Spend per Participant 14 US National Average Fuel Prices 14 Average Reported Business Mileage per Participant 14 Costs per Business Mile 15 Vehicle Program Ownership 15
COMPANY-OWNED VEHICLES 16 Cost Benchmarks: Company-owned Vehicles 17 What do people like about company-owned vehicles? 18 What do people like least about company-owned vehicles? 18 Personal use of Company-owned vehicles 19
VEHICLE ALLOWANCES 20 Cost Benchmarks: Vehicle Allowances 21 What do people like most about allowances? 22 What do people like least about allowances? 22 Monthly tax waste in a $800 allowance 23
CENTS-PER-MILE (CPM) 24 Cost Benchmarks: Cents-per-mile (CPM) 25 What do people like most about Cents-per-mile reimbursement? 26 What do people like least about Cents-per-mile reimbursement? 26 Managed Cents-Per-Mile (CPM) programs 27
FIXED AND VARIABLE RATE (FAVR) 28 Cost Benchmarks: Fixed and Variable Rate (FAVR) 29 What do people like most about FAVR? 30 What do people like least about FAVR? 30

2
Welcome to Runzheimer’s 11th annual Workforce Mobility Benchmark Study. Why do we perform this study year after year? We do it because we are committed to helping companies understand leading practices for vehicle programs and develop strategies that align with their company objectives. Also, by evaluating best practices across many industries and vehicle program types, we continue to deliver technologies and services that align with the direction of the mobile and digital workplace.
As the experts in vehicle reimbursement programs, we monitor trends across industries and company sizes while also aggregating study responses from hundreds of companies in order to provide current benchmark data. This data will help you understand areas of risk, compliance gaps, financial costs, perceived administrative burdens, and overall fairness to employees for each vehicle program approach.
Understanding practices among industry peers (external benchmarking) can provide competitive insights and help companies accomplish their strategic goals. That’s one reason why companies consult with Runzheimer – to gain insight into vehicle program practices among industry peers and create strategic vehicle program policies.
Reducing risk and improving compliance are at the forefront of the challenges organizations face today. These add to the challenges of monitoring spend, reducing administrative burdens, and providing deep insights into field activity and performance. The world is changing and we are committed to helping you optimize your mobile workforce and accomplish your strategic goals.
KEY FINDINGS
INTRODUCTION

3
Mobile Mileage Capture saves employees time and saves companies money
Vehicle reimbursement programs are becoming more affordable
Employers have opportunities to increase visibility into mobile workforce activities
Managing accident risk is a challenge for employers
Company-owned vehicles remain the most expensive option for employers
• Automated mileage capture reduces administrative burden on employees by up to 84% vs. manual mileage logging and reporting
• Companies report that using mileage capture technology led to an average 17% reduction in reimbursement spend per mile
• The average direct spend per business mile was reported at the lowest rate in the past five years ($0.54 per business mile).
• Among companies that use mobile technology to capture employee mileage, only 33% report using that data for additional insights into their mobile workforce
• Driver safety is a priority for 80% of companies1, but 62% don’t check motor vehicle records on an annual basis
• Companies report that fleet vehicles cost, on average, nearly 15% more than vehicle reimbursement programs.
ADMINISTRATIVE BURDEN
REIMBURSEMENT SPEND OPPORTUNITY FOR MORE INSIGHTSOPPORTUNITY TO INCREASE AWARENESS OF DRIVING BEHAVIOR
RATE OF DIRECT SPEND REIMBURSEMENT COST COMPARED TO FLEET VEHICLES

4
MARKET CHALLENGES
1
2
3
Nearly 75% of companies benchmark against others and industries2
Runzheimer delivers thousands of benchmarks each year to clientsin more than 200 industries3
Comparing against best-in-class firms in respondent industries
Optimization of program management and administrative processes
Understanding whether vehicle program spending is accurate
Many companies use benchmarking to measure their policies and practices against competitors and identify opportunities for improvement.
As technology improves, expectations increase for simplified processes and streamlined program management across all expense management categories.
Business mileage reimbursement is a top-10 expense category6 and results in high pressure on organizations to improve insight into spending. Despite this, the most common method of mileage reimbursement involves employees manually entering mileage into an expense report.
Companies can address many of these concerns by leveraging mobile technology to streamline this segment of expense reporting.
DID YOU KNOW?
DID YOU KNOW?
DID YOU KNOW?
Companies report three common challenges regarding vehicle programs.
Streamlining processes is a key component in minimizing the cost of expense reporting4
Nearly half of companies identify the elimination of manual and paper-based processes as a top business pressure for managing expenses4
The top goal for improving T&E for 66% of companies is: Simplify the process for employees and managers5
Using mobile technology helps companies capture expenses at the earliest possible moment7
Standardized mileage records and improved accuracy help companies increase visibility into spend
Mobile technology creates an 84% reduction in employee administrative burden for mileage reporting

5
Note: 27% of companies identified other top challenges
How does my company’s business vehicle program compare against Best-in-Class firms in my industry?
Are we doing enough to optimize our program management/administrative processes?
Are vehicle reimbursements accurate and representing true business miles?
Are employees complying with vehicle program policies?
Are employees satisfied with my company’s business vehicle program?
19%
15% 14% 13% 12%
Popular Market Challenges

6
METHODOLOGY
700 companies responded to Runzheimer’s
benchmark study
Focus Vehicle program policy, process,
controls and costs
Data collected January - May 2017
Responses verified May - June 2017
Published July 2017
Participant Profile and Methodology
Key details about the 11th Annual Runzheimer Workforce Mobility Benchmark Study
The Runzheimer Workforce Mobility Benchmark Study collects financial, operational, and program-specific data points to provide trends and comparisons among participant organizations. This study drills deep into vehicle programs including:
Fixed and Variable Rate (FAVR)
Company-owned (Fleet)
Cents-per-mile (CPM)
Vehicle Allowances
Organizations that participated in the Runzheimer Workforce Mobility Benchmark Study have US-based operations. Financial data was captured for operations in only these locations and reported in U.S. dollars. An extensive validation process was conducted following receipt of participant data. In cases where the accuracy of information was in question and could not be validated, data was not included as part of the analysis. All data was collected from study respondents for their prior completed fiscal year.
700

7
Respondents by Annual Revenue
Respondents by Organization Size
Respondents by Industry
Examining the Respondents
This study also represents a range in scale based on annual revenue as reflected below.
Runzheimer works with mobile workforces of five employees through thousands. This benchmark study represents a diverse sampling of company sizes as seen below:
28% Less than 250
251 - 1,000
1,001 - 4,000
24%
19%
Participants in this year’s study represent many diverse industries. The largest samples came from manufacturing, wholesale, biotechnology, pharmaceuticals & medicine, healthcare/medical services and food and beverage manufacturing. Here’s a breakdown by industry:
Industry Classification % Respondents
Manufacturing 9.84%
Wholesale – Other 7.73%
Biotechnology, Pharmaceuticals & Medicine 7.26%
Healthcare / Medical Services 6.09%
Food & Beverage Manufacturing 5.39%
Food Service 4.92%
Business / Professional Services 4.68%
Retail 4.45%
Alcoholic Beverage Wholesale 3.75%
Medical Equipment & Supplies 3.75%
Construction Materials 3.51%
Chemical Manufacturing 3.28%
Construction / Home Improvement 3.04%
Transportation / Trucking 2.58%
Construction & Hardware Materials Wholesale 2.11%
Consulting 2.11%
Machinery & Equipment Manufacturing 2.11%
Telecommunications 1.87%
Utilities / Energy 1.87%
Agriculture / Mining 1.64%
Machinery Wholesale 1.41%
Petroleum and Natural Gas Extraction 1.41%
Education 1.17%
Grocery Wholesale 1.17%
Non-Profit 1.17%
Other 11.69%
> $1.5 billion
35%
$
$50-$499 million
21%
$
$500 million - $1.5 billion
18%
$
$2-$10 million
13%
$
$11-$49 million
13%
$
More than 10,00119%
4,001 - 10,00010%

8
80% of companies have more than one vehicle program8
Examining the Respondents Cont’d
Vehicle Program Type Frequency of Vehicle Program Types1
Different vehicle programs are designed to meet the unique objectives of each business, and most organizations opt for a blended approach rather than single strategy to manage frequent and infrequent drivers differently. While Cents-Per-Mile (CPM) is the dominant program, it is usually paired with another method for frequent/high-mileage drivers.
Many organizations manage CPM separately from other vehicle programs, and this fragmented ownership can conceal risks and inflate costs. A centralized approach to vehicle program management helps organizations better manage cost, reduce risk and increase employee satisfaction.
66%
22%
7%
5%
Cents-per-Mile
Company-owned Vehicles
Vehicle Allowance
Fixed and Variable Rate
DID YOU KNOW?

9
59% 24% 17%
Job Responsibilities
Amount of Business Mileage
Job Title
A policy exists and employees sign it
A policy exists but employees do not sign it
No policy exists
VEHICLE PROGRAM POLICY
Job responsibilities was the most commonly reported factor (56%) for including employees in vehicle programs. The amount of business mileage (23%) and job title (21%) also were common factors for determining employee eligibility.
The majority of companies (83%) report having a vehicle policy. Most organizations (59%) require employees to sign the policy.
56%
23%
21%

10
Vehicle Program Policy Cont’d
Insurance Verification
The majority of organizations (73%) include minimum levels of insurance as part of their vehicle program policy. Most of those organizations (66%) also verify insurance coverage for participants.
! !
66% 3% 7% 24%
Company policy exists AND
Insurance is verified
Company policy does not exist AND
Insurance is verified
Company policy exists AND
Insurance is not verified
Company policy does not exist AND
Insurance is not verified
Fortune 500 companies that verify insurance as part of a vehicle program average 90% compliance10
DID YOU KNOW?70% of Fortune 500 companies with reimbursement polices withhold reimbursements when participants are out of compliance10
DID YOU KNOW?

11
Safe Driving Incentives
DUI/DWI Risks
Motor Vehicle Record (MVR) Checks
The majority of study respondents (91%) report that safe driving incentives are not part of their company’s vehicle program policy.
A majority of organizations (65%) have a policy of revoking driving privileges for employees who are convicted of driving under the influence. Alcohol is a contributing factor in 39% of all work-related traffic crashes13, yet job dismissal was cited as the penalty by only 25% of responding organizations.
Most organizations (62%) report that they do not perform MVR checks, or only check prior to hiring an employee. Some organizations (26%) report performing motor vehicle record (MVR) checks on an annual basis.
Not Incentivized
91% Incentivized 9%
Nearly 50% of business driving accidents occur after five years of tenure11
DID YOU KNOW?
In 2014, crashes involving vehicles on public roadways were the leading cause of work-related fatalities, accounting for 23% of all workplace fatalities13
DID YOU KNOW?On-the-job distracted driving crashes annually cost employers an estimated $4.3 Billion12
DID YOU KNOW?
Do not perform MVR checks or only prior to hiring
Perform annual MVR checks
MVR checks are run several times a year
62%
65% 25% 10%
Driving privileges
are revoked
Job dismissal
There is no penalty
26%
12%
12
Impact of Using Mobile Mileage Capture
APPS IN THE MOBILE WORKFORCE
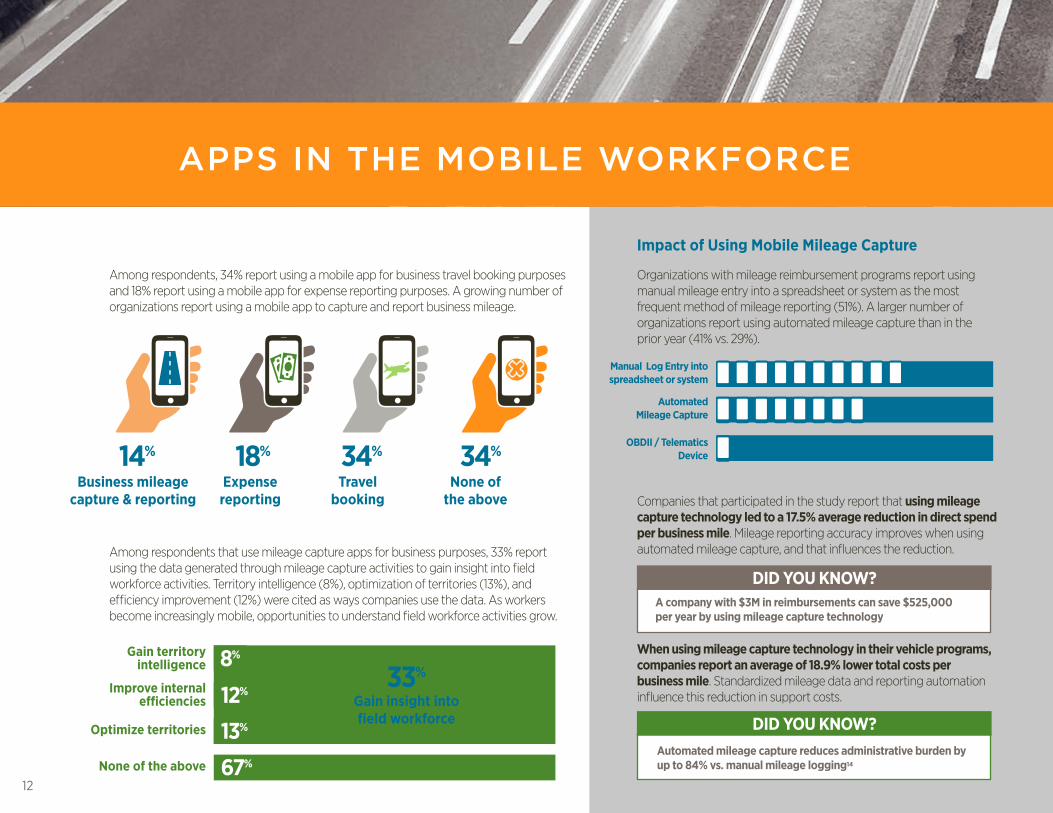
Among respondents, 34% report using a mobile app for business travel booking purposes and 18% report using a mobile app for expense reporting purposes. A growing number of organizations report using a mobile app to capture and report business mileage.
Organizations with mileage reimbursement programs report using manual mileage entry into a spreadsheet or system as the most frequent method of mileage reporting (51%). A larger number of organizations report using automated mileage capture than in the prior year (41% vs. 29%).
Companies that participated in the study report that using mileage capture technology led to a 17.5% average reduction in direct spend per business mile. Mileage reporting accuracy improves when using automated mileage capture, and that influences the reduction.
When using mileage capture technology in their vehicle programs, companies report an average of 18.9% lower total costs per business mile. Standardized mileage data and reporting automation influence this reduction in support costs.
Among respondents that use mileage capture apps for business purposes, 33% report using the data generated through mileage capture activities to gain insight into field workforce activities. Territory intelligence (8%), optimization of territories (13%), and efficiency improvement (12%) were cited as ways companies use the data. As workers become increasingly mobile, opportunities to understand field workforce activities grow.
14% 18% 34%
33%
34%
Business mileage capture & reporting
Expense reporting
Travel booking
Gain insight into field workforce
None of the above
Gain territory intelligence
Manual Log Entry into spreadsheet or system
Automated Mileage Capture
OBDII / Telematics Device
Improve internal efficiencies
Optimize territories
None of the above
8%
51%
41%
8%
12%
13%
67%
A company with $3M in reimbursements can save $525,000 per year by using mileage capture technology
DID YOU KNOW?
Automated mileage capture reduces administrative burden by up to 84% vs. manual mileage logging14
DID YOU KNOW?
13
$8,480annual direct spend
per participantsupport costs total cost per participant$664 $9,144
COST BENCHMARKS BY PARTICIPANT
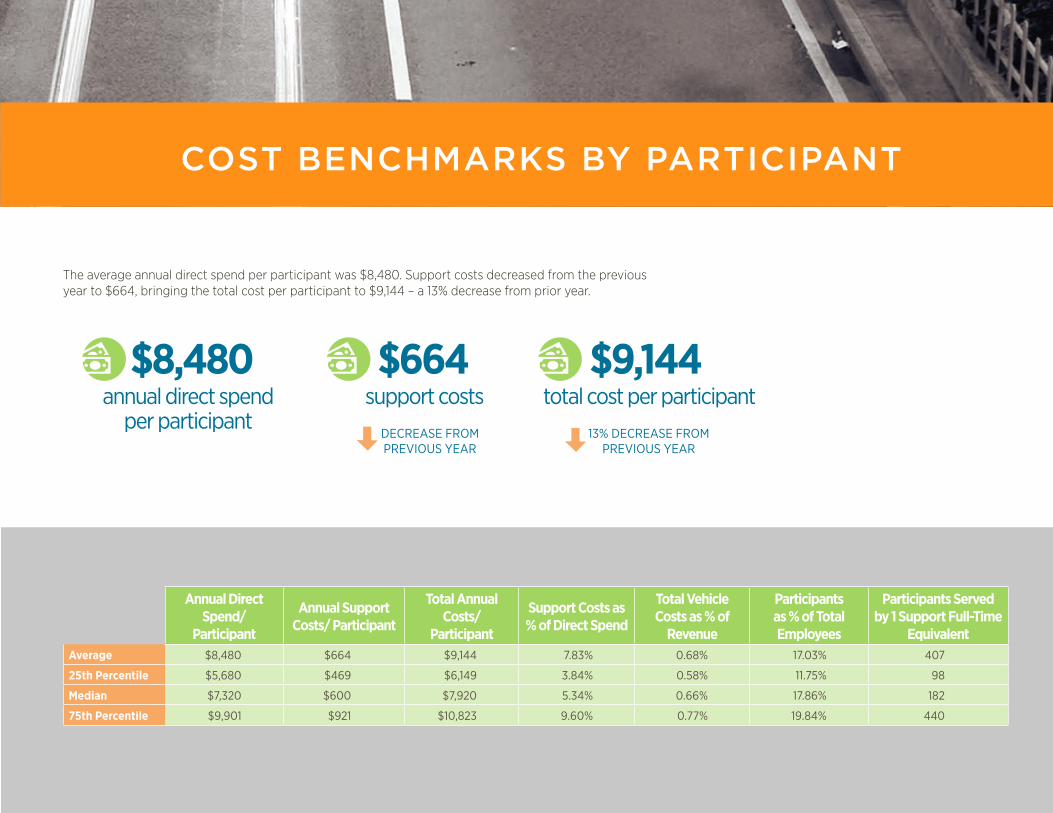
The average annual direct spend per participant was $8,480. Support costs decreased from the previous year to $664, bringing the total cost per participant to $9,144 – a 13% decrease from prior year.
Annual Direct Spend/
Participant
Annual Support Costs/ Participant
Total Annual Costs/
Participant
Support Costs as % of Direct Spend
Total Vehicle Costs as % of
Revenue
Participants as % of Total Employees
Participants Served by 1 Support Full-Time
EquivalentAverage $8,480 $664 $9,144 7.83% 0.68% 17.03% 407
25th Percentile $5,680 $469 $6,149 3.84% 0.58% 11.75% 98
Median $7,320 $600 $7,920 5.34% 0.66% 17.86% 182
75th Percentile $9,901 $921 $10,823 9.60% 0.77% 19.84% 440
DECREASE FROM PREVIOUS YEAR
13% DECREASE FROM PREVIOUS YEAR

14
Cost Benchmarks by Participant Cont’d
Average Direct Spend per Participant
US National Average Fuel Prices
Average Reported Business Mileage per Participant
The average direct spend per participant decreased 14% compared with the prior year results of $9,843. National average fuel costs continue to trend lower than previous years, and the decrease is reflected in the average direct spend costs collected for this study. A lower reported number of business miles per participant may also influence the decreased average direct spend.
The average US price per gallon of self-serve, regular fuel remained lower than the 2015 average throughout 2016. This is a 12% annual reduction in the average price compared with 2015.
Organizations reported a 9% lower average number of annual business miles per program participant compared with the previous year. Increased use of mileage capture technology is reflected in lower reported mileage. This could also be influenced by reporting on programs for occasional business drivers, smaller field territories, and a larger number of employees driving for business purposes.
2014
2014
2014
$9,697
$3.38
2015
2015
2015
$9,843
$2.43
2016
2016
2016
$8,480
$2.14
12% lower annual average fuel price in
2016 than 2015
9% lower average number of annual business miles per participant in 2016
than 2015
14% decrease in average direct spend
per participant in 2016 than 2015
1 1 15 3 15 1 82 0 80 6 5

15
Costs per Business Mile
Vehicle Program Ownership
This benchmark includes responses from several key vehicle program owners. In most cases, Human Resources (28%) and Accounting/Finance (22%) reported owning their company’s vehicle programs in this study.
27.71%
22.29%
13.25%
9.04%
7.83%
7.23%
7.23%
3.01%
2.41%
Human Resources
Fleet Management
Accounting / Finance
Operations
Purchasing / Procurement
Administration
Sales / Marketing
No Central Department Has Ownership
Corporate Services
9% decrease in average direct spend
per business mile compared to prior year
The average direct spend per business mile decreased 9% compared with the prior year. The average direct spend was $0.54 per mile, with support costs of $0.05 per mile for a total cost per business mile of $0.59. This reflects lower overall vehicle ownership and operating costs - including fuel costs.15
Direct Spend per Business Mile
Support Costs per Business Mile
Total Costs per Business Mile
Support Costs as % of Direct Spend
Average $0.54 $0.05 $0.59 9.25%
25th Percentile $0.46 $0.04 $0.50 3.84%
Median $0.53 $0.05 $0.58 5.34%
75th Percentile $0.62 $0.06 $0.68 9.60%
16
COMPANY-OWNED VEHICLES
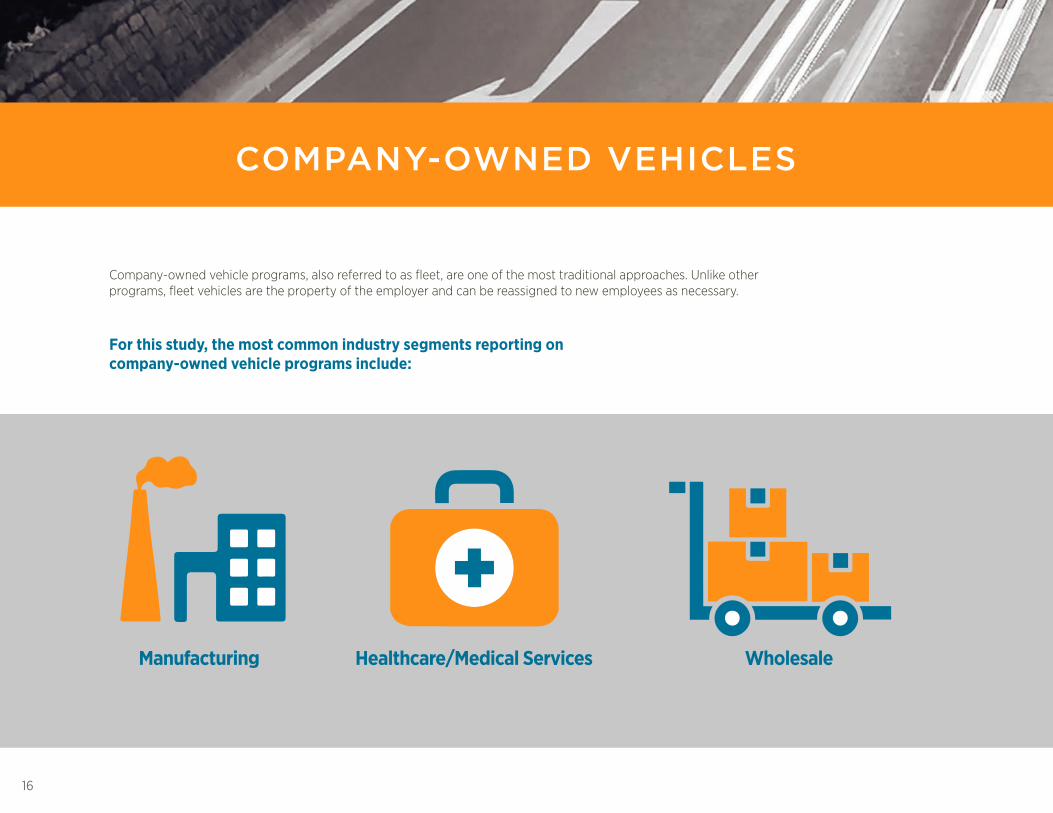
Company-owned vehicle programs, also referred to as fleet, are one of the most traditional approaches. Unlike other programs, fleet vehicles are the property of the employer and can be reassigned to new employees as necessary.
Manufacturing Healthcare/Medical Services Wholesale
For this study, the most common industry segments reporting on company-owned vehicle programs include:
17
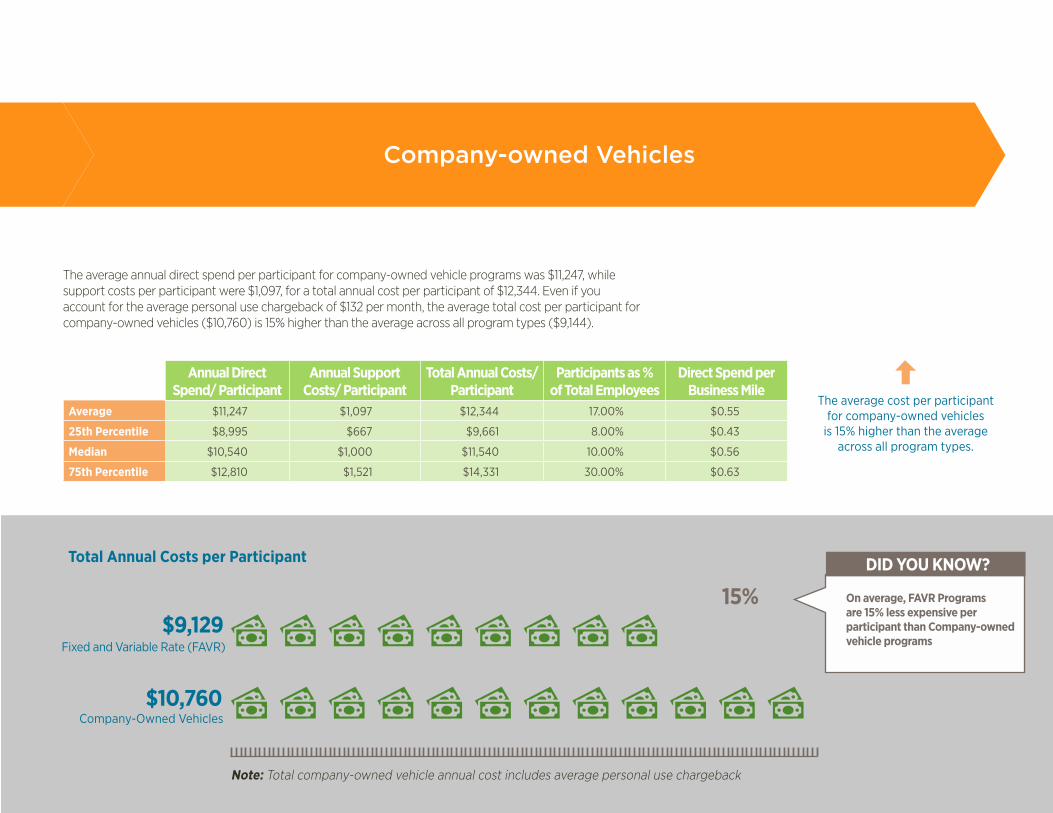
The average annual direct spend per participant for company-owned vehicle programs was $11,247, while support costs per participant were $1,097, for a total annual cost per participant of $12,344. Even if you account for the average personal use chargeback of $132 per month, the average total cost per participant for company-owned vehicles ($10,760) is 15% higher than the average across all program types ($9,144).
Annual Direct Spend/ Participant
Annual Support Costs/ Participant
Total Annual Costs/ Participant
Participants as % of Total Employees
Direct Spend per Business Mile
Average $11,247 $1,097 $12,344 17.00% $0.55
25th Percentile $8,995 $667 $9,661 8.00% $0.43
Median $10,540 $1,000 $11,540 10.00% $0.56
75th Percentile $12,810 $1,521 $14,331 30.00% $0.63
The average cost per participant for company-owned vehicles
is 15% higher than the average across all program types.
Total Annual Costs per Participant
Fixed and Variable Rate (FAVR)
Company-Owned Vehicles
$9,12915%
$10,760
On average, FAVR Programs are 15% less expensive per participant than Company-owned vehicle programs
DID YOU KNOW?
Company-owned Vehicles
Note: Total company-owned vehicle annual cost includes average personal use chargeback
18
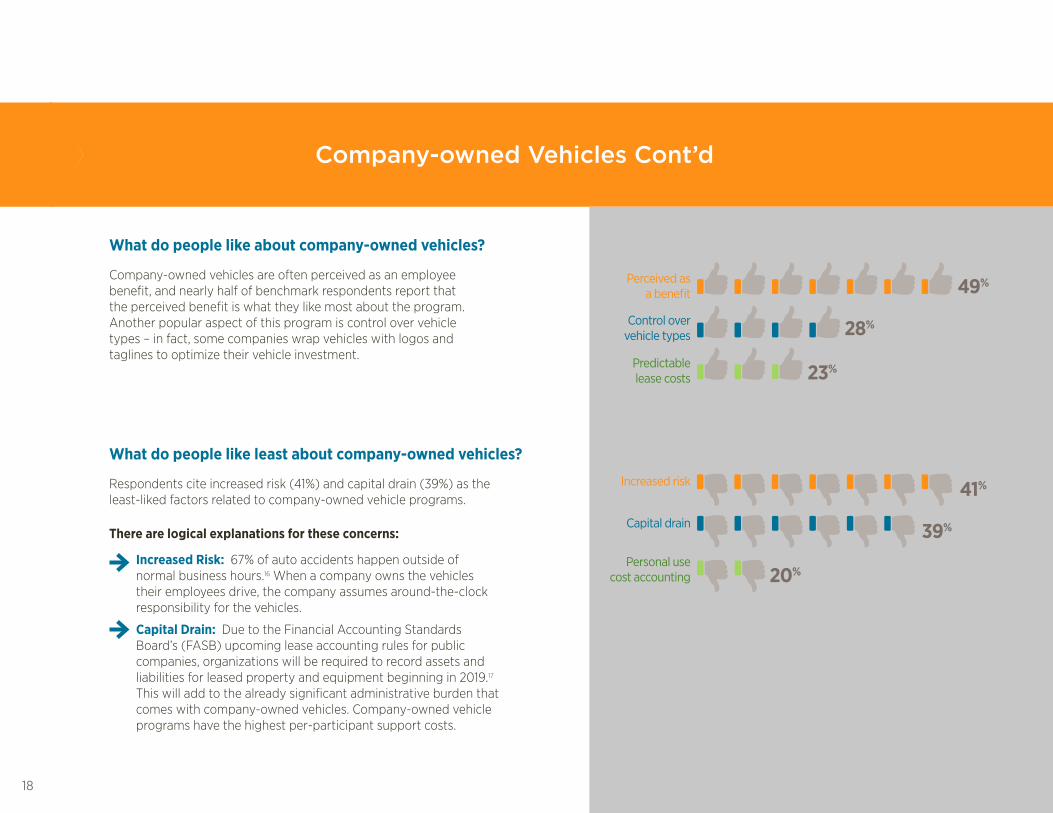
What do people like about company-owned vehicles?
What do people like least about company-owned vehicles?
There are logical explanations for these concerns:
Company-owned vehicles are often perceived as an employee benefit, and nearly half of benchmark respondents report that the perceived benefit is what they like most about the program. Another popular aspect of this program is control over vehicle types – in fact, some companies wrap vehicles with logos and taglines to optimize their vehicle investment.
Respondents cite increased risk (41%) and capital drain (39%) as the least-liked factors related to company-owned vehicle programs.
Increased Risk: 67% of auto accidents happen outside of normal business hours.16 When a company owns the vehicles their employees drive, the company assumes around-the-clock responsibility for the vehicles.
Capital Drain: Due to the Financial Accounting Standards Board’s (FASB) upcoming lease accounting rules for public companies, organizations will be required to record assets and liabilities for leased property and equipment beginning in 2019.17 This will add to the already significant administrative burden that comes with company-owned vehicles. Company-owned vehicle programs have the highest per-participant support costs.
Perceived as a benefit
Increased risk
Control over vehicle types
Capital drain
Predictable lease costs
Personal use cost accounting
49%
41%
28%
39%
23%
20%
Company-owned Vehicles Cont’d

19
Employees are charged
monthly
We do not have a formal policy
in place
Imputed income
Employees are charged
annually
Personal use of Company-owned vehicles Personal use charges per month
Average Monthly Personal Use Charge
The majority of respondents with company-owned vehicle programs report having a personal use policy in place, charging a monthly fee for personal use. However, 30% of respondents report not having a personal use policy in place.
The majority of respondents report charging employees less than $132 per month for personal use of company-owned vehicles.
The average monthly personal use charge
was reported at $132 in 2016.18 This represents a 14%
increase since 2012.
35% 30% 28% 7%
$116$121
20162015201420132012
$123$128
$132
Less than $132 per month
More than $132 per month
About $132 per month
66%
26%
8%

20
VEHICLE ALLOWANCES
With a vehicle allowance approach, employers pay workers a flat fee that is deemed adequate to cover driving-related expenses. This is the easiest program to administer and for which to budget, however the one-size-fits-all approach has potential drawbacks. Allowances do not factor in localized costs or the actual number of business miles driven. As a result, workers may receive too much or too little to cover the actual number
For this study, the most common industry segments reporting on company-owned vehicle programs include:
Biotechnology, Pharmaceuticals & Medicine
Manufacturing Alcoholic Beverage Wholesale

21
Vehicle Allowances
The average annual direct spend per participant for vehicle allowance programs was $11,644, which is 27% higher than the average across all program types ($8,480).
Note: Thirty-four percent (34%) of respondents with vehicle allowances also provide some form of reimbursement for fuel costs.
Annual Direct Spend/ Participant
Direct Spend per Business Mile
Participants as % of Total Employees
Average $11,644 $0.57 12.06%
25th Percentile $7,751 $0.47 2.00%
Median $9,043 $0.55 12.50%
75th Percentile $11,230 $0.60 20.00%
The average annual direct spend per participant was
27% higher than the average across all program types.
Organizations report that the average monthly vehicle allowance is $800 per month
DID YOU KNOW?
34%
respondents with fuel cost reimbursement

22
Vehicle Allowances Cont’d
What do people like most about allowances?
What do people like least about allowances?
Predictable costs were the most-liked aspect of vehicle allowance programs (45%). The freedom of choice that comes with employee-owned vehicles was ranked as a close second (42%). This aspect contributes to employee satisfaction, as employees are able to choose the make and model of the vehicle they drive.
Reimbursement inequities were reported as the least liked aspect of vehicle allowance programs (37%). Sometimes allowances result in significantly over- or under-reimbursing drivers depending on their mileage and driving patterns. No control over insurance was also cited as a frequently disliked aspect of allowance programs (34%). In this case, companies may set a standard level of insurance coverage, but cannot monitor compliance with this requirement.
Predictable costs
Reimbursement inequities
Employee-owned vehicles
Insurance visibility
Flexibility
Employer payroll tax liability
45%
37%
42%
34%
13%
29%
Income tax
Employee take-home

23
Monthly tax waste on an $800 allowance
The chart below shows how an employee will take home only $560 of an $800 vehicle allowance each month due to tax waste.
$61
$179
$560
$240 tax waste
$560 take home
$800 total allowance
+
FICA/FUTA
Income tax
Employee take-home
Employees lose an average of 30% of a vehicle allowance in tax waste
DID YOU KNOW?

24
CENTS-PER-MILE (CPM)
The Cents-per-mile approach is the most common vehicle program. In fact, 66% of organizations use CPM for at least some of their employees.7 Under a CPM program, employers reimburse participants for business use of their personally-owned vehicles. Reimbursement is either at the IRS safe harbor rate – a national standard rate used to calculate the deductible expenses of using a vehicle for work – or at a custom rate developed by the company.
Sometimes companies overlook CPM reimbursements reported in expense systems
DID YOU KNOW?
In this study, the most common industry segments reporting on CPM programs include:
Retail Food & Beverage ManufacturingManufacturing
Runzheimer has consulted with the IRS each year since 1980 to help establish the safe harbor mileage rate
DID YOU KNOW?

25
Cents-per-mile (CPM)
The average annual direct spend per participant for CPM programs was $2,706. The average number of annual miles per participant was 58% less than the average across all program types. It is common for companies to use CPM to reimburse employees who drive occasionally for business purposes. This practice is also reflected by the higher than average percentage of total employees reported as CPM participants (39% vs. 17%).
Annual Direct Spend/ Participant
Direct Spend per Business Mile
Annual Miles per Participant
Participants as % of Total Employees
Average $2,706 $0.54 5,011 39.62%
25th Percentile $1,056 $0.54 1,955 16.50%
Median $1,900 $0.54 3,519 33.00%
75th Percentile $2,728 $0.54 5,051 50.00%
The average annual miles per participant was 58%
less than the average across all program types.
$10,000miles
2 0 0 0 0 = more than
DID YOU KNOW?
Many organizations overspend in CPM programs For example, an employee would be reimbursed more than $10,000 for driving 20,000 miles

26
Cents-per-mile (CPM) Cont’d
What do people like most about Cents-per-mile programs?
What do people like least about Cents-per-mile programs?
Among respondents, the most-liked aspect of CPM reimbursement was that reimbursements are non-taxable. (53%). To meet IRS criteria for tax-free CPM reimbursements, employees must report every trip’s start and end location, time and date, reason for travel and total distance and the per-mile rate must be less than or equal to the IRS safe harbor rate. Similar to respondents with vehicle allowance programs, many respondents cited employee-owned vehicles as another favorable attribute of CPM (36%).
Note: Organizations must comply with IRS criteria to qualify for tax-free CPM reimbursements.
The majority of respondents (63%) cited the administrative burden of processing mileage expense reports as the least-liked aspect of CPM reimbursement. One way to minimize time spent on processing expense reports is to automate the program using mileage capture technology. Reimbursement inequities were also frequently identified (32%) as a disliked aspect. This is often the result of using the IRS safe harbor rate, which is based on national averages, rather than unique, localized costs.
Administrative time to process
expense reports
No tax implications
Reimbursement inequities
Employee-owned vehicles
Reimbursement costs
Ease of administration
63%
36%
32%
11%
5%
53%

27
Managed Cents-Per-Mile (CPM) programs
The key to running IRS-compliant CPM programs is to implement solid policies and controls. Manual mileage logging practices increase the administrative burden on employees. Consulting with vehicle program experts can help organizations implement accessible, meticulous mileage capture technology and ensure participants adopt and correctly use the tools.
There are also financial benefits to a managed CPM reimbursement program. The accuracy of mileage reporting improves when organizations adopt mileage capture technology over manual mileage logs, typically resulting in reduced mileage. Implementing a mileage capture tool is more than an investment in accuracy – it also gives employers unprecedented visibility into their vehicle program costs, and increases employee productivity by eliminating the need to manually log miles. Data culled from mileage capture tools can be transformed into valuable insights to optimize driving routes and territories for less windshield time and more productive time.
An unmanaged CPM approach can leave organizations exposed to liability risk. Employers running a managed CPM initiative can design controls to mitigate risk. Defining insurance requirements that employees must meet to qualify for the reimbursements helps organizations minimize their liability in the event of accidents or other on-the-road violations. Implementing frequent Motor Vehicle Record checks is another method to mitigate risk.
Manual mileage logging adds an average of 21 hours of administrative time per year to each participant19
DID YOU KNOW?
Automated mileage capture reduces reported mileage by an average of 17.5%
DID YOU KNOW?
62% of organizations don’t check Motor Vehicle Records annually
DID YOU KNOW?

28
FIXED AND VARIABLE RATE (FAVR)
Fixed and variable rate (FAVR) programs combine the fixed costs of operating a vehicle with geographically specific variable expenses to produce highly accurate reimbursements. Participants receive a fixed amount, which is designed to cover vehicle insurance, taxes, depreciation and registration for business use of their personal vehicle. Employees also receive a variable, localized Cents-per-mile (CPM) reimbursement based on where they live and work. The CPM rate accounts for the cost of fuel, maintenance, oil, tires and other incidental expenses.
Runzheimer invented FAVR in 1933
DID YOU KNOW?
In this study, the most common industry segments reporting on FAVR programs include:
Manufacturing RetailBiotechnology, Pharmaceuticals & Medicine

29
Fixed and Variable Rate (FAVR)
The average annual direct spend per participant for fixed and variable rate reimbursement programs was $8,508. The average annual direct spend per participant is less than 1% higher than the average across all program types ($8,508 vs. $8,480).
The average annual direct spend per participant is less
than 1% higher than the average across all program types
Annual Direct Spend/ Participant
Annual Support Costs/ Participant
Total Annual Costs/ Participant
Support Costs as % of Direct Spend
Total Vehicle Costs as % of Revenue
Participants as % of Total Employees
Participants Served by 1 Support Full-Time
EquivalentAverage $8,508 $621 $9,129 7.29% 0.33% 18.08% 139
25th Percentile $6,354 $499 $6,853 5.35% 0.03% 9.90% 68
Median $7,961 $594 $8,555 8.80% 0.12% 17.79% 92
75th Percentile $10,223 $718 $10,940 9.89% 0.38% 25.00% 153
FAVR averages 27% less than allowance programs for employers and eliminates 30% tax waste for employees
DID YOU KNOW?Per participant, FAVR direct spend averages 14% less than company-owned vehicles
DID YOU KNOW?

30
Fixed and Variable Rate (FAVR) Cont’d
What do people like most about FAVR?
What do people like least about FAVR?
The majority of respondents (72%) cited equitable reimbursements as the most-liked aspect of fixed and variable rate (FAVR) reimbursement. FAVR does not overpay participants with high business mileage, nor does it underpay participants with low business mileage. Some respondents (19%) identified a lack of payroll tax as a most-liked aspect of FAVR. FAVR can be tax-free for both employers and employees.
The majority of respondents (51%) cited end user education as the least-liked aspect of FAVR reimbursement. Some respondents (39%) report managing IRS compliance as the least-liked aspect of FAVR. Some organizations find it difficult to manage change when implementing FAVR programs. Consulting with a vehicle program solution provider can help organizations develop and implement an IRS-compliant program that meets their strategic objectives.
Equitable reimbursements
End user education
No employer payroll tax liability
Managing IRS compliance
No capital drain
Managing policy compliance
51%
19%
39%
9%
10%
72%
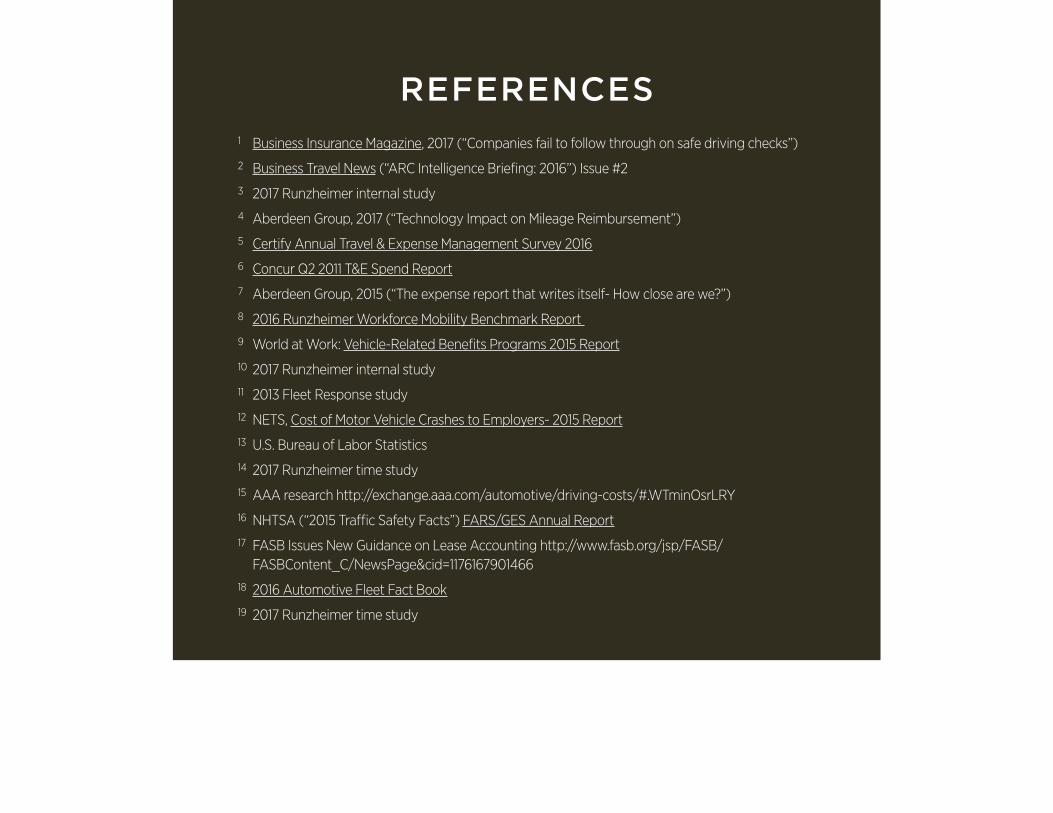
1 Business Insurance Magazine, 2017 (“Companies fail to follow through on safe driving checks”)2 Business Travel News (“ARC Intelligence Briefing: 2016”) Issue #2 3 2017 Runzheimer internal study 4 Aberdeen Group, 2017 (“Technology Impact on Mileage Reimbursement”)5 Certify Annual Travel & Expense Management Survey 20166 Concur Q2 2011 T&E Spend Report7 Aberdeen Group, 2015 (“The expense report that writes itself- How close are we?”)8 2016 Runzheimer Workforce Mobility Benchmark Report 9 World at Work: Vehicle-Related Benefits Programs 2015 Report10 2017 Runzheimer internal study11 2013 Fleet Response study 12 NETS, Cost of Motor Vehicle Crashes to Employers- 2015 Report13 U.S. Bureau of Labor Statistics14 2017 Runzheimer time study 15 AAA research http://exchange.aaa.com/automotive/driving-costs/#.WTminOsrLRY 16 NHTSA (“2015 Traffic Safety Facts”) FARS/GES Annual Report17 FASB Issues New Guidance on Lease Accounting http://www.fasb.org/jsp/FASB/ FASBContent_C/NewsPage&cid=1176167901466 18 2016 Automotive Fleet Fact Book19 2017 Runzheimer time study
REFERENCES

[email protected] 800.558.1702 runzheimer.com Copyright © 2017 Runzheimer