vehicle market insights
TRANSCRIPT

Vehicle Market InsightsManheim Used Vehicle Value Index CallOctober 7, 2021
Edit Master text styles

Edit Master text styles 2
Presenters
Mark Schirmer, Director, Public Relations
Jonathan Smoke, Chief Economist
Kayla Reynolds, Economic and Industry Insights Manager
Kevin Chartier, Vice-President, Manheim Consulting
Grace Huang, President, Manheim
coxautoinc.com/newsroompublish.manheim.com/en/services/consulting/used-vehicle-value-index.html

Empower clients to thrive in a rapidly changing marketplace
OUR PURPOSE
OUR VISIONTransform the way the world buys, sells, owns and uses vehicles
JONATHAN SMOKECHIEF ECONOMIST
Edit Master text styles
@smokeoncars

COVID-19 DAILY CASE AND VACCINATION TRENDS
Source: Cox Automotive 5

ECONOMIC ACTIVITY IMPACTED IN SEPTEMBER BY DELTA WAVE AND STORMS
Source: Moody’s Analytics and CNN Business 6

Source: Verisk/Equifax
CONSUMER SPENDING GROWTH SLOWED IN THE SUMMER
7
Total spending in 2021 has exceeded 2019 spending levels; peak spending so far in weeks 13, 17, 26, and 35
0.0
20.0
40.0
60.0
80.0
100.0
120.0
140.0
160.0
1 2 3 4 5 6 7 8 9 101112131415161718192021222324252627282930313233343536
Inde
x R
elat
ive
to S
ame
Wee
k in
201
9
Consumer Spending By Week in 2021Total Vehicles Gas Stations Auto Rental Ride Hail
-60% -40% -20% 0% 20% 40% 60% 80%
AirlinesOther Transportation
Travel AgenciesRide Hail
Auto RentalHotel/Motel
EducationDrug StoresMail Orders
VehiclesRepair Shops
Food StoresClothing Stores
Restaurants/BarsUtilities
Health CareRecreation
Department StoresElectric Appl iance Stores
TotalGas Stations
Wholesale RetailersInter ior Furnishing Stores
Hardware StoresOther Services
Sporting Goods/Toy StoresDiscount Stores
Professional Services
Spending % Change from 2019 for Week Ending Sep 4

RETAIL SALES ESTIMATES SHOW SLOWING MARKET FROM PEAK IN SPRING
Source: Cox Automotive 8
-60.0%
-50.0%
-40.0%
-30.0%
-20.0%
-10.0%
0.0%
10.0%
20.0%
Week 2
Week 3
Week 4
Week 5
Week 6
Week 7
Week 8
Week 9
Week 1
0
Week 1
1
Week 1
2
Week 1
3
Week 1
4
Week 1
5
Week 1
6
Week 1
7
Week 1
8
Week 1
9
Week 2
0
Week 2
1
Week 2
2
Week 2
3
Week 2
4
Week 2
5
Week 2
6
Week 2
7
Week 2
8
Week 2
9
Week 3
0
Week 3
1
Week 3
2
Week 3
3
Week 3
4
Week 3
5
Week 3
6
Week 3
7
Week 3
8
Week 3
9
Week 4
0
Week 4
1
Week 4
2
Week 4
3
Week 4
4
Week 4
5
Week 4
6
Week 4
7
Week 4
8
Week 4
9
Week 5
0
Week 5
1
Week 5
2
2021 and 2020 % Change vs. 2019 in Retail Sales by Week
New Y/Y 20 Used Y/Y 20 New 21/19 Used 21/19

RETAIL INVENTORY REMAINS TIGHT BUT DAYS’ SUPPLY NO LONGER DECLINING
Source: Cox Automotive 9
0
20
40
60
80
100
120
140
160
180
2 4 6 8 10 12 14 16 18 20 22 24 26 28 30 32 34 36 38 40 42 44 46 48 50
New Days’ Supply
2019 2020 2021
0
10
20
30
40
50
60
70
80
90
2 4 6 8 10 12 14 16 18 20 22 24 26 28 30 32 34 36 38 40 42 44 46 48 50
Used Days’ Supply
2019 2020 2021

PREPARING FOR AN “ELECTRIFIED” FUTURE
O C T O B E R 7 , 2 0 2 1

Manheim Is Well-Positioned
$100M+
11,500+Workforce
5.5MVehicles Handled
InfrastructureInvestment
110 NetworkPhysical, Digital and Mobile Sites
6,500+Land Acres
84%Population within 100 miles of a Manheim site
Industry Experience 75+ Years
11

Traditional vs. Electric Vehicles
12
Key drivers of vehicle value differ
A battery pack is the single most costly part of an EV
Consumer adoption of EVs faces skepticism
Battery health as a vital component in increasing confidence in EV performance

Preparing for EV Influx
13
In 2020, Manheim processed roughly 114,000 electrified vehicles*
Preparing for a larger mix of traditional and EVs
The EV market is forecasted to grow to 32.8 million units in 2030**
Kelley Blue Book estimates between now and 2030, there will be about 100 new EV models entering the market
**Source: IHS Markit*Includes battery electric, hybrid and plug-in vehicles

Infrastructure Investment
14
Technology processes and innovations
Vehicle information improvements
Charging stations
EV battery health tool & testing
Specialized equipment, training for employees

EV Battery Health Pilots
15
Spiers New Technologies (SNT) is a leading provider of EV battery life cycle management
Developing a health diagnostic tool in partnership with SNT and powered by Cox Automotive
Battery health pilots at select Manheim locations with high EV volumes
Test being conducted with seven OEM clients

170mi165mi
170mi38.3kWh
Battery Vitals ScorecardEV Battery Vitals are VIN-specific, industry standard, reports leveraging patented algorithm to assess health and improve transparency, trust and valuations for EVs
Battery vitals scoreIndustry standard score informed by key measures of energy in and out
Comparison to new & range snapshotAt birth what is range and battery capability and how much range available today at full charge vs. New
Battery warrantyBattery warranty information included
2020 Hyundai IoniqSE Hatchback
Current Range
Connector Type
State of Charge
Charging Cable
Battery Capacity
Charging Level
EPA Mileage
Battery Warranty
Battery Chemistry
110 mi
CCS
--
Present
38.3 kWh
DC Level 2
170 mi
10 year / 100,00 miles
Lithium Ion
EV informationBattery Health Report (4.7)1
2
3
1
1
3
2
2
16
EV VEHICLE 1
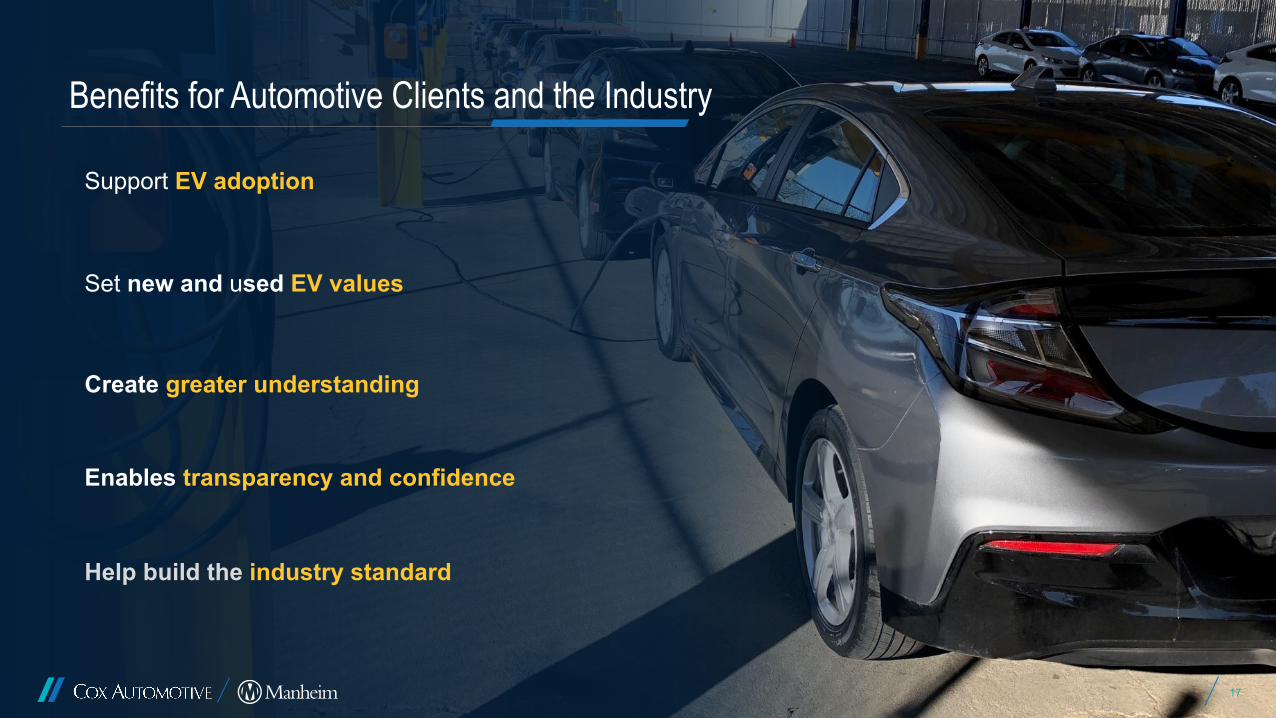
Benefits for Automotive Clients and the Industry
17
Support EV adoption
Set new and used EV values
Create greater understanding
Enables transparency and confidence
Help build the industry standard

Placeholder text Placeholder text
Manheim Used Vehicle Value Index
18
Concept
A single measure of used vehicle price change that is independent of underlying segment shifts in the characteristics of vehicles being sold
Steps
1. All Manheim U.S. sales
2. Classify by market segment
3. Account for differences in mileage
4. Weight to provide smoother segment mix
5. Seasonally adjust

Source: Manheim
WHOLESALE VEHICLE VALUES INCREASE IN SEPTEMBER
19
Prices in September increased 5.3% from August 2021 and were up 27.1% compared to September 2020
204.8
9095
100105110115120125130135140145150155160165170175180185190195200205210215
Jan-95 Jan-98 Jan-01 Jan-04 Jan-07 Jan-10 Jan-13 Jan-16 Jan-19
January 1995 = 100

Source: Manheim 20
Year-over-year price performance set records this spring
Monthly Average = 1.3%
Y/Y PERFORMANCE GROWS AMID NEW HISTORCAL HIGH
27.1%
-20%
-10%
0%
10%
20%
30%
40%
50%
60%
Jan-96 Jan-99 Jan-02 Jan-05 Jan-08 Jan-11 Jan-14 Jan-17 Jan-20

Source: Manheim
WHOLESALE USED VEHICLE PRICES VS. NEW VEHICLE PRICES
21
40
60
80
100
120
140
160
180
200
Jan-12
Apr-12
Jul-1
2
Oct-12
Jan-13
Apr-13
Jul-1
3
Oct-13
Jan-14
Apr-14
Jul-1
4
Oct-14
Jan-15
Apr-15
Jul-1
5
Oct-15
Jan-16
Apr-16
Jul-1
6
Oct-16
Jan-17
Apr-17
Jul-1
7
Oct-17
Jan-18
Apr-18
Jul-1
8
Oct-18
Jan-19
Apr-19
Jul-1
9
Oct-19
Jan-20
Apr-20
Jul-2
0
Oct-20
Jan-21
Apr-21
Jul-2
1
New Vehicle ATP Manheim Non-Adjusted Price

VANS OUTPERFORMING OTHER SEGMENTS
Source: Manheim 22
PERCENT CHANGE IN MANHEIM INDEX YEAR-OVER-YEAR SEPTEMBER 2021
27.1%25.6% 24.6% 24.1%
17.8%
28.2%
40.9%
0%
5%
10%
15%
20%
25%
30%
35%
40%
45%
Industry Compact cars Midsize cars Luxury cars Pickups SUV/CUV Vans
Source: Manheim 23
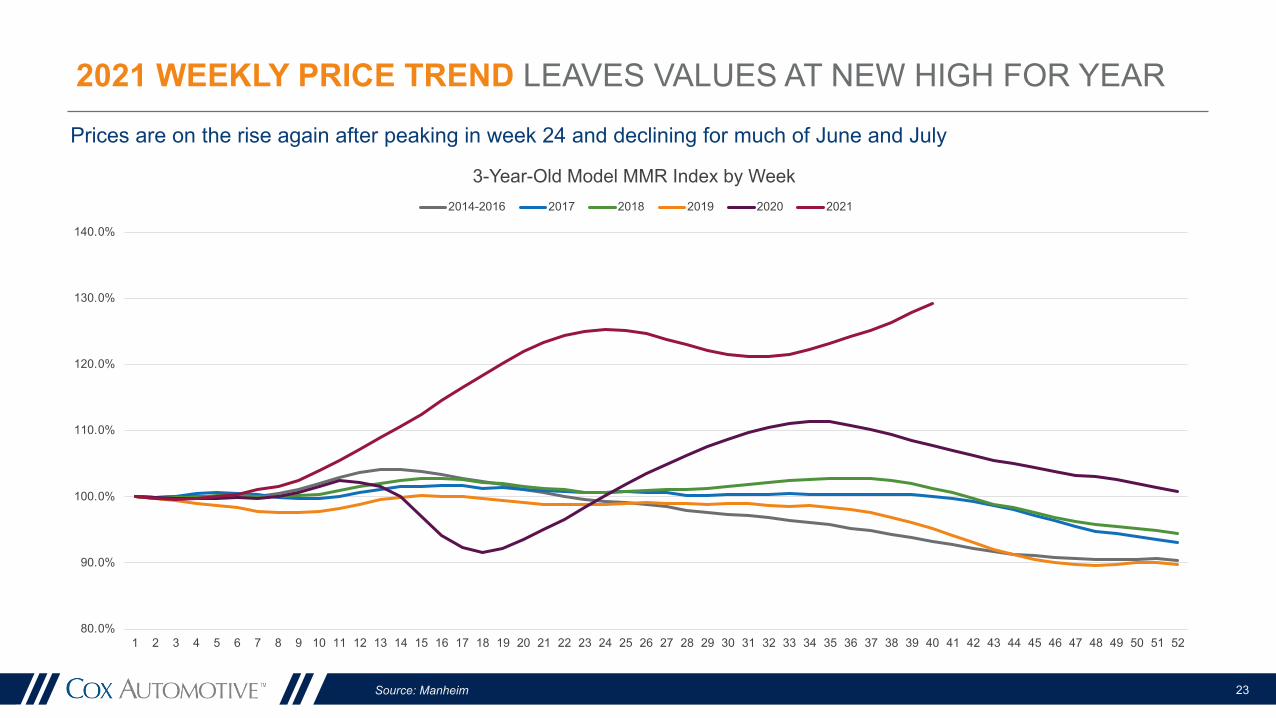
Prices are on the rise again after peaking in week 24 and declining for much of June and July
2021 WEEKLY PRICE TREND LEAVES VALUES AT NEW HIGH FOR YEAR
80.0%
90.0%
100.0%
110.0%
120.0%
130.0%
140.0%
1 2 3 4 5 6 7 8 9 10 11 12 13 14 15 16 17 18 19 20 21 22 23 24 25 26 27 28 29 30 31 32 33 34 35 36 37 38 39 40 41 42 43 44 45 46 47 48 49 50 51 52
3-Year-Old Model MMR Index by Week2014-2016 2017 2018 2019 2020 2021
Source: Manheim 24
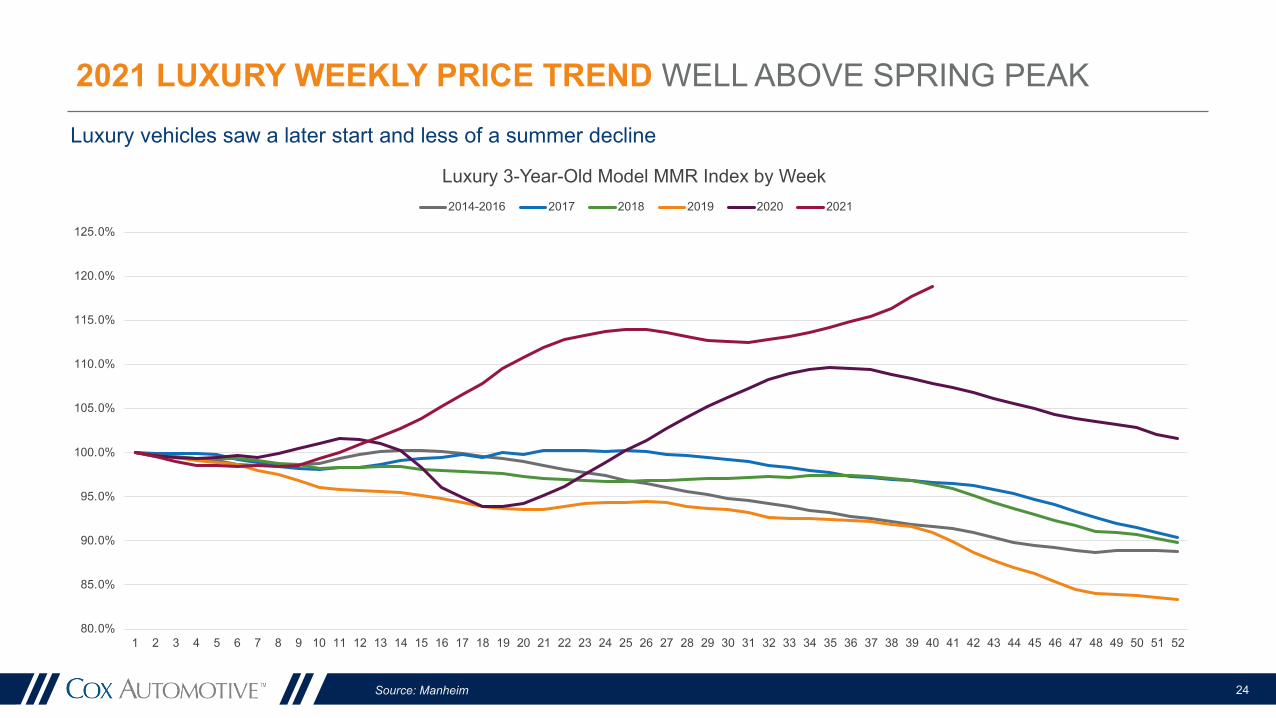
Luxury vehicles saw a later start and less of a summer decline
2021 LUXURY WEEKLY PRICE TREND WELL ABOVE SPRING PEAK
80.0%
85.0%
90.0%
95.0%
100.0%
105.0%
110.0%
115.0%
120.0%
125.0%
1 2 3 4 5 6 7 8 9 10 11 12 13 14 15 16 17 18 19 20 21 22 23 24 25 26 27 28 29 30 31 32 33 34 35 36 37 38 39 40 41 42 43 44 45 46 47 48 49 50 51 52
Luxury 3-Year-Old Model MMR Index by Week2014-2016 2017 2018 2019 2020 2021

Source: Manheim
ONE-YEAR-OLD PRICES ALSO AT NEW PEAK
25
One-year-old vehicle prices peaked later and saw less depreciation in June and July
80.0%
85.0%
90.0%
95.0%
100.0%
105.0%
110.0%
115.0%
120.0%
125.0%
130.0%
1 2 3 4 5 6 7 8 9 10 11 12 13 14 15 16 17 18 19 20 21 22 23 24 25 26 27 28 29 30 31 32 33 34 35 36 37 38 39 40 41 42 43 44 45 46 47 48 49 50 51 52
1-Year-Old Model MMR Index by Week2014-2016 2017 2018 2019 2020 2021

Source: Manheim
RESALE VALUE CHANGE RECORD INCREASES ACROSS THE BOARD
26
After brief mid-summer pause. Resale Values are Breaking Records again
Near New Segments Leading the Charge
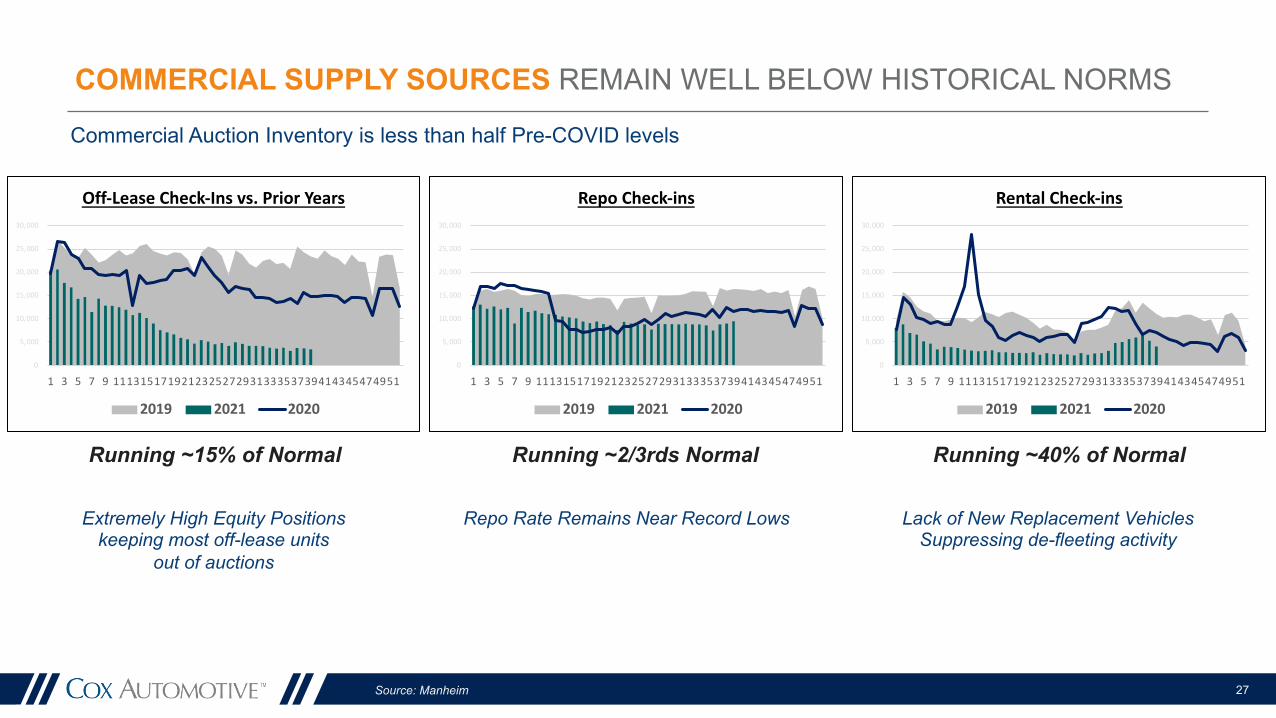
COMMERCIAL SUPPLY SOURCES REMAIN WELL BELOW HISTORICAL NORMS
Source: Manheim 27
Commercial Auction Inventory is less than half Pre-COVID levels
0
5,000
10,000
15,000
20,000
25,000
30,000
1 3 5 7 9 111315171921232527293133353739414345474951
Off-Lease Check-Ins vs. Prior Years
2019 2021 2020
0
5,000
10,000
15,000
20,000
25,000
30,000
1 3 5 7 9 111315171921232527293133353739414345474951
Repo Check-ins
2019 2021 2020
0
5,000
10,000
15,000
20,000
25,000
30,000
1 3 5 7 9 111315171921232527293133353739414345474951
Rental Check-ins
2019 2021 2020
Extremely High Equity Positions keeping most off-lease units
out of auctions
Repo Rate Remains Near Record Lows Lack of New Replacement VehiclesSuppressing de-fleeting activity
Running ~15% of Normal Running ~2/3rds Normal Running ~40% of Normal

Source: Manheim 28
Sales Conversion back up near historic highs following brief correction in June/July
LEADING INDICATOR STRONG DEALER DEMAND RETURNED IN AUGUST
66.3%
0.0%
10.0%
20.0%
30.0%
40.0%
50.0%
60.0%
70.0%
80.0%
90.0%
1 2 3 4 5 6 7 8 9 10 11 12 13 14 15 16 17 18 19 20 21 22 23 24 25 26 27 28 29 30 31 32 33 34 35 36 37 38 39 40 41 42 43 44 45 46 47 48 49 50 51 52 53
Sales Conversion Trends
2019 2020 2021
High Sales Conversion Rate indicates strong wholesale demand likely through October

Source: Kelley Blue Book 29
Retention values peaked up 22 percentage points vs. 2019 in June, but now at record +26 percentage points
RETENTION VALUES ALSO UP TO NEW RECORD
(1- to 3-year-old models)45%
50%
55%
60%
65%
70%
75%
80%
85%
Jan Feb Mar Apr May Jun Jul Aug Sep Oct Nov Dec
Auction Retention Value(1-3 year old vehicles)
CY 2019 CY 2020 CY 2021

Source: Manheim
RENTAL RISK AVERAGE AUCTION PRICES
30
Average price for rental risk units sold in September up 37% y/y and up 12% m/m
$10,000
$12,000
$14,000
$16,000
$18,000
$20,000
$22,000
$24,000
$26,000
$28,000
$30,000
1 2 3 4 5 6 7 8 9 10 11 12
20172018201920202021

Source: Manheim
RENTAL RISK VEHICLE VARIETY REPRESENTED IN SALES
31
2019 Q3 2020 Q3 2021 Q3
Number of unique year, make, model,body configurations
sold3,496 3,903 2,890
Share accounted for top 10 YMMB 12.7% 16.9% 17.2%
Share accounted for top 25 YMMB 23.6% 30.0% 30.0%
Number of YMMB to reach 50% share 106 75 77

Source: Manheim
RENTAL RISK AVERAGE MILEAGE
32
Average mileage for rental risk units in September was up 33% compared to a year ago and down 19% m/m
56,611
20,000
30,000
40,000
50,000
60,000
70,000
80,000
90,000
100,000
Jan-03 Jan-05 Jan-07 Jan-09 Jan-11 Jan-13 Jan-15 Jan-17 Jan-19 Jan-21
Source: Manheim
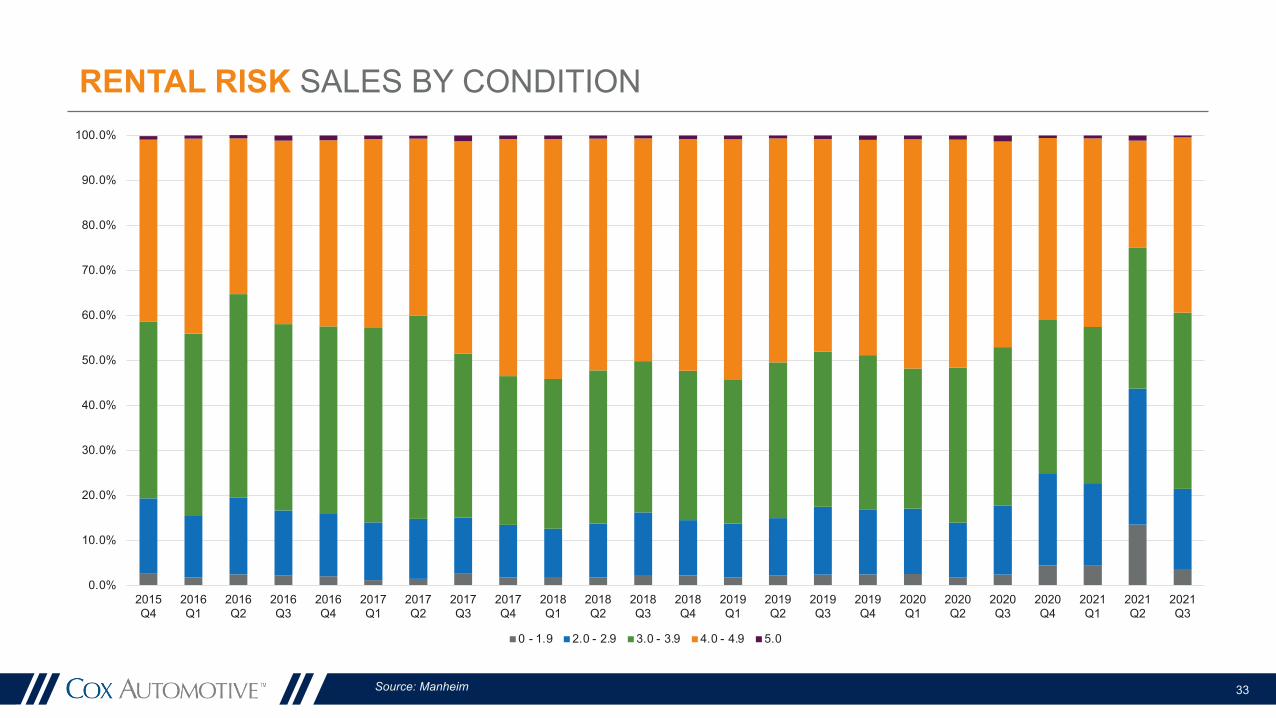
RENTAL RISK SALES BY CONDITION
33
0.0%
10.0%
20.0%
30.0%
40.0%
50.0%
60.0%
70.0%
80.0%
90.0%
100.0%
2015Q4
2016Q1
2016Q2
2016Q3
2016Q4
2017Q1
2017Q2
2017Q3
2017Q4
2018Q1
2018Q2
2018Q3
2018Q4
2019Q1
2019Q2
2019Q3
2019Q4
2020Q1
2020Q2
2020Q3
2020Q4
2021Q1
2021Q2
2021Q3
0 - 1.9 2.0 - 2.9 3.0 - 3.9 4.0 - 4.9 5.0

Source: Manheim
RENTAL RISK SALES BY MAKE
34
0%
10%
20%
30%
40%
50%
60%
70%
80%
90%
100%
2015Q4
2016Q1
2016Q2
2016Q3
2016Q4
2017Q1
2017Q2
2017Q3
2017Q4
2018Q1
2018Q2
2018Q3
2018Q4
2019Q1
2019Q2
2019Q3
2019Q4
2020Q1
2020Q2
2020Q3
2020Q4
2021Q1
2021Q2
2021Q3
All other
Mazda
Kia
Jeep
VW
Chrysler
Hyundai
Dodge
Toyota
Nissan
Ford
Chevrolet

Source: Manheim
RENTAL RISK SALES BY VEHICLE SEGMENT
35
0%
10%
20%
30%
40%
50%
60%
70%
80%
90%
100%
2015Q4
2016Q1
2016Q2
2016Q3
2016Q4
2017Q1
2017Q2
2017Q3
2017Q4
2018Q1
2018Q2
2018Q3
2018Q4
2019Q1
2019Q2
2019Q3
2019Q4
2020Q1
2020Q2
2020Q3
2020Q4
2021Q1
2021Q2
2021Q3
Van
SUV
Sports Car
Pickup
Luxury Car
Midsize Car
Compact Car
Source: Manheim
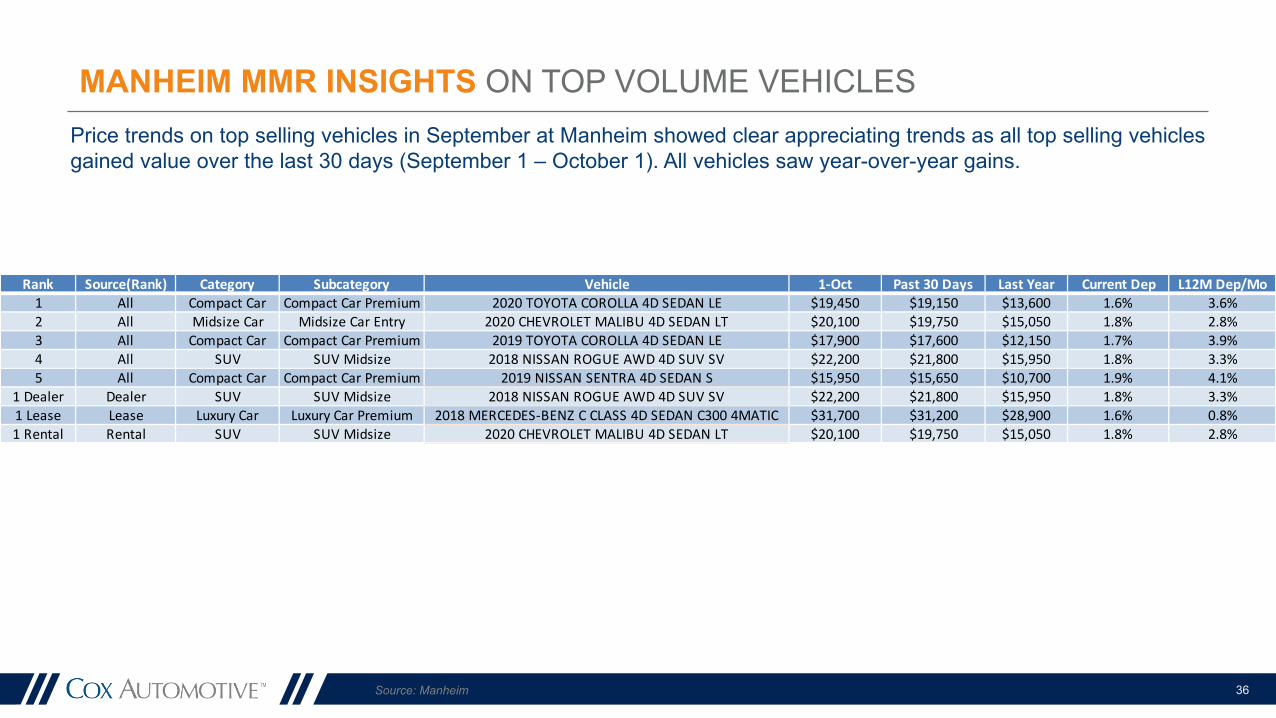
MANHEIM MMR INSIGHTS ON TOP VOLUME VEHICLES
36
Price trends on top selling vehicles in September at Manheim showed clear appreciating trends as all top selling vehicles gained value over the last 30 days (September 1 – October 1). All vehicles saw year-over-year gains.
.Rank Source(Rank) Category Subcategory Vehicle 1-Oct Past 30 Days Last Year Current Dep L12M Dep/Mo1 All Compact Car Compact Car Premium 2020 TOYOTA COROLLA 4D SEDAN LE $19,450 $19,150 $13,600 1.6% 3.6%2 All Midsize Car Midsize Car Entry 2020 CHEVROLET MALIBU 4D SEDAN LT $20,100 $19,750 $15,050 1.8% 2.8%3 All Compact Car Compact Car Premium 2019 TOYOTA COROLLA 4D SEDAN LE $17,900 $17,600 $12,150 1.7% 3.9%4 All SUV SUV Midsize 2018 NISSAN ROGUE AWD 4D SUV SV $22,200 $21,800 $15,950 1.8% 3.3%5 All Compact Car Compact Car Premium 2019 NISSAN SENTRA 4D SEDAN S $15,950 $15,650 $10,700 1.9% 4.1%
1 Dealer Dealer SUV SUV Midsize 2018 NISSAN ROGUE AWD 4D SUV SV $22,200 $21,800 $15,950 1.8% 3.3%1 Lease Lease Luxury Car Luxury Car Premium 2018 MERCEDES-BENZ C CLASS 4D SEDAN C300 4MATIC $31,700 $31,200 $28,900 1.6% 0.8%1 Rental Rental SUV SUV Midsize 2020 CHEVROLET MALIBU 4D SEDAN LT $20,100 $19,750 $15,050 1.8% 2.8%
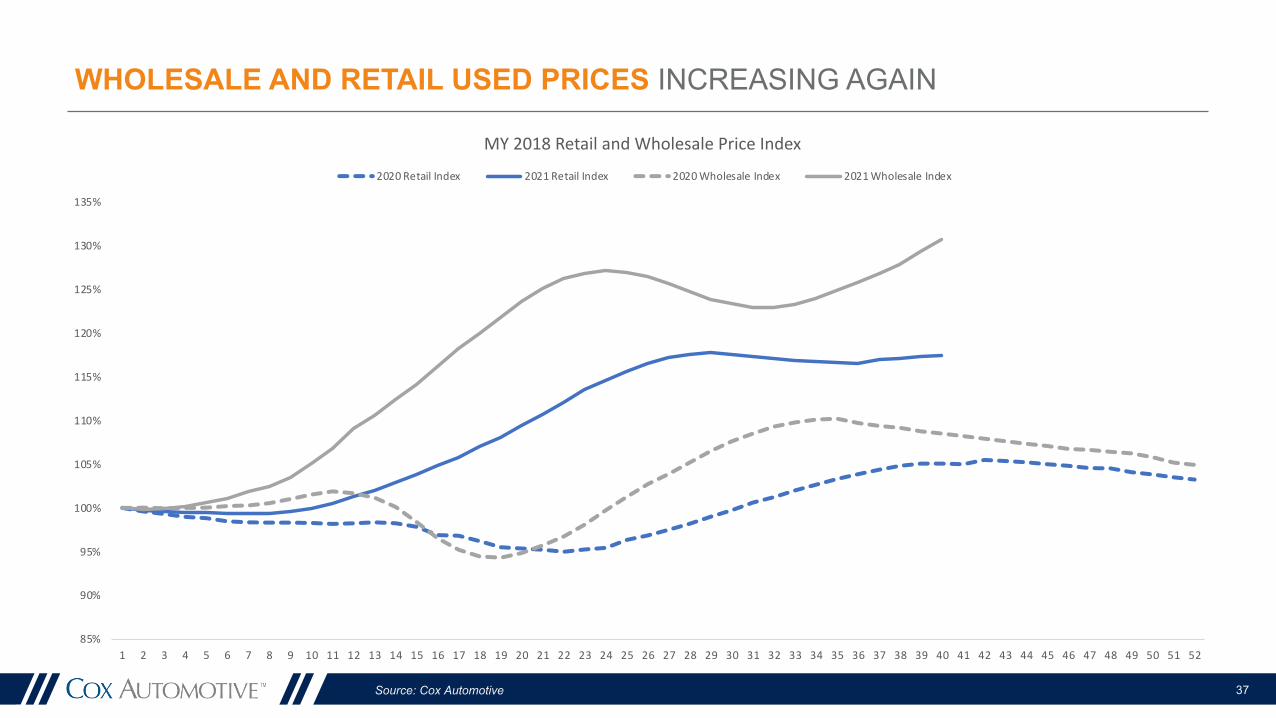
WHOLESALE AND RETAIL USED PRICES INCREASING AGAIN
Source: Cox Automotive 37
85%
90%
95%
100%
105%
110%
115%
120%
125%
130%
135%
1 2 3 4 5 6 7 8 9 10 11 12 13 14 15 16 17 18 19 20 21 22 23 24 25 26 27 28 29 30 31 32 33 34 35 36 37 38 39 40 41 42 43 44 45 46 47 48 49 50 51 52
MY 2018 Retail and Wholesale Price Index
2020 Retail Index 2021 Retail Index 2020 Wholesale Index 2021 Wholesale Index

DEC 2021 Y/Y MANHEIM USED VEHICLE VALUE
INDEX
+30%
NEW LEASE VOLUME
3.5M 2.7MCPO SALES
2.2MFLEET SALES
26%LEASE
PENETRATION
NEW RETAIL SALES13.3M
2021FORECASTS
15.5MNEW SALES
38
21.4MUSED RETAIL SALES
39.2MUSED SALES

DEC 2022 Y/Y MANHEIM USED VEHICLE VALUE
INDEX
-2%
NEW LEASE VOLUME
3.8M 2.9MCPO SALES
2.7MFLEET SALES
28%LEASE
PENETRATION
NEW RETAIL SALES13.6M
2022FORECASTS
16.3MNEW SALES
39
22.1MUSED RETAIL SALES
39.3MUSED SALES

TOTAL WHOLESALE VOLUMES WILL REMAIN BELOW PEAK
Source: Cox Automotive 40
2021 will see little growth from 10% decline in 2020; modest 2% growth expected in 2022 followed by decline in 2023
6.0 6.5 6.7 6.9 6.6 6.8 6.27.6 7.7 7.5 7.3
2.22.5
3.03.4 3.8
4.14.1
4.0 3.93.3 3.51.2
1.3
1.51.6 1.6
1.7
1.3
1.1 1.21.3 1.5
1.2
1.4
1.41.4 1.7
1.7
1.40.5 0.7
1.11.5
1.2
1.0
0.90.8 0.6
0.7
0.5 0.4 0.4 0.40.4
11.8
12.7
13.514.1 14.3
15.0
13.5 13.6 13.9 13.614.2
0.0
2.0
4.0
6.0
8.0
10.0
12.0
14.0
16.0
2014 2015 2016 2017 2018 2019 2020 2021 2022 2023 2024
Mill
ion
Uni
ts
Estimated Wholesale Volumes by Inflow Channel (Annual Volume)
Dealer Off Lease Repo Rental Risk Factory/Other Total

THANK YOU!
Contact Information:
Dara HailesManager, Public RelationsCox [email protected]
Mark SchirmerDirector, Public RelationsCox [email protected]
For additional content from Cox Automotive, visit the Newsroom at www.coxautoinc.com/newsroom/, sign up for From the Newsroom, our biweekly newsletter at www.coxautoinc.com/signup and bookmark the new Auto Market Snapshot.