ventsim manual
TRANSCRIPT

Ventsim software
Ventsim Visual™
Standard and Advanced Versions
(Version 2.5)
Ventsim Visual™ User Guide

Page | 2
V E N T S I M S O F T W A R E

Page | 3
Ventsim Visual™ User Guide
Volume 1 Version 2.4
The author and the supplier has no liability to the licensee or any other person or entity for any damage or loss, including special, incidental or consequential damages caused by this product directly or indirectly.
The software is supplied as is without warranty of any kind, either expressed or implied. Warranties of merchantability or of fitness for any purpose are specifically disclaimed.
Ventsim Software
By Chasm Consulting
PO Box 2006
Aitkenvale Qld 4814

Page | 4
Preface
This manual presents a guide to the effective use of Ventsim Visual™ ventilation software for mine ventilation simulation and design. It does not profess to be a ventilation engineering guide and as such should not be used as a substitute for existing ventilation texts for underground ventilation and environmental engineering.
The manual may contain simplifications and does not attempt to explain many of the complex concepts and methods used in mine environmental engineering. It is highly recommended that users of Ventsim Visual™ have at least a basic understanding of ventilation and simulation concepts in order to correctly input and interpret the program functions and results. Many excellent texts and papers exist for mine ventilation, not the least which is the late Malcolm J McPherson’s ‘Subsurface Ventilation and Environmental Engineering’, from which Ventsim Visual™ draws much of the methodology for thermodynamic simulation.
Finally, special thanks to Dr Rick Brake for his assistance during the development of Ventsim Visual.

Page | 5
Table of Contents
PREFACE ................................................................................................................................................................... 4
TABLE OF CONTENTS ................................................................................................................................................ 5
1 VENTSIM VISUAL™ – AN INTRODUCTION .................................................................................... 13
1.1 ABOUT VENTSIM VISUAL™ ......................................................................................................... 13 1.2 COMPUTER HARDWARE REQUIREMENTS ....................................................................................... 14
2 VENTSIM CLASSIC 3.9 TO VISUAL GUIDE ...................................................................................... 16
2.1 DISPLAY .................................................................................................................................. 16 2.2 ANIMATION ............................................................................................................................. 16 2.3 ELEVATION DATABASE (LEVELS) ................................................................................................... 17 2.4 AIRWAYS ................................................................................................................................. 17 2.5 DATA ...................................................................................................................................... 17
2.5.1 Colour and Data Manager ................................................................................ 17 2.6 COORDINATES .......................................................................................................................... 18 2.7 EDITING AND INFORMATION ........................................................................................................ 18
2.7.1 The Edit Box ...................................................................................................... 18 2.7.2 The Information Tab ......................................................................................... 18 2.7.3 Modifying Data ................................................................................................. 18
2.8 REFERENCED GRAPHICS .............................................................................................................. 18 2.9 EXPERIMENT ! .......................................................................................................................... 19
3 THE VIEW WINDOW .................................................................................................................... 20
3.1 POINT OF FOCUS ....................................................................................................................... 21 3.2 USER CONTROL SUMMARY ......................................................................................................... 22 3.3 THE EDIT PLANE ........................................................................................................................ 23 3.4 DRAWING IN THE THIRD DIMENSION ............................................................................................. 24
3.4.1 The True Vertical Guide .................................................................................... 24 3.4.2 Drawing Airways .............................................................................................. 25 3.4.3 Manual Coordinate Entry ................................................................................. 26 3.4.4 Copying Airways ............................................................................................... 26 3.4.5 Moving Icons .................................................................................................... 27 3.4.6 Moving Airways ................................................................................................ 27
4 MENU BAR .................................................................................................................................. 30
4.1 THE INTERFACE ......................................................................................................................... 30 4.2 FILE MENU .............................................................................................................................. 31
4.2.1 New / Close ....................................................................................................... 31 4.2.2 Open ................................................................................................................. 31 4.2.3 Save .................................................................................................................. 31 4.2.4 Save As .............................................................................................................. 31 4.2.5 Merge ............................................................................................................... 32 4.2.6 Master Link ....................................................................................................... 32 4.2.7 Inherit ............................................................................................................... 33 4.2.8 Defaults ............................................................................................................ 34 4.2.9 Icons.................................................................................................................. 34 4.2.10 FILE TOOLS ........................................................................................................ 35 4.2.11 Compare ........................................................................................................... 35 4.2.12 Security ............................................................................................................. 35 4.2.13 Save Picture ...................................................................................................... 36

Page | 6
4.2.14 Import ............................................................................................................... 36 4.2.15 Export DXF ........................................................................................................ 40 4.2.16 Manage References .......................................................................................... 40 4.2.17 Title Note .......................................................................................................... 41 4.2.18 File Memo ......................................................................................................... 41 4.2.19 Page Setup / Print / Print Preview .................................................................... 41 4.2.20 Previous File Listing .......................................................................................... 41 4.2.21 Load Demonstration ......................................................................................... 41 4.2.22 License Manager .............................................................................................. 41 4.2.23 Exit .................................................................................................................... 43
4.3 EDIT MENU.............................................................................................................................. 44 4.3.1 Undo ................................................................................................................. 44 4.3.2 Redo .................................................................................................................. 44 4.3.3 Copy and Paste Airways ................................................................................... 44 4.3.4 Clone and Apply Attributes ............................................................................... 44 4.3.5 Lock Target ....................................................................................................... 45 4.3.6 Lock Transparency ............................................................................................ 45 4.3.7 Lock Vertical ..................................................................................................... 45 4.3.8 Lock On References ........................................................................................... 45 4.3.9 Check Intercept ................................................................................................. 46 4.3.10 New Airways ..................................................................................................... 46 4.3.11 Find / Find Next / Find ALL ................................................................................ 46 4.3.12 Highlight or Select All ....................................................................................... 47
4.4 VIEW MENU ............................................................................................................................ 47 4.4.1 Fit All ................................................................................................................. 47 4.4.2 Show All ............................................................................................................ 47 4.4.3 Show All ............................................................................................................ 47 4.4.4 Quick View ........................................................................................................ 48 4.4.5 Copy to clipboard .............................................................................................. 48 4.4.6 Copy to clipboard (all)....................................................................................... 48 4.4.7 Snapshot ........................................................................................................... 48 4.4.8 Set Edit Centre .................................................................................................. 49 4.4.9 Colour Manager ................................................................................................ 49 4.4.10 Display Manager .............................................................................................. 51 4.4.11 Animate Flows .................................................................................................. 51 4.4.12 Text Data .......................................................................................................... 51 4.4.13 Limit Data ......................................................................................................... 51 4.4.14 Transparency .................................................................................................... 53 4.4.15 Hide Zero Flow .................................................................................................. 53 4.4.16 Hide Excluded ................................................................................................... 53
4.5 SAVED VIEW MENU ................................................................................................................... 53 4.5.1 Save View.......................................................................................................... 53 4.5.2 Delete View ....................................................................................................... 53 4.5.3 Saved Views ...................................................................................................... 53
4.6 RUN MENU.............................................................................................................................. 54 4.6.1 Thermo-dynamics [ADVANCED] ....................................................................... 54 4.6.2 Diesel particulates [ADVANCED] ....................................................................... 55 4.6.3 Recirculation [ADVANCED] ............................................................................... 55 4.6.4 Financial Simulation Selected ........................................................................... 56 [ADVANCED] ................................................................................................................... 56 4.6.5 Financial Simulation Global .............................................................................. 59 [ADVANCED] ................................................................................................................... 59 4.6.6 Contaminant Simulations ................................................................................. 59 4.6.7 Summary........................................................................................................... 59
4.7 TOOLS MENU ........................................................................................................................... 62 4.7.1 Fans .................................................................................................................. 62

Page | 7
4.7.2 Levels ................................................................................................................ 65 4.7.3 Spreadsheet ...................................................................................................... 66 4.7.4 Utilities.............................................................................................................. 67 4.7.5 Filtering Tools ................................................................................................... 67 4.7.6 Binding .............................................................................................................. 69 4.7.7 Duplicates ......................................................................................................... 70 4.7.8 Convert To 3D ................................................................................................... 71 4.7.9 Select Loose ...................................................................................................... 71 4.7.10 Swap Axis .......................................................................................................... 71 4.7.11 Rotate Coordinates ........................................................................................... 71 4.7.12 Scale Coordinates ............................................................................................. 72 4.7.13 Scale Airway Size .............................................................................................. 72 4.7.14 Airways ............................................................................................................. 72 4.7.15 Auto Name ........................................................................................................ 72 4.7.16 Limit Display Data............................................................................................. 72 4.7.17 Resequence Index/Unique Numbers ................................................................. 72 4.7.18 Troubleshoot ..................................................................................................... 73 4.7.19 Conversions ....................................................................................................... 73 4.7.20 Presets .............................................................................................................. 74 4.7.21 Settings ............................................................................................................. 75
4.8 WINDOWS MENU ..................................................................................................................... 76 4.8.1 Fit All ................................................................................................................. 76 4.8.2 Zoom Out .......................................................................................................... 76
5 PRESETS ....................................................................................................................................... 77
5.1 PRESET VALUES ........................................................................................................................ 77 5.1.1 Preset Values .................................................................................................... 77 5.1.2 Sort Order ......................................................................................................... 78
5.2 ACCESSING PRESETS .................................................................................................................. 78 5.2.1 Resistance ......................................................................................................... 79 5.2.2 Friction .............................................................................................................. 79 5.2.3 Shock ................................................................................................................ 79 5.2.4 Heat .................................................................................................................. 79 5.2.5 Layer Prim, Layer Sec, Air Type ......................................................................... 79 5.2.6 Fans .................................................................................................................. 79 5.2.7 Airways ............................................................................................................. 79 5.2.8 Profiles .............................................................................................................. 79
6 SETTINGS ..................................................................................................................................... 81
6.1 AIRWAY DEFAULTS .................................................................................................................... 81 6.2 COLOUR SETTINGS ..................................................................................................................... 82 6.3 GRAPHICS ................................................................................................................................ 84 6.4 COSTING ................................................................................................................................. 87 6.5 SIMULATION – AIRFLOW............................................................................................................. 89 6.6 SIMULATION – HEAT [ADVANCED] ............................................................................................ 94
6.6.1 Simulation Environments [ADVANCED] ............................................................ 97 6.6.2 Examples of Rock Properties ........................................................................... 100
6.7 SIMULATION CONTAMINANTS .................................................................................................... 101 6.8 VENTSIM PROGRAM SETTINGS ................................................................................................... 103
7 THE TOOLBAR ............................................................................................................................ 105
7.1 FILE INPUT AND OUTPUT FUNCTIONS .......................................................................................... 105 7.1.1 New File .......................................................................................................... 105 7.1.2 Open File ......................................................................................................... 105 7.1.3 Save File .......................................................................................................... 105 7.1.4 Copy ................................................................................................................ 105

Page | 8
7.1.5 Paste ............................................................................................................... 105 7.2 UTILITY FUNCTIONS ................................................................................................................. 105
7.2.1 Undo ............................................................................................................... 105 7.2.2 Redo ................................................................................................................ 105 7.2.3 Find ................................................................................................................. 105 7.2.4 Data Category................................................................................................. 106 7.2.5 Data Type ....................................................................................................... 107
7.3 AIRWAY EDITING FUNCTIONS .................................................................................................... 107 7.3.1 View ................................................................................................................ 107 7.3.2 Add ................................................................................................................. 107 7.3.3 Draw - Convert ................................................................................................ 110 7.3.4 Edit .................................................................................................................. 111 7.3.5 Select .............................................................................................................. 111 7.3.6 Multi Select Options ....................................................................................... 111 7.3.7 Delete ............................................................................................................. 112 7.3.8 Deletion Options ............................................................................................. 112 7.3.9 Block ............................................................................................................... 112 7.3.10 Move ............................................................................................................... 113 7.3.11 Copy ................................................................................................................ 113 7.3.12 Reverse ........................................................................................................... 114 7.3.13 Insert Node ..................................................................................................... 114 7.3.14 Contaminant ................................................................................................... 114
7.4 VIEWING FUNCTIONS ............................................................................................................... 115 7.4.1 Display Manager ............................................................................................ 115 7.4.2 Colour Manager .............................................................................................. 117 7.4.3 Colour Manager Sub Menu ............................................................................. 120 7.4.4 Flow Animation ............................................................................................... 120
7.5 SIMULATION FUNCTIONS .......................................................................................................... 121 7.5.1 Airflow Simulation .......................................................................................... 121 7.5.2 Heat Simulation .............................................................................................. 121 7.5.3 Contaminant Simulation ................................................................................. 121 7.5.4 Diesel DPM [Advanced] .................................................................................. 122 7.5.5 Recirculation Simulation [ADVANCED] ........................................................... 123 7.5.6 Financial Simulation [ADVANCED] .................................................................. 123
8 THE EDIT BOX ............................................................................................................................ 124
8.1.1 File > Create Picture ........................................................................................ 124 8.1.2 Select Airways ................................................................................................. 124 8.1.3 Tools – Convert fix to resistance ..................................................................... 125 8.1.4 Pressure Survey Tools ..................................................................................... 125 8.1.5 Apply Gradient Slope ...................................................................................... 126 8.1.6 Distribute Rock Age ........................................................................................ 126 8.1.7 Custom Resistance to Friction Factors ............................................................ 126 8.1.8 Customer Linear Resistance to Friction Factors .............................................. 126
8.2 AIRWAY TAB .......................................................................................................................... 126 8.2.1 Airway Names and Coordinates ..................................................................... 127 8.2.2 Airway Size...................................................................................................... 127 8.2.3 Airway Options ............................................................................................... 129 8.2.4 Airway Attributes ............................................................................................ 131
8.3 FANS .................................................................................................................................... 133 8.3.1 Fan Duty Point ................................................................................................ 136 8.3.2 Fans Stalled, Low Pressure or Negated........................................................... 136 8.3.3 Fan Pressure Curve ......................................................................................... 137 8.3.4 Fan Efficiency Curve ........................................................................................ 137 8.3.5 Fan Power Curve ............................................................................................. 137
8.4 HEAT TAB (ADVANCED VERSION) .............................................................................................. 137
Page | 9
8.4.1 Heat and Cooling ............................................................................................ 138 8.4.2 Rock Conditions .............................................................................................. 140 8.4.3 Heat Simulation Results .................................................................................. 142
8.5 CONTAMINANT ....................................................................................................................... 143 8.5.1 Contaminant Options (Dynamic) .................................................................... 143 8.5.2 Contaminant Source Button ........................................................................... 144 8.5.3 Sourcing Location Tools .................................................................................. 144
8.6 INFORMATION ........................................................................................................................ 144 8.6.1 Fan and Fixed Information .............................................................................. 145 8.6.2 Pressure Information ...................................................................................... 147 8.6.3 Heat Data ....................................................................................................... 147
8.7 NOTES .................................................................................................................................. 148
9 HEAT ASSISTANT ....................................................................................................................... 149
9.1.1 Airflow # 1 ...................................................................................................... 149 9.1.2 Airflow # 2 ...................................................................................................... 150 9.1.3 Diesel Engine .................................................................................................. 150 9.1.4 Diesel Fuel ....................................................................................................... 151 9.1.5 Electric ............................................................................................................ 152 9.1.6 Water Flow ..................................................................................................... 152
10 POPUP CONTEXT MENU ............................................................................................................ 154
10.1.1 Fit All ............................................................................................................... 154 10.1.2 Saved Views .................................................................................................... 154 10.1.3 Zoom Out ........................................................................................................ 154 10.1.4 Animate .......................................................................................................... 154 10.1.5 Flight ............................................................................................................... 155 10.1.6 Select Level ..................................................................................................... 155 10.1.7 Show All .......................................................................................................... 156 10.1.8 View ................................................................................................................ 156 10.1.9 Select .............................................................................................................. 156 10.1.10 Add ................................................................................................................. 156 10.1.11 Edit .................................................................................................................. 156 10.1.12 Block ............................................................................................................... 156 10.1.13 Delete ............................................................................................................. 156 10.1.14 Move ............................................................................................................... 156 10.1.15 Copy Airway .................................................................................................... 156 10.1.16 Copy Attributes ............................................................................................... 156 10.1.17 Paste Attributes .............................................................................................. 157 10.1.18 Reverse ........................................................................................................... 157 10.1.19 Solids ............................................................................................................... 157 10.1.20 Grid ................................................................................................................. 157 10.1.21 Text ................................................................................................................. 157 10.1.22 Node ............................................................................................................... 157 10.1.23 Icons................................................................................................................ 157 10.1.24 Perspective ..................................................................................................... 157 10.1.25 Arrows ............................................................................................................ 157 10.1.26 References ...................................................................................................... 157 10.1.27 Reconnect DirectX ........................................................................................... 157
11 BUILDING A NETWORK .............................................................................................................. 158
11.1 OVERVIEW ............................................................................................................................. 158 11.2 TYPE OF MODELS .................................................................................................................... 158
11.2.1 Network Types ................................................................................................ 158 11.3 INITIAL MODEL CONSTRUCTION ................................................................................................. 160
11.3.1 Manual Scaled Construction ........................................................................... 160

Page | 10
11.3.2 Manual Schematic Construction ..................................................................... 161 11.3.3 Spreadsheet Text Import ................................................................................ 161 11.3.4 DXF Graphics Import ....................................................................................... 161 11.3.5 Correcting Errors ............................................................................................. 162 11.3.6 Ventilation Pathways ...................................................................................... 163 11.3.7 Ventilation Ducting and Blind Headings ......................................................... 165 11.3.8 Interconnecting Mine Airways ........................................................................ 165
11.4 CREATE AND INSTALL FANS ....................................................................................................... 166 11.4.1 Fans ................................................................................................................ 166 11.4.2 Fixed Airflow ................................................................................................... 167 11.4.3 Fixed Pressure ................................................................................................. 169
11.5 UTILIZING LAYERS .................................................................................................................... 169 11.5.1 Primary Layers ................................................................................................ 169 11.5.2 Secondary Layers ............................................................................................ 169 11.5.3 Using Layers.................................................................................................... 170
11.6 SUMMARY ............................................................................................................................. 170
12 CONTAMINANT SIMULATION .................................................................................................... 172
12.1 INTRODUCTION ....................................................................................................................... 172 12.2 CONTAMINANT STEADY STATE ................................................................................................... 172 12.3 CONTAMINANT DYNAMIC ......................................................................................................... 173 12.4 FIXED / LINEAR / LOGARITHMIC RELEASE ..................................................................................... 173 12.5 DYNAMIC BLAST CONTAMINATION ............................................................................................. 174 12.6 CONTAMINANT SOURCING ........................................................................................................ 175 12.7 LOCATION TOOL...................................................................................................................... 175 12.8 FIRE SIMULATION? .................................................................................................................. 176
13 GAS SIMULATION ...................................................................................................................... 178
13.1 INTRODUCTION ....................................................................................................................... 178 13.1.1 Inline Concentration Method .......................................................................... 178 13.1.2 Injection Method ............................................................................................ 178
13.2 SIMULATING GAS SOURCES ....................................................................................................... 179 13.2.1 Placing Gas Sources ........................................................................................ 179 13.2.2 Simulating Results .......................................................................................... 180
13.3 DENSITY BASED SIMULATION OF GAS .......................................................................................... 180
14 THERMODYNAMIC SIMULATION ............................................................................................... 182
14.1 INTRODUCTION ....................................................................................................................... 182 14.1.1 Sources of Heat ............................................................................................... 182 14.1.2 Source of Moisture ......................................................................................... 183
14.2 APPLICATION OF HEAT ............................................................................................................. 184 14.2.1 Network Environmental Settings ................................................................... 184 14.2.2 User Inputs ...................................................................................................... 184 14.2.3 Sensible Heat .................................................................................................. 184 14.2.4 Diesel Heat ...................................................................................................... 184 14.2.5 Latent Heat ..................................................................................................... 184 14.2.6 Oxidisation ...................................................................................................... 185 14.2.7 Fan and Fixed Flow Heat ................................................................................ 185
14.3 APPLICATION OF MOISTURE ...................................................................................................... 185 14.3.1 Dust Suppression ............................................................................................ 185 14.3.2 Evaporative Cooling ........................................................................................ 186 14.3.3 Wet Material / Dam / Flooded airways .......................................................... 186
14.4 APPLICATION OF REFRIGERATION ............................................................................................... 186 14.4.1 Placement of Refrigeration Sources ............................................................... 187 14.4.2 What portion of the air is cooled? .................................................................. 187

Page | 11
15 DIESEL PARTICULATE MATTER SIMULATION .............................................................................. 189
15.1 APPLICATION OF DPM SIMULATION ........................................................................................... 189 15.2 HOW TO PERFORM DPM SIMULATION IN VENTSIM ....................................................................... 190
15.2.1 Example .......................................................................................................... 191
16 SAVING MONEY ......................................................................................................................... 193
16.1 FINANCIAL SIMULATION ............................................................................................................ 193 16.2 COST DATA FUNCTION ............................................................................................................. 193
16.2.1 Example .......................................................................................................... 194 16.3 VENTILATION ON DEMAND........................................................................................................ 194 16.4 FAN OPTIMISATION ................................................................................................................. 195
17 NETWORK EXAMPLES ................................................................................................................ 196
17.1 EXAMPLE 1 ............................................................................................................................ 196 17.1.1 Suggested Steps .............................................................................................. 196
17.2 EXAMPLE 2 ............................................................................................................................ 203 17.2.1 Suggested Steps .............................................................................................. 203
17.3 EXAMPLE 3 – IMPORT A COMPLEX MINE DESIGN .......................................................................... 207
18 APPENDIX A – GLOSSARY OF TERMS.......................................................................................... 211
18.1 A GLOSSARY OF COMMONLY USED TERMS .................................................................................... 211 18.1.1 Airway ............................................................................................................. 211 18.1.2 Branch............................................................................................................. 211 18.1.3 TXT .................................................................................................................. 211 18.1.4 DXF ................................................................................................................. 211 18.1.5 Endpoint / Start point ..................................................................................... 211 18.1.6 Friction cost .................................................................................................... 211 18.1.7 Friction factor or k factor ................................................................................ 211 18.1.8 Friction loss ..................................................................................................... 211 18.1.9 Friction power ................................................................................................. 211 18.1.10 Hardy- Cross Method ...................................................................................... 211 18.1.11 Junction .......................................................................................................... 211 18.1.12 Load (Pressure) ............................................................................................... 211 18.1.13 Node ............................................................................................................... 211 18.1.14 Pan .................................................................................................................. 211 18.1.15 Pressure loss ................................................................................................... 211 18.1.16 Resistance ....................................................................................................... 211 18.1.17 Shock loss ........................................................................................................ 212 18.1.18 Thermal Diffusivity.......................................................................................... 212 18.1.19 Thermal Conductivity ...................................................................................... 212 18.1.20 Wetness Fraction ............................................................................................ 212 18.1.21 Relative Humidity ........................................................................................... 212 18.1.22 Density ............................................................................................................ 212
19 APPENDIX B – SUMMARY DATA TYPES ...................................................................................... 213
19.1 SUMMARY OF THE MAJOR DATA TYPES ....................................................................................... 213 19.1.1 Air types .......................................................................................................... 213 19.1.2 Airflow ............................................................................................................ 213 19.1.3 Pressure .......................................................................................................... 213 19.1.4 Airway Attributes ............................................................................................ 214 19.1.5 Energy, Power Cost ......................................................................................... 215 19.1.6 Thermo -dynamics .......................................................................................... 215 19.1.7 Identifiers ........................................................................................................ 217 19.1.8 Contaminants ................................................................................................. 217 19.1.9 Rock Properties ............................................................................................... 217

Page | 12
20 APPENDIX C - ICON SPOTTERS GUIDE ........................................................................................ 219
20.1 AIRWAY ICONS ....................................................................................................................... 219 20.1.1 Fans ................................................................................................................ 219 20.1.2 Blocked Airway ............................................................................................... 219 20.1.3 Airway Resistance ........................................................................................... 219 20.1.4 Fixed Airway ................................................................................................... 220 20.1.5 Fixed Pressure ................................................................................................. 220 20.1.6 Contaminant Report ....................................................................................... 220 20.1.7 Fresh Air Report .............................................................................................. 220 20.1.8 Contaminant ................................................................................................... 221 20.1.9 Thermo- dynamic Heat or Moisture Source .................................................... 221 20.1.10 Thermo- dynamic Cooling or Drying Source ................................................... 221 20.1.11 Airway Notes .................................................................................................. 221
21 APPENDIX D – DISPLAY PROBLEMS ............................................................................................ 222
21.1 HARDWARE PROBLEMS ............................................................................................................ 222 21.1.1 Screen fails to display after coming out of ‘sleep / hybernation’ ................... 222 21.1.2 Anti-aliasing does not work / is very slow ...................................................... 222 21.1.3 Custom Icons cannot be used ......................................................................... 222
21.2 SOFTWARE PROBLEMS ............................................................................................................. 223 21.2.1 No Graphics Shown on Screen ........................................................................ 223 21.2.2 Some text is shown as ‘????????” on the screen. ........................................... 223 21.2.3 I can see airways, but no text / arrows / nodes .............................................. 223
22 APPENDIX E – SIMULATION ERRORS .......................................................................................... 224
22.1 WARNINGS ............................................................................................................................ 224 22.1.1 no entry airway or surface connection ........................................................... 224 22.1.2 no exit airway or surface connection .............................................................. 224 22.1.3 no entry or exit ............................................................................................... 224 22.1.4 airway stopping redundant ............................................................................ 224 22.1.5 fan directly interfering with another fan ........................................................ 224 22.1.6 temperature balancing issue .......................................................................... 224 22.1.7 stalled fan ....................................................................................................... 225 22.1.8 low pressure fan ............................................................................................. 225 22.1.9 negated fan .................................................................................................... 225
22.2 ERRORS ................................................................................................................................. 225 22.2.1 airway attempted to reverse .......................................................................... 225 22.2.2 Anomolous pressures ...................................................................................... 225 Duplicate airway ........................................................................................................... 226 22.2.3 Fixed flow cannot be achieved........................................................................ 226 22.2.4 fix stopped ...................................................................................................... 226 22.2.5 operating fan blocked ..................................................................................... 226 22.2.6 convergence problem ..................................................................................... 226 22.2.7 temperature outside allowable range ............................................................ 226 22.2.8 heat estimation error encountered ................................................................ 226 22.2.9 temp estimation near rock surface ................................................................. 227 22.2.10 overpressure across resistance ....................................................................... 227 22.2.11 operating fan restricted by resistance ............................................................ 227 22.2.12 fix being over restricted .................................................................................. 227 22.2.13 unresolved pressure or flow............................................................................ 227 22.2.14 fan static P curve invalid, check fan ................................................................ 227 22.2.15 fan total P curve invalid, check fan ................................................................. 228
23 APPENDIX F – SHORTCUT KEYS .................................................................................................. 229
24 APPENDIX TABLE OF FIGURES .................................................................................................... 230

Page | 13
1 Ventsim Visual™ – An Introduction
Ventsim Visual™ is a technical successor to Ventsim Classic 3.9 which was first developed and released in 1993, and was widely lauded for its simple interface and graphical Windows based 3D wireframe approach to displaying ventilation networks.
The relatively recent introduction of affordable 3D graphics hardware into everyday PC’s
encouraged a new approach with Ventsim ventilation software.
It became clear soon after the introduction of Ventsim Classic that very sophisticated and
complex networks were being developed with the program, however the application and
analysing of these networks was restricted by the shear amount of data being
manipulated. In addition, in networks of many thousands of airway branches, serious
mistakes could often be made in the entry of data without being noticed. Viewing and
editing of large datasets was becoming increasingly problematic, and use of these
networks by others not familiar with the mine was becoming more difficult.
A key factor in the development of Ventsim Visual was the observation that many
sophisticated ventilation networks were being developed in Ventsim Classic by bright
engineers, but then simply gathered dust once these engineers moved on, and new
engineers abandoned trying to decipher them.
Another key factor to the development of the next generation of Ventsim was the
increasing demand to simulate and design underground environmental conditions, to
ensure suitable conditions for mine workers and equipment.
As a result, Ventsim Visual™ Standard and Advanced were developed to address these
requirements. Primarily, it has been designed as a ventilation tool, which can operated
independently of other mine planning packages, but maintains a level a compatibility
which ensures data from mine planning packages and other ventilation software can be
passed to the program.
Ventsim Visual™ provides a full toolbox of tightly integrated utilities to analyse ventilation
flows, heat, contaminants and financial aspects of mine ventilation. Building on the
success and experience of fifteen years of Ventsim implementation at over 400 sites,
Ventsim Visual™ goes a generation further in its approach to ventilation simulation and
analysis, and sets a new standard in ventilation software design and implementation.
1.1 About Ventsim Visual™
Ventilation has been a primary concern in underground mines for hundreds of years, but
until the introduction of computerized network analysis in the last 40 years, the planning
and modelling of ventilation was largely a black art, relying on experience, guesswork and
extensive calculations.
Chapter
1

Page | 14
Even when computer ventilation software allowed simulations of large networks of
underground airways, the process of entering and interpreting results still remained a job
for experts in the field. Ventsim Visual™ aims to make ventilation simulation and design
accessible to any mine engineer or ventilation officer, even those without substantial
ventilation experience.
Ventsim Visual™ Standard provides the user with the tools to;
Simulate and provide a record of flows and pressures in an existing mine.
Perform 'what if' simulations for planned new development.
Help in short term and long term planning of ventilation requirements.
Assist in selection of types of circuit fans for mine ventilation.
Assist in financial analysis of ventilation options.
Simulate paths and concentrations of smoke, dust, or gas for planning or
emergency situations
Ventsim Visual™ Advanced provides additional tools to;
Undertake full thermodynamic analysis of heat, humidity and refrigeration in
underground mines.
Take into account air compressibility for deeper mines.
Provide tools for analysing multiple different airways size options, both financially
and for establishing ventilation capacity.
Show dynamic time based analysis of contaminants and concentrations spreading
through a mine from blasting.
Provide a tool to check for recirculation in mines.
Simulate Diesel Particulate Matter (DPM) concentrations through a mine.
Ventsim Visual™ has been written to make the process of ventilation network analysis as
easy to use as possible. Both versions utilise sophisticated 3D graphics, driven by a fully
graphical mouse driven interface. Ventsim Visual™ is compatible with Microsoft Windows
XP, VISTA or WINDOWS 7. The software can also be run on Apple Mac Computers with
suitable graphics hardware, running Windows under dual boot or emulation.
1.2 Computer Hardware Requirements
Ventsim relies heavily on 3D graphics hardware to present detailed smooth graphics.
While most computers these days have this functionality built in, older computer may
not and may struggle to produce acceptable performance.
Even modern computers, particularly laptops may have substandard graphics
hardware for displaying 3D graphics and performance may not be as good as
expected. The following guide is recommended for computers

Page | 15
Minimum Configuration
Intel based (AMD or Intel) processor 1 Ghz +
Windows XP, Vista or Windows 7
Memory 2G or RAM
Hard Drive Space 100 Mb
Direct X9 compatible graphics (minimum Intel integrated graphics)
Two button mouse
Recommended Configuration
Intel based 32 or 64 bit dual core processor 2 Ghz +
Windows XP, Vista or Windows 7
Memory 2G of Ram
Hard Drive Space 100Mb +
Dedicated /Discrete Graphics card from INTEL, ATI or NVIDIA with greater than
128Mb or RAM. INTEL CORE i (Sandy bridge) processors now have reasonable
graphical power and perform well with Ventsim without a dedicated graphics card.
Two button mouse with centre scroll / click wheel
Ventsim Visual is not officially supported on Apple Mac computers, however it has
been confirmed that Ventsim Visual is capable of running on newer Macbooks
under Windows dual boot or Parallels™ systems.

Ventsim Visual User Manual Page | 16
2 Ventsim Classic 3.9 to Visual Guide
Ventsim Visual™ is a substantially different program than Ventsim Classic 3.9
and takes a new approach to ventilation display and simulation. This section will
give you a brief overview of the major changes if you are familiar with Ventsim
Classic 3.9, and may also assist if you are familiar with other ventilation software
packages.
Ventsim Visual has been accused of being unnecessarily ‘flashy’ or ‘pretty’,
however every graphical aspect of the program has a necessary function to help
make ventilation models easier to understand and reduce the opportunity for
error. The 3D graphics accurately represent the true size, shape and location of
underground airways. The colouring represents many different types of data (for
example temperature or pressure). The animated arrows show both the speed
and direction of airflow. By removing or reducing the need to comb through
excessive amount of textual data, ventilation models can be analysed and
validated much faster than traditional means.
2.1 Display
Three dimensional (3D) perspective views are rarely used in CAD or Mine
Planning packages, except occasionally for final presentation purposes. The
perspective view tends to distort distances and true directions and is
therefore largely unsuitable for detailed engineering drawing. An orthogonal
non-perspective view however is not required for ventilation modelling,
which relies more on effective data presentation.
A 3D perspective view is the way we look at the world and when used to view
computer models, it is natural and easily understood, particularly to someone
unfamiliar with your network.
Airway solids shown with true dimensions and shapes allow quick appraisal to
check whether dimensions are as intended. The author has found numerous
examples of Ventsim Classic 3.9 networks loaded in Ventsim Visual™ that
immediately show inadvertent incorrectly sized or shaped airways which may
prevent the network from simulating or balancing as expected.
A perspective view also permits closer visualisation of specific parts of a network,
while other parts are hidden or obscured by distance. In cluttered large
networks this can help clarify intended data significantly.
2.2 Animation
They say a picture is worth a thousand words. Animation may therefore be worth
a thousand pictures. Ventsim Visual™ animation again demonstrates a key
feature of the software’s presentation of complex data. By animating flow
arrows, fans and heating/cooling sources, Ventsim Visual™ can show a huge
amount of data in a way that the human brain can quickly visualise and
Chapter
2
Ventsim Visual™ default uses a 3D perspective view.
The Ventsim Visual™ Approach
To create a user friendly, graphically
rich program and interface, which
shows the maximum amount of relevant
data, in the most efficient and
understandable way.

Ventsim Visual User Manual Page | 17
interpret. Animated flows show the direction and relative speed of all airflows in
a mine over potentially thousands of airways. Animated fans show whether they
are turned on or off, while dynamic colouring draws the user’s attention to
specific data ranges. Using only animation and colouring of data, Ventsim
Visual™ users can process and analyse complex networks, without having to
interpret a single line of textual data. In addition, it makes presentation of data
very effective to the layperson (who often control budgets and have to make
decisions regarding investing in costly ventilation infrastructure)
2.3 Elevation Database (Levels)
There no longer needs to be a defined surface level elevation. Any airway can be
connected to the surface at any place in the mine, by clicking on Connect to
Surface in the airway Edit Box. Ventsim Visual™ will calculate which end is
connected to the surface, based on what end is joined to other airways.
A level database, although still useful, is no longer mandatory for viewing
different elevations of a network. While an overarching single elevation level
covering all elevation ranges is still recommended, any elevation range can be
viewed at any time by Right Clicking the screen, choosing Select Level from the
context menu, and then clicking or fencing the area you wish to view. In
addition the select level function can be used to quickly limit an elevation range,
or multiple ranges, by drawing a box around the intended airways.
2.4 Airways
Airways no longer need to be connected to another and can be left closed ended,
as would be the case in blind development headings. Because this may still
cause unintentional problems (such as airways not joined as the user intends),
Ventsim Visual™ will alert the user to these during simulation.
These warnings can be turned OFF in the settings menu, or disabled individually
by clicking Allow Closed End in the edit box. No airflow will travel through closed
ended airways, unless connected to surface.
No Entry / No Exit errors are largely abolished with Ventsim Visual™. Providing
the airways are connected to a part of a network where a pressure can be
derived, Ventsim Visual™ will automatically reverse and adjust airways into a
node.
Finally, airways drawn by the user that cross other airways, will automatically
have a junction node inserted, joining both airways.
2.5 Data
The single biggest change to Ventsim Visual™ is the visual management of data
types. Around seventy (70) different data types exist in the Advanced version,
all of which may be displayed as text on the screen, in a spreadsheet or as a
colour range.
This creates a rich, but potentially confusing interface. To simplify things,
Ventsim Visual™ uses both a Colour Manager and a Data Manager control form
to assist in rapid analysing and changing of on screen data. These two controls
can be utilised via the view menu, or from the toolbar.
2.5.1 Colour and Data
Manager

Ventsim Visual User Manual Page | 18
It is important to note that the Colour Manager control can display data
independently of the text data which is shown on screen (for example pressures
can be showed at a colour range, while text data could show air flows. Colour
ranges can be adjusted in the Colour Manager control with the slider bars, or by
manually entering new ranges.
2.6 Coordinates
Ventsim has switched to a more conventional Eastern / Northing / Elevation
coordinate approach. The relative directions on screen of these coordinates can
be changed in the Settings menu.
Ventsim Visual™ allows decimal point coordinates to be used allowing more
accurate placement of airways. While this will have little effect on ventilation
flows, it removes the ‘saw tooth’ effect often seen in the Ventsim Classic 3.9
integer coordinate display
2.7 Editing and Information
The Edit Box now acts as a powerful editing and information tool for airways in a
network. The Edit Box may be left open permanently, and will update with
information from the airway clicked on during viewing, editing and adding
modes. It will also automatically update after simulation, with the latest airway
results.
To view airway information for example, leave the Edit Box selected on the
Information Tab, and airways throughout a network can be quickly analysed by
clicking on the airway. Likewise, the Fan Tab could be left open, and operating
fan curves can be analysed quickly at different point in the network in the same
way.
To modify data in an airway, simply click on the cell you wish to modify and
change the data. The airway will automatically update when Apply or OK is
pressed, or when another airway is selected. Multiple airways can be
selected for simultaneous editing by fencing or selecting the airways while in
Edit Mode, and then clicking on any selected airway. Any data within the
Edit Box changed during editing multiple airways will be changed for all the
selected airways.
For example, if all selected airways require a width of 6m, then after changing
and applying the Width in the Edit Box, the width (and only the width) of the
selected airways would change. All other attributes (even if different between
the selected airways) remain unchanged. Data that will be changed turns blue
after modification.
To abandon these changes, select Cancel from the Edit Box before moving to
another airway.
2.8 Referenced Graphics
The introduction of Ventsim Visual version 1.2 permits the use of referencing into
the program of external 3D graphics DXF models, such as surface terrains,
orebodies, actual development and mine infrastructure.
While referenced graphics do not interact directly with ventilation circuits, they
provide a useful visual and construction aid to developing and presenting
networks. Mine ventilation network airways and sizes can be directly compared
2.7.1 The Edit Box
2.7.2 The Information
Tab
2.7.3 Modifying Data

Ventsim Visual User Manual Page | 19
to actual or design development, surface terrains can be used to ensure shafts
are set to the correct elevation, while orebodies and stopes can be used to
ensure ventilation circuits are not developed in the wrong area, and have
adequate ventilation designs to control airflow.
2.9 Experiment !
Finally, by all means experiment with the program. Load up and view some of
the included demos. Most features have a Tool Tip attached to them, which will
provide further information if the mouse cursor is hovered near them. Ensure
you save your network files frequently and create backups where necessary.
Good Luck
Craig Stewart
Author Ventsim Visual™
© 2010 Ventsim Software

Ventsim Visual User Manual Page | 20
3 The View Window
Ventsim Visual™ operates in a full three dimensional (3D) perspective driven
environment.
Figure 3-1 Ventsim Visual™ Main Window
1 Main Menu. Consists of options required to load, save, view and
manipulate the model, as well as options to change settings and
simulate ventilation models.
2 Toolbar Menu. Consists of many of the construction tools required to
build ventilation models. In addition it contains a number of buttons
for different types of ventilation simulations
3 Data Selection Position. Selects the position along an airway from
which data will be displayed as text on screen or as colours. The
condition of air will change along an airway (particularly long or deep
airway segments), therefore this option is available to select which
position along an airway segment display data is sourced from. The
first and last button displays the conditions of air entering and exiting
an airway segment. The middle button displays an average of airway
Chapter
3
1 2
3
4 5
6

Ventsim Visual User Manual Page | 21
data through the segment. The middle left and right button displays
the airflow conditions entering and exiting any icon (for example a
fan) within the airway. If an icon is not present, then they display the
middle conditions of an airway segment.
4 Mouse cursor position coordinates in the 3D screen.
5 Simulation status. Green = successful simulation, Yellow = successful
simulation with warnings, Red = unsuccessful simulation.
6 Main 3D view display window.
The success on how to utilise some of the unique aspects of a 3D perspective
view comes from an understanding of how it works. Ventsim Visual™ has a
number of guides to assist in viewing and construction in 3D.
3.1 Point of Focus
The view in the main 3D Ventsim window is essentially a view seen from a
‘camera’ floating in space, aimed at a point of focus. Your eye is the camera.
The point of focus is always in the centre of the screen, at a pre-determined
distance away from the camera.
You can move closer or further away from the point of focus with the Mouse Scroll button, and rotate around this point of focus with the Mouse Right button. To move the screen to a different location, the point of focus needs to
be moved.
There are several ways to move the point of focus;
Draw a window with the mouse around the area you wish to focus on.
The focus will move to the centre of the window, at the closest distance
of an object or airway in the window.
Drag (pan) the screen with the Centre mouse button. The point of focus
will move along the current horizontal plane with the mouse cursor
Click on an airway while in the view mode, or when in any other mode
with the Mouse Middle button (or a Right/Left combination for those
without a 3 button mouse). This will automatically put the focus onto the
clicked airway at the same viewing distance as was previously set. If the
object being clicked is a long way away, this has the effect of quickly
flying through space towards that object in order to maintain the same
view distance as the previous point of focus.
The Elevation of the point of focus can also be changed by selecting the
Shift key while using the Mouse Scroll button. A transparent grid (if the
grid is turned on) will show the horizontal plane of the point of focus.

Ventsim Visual User Manual Page | 22
3.2 User Control Summary

Ventsim Visual User Manual Page | 23
3.3 The Edit Plane
The Edit Plane is a horizontal plane at a set elevation. By default, any new
airways are initially constructed on the edit plane. The edit plane can be viewed
by ensuring the grid function is turned on. The plane will be crossed with grid
coordinate lines. If Shift is selected the edit plane will be made semi-transparent
which will indicate where it intersects existing airways.
Figure 3-2 The Edit Plane, shown with the SHIFT key pressed
To move an edit plane, select a new point of focus by centering on an airway, or
use the Shift-Mouse-Scroll combination to move the edit plane elevation. The
coordinates in the status bar at the Bottom Left corner will always show the
elevation of the edit plane.
Hint : The Edit Plane will also temporarily move automatically to the level of an airway being drawn from another airway. Additionally, the edit plane and point of focus can be moved manually by the Set Edit Plane function in the menu bar.
Ventsim Visual User Manual Page | 24
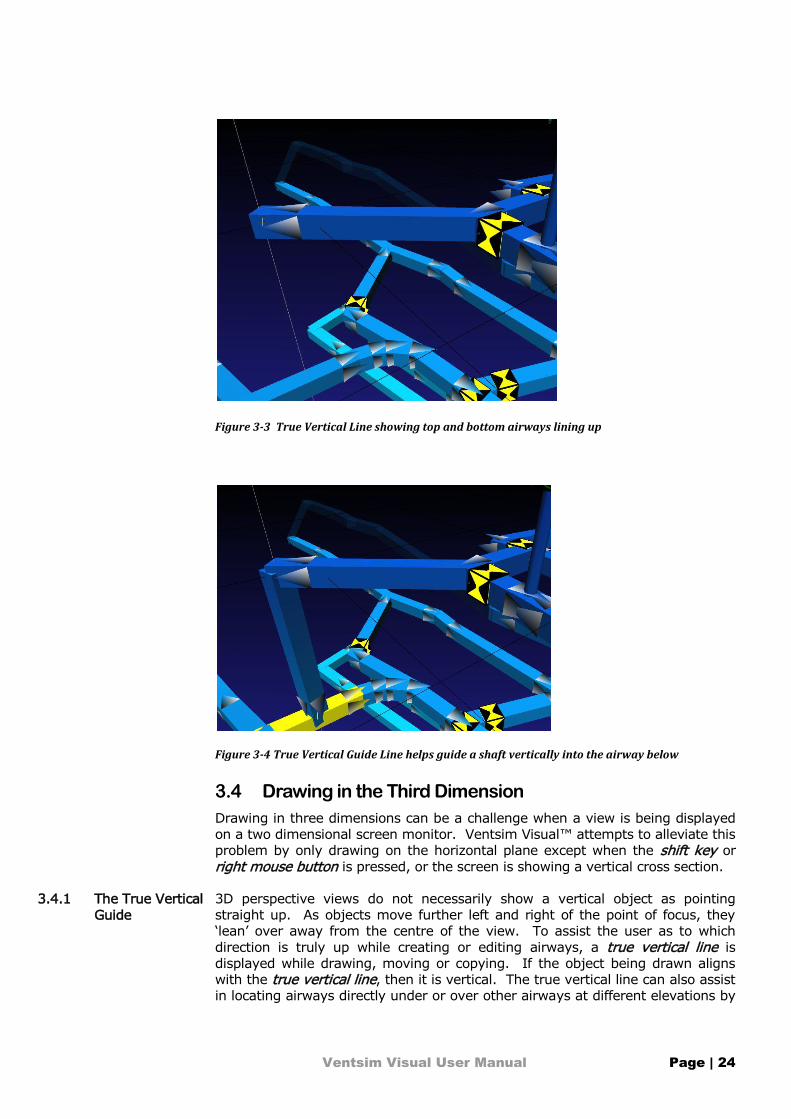
Figure 3-3 True Vertical Line showing top and bottom airways lining up
Figure 3-4 True Vertical Guide Line helps guide a shaft vertically into the airway below
3.4 Drawing in the Third Dimension
Drawing in three dimensions can be a challenge when a view is being displayed
on a two dimensional screen monitor. Ventsim Visual™ attempts to alleviate this
problem by only drawing on the horizontal plane except when the shift key or
right mouse button is pressed, or the screen is showing a vertical cross section.
3D perspective views do not necessarily show a vertical object as pointing
straight up. As objects move further left and right of the point of focus, they
‘lean’ over away from the centre of the view. To assist the user as to which
direction is truly up while creating or editing airways, a true vertical line is
displayed while drawing, moving or copying. If the object being drawn aligns
with the true vertical line, then it is vertical. The true vertical line can also assist
in locating airways directly under or over other airways at different elevations by
3.4.1 The True Vertical
Guide

Ventsim Visual User Manual Page | 25
observing where the line ‘intersects’ airways above and below the current point
being edited.
To simplify construction of airways, initially all drawing, moving and copying of
airways defaults to the horizontal Edit Plane, regardless of the orientation of the
view screen. To assist the user further, airways being drawn or moved will
automatically ‘click’ and join to airways under the mouse cursor, even if at
different elevations or distances away.
Hint: To quickly change the view from horizontal plan view to vertical section view, press the F2 button
If airways are drawn in isolation (not connected to other airways), they will use
the default airway settings specified in the Settings form. If airways are drawn
connected from another airway, they will inherit the settings from the airway
from which they are drawn. Airways can be drawn from another airway end
(node) or from any other point along an airway. Ventsim Visual™ will create a
new node (or junction) if none already exists.
Hint: Ventsim Visual™ can detect whether an airway being constructed crosses the paths of other airways. For example, if a long airway is drawn from one point to another, over which it crosses the paths of existing airways, Ventsim Visual™ will join this airway into the crossed airways with new nodes. This will only happen in the drawing mode. If airways are imported (from a DXF for example), crossed airway junctions will not automatically be detected).
To draw in the third dimension (up or down in elevation) where there is not an
airway above or below to click to, first draw the airway to the desired horizontal
(plan) location, then press the Shift key. The Edit Plane will turn semi-
transparent, and further movements of the mouse will occur in a Vertical plane
parallel to the computer screen. The Edit Plane will follow the vertical movement,
assisting in showing where the cursor is in relation to other airway elevations. In
addition, the numbers in the lower left status bar will show the elevation and
coordinates of the point.
Figure 3-5 Picture showing inclined airway being drawn down to the elevation of the level below
3.4.2 Drawing Airways

Ventsim Visual User Manual Page | 26
Airways can be manually added, moved or copied by selecting a manual
coordinate entry system. To activate this system while in draw mode, click on
an airway end or somewhere in empty space. To activate this system every
time an airway is drawn (to allow manual adjustment or entry of airway ends)
select the pull down arrow on the ADD button and choose the ‘Coordinates’ sub-
options from the button.
To activate the system, when moving or copying, simply click an existing airway
while in the Move or Copy mode. A coordinate window will show and the
coordinates (or offsets) of the airway can be entered.
The coordinate entry allow airways ends to be adjusted manually, or by using a
vector polar coordinate or a physical offset of the eastings, northings and
elevation. End Coordinates are adjusted in real time as offsets or polar
coordinates are adjusted. To apply the change, simply click OK when completed.
Figure 3-6 Coordinate entry system
Airways can be copied, much in the same way as the Move function. An airway
can be ‘grabbed’ with the mouse and ‘dropped’ in a new location, or the airway
can be clicked and manually copied with new coordinates. In addition, a group
of airways can be selected with the Select button, or by drawing a fence around
the airways, and then clicking or dragging one of the selected airways.
3.4.3 Manual
Coordinate Entry
3.4.4 Copying Airways
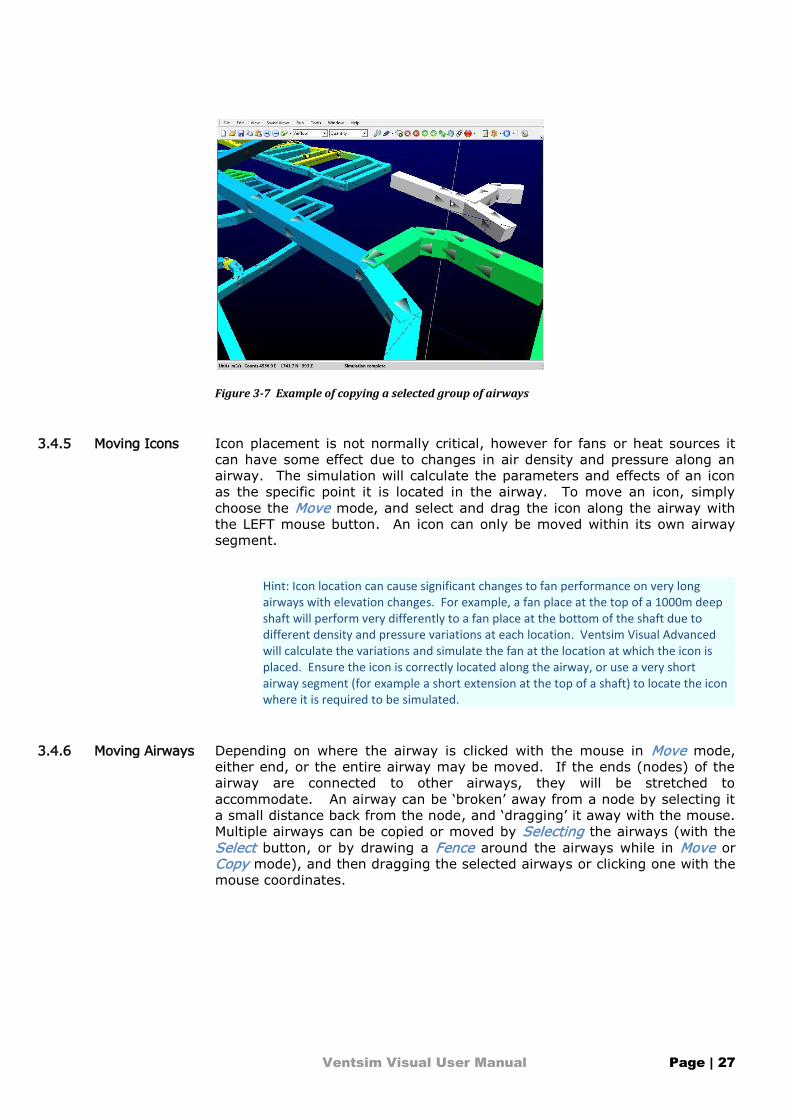
Ventsim Visual User Manual Page | 27
Figure 3-7 Example of copying a selected group of airways
Icon placement is not normally critical, however for fans or heat sources it
can have some effect due to changes in air density and pressure along an
airway. The simulation will calculate the parameters and effects of an icon
as the specific point it is located in the airway. To move an icon, simply
choose the Move mode, and select and drag the icon along the airway with
the LEFT mouse button. An icon can only be moved within its own airway
segment.
Hint: Icon location can cause significant changes to fan performance on very long airways with elevation changes. For example, a fan place at the top of a 1000m deep shaft will perform very differently to a fan place at the bottom of the shaft due to different density and pressure variations at each location. Ventsim Visual Advanced will calculate the variations and simulate the fan at the location at which the icon is placed. Ensure the icon is correctly located along the airway, or use a very short airway segment (for example a short extension at the top of a shaft) to locate the icon where it is required to be simulated.
Depending on where the airway is clicked with the mouse in Move mode,
either end, or the entire airway may be moved. If the ends (nodes) of the
airway are connected to other airways, they will be stretched to
accommodate. An airway can be ‘broken’ away from a node by selecting it
a small distance back from the node, and ‘dragging’ it away with the mouse.
Multiple airways can be copied or moved by Selecting the airways (with the
Select button, or by drawing a Fence around the airways while in Move or
Copy mode), and then dragging the selected airways or clicking one with the
mouse coordinates.
3.4.5 Moving Icons
3.4.6 Moving Airways
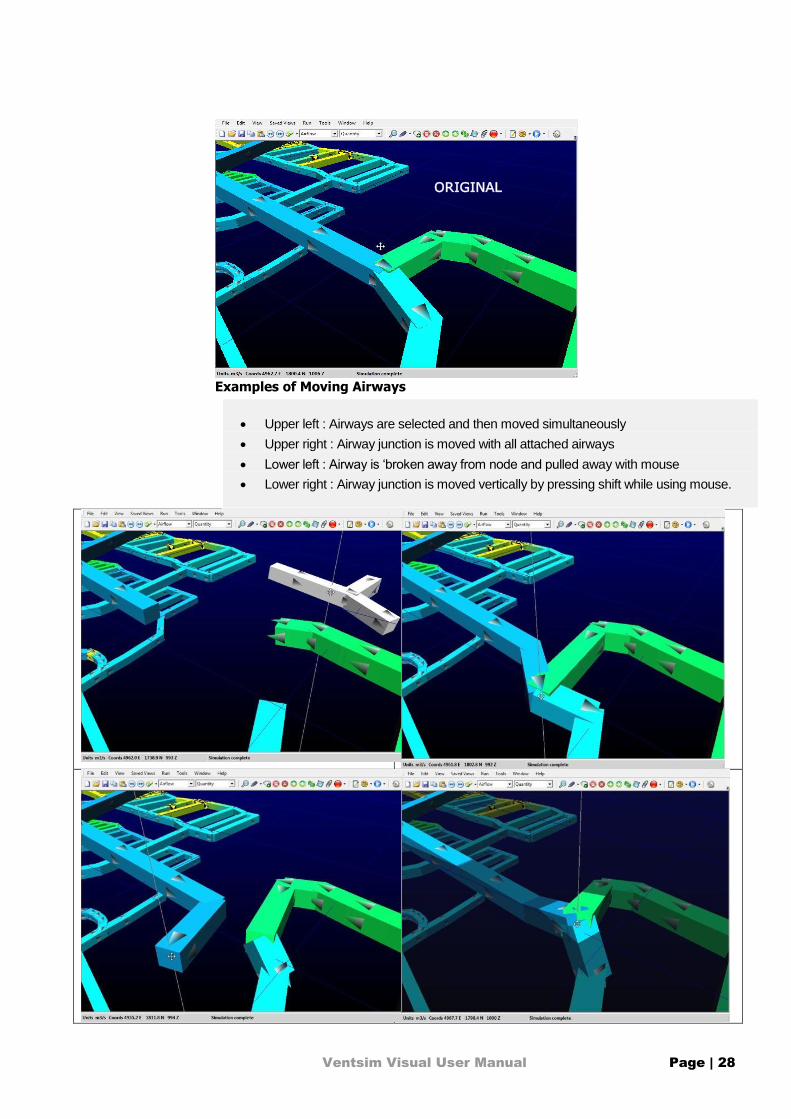
Ventsim Visual User Manual Page | 28
Examples of Moving Airways
Upper left : Airways are selected and then moved simultaneously
Upper right : Airway junction is moved with all attached airways
Lower left : Airway is ‘broken away from node and pulled away with mouse
Lower right : Airway junction is moved vertically by pressing shift while using mouse.
ORIGINAL

Ventsim Visual User Manual Page | 29

Ventsim Visual User Manual Page | 30
4 Menu Bar
4.1 The Interface
Figure 4-1 Main view window
The main Ventsim Visual™ window contains all the functions you will require to
create, edit, view and simulate airway networks. Note that some of these
functions may differ between Advanced and Standard versions.
Menu Bar
Tool Bar
3D Viewer
Status Bar
Chapter
4
Status Bar
Tool Bar Menu Bar
3D Viewer

Ventsim Visual User Manual Page | 31
4.2 File Menu
Erases the network currently in memory.
An option is given to save any unsaved changes from the current network. The
previously used Level, Layer and Fan Database will be retained for the new
network. The New option close the network, and load up the system startup
defaults, whereas the Close option closes the network, but retains the previous
network defaults.
Loads a pre-saved network.
You can also open Ventsim Visual™ files by dragging file icons from your
Windows folders onto the Ventsim Visual™ screen.
Ventsim can open a number of different formats, including Ventsim Visual,
Ventsim Classic, and provides limited functionality to load VNET-PC files.
Ventsim Classic files are slightly different in structure. While good
compatibility should be retained when loading these files, it is always
important to check and validate the model to ensure no significant changes
have occurred during the transition from Ventsim Classic to Ventsim Visual.
Ventsim can directly import VnetPC files and construct a workable Ventilation
network from the file, however full compatibility is not guaranteed. Ventsim
attempts to import all airway data, fan curves and environment data,
however because of some fundamental differences in files formats and data
used, there may be difference in simulation.
To maintain maximum compatibility, the resistance of all airways is fixed to
the same value as the VnetPC file, however if the file has correct airway
dimensions, the user is encouraged to remove this fixed value and utilise the
AUTO resistance in Ventsim to calculate airway resistance from size and
friction factor. To do this, select the airway or airways, then choose the
EDIT button, and change the CUSTOM resistance to AUTO. Ensure the
airway size and friction factors are correctly set for each airway.
Warning. Full VnetPC compatibility is not guaranteed and ever file should be thoroughly checked for accuracy and consistency after import. VnetPC files are missing much of the information Ventsim normally used to simulate networks, and assumptions are sometimes made which may not be correct.
Saves changes made to the network.
If the Ventsim title bar shows that the network is untitled, the user will be
prompted to select a name before the file can be saved.
Saves the network, but gives the option of saving under a different name.
4.2.1 New / Close
4.2.2 Open
VnetPC Files
4.2.3 Save
4.2.4 Save As

Ventsim Visual User Manual Page | 32
Ventsim can be saved in one of two formats. The default format in the VSM file
which is the standard file format. This format is highly compressed and cannot
be read by other programs.
Ventsim Visual™ files can also be saved as a Text format. This format follows
the standard TAB separate values format and can be loaded by programs such
as Microsoft EXCEL, WORD or ACCESS. The internal contents of the file can be
viewed, modified and resaved as a Text file. The Text file can be reloaded into
Ventsim Visual™ providing the basic structure and the HEADER and FOOTER
tabs remain the same.
Joins two networks together instead of erasing the currently loaded network.
Similar to the Open command, this may be useful for joining separate networked
areas of the same mine. Caution should be taken however, as duplicate
branches are not immediately checked when the networks are merged (duplicate
branches will be subsequently be deleted if an attempt is made to simulate the
network).
Enables a common settings file (Master File) to be linked and shared with
multiple Ventsim Visual files. Master Files replace the Template function used in
Version 1 of Ventsim Visual.
Master Files store a user definable selection of shared settings (for example
resistance and friction factor preset values or fans). When a Ventsim file is
linked to a Master File, and the file is saved, the settings are also saved to the
Master File and will be available to all other Ventsim Visual files which have a link
to the Master File. The settings in linked Ventsim Visual files are updated from
the Master File when loaded. If the Master File is not available, then a warning
will show and the most previously saved settings will the used.
Warning : Using linked Master Files can be dangerous if settings made in one file adversely affect another linked file. For example if a fan is removed or replaced with another fan, and the file saved, then all other linked Ventsim Visual files which used to use this fan may no longer work correctly. If a linked Master File is used, it is normally better to add new settings, not remove or delete existing settings which may be used by other files.
Create New : Creates a new Master file template,
which can then be linked to other Ventsim Visual files.
When creating the file, it is automatically linked to the
current file. Other Ventsim Visual files can be linked
to this same Master File by opening the files and using
the Link option below.
Hint : When creating a new file, there is an option to specify what common settings you would like to make in the master file. For example if only the fan database, and the common resistance, friction and shock factors are to be used, then click on the Fan Database, and Preset options in the dialog box.
4.2.5 Merge
4.2.6 Master Link
Figure 4-2 Master File Options

Ventsim Visual User Manual Page | 33
Save the Master File in an accessible file location. A descriptor can be saved with
the file to explain information about what components have been saved.
Link : Opens a dialog form to search and link to a Master File. If the current
Ventsim file has an existing linked Master file, the new Link will replace the data
in the Ventsim file. An alternative method to link a file is to simply drag and
drop a Master File into the current Ventsim Visual window.
Unlink : Breaks a link to the Master file (but does not change the Master File).
Any changes to file settings made after the link is removed will no longer update
the Master File.
Update : Refreshes the current Ventsim file with the data in the Master File. This
may be necessary if another file has modified the data in the Master File after
the Ventsim file has been opened. It is normally not recommended to have
multiple files open accessing the Master File as only the most recently saved
Ventsim File will have updated the master settings. If another file has updated
the Master File while the current file is open, then a WARNING will display
indicated a possible conflict.
Adopts some of the attributes of another network.
Ventsim Visual™ files contain many different components such as fan
databases, file and simulation settings, level and layer database and many other
options. Instead of setting up new parameters for you network, these
components can be loaded from an
existing file without deleting the
airway data in the current file.
Hint : Fans from other Ventsim Visual files can be used in your existing files by inheriting and ‘combining’ the fan databases. The simulation file fans being inherited will only be added if no existing fans exist with the same name. The ‘combine’ option will ensure all the current network fans will be preserved, and new fans made available for selection. The fan list can be edited from the fan database, or from the Presets spreadsheet.
Once a suitable file is selected, an option panel is displayed to allow the user to
select various components they wish to inherit from the saved file. Once loaded,
these components will become part of the existing file. An option is provided to
merged with existing presets (for example, the friction factors may be added to
a list of currently used friction factors), or they can simply completely replace
existing presets.
4.2.7 Inherit

Ventsim Visual User Manual Page | 34
CAUTION – When selecting ‘REPLACE’ many components such as fan databases, levels and most presets may not correctly map to the existing network’s fans, levels and presets, particularly if (for example) fans within the database are in a different order. These may need to be manually corrected by checking and re-editing fan airways to ensure the correct fans have been placed.
The start up settings for Ventsim Visual.
The defaults file is stored in the user’s personal Windows directory. The file is
loaded when Ventsim Visual™ starts and specifies the settings, behaviour and
fans when the program is first loaded. Each user who logs on to the computer
will have a different default file which is initially created when the program is
installed.
Ventsim Visual™ files have a copy of defaults stored within the file which may
have been modified after the network file was started. This will override the
standard start up defaults when the file is loaded.
Reload Startup - Reloads the original defaults file that is first loaded when
Ventsim is initiated.
This may be required if the default settings that are automatically loaded with a
Ventsim simulation file are incorrect or out of date, or you wish to overwrite the
current file settings.
CAUTION – This will reset all file parameters such as fan databases and graphics options. If you wish to only update selected components, use the inherit function to load selected components from an existing file.
Save Defaults - Saves the settings currently loaded in memory to the defaults
file. These will be loaded automatically next time the program is run.
Restore Defaults - Restores the defaults file to the original file created when the
Ventsim Visual™ program was installed.
Offers tools to assist with applying custom pictures to fans, resistance or heat
preset items in Ventsim.
Custom icons allow individual fans, heat sources or resistances to have pictures
of (for example) real installations placed over the default icons in the model.
4.2.8 Defaults
4.2.9 Icons

Ventsim Visual User Manual Page | 35
To place a new icon picture in a model, simply ‘drag and drop’ a picture file from
any Windows folder, onto the icon in your Ventsim Visual model to be changed.
The default icon will automatically change to the new picture.
Other tools that may be of use in managing custom icons include:
Import: Ventsim will search through a Windows folder, and automatically map
any picture with the same name as a Ventsim Icon. For example, if a
ventilation model has a fan called “Sinclair Fan” and a picture is present
in the Windows Folder also called “Sinclair Fan”, then the picture will
now replace the Fan Icon in the Ventsim ventilation model file.
Export: Ventsim stores compressed copies of any icon pictures in the model onto
a hard drive location that can be accessed from a Windows folder.
View: Shows the Windows folder with currently stored Ventsim Icon Pictures.
Refresh: Updates the Ventsim display with any changed icons in the model. The
should normally not be required.
Clear: Removes any icon pictures from the Ventsim file. The pictures are still
available in the Windows folder if they are required again.
A series of tools to assist with securing, comparing or linking pictures to Ventsim
files. The tools are described below.
Compares the current loaded file with a saved file. Any obvious changes to
airways such as moving, deletion, new attributes, presets or sizes will be
highlight on screen and in the error list box.
HINT : This function may be useful where there may be multiple similar versions of the same file, and it is unknown what changes may have been made between versions.
Sets the file security with a password to prevent unauthorised changes or access. In addition, a password protected file cannot be merged with another.
Do activate security for a file, simply select this option, enter a password and
click what security option you wish to apply.
4.2.10 FILE TOOLS
4.2.11 Compare
4.2.12 Security

Ventsim Visual User Manual Page | 36
Figure 4-3 File Security Options
View Only – Allows the network to be loaded and viewed, but not
changed in any way or re-saved.
Read Only – Allows the network to be loaded and modified, but not
resaved or copied to a new network.
Lock File – Prevents the file from being opened or viewed.
When a security enabled file is loaded (in Ventsim Visual version 1.2.3+), a
dialog form will request a password. If the password is not entered or is
incorrect, only the restricted security access option will be available.
CAUTION – Passwords are case sensitive. Ensure you can recall the password. A lost password means the file will not be able to be opened or changed in the future.
Saves the current screen to a file location as an image file.
This file can be later loaded into documents or presentations from other software
packages.
Imports external data into Ventsim Visual to build network model.
Ventsim can import data from TXT (text) files, DXF (drawing exchange format
Autocad) files, DWG (Autocad native format), STR (Surpac string files), DM
(Datamine Files – String or Wireframe Solid) and VDP (VnetPCTM files)
4.2.13 Save Picture
4.2.14 Import
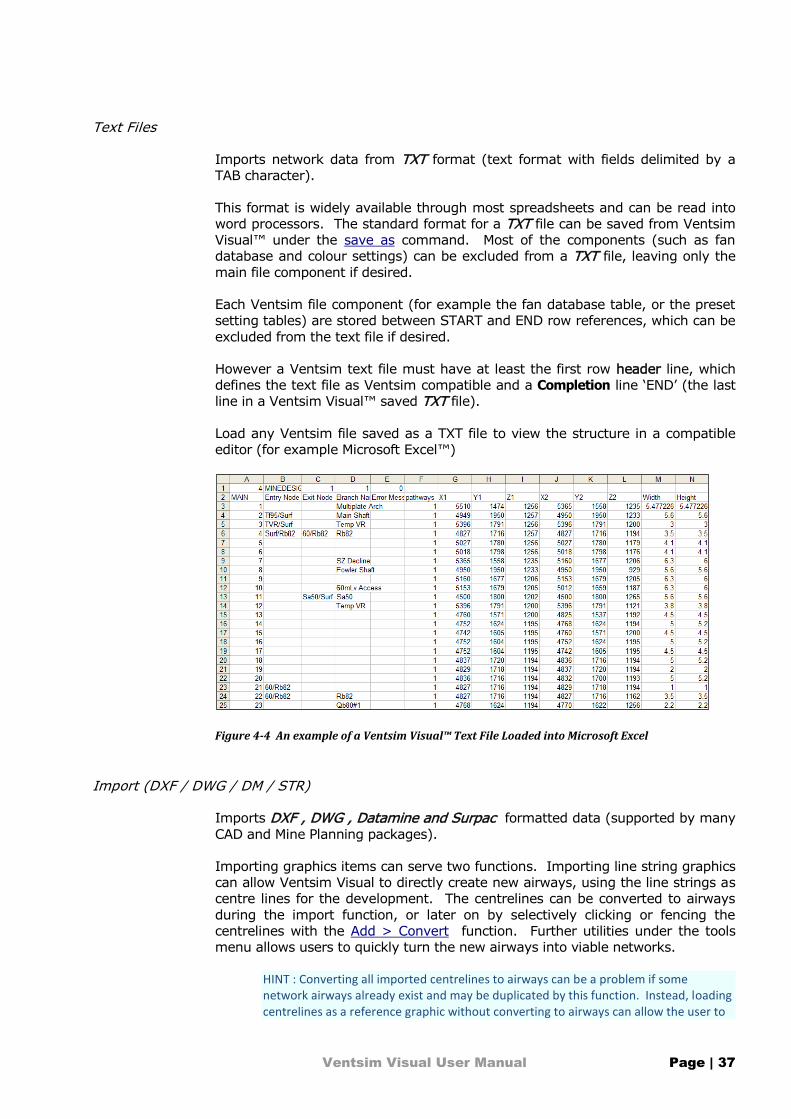
Ventsim Visual User Manual Page | 37
Text Files
Imports network data from TXT format (text format with fields delimited by a
TAB character).
This format is widely available through most spreadsheets and can be read into
word processors. The standard format for a TXT file can be saved from Ventsim
Visual™ under the save as command. Most of the components (such as fan
database and colour settings) can be excluded from a TXT file, leaving only the
main file component if desired.
Each Ventsim file component (for example the fan database table, or the preset
setting tables) are stored between START and END row references, which can be
excluded from the text file if desired.
However a Ventsim text file must have at least the first row header line, which
defines the text file as Ventsim compatible and a Completion line ‘END’ (the last
line in a Ventsim Visual™ saved TXT file).
Load any Ventsim file saved as a TXT file to view the structure in a compatible
editor (for example Microsoft Excel™)
Figure 4-4 An example of a Ventsim Visual™ Text File Loaded into Microsoft Excel
Import (DXF / DWG / DM / STR)
Imports DXF , DWG , Datamine and Surpac formatted data (supported by many
CAD and Mine Planning packages).
Importing graphics items can serve two functions. Importing line string graphics
can allow Ventsim Visual to directly create new airways, using the line strings as
centre lines for the development. The centrelines can be converted to airways
during the import function, or later on by selectively clicking or fencing the
centrelines with the Add > Convert function. Further utilities under the tools
menu allows users to quickly turn the new airways into viable networks.
HINT : Converting all imported centrelines to airways can be a problem if some network airways already exist and may be duplicated by this function. Instead, loading centrelines as a reference graphic without converting to airways can allow the user to

Ventsim Visual User Manual Page | 38
check where extensions or changes to a mine network may be, particular if some of the centrelines may overlap existing airways. The reference lines will extend from existing ventilation airways showing where extensions to the mine ventilation network may be required. The referenced centreline can then be selectively clicked or fenced to convert to airways using the Add >Convert function.
A second option allows importing DWG or DXF files as ‘references’, which places
the graphics within the network, but does not affect or interact with the network
airways. Examples may include mine surface terrain, orebodies, actual
development solids etc. This option allows the reference graphics to be used as a
guide to building new airways, or simply enhances the display with more
information about the mine environment. Any solids that are present in the DXF
will automatically be imported as a ‘reference’ graphic, as Ventsim Visual cannot
build new airways from graphical solids (only centrelines)
Figure 4-5 Import Option form showing DXF import options.
Import reference files can be merged with an existing network (for example a
mine addition), and new airways built with DXF centre lines can be set with
default attributes (airway sizes etc) before importing. Attributes can easily be
changed later within the program.
HINT : File imports support drag’n’drop. Simple grab the file from a windows folder or directory and drop it on the Ventsim Visual™ screen. More than one file can be imported at a time by using the SHIFT or CTRL key to select and load the files.
Ventsim Visual will search a DXF file for both line strings and solids, as well
as layers within the DXF file. The import options indicate what action to take
if these items are found.
Layers
The right hand column lists available layers in the DXF file which may be
imported. Only select the layers required to be imported into Ventsim.
Import Options

Ventsim Visual User Manual Page | 39
Centrelines Centrelines (lines or polylines) can be either converted to ventilation
airways, which will carry airflow within a ventilation network, or simply as a
reference graphical line string, which will not affect a mine ventilation
network, but which can be used to help guide and place manually
constructed airways.
Disabling this function will tell the program to ignore any line strings found.
Adds the new imported data to the current network
Tells the program NOT to build airways out of centrelines, but simply import
as a graphical reference. A centreline can be converted later to an airway
using the Add > Convert function.
Surfaces (referenced)
Surfaces or 3D solids cannot be directly converted into airways (unless a
‘convert all’ option is attempted), however 3D data can provide a useful
reference to manually developing Ventsim Airways. In addition, it can
provide an important visual aid to viewing ventilation networks within an
actual mine environment.
Disabling this function tells the program to ignore and not load any solid
graphical data found in the reference file.
Adds the imported data to any existing referenced solid graphical
information already within the network
Adds the imported data as a wireframe line solids, instead of a polygon solid.
Most imported files do not have an internal specification of whether the units
are Imperial or Metric. Ventsim will assume the coordinates are the same as
currently used in the Ventsim file, however if the coordinates system are
mismatched, then the imported data will be displaced to incorrect
coordinates (for example a metric DXF imported into an imperial Ventsim
model). This setting allows you to override the default Ventsim setting to
ensure coordinates will match up.
Allows a DXF file to be imported with an offset from the original file
coordinates. This may be useful to match existing coordinates used in
Ventsim, or when a 2D file single elevation file needs to be moved to a new
elevation in Ventsim.
Flattens the entire DXF file on to a single elevation or level. Occasionally,
flat 2D CAD files may have different elevations set in the file. When these
files are used in a 2D CAD package, the elevations difference may not be
noticed, however when loaded into Ventsim, the elevation differences may
become troublesome in a 3D working environment. If the OFFSET Z option
is entered, then the imported elevation will be at this number when this
option is set.
Import STR (Surpac Strings)
Similar to DXF functionality, Ventsim will attempt to import line strings and
offer to directly convert to airways, or import them as a reference for later
use.
Import Centrelines
Merge Data
Import as reference only
Import Solids
Merge References
Wireframed Only
Metric or Imperial Coordinates
Offset X, Y, Z
2D

Ventsim Visual User Manual Page | 40
Import DM (Datamine Strings and Wireframe Solids)
Similar to DXF functionality, Ventsim will attempt to import line strings and
wireframe solids from Datamine compatible files.
Provides a utility to export Ventsim centrelines,
text and solid graphics to a DXF file for
importing into other CAD software. The colours
and text exported will be set to the current
screen colours and text. Different items can be
selected for exporting. They will be placed on
different DXF layers so they can be turned on or
off independently in the CAD program.
Note that any airway ventilation attributes will
be lost during the export process, and DXF files
cannot be re-imported back in to Ventsim as
ventilation networks.
Provides a utility to separately manage any
imported graphics reference. Each imported
object can be separately coloured, made
transparent or hidden from the main view
through the form options.
Figure 4-7 Reference Graphics Manager
Select one or more graphics objects from
the list with the mouse (hold the shift
key down to select multiple items). A
[+] against the name indicates it is
currently being shown. A [-] indicates it
is currently hidden.
Changes the colour of the items. The
second colour shows the transparency
effect on the colour.
Changes the transparency of the item.
Hides the object from the screen view
Shows the object in the screen view
Joins together two or more selected files
from the reference graphic list.
Removes the reference object from the file
Search all reference graphics for duplicate graphics and removes any
4.2.15 Export DXF
4.2.16 Manage
References
Colour
Transparency
Hide
Show
Merge
Delete
Duplicates
Figure 4-6 Export to DXF Options

Ventsim Visual User Manual Page | 41
duplicates to reduce memory requirements. This function does not remove
duplicates on different reference layers.
Shows the current internal Ventsim memory reserved for storing reference
graphics. If this approaches 100%, consider removing some reference
graphics objects, or alternatively if the computer has sufficient memory
increase the Reference Graphics memory from the Settings > Program
Settings menu.
Allows the user to specify a unique file comment which appears in the top title bar.
This comment can help identify the date, name and purpose of the network.
Allows users to write an extensive descriptor regarding the function or
description of the current network.
This is saved with the file for future reference.
Prints a graphic picture of the network in the View Window to an installed
printer.
Only printers with Windows supported graphics capabilities will be capable of
printing the network. As Ventsim Visual™ uses a perspective view, no particular
scale is applied to the image. The image is sized to the maximum size of the
page and orientation. To reduce colour output, the Ventsim screen colours can
be changed under the Tools > Settings > Colours menu.
Quickly loads files recently loaded or saved.
Loads a generic network of a typical mine.
This is for demonstration purposes only.
Opens the License Manager form.
Memory
4.2.17 Title Note
4.2.18 File Memo
4.2.19 Page Setup /
Print / Print
Preview
4.2.20 Previous File
Listing
4.2.21 Load
Demonstration
4.2.22 License Manager

Ventsim Visual User Manual Page | 42
Figure 4-8 Automatic License Activation and Release
Ventsim Visual™ licenses are floating licenses which can only be used on one
computer at a time. They can be activated for use on one computer and then if
required released and used on another computer (within the terms of the license
agreement). License certificates are stored on the Ventsim server and prevent
simultaneous installation of the same license on more than one computer.
As part of the digital licensing agreement, the license collects the computer
name and user name of the computer that Ventsim Visual™ is currently
activated on. This system protects against unauthorised use of the Ventsim
Visual™ license and informs the user who has currently activated the software
license.
Once a license is activated on a computer, it cannot be moved to another
computer unless it is first released from the activated computer. If another
computer tries to activate the same license simultaneously, this will be
prevented and a warning will display the currently licensed computer and the
login user name of the person who has installed it.
An internet connection is required to activate and release license certificates
from a computer. If an internet connection is not available or an internet
connection is not authorised by your firewall or company administrator, try to
arrange a link to the http:\\ventsim.com website. If this cannot be done, a
manual license transfer can be performed via email located under the file menu.
Licenses
Releasing a License
Registration information
must be entered EXACTLY
as shown on license
details
The site license issued
number. For example if a
site has two (2) licenses,
this may be 1 or 2. Each
license number has a
unique license code
License details found on
the computer. If no
details are present, then
the license is not activated
and will run in VIEWER
mode
Display panel for site with
multiple licenses.
Licenses can be
automatically selected
from this list.
Ventsim Visual User Manual Page | 43
In the event an internet connection cannot be made available to activate the
software, and manual licensing system can be used. The manual licensing
system still requires transfer of a file via email or FTP.
The license request file can be manually saved and emailed to
[email protected]. Once authorised (which may take up to 48 hours), an
authorised license file will be emailed back and can be installed on the computer
via the ‘LOAD’ option under the FILE menu.
This command closes Ventsim. Ventsim will prompt if your network file, fan
database or defaults have not been saved since last modified.
Manual License Activation
4.2.23 Exit

Ventsim Visual User Manual Page | 44
4.3 Edit Menu
Reverses the previous action
Undo is a fully functional undo facility that will undo a number of previous
changes made to a network (up to the buffer size of the undo function). Note
that while it will not directly undo a simulation, by pressing UNDO until your
previously network is in place and then re-simulating, this will produce the same
results.
Redo will reverse the result of the undo function.
Copy airways from one Ventsim Visual™ program to another.
Copy and Paste Airways creates an exact replica of selected existing airways in a
network and pastes them into the same location into the existing or new
network. The function is primarily designed to copying and paste airways
between network files. This may be required to update airways from a network
that has been modified into another network.
To use this function, ideally have two copies of Ventsim Visual™ open with
different network files. Select the Copy Airways menu item, and click on, or
fence the airways you wish to copy.
To paste the airways, move to the new network (or load it up) and select the
Paste Airways menu item. The copied airways will be pasted into the new
network.
If airways become duplicated in the process, Ventsim Visual™ will delete one of
the duplicate copies.
Clones selected attributes from one airway and applies the attributes to another.
Attributes are physical airway parameters such as size, friction factors and shock
losses, as well as identifying attributes such as layers. You can decide which
attributes to apply to an existing airway by selecting the Clone Options function
from the menu or Select Manager Form from the toolbar.
To clone attributes, select the Clone Attribute menu item, and click on an
existing airway. The airway properties will be copied to memory and the
program will automatically enter the Apply Attribute mode.
To apply attributes, make sure you are in the Apply Attribute mode if it has not
already been selected and either click on an existing airway, OR fence a selection
of airways to apply the attributes to that group. Cloned Attributes can be applied
at anytime (even after other editing has been done) and will apply the most
recently cloned values.
LOCK
The lock function described below control how the Ventsim cursor attaches to
other airways or graphics objects. When editing, this is often desirable to ensure
4.3.1 Undo
4.3.2 Redo
4.3.3 Copy and Paste
Airways
4.3.4 Clone and Apply
Attributes

Ventsim Visual User Manual Page | 45
airways attach correctly to other airways or reference graphics while drawing or
editing, however it may become problematic particularly in graphically crowded
environments.
Individual graphical locks can be turned off using the function below. Note that
ALL LOCKS CAN BE TURNED OFF temporarily by pressing the CTRL key while
editing (moving or drawing) airways.
Hint : You may wish to carefully move airway ends or joins, however the move keeps connecting the ends to other nearby (or far away) airways in the same view direction. To disable this behaviour and allow fine control over moves, simply hold the CTRL key down while moving to prevent the airways locking on to other objects.
Locks on to the closest airway when add, moving or copying new airways.
Deselecting this option will allow airways and nodes to be finely moved
without locking on to a nearby node or airway, or to travel through each
other without connecting.
Hint : The lock target can be deselected when arranging airways which are closer together. The lock function when selected will normally lock on to the closest available airway, ensuring a positive join between the airway.
Warning. If the lock target function is turned off, airways may not join into each other precisely (even if they appear close or overlap), resulting in no exit or entry errors. The ‘lock target’ function should always be selected when you intend to join into other airways or nodes. You can check whether airways truly join into each other by turn on the NODE display.
Allows transparent (non active) airways to be also locked, selected or edited.
Transparent airways are normally treated as invisible by the program and by
default cannot be selected or changed. Enabling this function will allow the
airways to be selected or edited the same as any other airway.
Forces new airways, or moved or copied airways to be drawn exactly
vertically when the vertical movement function is chosen (with the SHIFT
key or the RIGHT MOUSE button) while drawing. When this function is not
selected, airways can be moved both vertically and parallel to the plane of
the viewing screen while being drawn.
Hint: Airway drawn or moved with the Lock Vertical function activated can still be
angled. Simply release the SHIFT key or RIGHT mouse button while drawing and
moving when you are at the desired elevation and the airway end can continue to
be moved horizontally at the new elevation.
Locks the mouse onto a referenced graphic surface or wireframe IF AN
AIRWAY IS NOT PRESENT. Ventsim Visual will preferentially search for
airways when clicking to new locations. If no airway is found, when this
option is enabled the program will search for a reference graphic to lock on
to.
Hint: This function is very useful for tracing or moving airways on to imported referenced graphic locations. By using the referenced graphics as a guide, airways can be accurately placed within a network. To force the program to use the
4.3.5 Lock Target
4.3.6 Lock
Transparency
4.3.7 Lock Vertical
4.3.8 Lock On
References

Ventsim Visual User Manual Page | 46
referenced graphics only, and not lock on to other airways, turn the Lock Target options OFF.
Checks whether new airways intercept existing airways, and inserts a node if
they do. The function works by searching surrounding airways for
intersections or crossing paths that are close. Turn this function OFF if you
require an airway to cross another without joining (for example an overcast
airway) or airways are required to be drawn very close together without
being joined.
Hint: When drawing Vent Duct within or close to an airway, ensure this function is turned OFF. The Vent Duct airway may inadvertently join into the adjacent airway, creating shortcuts or duplicate airways.
Control which attributes are applied to new airways.
New airways drawn from existing airways will inherit the settings from the
airways they are attached to (such as size, shape, friction factors etc).
Airways which do not originate from another airway will use the default
setting values.
To force the program to use the Default Values (from the Settings Menu),
choose Default. All new airways drawn (regardless of whether they connect
from existing airways) will use the default settings.
Forces the program to use the Cloned Settings from a previously cloned
airway. For example if a shaft is to be drawn from a horizontal airway,
cloning a similar shaft and then drawing the new airway with this function
set, will result in a new shaft with the same size, parameters and layer
settings as the cloned shaft.
Automatically locates specific airways and moves the screen to selected parts of a network.
Figure 4-9 Find Airway Data
Selecting one of the options will find and highlight the airway searched for. The
option may be repeated for further branches by pressing the Find Next menu
function, the Find tool bar button or by pressing <F3> on the keyboard. To find
All instances of an airway (for example to find all airways with the name ‘shaft’ in
4.3.9 Check Intercept
4.3.10 New Airways
Use Inherited
Use Defaults
Use Cloned
4.3.11 Find / Find Next
/ Find ALL

Ventsim Visual User Manual Page | 47
the airway name, or to find all fans, click on an initial find type and then click on
Find All. All items with these parameters will Highlight and Flash.
HINT – Pressing <F3> will rapidly allow you to search through a network, by repeatedly jumping to the next item. To view more detail about the items being jumped to, LEAVE THE EDIT BOX open. The EDIT BOX will instantly update with detail about every airway that is jumped to.
Highlights or select all airways matching the previous find criteria. For example,
if FIND was used to locate an airway with the name “M52 Decline”, Select All
would select ALL airways with this name in the airway name field. The selected
airway could then be edited or manipulated as a group.
4.4 View Menu
Fits all the display data into the view window.
CAUTION : If display data is from two regions a long way apart (for example data may have been imported into Ventsim Visual™ from a different coordinate system). The Fit All may not be able to accommodate the range of data attempted to be shown, or the camera may be too far away to view the data effectively. Ensure all data is in the same coordinate region before it is loaded or merged.
Resets all hidden levels, layers and airway data and displays the entire
network. Occasionally a network may have hidden or semi-transparent
airways set from a previous action. Show all will quickly bring the entire
network back to full view.
Shows all elevations and layers in the mine.
Levels are definitions or ranges of elevations on which airways data may be
separately located and viewed. Elevation ranges can be given names (such as
‘1140 Level’) in the Level Database. Show All will force Ventsim Visual™ to show
all elevations of airway data in your network, even if they are outside of the
ranges specified in the Level Database.
Show Levels / Layers : Similar to Show All, the respective functions will limit the
showing of all display to the either all levels or all layers.
To select a single level range, use the Right Mouse button and choose the
context menu item Select Level to narrow your range to one or more elevation
levels. Click on one or more airways or fence select a group of airways, and then
Right Mouse click to confirm selection. All airways outside the elevation range
will be hidden or made transparent. The level of transparency can be adjusted
from the Colour Palette Manager.
HINT: Airways outside of the normal range of the LEVEL (elevation) database will be displayed as invisible or transparent. The LEVEL database should have a least one level which encompasses all elevations of airway data in your model.
4.3.12 Highlight or
Select All
4.4.1 Fit All
4.4.2 Show All
4.4.3 Show All

Ventsim Visual User Manual Page | 48
Quick Views are temporary saved views which can quickly be saved and
recalled sequentially outside of the normal Saved View system. Quick views
are not added to the Save View menu selection. The views can be quickly
recalled at any time using the arrow keys. The function primarily assists
with navigation of large networks, where different areas can be quickly
returned to for viewing simulation results.
Save Quick View Creates a temporary view position for a network. The view is added
sequentially to previous stored Quick Views. The sequence of stored quick
view can be recalled or returned to using the LEFT and RIGHT arrow keys.
Clear Current
Clears and removed the currently recalled quick view. The view is removed
from the sequence of other stored Quick Views, and can no longer be
recalled.
Clear ALL
Clears all Quick Views from memory.
Previous Quick View
Recall the previous Quick View from the sequence of saved Quick Views.
Next Quick View
Recalls the next Quick View in the sequence of saved Quick Views.
Copies the screen to the Windows clipboard for direct pasting into an external documents (such as a Power Point presentation). Static Views are
primarily for referencing areas before and after simulation.
Similar to above, but copies any overlying windows (such as legends and
graphs).
Creates a picture copy of the current window in a new form window. Static
Views are primarily for referencing areas before and after simulation. It may
be useful in showing a sequence of changing ventilation simulation results by
storing previous results for comparison with new results.
4.4.4 Quick View
4.4.5 Copy to
clipboard
4.4.6 Copy to
clipboard (all)
4.4.7 Snapshot
Figure 4-10 Examples of using ‘Select All’ and ‘Select Level’

Ventsim Visual User Manual Page | 49
The form window defaults to 25% of the size of the normal view window, but
can be resized or maximised at anytime to show full detail. The static view
forms can be renamed for reference or saved to a picture JPG file for future
use in other software.
Static views are simply picture copies of the original network and remain the
same regardless what happens to a network after the static view is created.
They cannot be edited, moved or rotated. The number of static views
created is only limited by the memory capacity of the computer.
HINT : Both the EDIT box and the FAN DATABASE form can also be reproduced as a STATIC view. This is useful to provide a quick comparison between airways or network results before and after simulation changes. To use this function, simply RIGHT click the EDIT box or FAN form, and select Static View
Sets the edit grid and point of focus to a specified coordinate or elevation.
New airways will be drawn on the specified elevation
The COLOUR MANAGER is a powerful
tool which controls the colour and
transparency of all items on the screen.
Up to 70 types of different ventilation
data can be automatically coloured and
displayed in different ranges. The data
type can be chosen by clicking the box
at the base of the form, and selecting
the data you wish to display. The
colour display can work independently
of the Text units displayed on the
screen.
For example, if the pressure differences relatively to surface need to be viewed in different colours, select ‘Pressure – Relative P’. The colour range according to pressure will be automatically spread across airways, however can be manually adjusted by typing different range values in the top fields. Another option may be to view the Power – Ventilation Cost of airways for a year. The function makes analysing networks and viewing potential problems or solutions very quick
The sliders at the top left of the form can narrow the colour
4.4.8 Set Edit Centre
4.4.9 Colour Manager

Ventsim Visual User Manual Page | 50
spectrum and range shown. By clicking the Check boxes below each slider,
airways outside of this range can be made semi-transparent or even invisible by
using the horizontal slider.
Note that selecting Primary or Secondary layers under the Identifier section will
also show a layer colour legend. Colours on this form can be changed by clicking
the colour box.
See the Colour Manager for further information.

Ventsim Visual User Manual Page | 51
Displays the DISPLAY MANAGER
The display manager allows fine details control over
what is displayed on screen, such as graphics items,
layers, levels and other options.
The Display Manager allows control over graphics
options, elevation levels, layers, saved views and
copy and paste options. It also permits level and
layer names to be changed by pressing the RIGHT
mouse button.
See Display Manager for further details.
Activates the flow animation system to animate flow direction arrows.
This function is for display purposes only, and does not play a part in simulation
or control. Flows arrows are animated at either scale (real time) speeds, or by a
factor of x5 or x10. Flow animation may be left on all the time, but will slightly
hinder system performance, particularly on very large networks.
Controls how much text information is displayed on the screen.
Displays text information for data values, node names, airway names and
error messages.
Hides all text information.
Text data, airway names or node names can be individually turned on or off
by selecting them from the view menu or by selecting or deselecting from
the right mouse button popup menu.
Provides options for limiting the amount of data displayed in a network. For
complex networks, displaying data for every single airway segment this can lead
to a cluttered display, and is often unnecessary, particularly if the data shown is
largely the same (for example airflows). For other items however (such a heat
flows) this large amount of text data can still be useful.
4.4.10 Display Manager
4.4.11 Animate Flows
4.4.12 Text Data
Display ALL
Hide ALL
Data, Airways, Nodes
4.4.13 Limit Data

Ventsim Visual User Manual Page | 52
Figure 4-11 Example of unlimited text display
Hint : For data which may vary from one end of an airway to another (such as temperature), Ventsim Visual™ will always show the ENTRY data on the airway unless otherwise specified.
Figure 4-12 Example of Limited Text Display
Only displays text, nodes and/or arrows on airways which specifically have
‘Always Show Data’ option set in the EDIT box. For example a loop in a decline
consisting of 10 airway segments, will normally show data for every segment.
To only show one text data for all the segments, ensure only one airway is set to
‘Always Show Data”, and the activated the LIMITED > text display. To force an
airway segment to show data, use the EDIT box and click ‘Always Show Data’.
Shows all data for the airways, regardless of whether the ‘Always Show Data’
option is set in the Edit box.
Show Limited
Show Unlimited
Ventsim Visual User Manual Page | 53
By default, all data which is non active (for example levels or layers which are
turned off, data which is outside of the Colour Manager display, or zero flows if
set) are shown as a transparency, with the transparency amount set in the
Colour Manager. To specifically hide some items (for example layers which you
do not want to see), but still show transparencies for other items (for example
Zero Flows or Coloured Data), you will need to individually set which
transparencies are to be shown.
Data : coloured data which is outside of the selection range in the Colour
Manager, and is selected to be hidden can be made transparent, or removed
from the display.
Levels : level elevations outside of the selected ranges can be made transparent
or hidden
Layers (primary and secondary) layers that are not selected can be made
transparent or hidden.
Zero Flows : Airways carrying no flow can be made transparent or hidden.
Hides airways with no flow. This function is useful for hiding disused or
unventilated parts of a mine so they do not clutter the display. Airways with no
flow (or airflow below the level set as zero flow value in the Settings menu) will
be shown as transparent or hidden, depending on the transparency settings
described above, and the transparency amount set in the Colour Manager.
Hides airways which have been set as EXCLUDED from the model. This function
is useful for hiding parts of a mine which are not required to be simulated, or are
not set to be part of the current simulation model. The exclude options for
airways are available from the EDIT box.
Hint: Old sealed off development, or future development yet to be mined can be excluded from the model to speed up simulation and display of models. Excluded airway can be hidden to simplify the display, but can be shown and converted back to normal airways at any time if required.
4.5 Saved View Menu
Saves the current view and stores the save name in menu for future recall. Save
view will save all attributes in a view including RL levels, layers and display
options. Saved views can be pulled back into any current window by selecting
the saved name from the pull down view list.
Deletes the saved view stored in the CURRENT pull down menu list (and hence
removes this name from the list).
Four view orientations are set as defaults
PLAN
EW SECTION
NS SECTION
4.4.14 Transparency
4.4.15 Hide Zero Flow
4.4.16 Hide Excluded
4.5.1 Save View
4.5.2 Delete View
4.5.3 Saved Views

Ventsim Visual User Manual Page | 54
ISO
These standard views will display the network at various orientations (although
the network can still be orientated to the same orientations by using the RIGHT
mouse button. These views cannot be deleted or changed
Caution: The Perspective view will distort some aspect of the views. For example, the plan view will show the airways at the EDIT grid level to plan, but airways above and below this elevation will appear larger and smaller respectively.
Any further saved views will be placed below these items. Saved views save the
position, orientation, colour scheme and data types and attributes of the screen
at the time at which they were saved.
Hint: Saved views are not only useful for recalling the location and orientation of a network. Because they recall selected levels, layers, data types and colours, they can be a quick way to establish a template to edit and view different data aspects of your network. For example, you may have an AIRFLOW view, custom set to highlight a certain range of airflows in different colours, while a ‘HEAT’ view may be saved to highlight a range of temperatures.
4.6 Run Menu
The RUN menu allows menu access to the main simulation functions of
Ventsim Visual.
Standard Functions
Airflows
Steady State Contaminants
Ventsim Visual™ Advanced Functions
Thermodynamic
Diesel Particulates
Dynamic Contaminants
Recirculation
Financial
Undertakes a thermodynamic simulation process, which derives initial airflow
(and mass flows) from an airflow simulation. Thermodynamic simulation is
complex and endeavours to simulate numerous parameters encountered in a
mining environment. The simulation process follows well documented methods
found in books such as Subsurface Ventilation and Environmental Engineering by Malcolm J. McPherson. Heat parameters that Ventsim Visual™ Advanced considers includes
Heat and moisture derived from rock strata and ground water.
Thermal properties of different rock types.
4.6.1 Thermo-
dynamics
[ADVANCED]
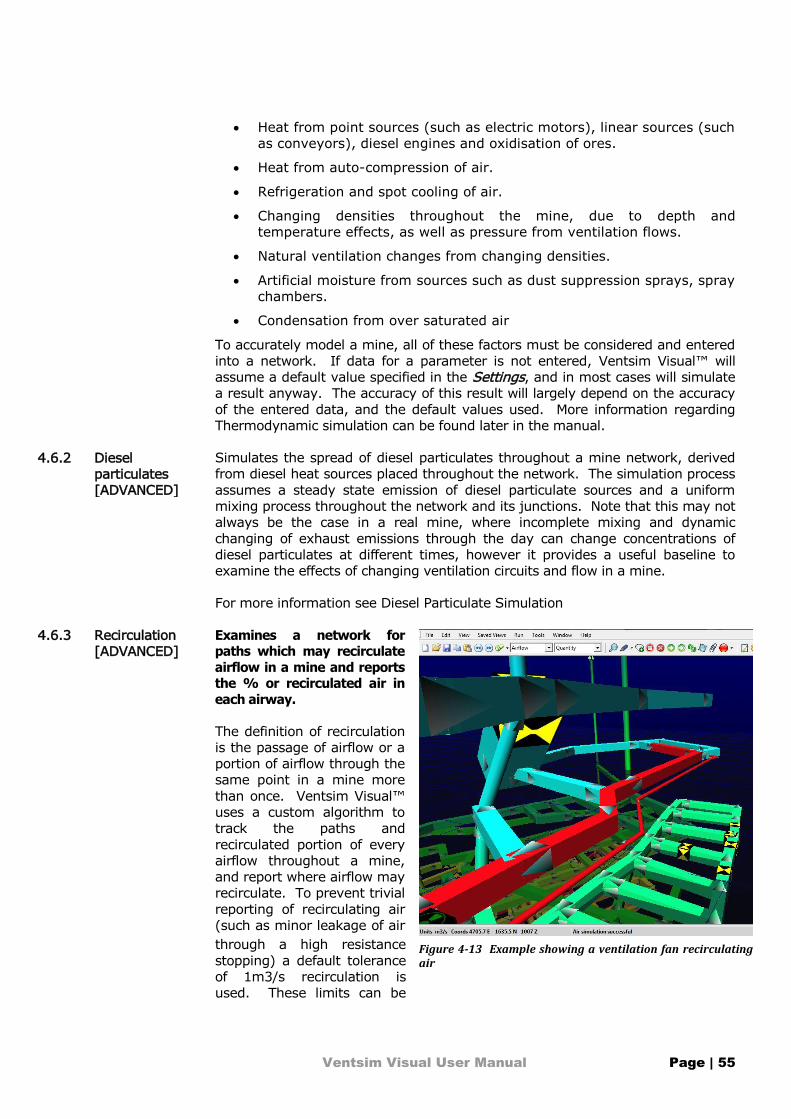
Ventsim Visual User Manual Page | 55
Heat from point sources (such as electric motors), linear sources (such
as conveyors), diesel engines and oxidisation of ores.
Heat from auto-compression of air.
Refrigeration and spot cooling of air.
Changing densities throughout the mine, due to depth and
temperature effects, as well as pressure from ventilation flows.
Natural ventilation changes from changing densities.
Artificial moisture from sources such as dust suppression sprays, spray
chambers.
Condensation from over saturated air
To accurately model a mine, all of these factors must be considered and entered
into a network. If data for a parameter is not entered, Ventsim Visual™ will
assume a default value specified in the Settings, and in most cases will simulate
a result anyway. The accuracy of this result will largely depend on the accuracy
of the entered data, and the default values used. More information regarding
Thermodynamic simulation can be found later in the manual.
Simulates the spread of diesel particulates throughout a mine network, derived
from diesel heat sources placed throughout the network. The simulation process
assumes a steady state emission of diesel particulate sources and a uniform
mixing process throughout the network and its junctions. Note that this may not
always be the case in a real mine, where incomplete mixing and dynamic
changing of exhaust emissions through the day can change concentrations of
diesel particulates at different times, however it provides a useful baseline to
examine the effects of changing ventilation circuits and flow in a mine.
For more information see Diesel Particulate Simulation
Examines a network for paths which may recirculate
airflow in a mine and reports the % or recirculated air in
each airway.
The definition of recirculation
is the passage of airflow or a
portion of airflow through the
same point in a mine more
than once. Ventsim Visual™
uses a custom algorithm to
track the paths and
recirculated portion of every
airflow throughout a mine,
and report where airflow may
recirculate. To prevent trivial
reporting of recirculating air
(such as minor leakage of air
through a high resistance
stopping) a default tolerance
of 1m3/s recirculation is
used. These limits can be
4.6.2 Diesel
particulates
[ADVANCED]
4.6.3 Recirculation
[ADVANCED]
Figure 4-13 Example showing a ventilation fan recirculating air

Ventsim Visual User Manual Page | 56
changed in the Settings form. Recirculating airflows are shown as a portion or %
of air which has recirculated through the same airway.
Note that this is not necessarily the total amount of recirculated air travel through a location, only the portion of air travelling through the current location and returning to the same location. Air in some cases may have recirculated upstream in a different part of the mine, and will not be reported as recirculated in downstream headings that do no recirculate. To view the downstream effect of recirculated air, click on the ‘Recirculated Stream’ data or colour option, instead of the Recirculation % option.
Assists in choosing the most economical airway sizes for the ventilation required.
This function can help optimise the size of shafts or horizontal development
airways, to maximise cost savings in ventilation, while minimising mining costs.
This function can only be used on a single airway (such as a shaft), or groups of
airways with the same size (for example a decline system)
Figure 4-14 : Financial Simulator Output showing life of mine airway costs
Increasing airway size is the easiest way to reduce frictional pressure losses and
decrease ventilation costs in a mine. Increasing airway size however creates
additional mining costs, and this is further exacerbated by the ‘time value of
money’ which dictates that a dollar saved in mining costs now is worth more
than a dollar saved in ventilation costs in the future. Another factor to consider
is how long the airway is required to carry air, which affects how much
ventilation cost can be saved in the future.
The financial simulator takes all this into account, and simulates up to 10
different airways sizes for an airway or group of airways, reporting the effect on
mining cost and ventilation costs as an NPV (net present value cost) adjusted
overall cost.
4.6.4 Financial
Simulation
Selected
[ADVANCED]
Optimum size
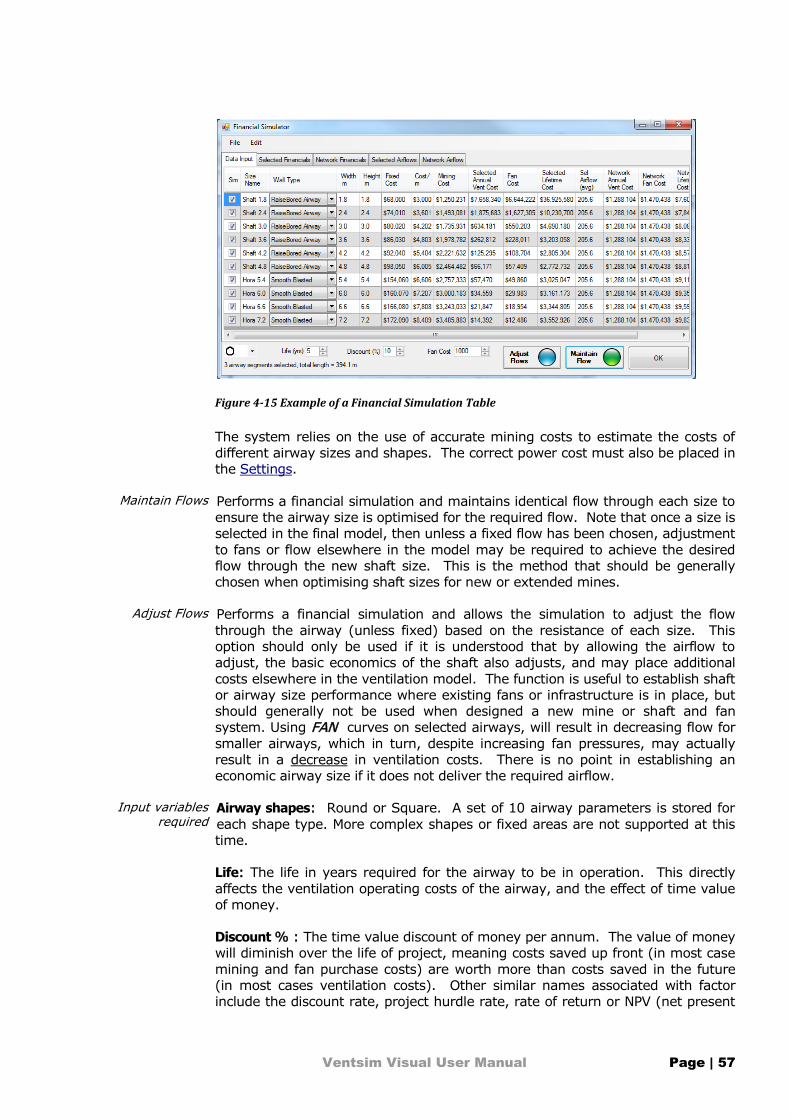
Ventsim Visual User Manual Page | 57
Figure 4-15 Example of a Financial Simulation Table
The system relies on the use of accurate mining costs to estimate the costs of
different airway sizes and shapes. The correct power cost must also be placed in
the Settings.
Performs a financial simulation and maintains identical flow through each size to
ensure the airway size is optimised for the required flow. Note that once a size is
selected in the final model, then unless a fixed flow has been chosen, adjustment
to fans or flow elsewhere in the model may be required to achieve the desired
flow through the new shaft size. This is the method that should be generally
chosen when optimising shaft sizes for new or extended mines.
Performs a financial simulation and allows the simulation to adjust the flow
through the airway (unless fixed) based on the resistance of each size. This
option should only be used if it is understood that by allowing the airflow to
adjust, the basic economics of the shaft also adjusts, and may place additional
costs elsewhere in the ventilation model. The function is useful to establish shaft
or airway size performance where existing fans or infrastructure is in place, but
should generally not be used when designed a new mine or shaft and fan
system. Using FAN curves on selected airways, will result in decreasing flow for
smaller airways, which in turn, despite increasing fan pressures, may actually
result in a decrease in ventilation costs. There is no point in establishing an
economic airway size if it does not deliver the required airflow.
Airway shapes: Round or Square. A set of 10 airway parameters is stored for
each shape type. More complex shapes or fixed areas are not supported at this
time.
Life: The life in years required for the airway to be in operation. This directly
affects the ventilation operating costs of the airway, and the effect of time value
of money.
Discount % : The time value discount of money per annum. The value of money
will diminish over the life of project, meaning costs saved up front (in most case
mining and fan purchase costs) are worth more than costs saved in the future
(in most cases ventilation costs). Other similar names associated with factor
include the discount rate, project hurdle rate, rate of return or NPV (net present
Maintain Flows
Adjust Flows
Input variables required

Ventsim Visual User Manual Page | 58
value) discount rate. To use a value of money not diminished by time or to
estimate undiscounted future savings, use a zero (0) rate. To evaluate projects
however, most mining companies will use factors ranging from 5% to 15%,
depending on the cost of money and the competing project values to be gained
elsewhere with that money.
Fan Cost : The capital (purchase) cost of fans required to provide ventilation
power for the mine simulation. Note that this uses an approximation of $/unit
power cost approach which is only an estimate of actual fan costs, and may vary
substantially when compared to real fans of different sizes. Nonetheless, it
provides an important adjustment to different airway sizes that in most cases
will be accurate enough for selecting suitable sizes.
Sim : Check this box to include the airway size in the simulation. Airway sizes
that are not reasonable or which do not deliver sufficient airflows should not be
included for use as they can distort the graphs to excessive ranges.
Fixed Cost : Many airways, such a shafts have an initial setup cost to establish
the mining method. This option is included to allow this to be factored in to the
overall airway mining costs. It is applied only once for the airway, or group of
airways selected, not applied to each individual airway. In most cases,
horizontal development will not have a fixed cost applied against it.
Variable Cost :The cost per unit length of development or mining. Using this
value, Ventsim Visual™ calculates total mining costs based on the length of the
airways selected.
Mining Cost : Total cost of mining the airways
Fan Cost : Cost of the capital cost portion of fan infrastructure required to
produce the ventilation flow. Note only the portion of fan cost related to
providing ventilation for the selected airway will be used.
Selected Annual Vent Cost; Cost of ventilating selected airways for one year.
Note this is only the frictional cost of the airway, not the power cost of
distributing air through the network.
Selected Lifetime Cost : Total cost of mining and ventilating selected airways for
the life of the airways.
Network Annual Vent Cost: Cost of ventilating the whole of network for one year
Network Fan Cost : Combined cost of all fan purchase costs based on the
required ventilation power for the entire network.
Network Lifetime Cost : Combined cost of mining selected airway plus cost of
ventilating whole of network for life of the airways.
Sel Airflow (avg) : Average airflow through each selected airway
Net Airflow (total) : Airflow through entire mine network.
In most cases, only the Selected Airway costs and graphs will be relevant to the
simulation results, however at times it is important to consider the effect of
changing airway sizes on the rest of a mine.
Financial Simulator Outputs

Ventsim Visual User Manual Page | 59
For example creating a large shaft to deliver more airflow to a mine, may simply
increase the cost of the airflow through other parts of the mine, offsetting some
of the expected ventilation savings. For this reason, Total Network ventilation
costs are included as a separate column and graph, and should be considered if
the project is an addition to a mature mine.
Checks and reports on all
airways within a mine network on their size suitability to carry
the simulated air.
This is a broad function which
utilises the default cost settings
to determine to cost of airflow
through each airway for the life
of the mine. The cost
component costs are a relative
mining cost, and fan capital cost
component and a lifetime
discounted power cost to
provide the ventilation.
The simulation will only report
airways which are over-restricted and potential cost savings exist by making the airway larger. While smaller airways could also be more economical, Ventsim
ignores this option as this type of airway is usually sized for a certain means (eg
truck access), and it would be distracting to report all possible size reductions.
To check individual airways for size reduction options, it is suggested the Select
Financial optimiser be used, or the Suggest (?) button in the Edit airway form.
Simulates the downstream spread or the upstream source of contaminants in the
air. These routines are generally used to identify the path and spread
concentration of fumes, gases, dust and smoke from a contaminant source, or to
predict where the airflow for a particular location comes from. The routines are
not generally recommended for large fires, due to the dynamic and changing
nature of fires, and the dynamic heat effects on natural ventilation pressures.
To clear any contaminants or gases from a ventilation model, select the Clear
Contaminants option from this menu, or the toolbar menu.
See the Contaminant Simulation section or the Gas Simulation section for further
information.
Displays a brief summary of your network collectively, or grouped under different
TABS. The data may be copied to the clipboard, for pasting into another
package such as Microsoft Word, or an email.
An example output is listed below from the Advanced version with explanations.
NETWORK AIRWAYS 2772 Total number of discrete airways in a network
Total length 66196.0 m Total summed length of all airways
4.6.5 Financial
Simulation
Global
[ADVANCED]
4.6.6 Contaminant
Simulations
4.6.7 Summary
Figure 4-16 Global Optimisation

Ventsim Visual User Manual Page | 60
Total airflow 1025.5 m3/s Total airflow returned to the surface
Mine resistance 0.00164 Ns2/m8 Cumulative resistance of moving the total airflow through the mine
POWER SUMMARY
AIR (loss) Power 1772.2 kW Total theoretical power required to move air through all airways
INPUT Power 3609.2 kW Total installed electrical power
required to move airflow
Consisting of ..
9 fans @ 3607.6 kW
0 fixed press @ 0.0 kW
2 fixed flows @ 1.6 kW
Network Efficiency 49.1 % Ratio of theoretical to installed power. Network efficiency will decrease as
more fans are required to boost airflow through mine. Placing fans in series (i.e. boosting) accumulates fan efficiency losses at each stage of the fan.
NETWORK FAN SUMMARY
Fan Installations 7 Total fan installation in network
Fan Numbers 9 Total number of fans in network
Fan Sites Switched Off 0 Fans turned off
Fan Sites Stalled 0 Fans operating at their maximum pressure
Fan Sites Low Pressure 1 Fans operating at a pressure beneath the lowest fan curve pressure, but still above zero
Fan Sites Negated 0 Fans running with no or negative
pressure added
Fans running reversed 0 Fans running in reverse (user selected)
Total fan power 3607.6 kW Total of all fan electrical power. The is calculated from fan shaft efficiencies, and motor efficiencies. The fan power
is calculate from the fan power curve. If the curve is unavailable, it is estimated from the fan total efficiency curve. If this is unavailable, the default fan efficiency is used.
HEAT & MOISTURE INPUT SUMMARY
Diesel Sources 0.0 kW from 0 sources
Sources of diesel heat and contaminants
Sensible Heat Sources 0.0 kW from 0 sources
Sources of sensible (dry) heat
Linear (S) Heat Sources
0.0 kW from 0 sources
Sources of heat distributed along multiple airways
Latent Heat Sources 0.0 kW from 0 sources
Sources of latent (vapour) heat
Oxidisation Heat Sources
0.0 kW from 0 sources
Sources of oxidising heat
Electrical Heat Sources 3609.2 kW Sources of electrical heat
Total Input Heat 3609.2 kW Total heat input from man-made influences
Total Strata Heat 2885.1 kW Total heat input from heat dissipated

Ventsim Visual User Manual Page | 61
from rock
TOTAL HEAT SUMMARY
6494.3 kW Summation of all heat
Total Refrigeration 0.0 kWR from 0 sources
Refrigeration installations
HEAT BALANCE TOTAL 6494.3 kW Summation of heat minus refrigeration
Moisture Point Sources 0 Number of point moisture sources
(such as conveyor dust suppression spray)
Moisture Linear Sources
0 Number of liner moisture sources (man-made, such as decline dust sprays)
Moisture Input as Latent
0 ml/sec Summary of moisture added from latent heat sources (such as diesel engines and latent point sources)
Moisture Airway Surfaces
4404 ml/sec Summary of moisture evaporated from rock strata
Network condensation 0 ml/sec Summary of moisture condensed as water (normally in upcast exhaust shafts)
MOISTURE
EXHAUSTED
4403 ml/sec Total moisture exhausted from mine.
HEAT AUDIT
Input heat below surface
6454.5 kW Check to make sure heat exhausted from mine, is accounted for from summation of underground heat
sources.
Elevation adjustment 29.5 kW Adjustment due to inlet / exhaust elevation differences (auto compression)
Differential inlet to
outlet
6469.9 kW Different between inlet from surface
heat, and exhaust to surface heat
Potential heat imbalance
14.1 kW (0.2 %) Error between the underground inputs and the surface recordings
Potential temp imbalance
0.00 C degrees Potential error in temperature as a result.
Figure 4-17 Example of Summary Output with Description
Heat Audit errors normally occur due to changing air densities during the heat
simulation, not been reflected in slight changes in air and mass flow. This small
error is corrected next time the simulation is run, however the next simulation
also adds slight changes to density, and hence the error is never truly
eliminated.
It depends on the network and tolerance for temperature margins, however up
to 5% is generally acceptable, and will only give a slight imbalance in
temperatures. Errors beyond 5% should be investigated to ensure major
recirculation, or some other heat imbalance is not occurring in the model.
A selection of graphs derived
from network model parameters.
The energy losses show the loss
of input electrical energy into
various ventilation losses such as
wall friction, shock loss and exit
losses. Exit losses represent
power lost due to the velocity of
How much Heat Audit Error is too much?
Graphs
Figure 4-18 Mine Summary Graphs

Ventsim Visual User Manual Page | 62
ejection of exhaust air into the atmosphere. Note that some of this energy can
be recovered and converted to useful fan static pressure by increasing evasé size
and reducing exit velocities.
Heat Gain / Losses show the addition and removal of heat into the mine
atmosphere. Note that while autocompression is a significant heat addition to
deeper mine, the heat is removed when air travels back to the surface. Also
note exhaust fan heat on surface fans has been deliberately excluded from this
summary as the heat does not directly affect underground atmosphere.
Moisture Gain show the addition of moisture to the underground atmosphere.
Note tha in most cases, moisture is due to either evaporation from rock strata or
from diesel engine latent heat.
4.7 Tools Menu
A selection of tools and settings to check, modify and fine tune the network
Displays a dialogue window which allows editing, adding and deleting of all fans
in the network fan database. Up to one thousand (1000) fans and the
associated fan curves may be entered into the fan database. A display for each
fan curve and data will be presented when a fan is selected from the display list.
The Edit > copy and paste functions can be used to copy data to or from another
program (for example a spreadsheet).
Caution should be taken when deleting or modifying a fan, as any network which may have used that fan number, will still attempt to use that particular number fan's data. If the data is not present, or is different, the network will not simulate properly.
The fan name is entered or chosen at the top
from the pull down menu. To enter a new
fan, select File > New
At a minimum, fan curve points for quantity
and either fan static or total pressure must be entered for each fan. Other curve
information such as efficiency and power can
also be entered to assist Ventsim Visual™ in estimating fan power and heat.
Density is an optional parameter, which will
be assume a default value if not specified.
In Ventsim Visual™ Advanced, fan performance is adjusted for density changes
in the mine. Most manufactures supply their fan curve at a standard density,
however different densities can be entered for your fan curve if required.
4.7.1 Fans
Density
Figure 4-19 Fan Curve Entered into Ventsim Visual

Ventsim Visual User Manual Page | 63
Diameter is also an optional parameter describing the exit diameter of a fan.
This may be the diameter of the fan casing or an evasé if fitted. Ensure the fan
curve entered is for the specific fan configuration (check with your fan
manufacture for this). Adding or removing an evasé from a fan for example can
significantly change the fan performance (although the fan total pressure curve
will remain the same). Where only a static curve is available, the diameter can
help estimate fan total pressure and the associated power consumption.
Where only fan total pressure is entered, the fan diameter can help estimate
available fan static pressure, a consideration for surface exhaust fans. Finally,
the fan diameter can also help estimate new curve points for the fan database, if
either the fan static or total curve is unavailable. See the fan database section
for more information.
Hint: It is recommended where fan pressure curves are provided without the modelled effects of an evasé (which is normally how fan manufacturers provide the curves as mines may mount the fan in different configurations), any evasé effects should be independently modelled by using the edit box options to place an evasé in the airway, not by changing the fan diameter or curve behaviour.
Fan speed can be individually changed at different fan locations, and will
calculate the theoretical fan performance difference at different speeds. Note
that this is a theoretical estimate only, and may become less accurate where
extremes of fans speeds are used.
ReverseP and ReverseQ modifies performance for fans run backwards for an
emergency situation. Most manufactures will not supply these figures as fans
are not generally designed to do this (although some fans can be designed to
perform better in reverse than others). These figures ideally need to be derived
experimentally be measuring actual fan performance with blades running in
reverse. Ventsim Visual™ initially defaults to 0.5 for both (50% of maximum
pressure and 50% of maximum airflow).
The method used to estimate curve data between specified fan duty points. The
cubic spline method estimates a curved data path between fan points. If only a
few points of data are available, this may produce a better estimate of fan duty,
however the method may be limited by sudden changes in curve data point
direction. Ensure sufficient points are available to produce a smooth non-
reversing curve.
The linear method predicts a straight path between points. This method is
slightly faster during simulation, and if the maximum number of fan points (10)
are entered, it should provide sufficient accuracy in most cases.
HINT: It is important that pressure on the curve is not permitted to bend over in a U shape (or upside down U), otherwise the simulation may oscillate between two pressure points. Stall regions of fans should be omitted for this reason.
Comment box is included to describe more information about the setup or
configuration of the fan.
Fan Point Table : The table will allow direct entry of fan curve data. Fan curves
will be constructed as data is entered. Points can be submitted non-sequentially,
and will be automatically rearranged when the fan is re-loaded or saved.
Diameter
Fan speed
Fan Reversal
Curve Estimation
Comments
Point Table

Ventsim Visual User Manual Page | 64
To calculate fan power within a network, Ventsim Visual™ needs either a fan
efficiency curve or a fan power curve. If neither of these curves are available,
the default fan efficiency will be used from the Settings menu. If both efficiency
and power curves are entered, Ventsim Visual™ will preferentially use the fan
power curve to calculate absorbed fan power.
Most fan manufactures supply one or both of the pressure curves. Ventsim
Visual™ differs from Ventsim Classic 3.9 in that it has an option in the Settings –
Air Simulation menu to universally use fan total pressures (FTP), fan static
pressures (FSP) or a mixture of both.
Using FSP curves will ignore the fan velocity pressure (FVP) portion contribution
to network pressures, but will also ignore any system exit velocity losses to
surface throughout the network.
Using FTP curves will include the FVP portion, but will include system exit velocity
pressure losses as part of the network system total pressure.
More information is available in the Settings Chapter.
The case for Fan Static Pressure Simulation
It is technically correct for simulations to use fan total pressure (FTP) curves for
fan installations. Fan total pressure however is not always converted into useful
ventilation energy due to outlet losses from fan installation configurations.
Traditionally, Ventsim Classic 3.9 has encouraged users to utilise fan static
pressure (FSP) curves for modelling, (although FTP curve modelling was included
as an option). Using FSP curves excludes the velocity (dynamic) component of
fan pressure curve which is therefore assumed not to contribute to the overall
system pressures in a network simulation. To partly offset the lack of fan
velocity pressure inclusion, the system exit velocity pressures (the velocity
pressure loss to the network from air exiting from shafts or other exhaust
airways) are also not included by Ventsim Classic 3.9 in calculating overall
system pressure. While these two factors partially cancel each other out, using
Static curves for underground fans is likely to give a slightly conservative system
pressure and airflow if fan exit (shock) losses are modelled identically for both an
FSP and FTP case.
When designing a network, this may be advantageous to provide contingency for
design simulations. In addition, use of FSP curves is less reliant on accurately
modelling fan exit shock losses, and provides a greater contingency for design
airflow. In general, they may be more suitable to use for a less experienced
user.
The case for Fan Total Pressure (FTP) Simulation
FTP Simulation will allow Ventsim Visual™ to utilise the full fan total pressure
curve for network system pressures. Provided fan exit shock losses are
modelled to consider the fan installation and exit airflow orientation, then this
method should provide more accurate results. In addition, as Ventsim Visual™
will consider system exit velocity pressures when FTP modelling is selected, fan
exit diameters, airway surface exhaust sizes or evasés sizes are adjusted to
simulate the effect of on surface exhaust airways and mine system pressure.
Should I Use Static or Total Pressure?

Ventsim Visual User Manual Page | 65
Note: Increasing fan diameters or including evasés in Ventsim Visual™ for underground installed fans will have no automatic effect on network simulation results, as it will not change the surface velocity pressure exit losses. It may however decrease shock losses at the fan exit, which if modelled in Ventsim Visual™ by changing airway shock loss will result in improved fan performance.
Evasé Hint: If the Fan Total Pressure Method is chosen, the effect of evasé size on surface exhaust shafts can be easily examined. Simply click on the surface airway, and select evasé and place a size. The size must be larger than the original airway. Alternatively, you can construct a short enlarged surface connection airway which will produce a similar effect to including an evasé option in an airway.
In Summary
In most cases, if fan exit shock losses are modelled with the same factors, the
FTP pressure method is a more accurate method and will deliver slightly more
airflow through a mine. This may or may not be significant for your model and
should be considered when examining the overall contingency built into the
model.
The tools menu contains a number of functions to assist in estimating fan static
or total fan curves as if either one is unavailable, as well as fan total shaft
efficiency and fan absorbed power if either one is unavailable. This may be
required if only a Fan Static Pressure (FSP) curve is available, and you wish to
simulate the network using a Fan Total Pressure (FTP) curve.
Ventsim Visual™ will use the outlet diameter of the fan to calculate the velocity
exit pressure of the fan, and thereby calculate the missing static or total
pressure curve. To estimate absorbed power, Ventsim Visual™ will calculate
theoretical power using total pressure and airflow. Note that none of these
estimation methods take into account shock losses, resistance and compression
factors which will slightly affect calculated pressure and powers. It therefore
should be used as a guide only, and is no substitute for an accurate fan
manufactures curve if available.
Quickly estimates 10 evenly spaced points of fan curve duty from as few as 3
entered points. The estimation method will use the Cubic Spline method to add
the additional points. This method should only be used if additional fan curve
data is not accurately available.
A list of elevation ranges on which airway data can be individually viewed.
A dialogue window is displayed which allows editing or creating of a list of levels
(elevations) between which airway data is located. The level list can contain up
to 1000 levels on which your network will be created.
Elevation data can be edited in any order, as well as added at a later date -
Ventsim will sort the data from highest to lowest when next displayed.
To select which levels are displayed, choose the View Options toolbar button,
Select Levels and click which levels you want to display. Alternatively, levels can
also be independently set by using the mouse context pop-up menu (right
mouse button on the screen) to Select Levels. Level can be chosen by clicking or
fencing a range of elevations, and then Right Click the screen to commit those
changes.
Estimate Tools Menu
Estimate Fan Curve
4.7.2 Levels

Ventsim Visual User Manual Page | 66
To view ALL levels at any time, simply use the Right Click pop-up menu to select
All Levels.
Displays a list of currently viewed airways in a spreadsheet form.
A READ ONLY spreadsheet of airway data is displayed which can be copied and
pasted to other applications such as Microsoft Excel or Word.
Up to 70 different types of data can be displayed on the spreadsheet. To display
different data types, use the SELECT > DATA OPTIONS menu to select which
data you wish to display.
Data can also be removed from the spreadsheet, by selecting EDIT > REMOVE or
using the right mouse button.
Data columns can be reordered by selecting the column title and dragging to a
new location. In addition columns can be resized and resorted by using the
appropriate menu commands.
Hint : The spreadsheet function is not designed for editing data. Extensive data characteristics for each airway can be displayed, and copied to external programs such as Microsoft Excel ™. Ventsim Visual provides an Index number and a Unique number reference for each airway. The Index number is referenced internally and during simulations by Ventsim Visual, but may changed for each airway as airways are added or removed. The Unique number will not change, and should be used as a permanent reference number to each airway if other identifiers such as names are not used.
Figure 4-20 Spreadsheet view of network with selected data
4.7.3 Spreadsheet

Ventsim Visual User Manual Page | 67
The utilities sub menu provides many functions to assist with manipulation of
airway data, particular raw data which may have been input from a DXF import
or similar.
Filtering tools consist of a selection of airway utilities to help correct overly complex, disconnected or overlapping raw network data. The tools can be
run simultaneously as a group, or individually.
The All Tools tab in the form, allows simultaneous filtering using the various
selected tools. Alternatively, each tool can be selected and run individually
from the other tabs.
Figure 4-21 Filtering Tools Combined
Simplify allows the user to reduce the number of airways in a network to a more efficient number without affecting the overall network analysis.
It is particularly useful where a network has been imported via a DXF file and
contains a large number of very detailed but unnecessary small connected
airways.
Simplify will search a network for sequences of airways that may be reduced to a
single straight airways. In doing so, much of the overhead and effort required to
set parameters to every airway can be reduced. Note that the simplify function
will only combine airways that have a single entry and exit. Airways at junctions
and split branches will remain untouched.
4.7.4 Utilities
4.7.5 Filtering Tools

Ventsim Visual User Manual Page | 68
Figure 4-22 The simplify dialog box
The Max Angle option specifies the maximum angle between two airways being
considered for merging. For example, if the original network contains a number
of airways that form a curve and Max Angle is set to 20 degrees Simplify will
keep on merging airways until the airways being considered have directions
changed by 20 degrees or more.
The Max Length option restricts only airways with lengths up to the value length
from being combined. For example if set to 30m, only airways with lengths of
less than 30m will be considered for merging and simplifying.
In general, the higher the values of the Max Angle and Max Length settings, the
more aggressively Ventsim Visual™ will seek and combine airways.
Ensure the new length of a combined airway is fixed to remain exactly the same
as the original combined lengths even if the original airways formed a curve. If
not set, the new lengths will be recalculated as the true length of the new
straight line.
Ensures that airways with a preset resistance (such as a bulk headed airway)
are not simplified and merged with other airways.
Check to see if airways that are considered for merging and simplifying are only
joined if they are exactly the same size.
Similar to dimensions, only airways with similar wall (friction factor) types are
joined.
Only simplify selected airways and ignore all others.
HINT : Short irregular airway segments are best simplified with high joined angle settings (+45 degrees) or smaller joined length settings (<20m). Long smooth airway segments are best simplified with low joined angle settings (<20 degrees) and high joined length settings (>50m). Note that airway can be individually or group selected for simplification.
Maximum Joined Angle
Maximum Joined Length
Use combined lengths:
Ensure no resistance presets filtered:
Ensure airways dimensions are the
same:
Ensure wall types are the same:
Selected airways only:

Ventsim Visual User Manual Page | 69
Binding connects disconnected airways ends or intersections. Many imported DXF files do not have correctly connected centre lines or ends. This function will
search for unconnected ends or crossed airways and join them together if they
are close enough. Airways must always be correctly joined to allow air to flow
Figure 4-23 Binding Tools
Bind loose airway ends
Defines the distance to join airway ends in a network which are close together
but do not join. Imported DXF file commonly have airways which don’t exactly
join due to editing or drawing inaccuracies in the original file. Airways which do
not exactly join in Ventsim Visual will not flow air, and will result in a No Ext /
Entry warning.
The search radius can be entered in the preset box. For example a search radius
of 4 will join any loose node (airway end without another connection) to any
airways within 4m of another node.
Warning : This function is intended for preliminary cleanup of new networks, not for existing balanced networks. It can permanently change the characteristics of your network and may delete some preset items of values.
Bind adjacent nodes Defines the distance to join adjacent connected nodes in a network which are
close together but do not join. This function is a little like simplify, in that small
airways between the joined nodes will be removed.
Warning : Selecting this option with too greater distance can seriously distort the model. Use with caution or not at all.
Bind airway ends to Junction Defines the distance to join airway ends to nearby airways which do not have a
node or end. It effectively splits and joins into the new airway. Imported DXF
file commonly have airways which cross the path of airway ends, but do not
have a joining node. This function will create a joining node. Airways which do
not exactly join in Ventsim Visual will not flow air, and will result in a No Ext /
Entry warning.
4.7.6 Binding

Ventsim Visual User Manual Page | 70
Warning : This function is intended for preliminary cleanup of new networks, not for existing balanced networks. It can permanently change the characteristics of your network and may delete some preset items of values.
Bind Crossed Airways at Intersection Defines the distance for joining airways which intersect or come close to
intersecting, but do not have a joining node. It effectively splits and joins both
airways into new airways. Imported DXF file commonly have airways which
cross the path of another airway, but do not have a joining node.
Searches for airways which have duplicates in the same or similar position.
Duplicate airways can cause problems with air simulation due to poorly defined or hidden flow paths that the user cannot see.
Figure 4-24 Duplicate Finding Tools
Adjacent Angle is the maximum angle difference between adjacent airways that
may be considered as a duplicate. Airways next to each other with greater
angles between them will not be considered as a duplicate. The smaller the
angle in degrees, the more ‘parallel’ and airway must be to be considered a
duplicate.
Adjacent Distance is the maximum distance two adjacent airways can be apart
before they will no longer be considered as duplicates. The smaller the distance,
only closer airways will be considered.
Exact select only an exact matching airway as a duplicate
Reversed selects airway the same, but facing opposite directions.
Similar selects airways similar but not identical. The adjacent angle and distance
will be used as a criterion for selection.
Action defines what action will be taken when the duplicate airways are found.
4.7.7 Duplicates

Ventsim Visual User Manual Page | 71
Moves the model airways on to a 3D surface or contour plan, effectively converting the model from a 2D plan to a 3D model. Note that if only parts of a
model need to be converted, they should first be selected with the Select tool
Figure 4-25 Filter Airways
Use Reference 3D Lines :Uses lines (such as contours) loaded in from a DXF as a
reference to convert the model to 3D.
Use Reference 3D Solids : Uses solids (such a terrain polygons) loaded in as a
referenced DXF object, to convert the airways to 3D,
Simple Method : A fast method which searches the closest 3D reference point.
Suitable for relatively flat conversions
Detailed Method : A slow method which searches for the closest vertical
intersection. It is more suitable for rugged 3D surface conversion.
HINT : To convert a multi seam of level model to 3D using this function, individually group select the airways required, and ensure only the relevant 3D DXF object for that level is turned on before conversion.
Selects any airway with one or both ends not connected to another airway. The
selected airways can be deleted or edited and set in the EDIT box (for example)
to ‘allow closed ends’. Loose ends such a dead end heading stubs (like truck
bays or sumps) often do not carry air and can be deleted from the network
quickly with this function.
Reverses the Easting and Northing coordinates. This may be useful where the
coordinate system in Ventsim Visual™ does not match the directions used on the
Mine Plan Grid. Where the direction of the coordinates needs to be reversed, use
the Settings > COORDINATES settings to change direction of the axis
coordinates.
A utility which rotates all (if none are selected) or just the selected airways by a
number of degree around the point of focus. The point of focus is always at the
centre of the screen. It can be set by middle clicking the mouse button on a
point, or by entering the centre coordinates in the View > Set Edit Centre option.
4.7.8 Convert To 3D
4.7.9 Select Loose
4.7.10 Swap Axis
4.7.11 Rotate
Coordinates

Ventsim Visual User Manual Page | 72
A utility which scales all airway coordinates by an input factor. This effectively
reduces or increases the size of the network without changing the airway size.
The airway length will not be changed if it has been fixed.
Warning this function should only be used to scale schematic ventilation network with predefined fixed airway lengths. Scale a network without fixed length will change the airway length and resistance, making it invalid for true scale network simulation.
A utility which scales all airway dimensions by an input factor. This effectively
reduces or increases the size of the airways in the network.
Warning this function will rarely find a practical use. Scale network airway sizes will change the airway resistances, making it invalid for true scale network simulation.
Modify a selection of airway specific parameters
Fixes or un-fixes airway lengths, so that networks may be manipulated without
changing the calculated airway lengths.
This will fix and protect all airways in the network from changes in length when
moving airways. This may be useful if airways are required to be moved for
clarity, but lengths must remain the same.
This will un-fix and recalculate all airway lengths in a network.
This function will recalculate airways lengths and hence change any previously fixed lengths. If there are any doubts, use the EDIT function to individually fix/unfix lengths of only the airways that need to be changed.
Automatically places a code number on every airway without a current airway
name. A letter may be specified to head the number if desired (e.g. B157).
Helps reduce text data shown on screen.
This function search selected airways (or if no selection made, all airways) for
continuous airway segment groups without junctions, and limits data display to
only one of those airways. When the menu item TEXT DATA > LIMIT DISPLAY is
selected under the VIEW menu, the display will only show text data on the single
airway segment.
HINT As many continuous airway segments show similar data (such as airflow amounts), reducing text display to just one airway per segment group can significantly reduce text clutter on the screen. If the automated function does not select the desired airway to show the data, simply EDIT the desired airway an check ALWAYS SHOW DATA.
Resequences the order of airway numbers in a Ventsim Visual™ network.
4.7.12 Scale
Coordinates
4.7.13 Scale Airway
Size
4.7.14 Airways
Lengths
Fix All Lengths
Unfix All Lengths
4.7.15 Auto Name
4.7.16 Limit Display
Data
4.7.17 Resequence
Index/Unique
Numbers

Ventsim Visual User Manual Page | 73
Index numbers are dynamic numbers representing airways stored internally in
Ventsim Visual. The numbers may change as airways are deleted or added.
Ventsim Visual™ uses Index numbers to refer to airways during simulation and
when indentifying problems. All index numbers are sequential and the highest
index number will be the sum of all airways. Resequencing index numbers
renumbers all airways from higher elevation to lowest elevation, easting to
northing.
Unique numbers are static numbers which do not change when airways are
deleted or added. Numbers are sequenced incrementally from the last highest
unique number. As such, as airways are added and deleted, there may be large
gaps of numbers between airways. Unique numbers are a useful reference to
identify the same airway as the network is developed. Resequencing the unique
numbers renumbers all airways from number 1, sequentially top to bottom to
the last airway.
HINT Resequencing numbers is not a requirement in Ventsim Visual, but may simplify tracking airways, as the resequence function tends to group airways in similar locations with similar numbers. This is particular handy in the SPREADSHEET function which initially lists airways in sequential index order.
This option allows detailed checking of networks, and will identify areas of your
network that may cause problems during the simulation process. A network with
too many redundant bulkheads (bulkheads in the same airway path as other
bulkheads), or fans that are in the same airway path as other fans, may result in
a network that will not converge.
Finds and alerts the user to fans that are directly competing against other fans.
Finds and if desired remove bulkheads that are not necessary (usually because
another bulkhead in the same airway has already stopped the airflow).
Removes all airflow and temperatures from a network. The simulation processes
is restarted with fresh data. Ventsim Visual™ utilises flows, densities and
temperatures from previous simulation to help it to recalculate new simulations
faster and more accurately. If data has been corrupted during a bad simulation
(which may have produced errors, excessive airflows, heat or densities), this
may hinder subsequent simulations from finding an acceptable solution, or may
simply produce further errors.
Resetting the network will remove all calculation flows, pressures, densities and
heat. It will NOT remove any values fixed by the user, such as fixed flows,
pressures or heat sources.
Sets the metric and imperial conversion units and factors used for Ventsim Visual,
as well as the number of decimal points to show on the display.
The conversion table displays the metric and corresponding imperial units for
each type of data used in Ventsim Visual. The table is saved with every network,
and can be individually modified for each network file. The conversion settings
can be inherited by other networks or saved in a template file.
The imperial unit names and factors may be freely changed to suit the region or
preference of the mine. The imperial column in the table may even contain
metric units if required, by setting the imperial unit name to a metric text value
and a conversion factor of ‘1’.
4.7.18 Troubleshoot
Restrictive Fans:
Unnecessary Bulkheads:
Reset Network
4.7.19 Conversions

Ventsim Visual User Manual Page | 74
Figure 4-26 Conversion Table
Sets the number of decimal units to display on the screen and in text displays.
Example A value of three (3) for example will display a value of 23.123 on the graphics display, or in the spreadsheet view.
Caution While the metric unit text name can be changed, the underlying metric value cannot be changed. For this reason, the units must remain the same as preset in Ventsim. For example, the Velocity cannot be changed to km/hr as this would represent a different value scales, and the underlying Ventsim equations are hard corded to use m/s.
A text name describing the imperial units.
The factor used to convert from metric to imperial. Ventsim Visual™ performs all
internal calculation using metric formula and methods, converting displayed data
back to imperial (if set in SETTINGS). The factor is used to convert to and from
metric to imperial, and will result in errors if not properly set.
This factor is only used in converting degrees Celsius to degrees Fahrenheit, and
added to the metric value before multiplied in imperial.
A list of preset factors and characteristic used for placing in airways.
Presets include
Resistances
Friction Factors
Shock Factors and Equivalent Length
Heat, Refrigeration and Moisture Sources
Layers
Air Types
Decimals
Imperial Unit
Multiplier
Addition
4.7.20 Presets

Ventsim Visual User Manual Page | 75
Fans (limited to header information only)
Values entered into the spreadsheets will be made available for attaching to
existing airways from the Edit box. Updating existing values in the preset
spreadsheet will automatically change all airways with that preset on the next
simulation.
Warning : Be careful when removing existing settings from the preset spreadsheet. Settings removed which already belong to an existing airway, will force the airway to ‘set’ the values permanently.
Figure 4-27 Preset Table Options
An extensive list of settings used by Ventsim Visual™ that controls the behaviour, simulation parameters and visual appearance of the program.
Settings are divided into a number of categories, including.
Category Description
Airway Defaults Controls parameters of the simulation process for airflow
Colours Colours of the background and text used for display
Costing Costing assumptions for financial reporting and analysis
Graphics Visual appearance of graphics, sizes of objects and text
on screen
Heat Physicals Actual parameters of air and rock conditions used in
4.7.21 Settings

Ventsim Visual User Manual Page | 76
simulation
Model Coordinates Coordinates and grid systems used for the network
Simulation – Heat Controls parameters of the simulation process for heat
Simulation – Airflow Controls parameters of the simulation process for airflow
Ventsim Main The program control settings
For further information on settings, go to the settings sections
4.8 Windows Menu
Fits all display data on the screen.
Increase the distance away from the window point of focus. This may be of use
if the mouse used does not have a scroll wheel.
4.8.1 Fit All
4.8.2 Zoom Out

Ventsim Visual User Manual Page | 77
5 Presets
5.1 Preset Values
Figure 5-1 Preset Settings
Preset values provide a quick and convenient way to specify airway characteristics and parameters that may be commonly used in the ventilation
network. Examples are resistances (such as doors or seals), common wall friction factors, shocks losses, heat sources.
The preset table also gives access to network primary and secondary layers, as
well as air types, tunnel profiles and fans.
Any preset value which is changed will be applied to ALL airways using that
preset value. For example if a network has 10 airways using a resistance preset
called ‘Rubber Flaps’ and the resistance for ‘Rubber Flaps’ is changed in the
preset box, then ALL 10 airways using rubber flaps will have the new resistance
applied.
Chapter
5
5.1.1 Preset Values
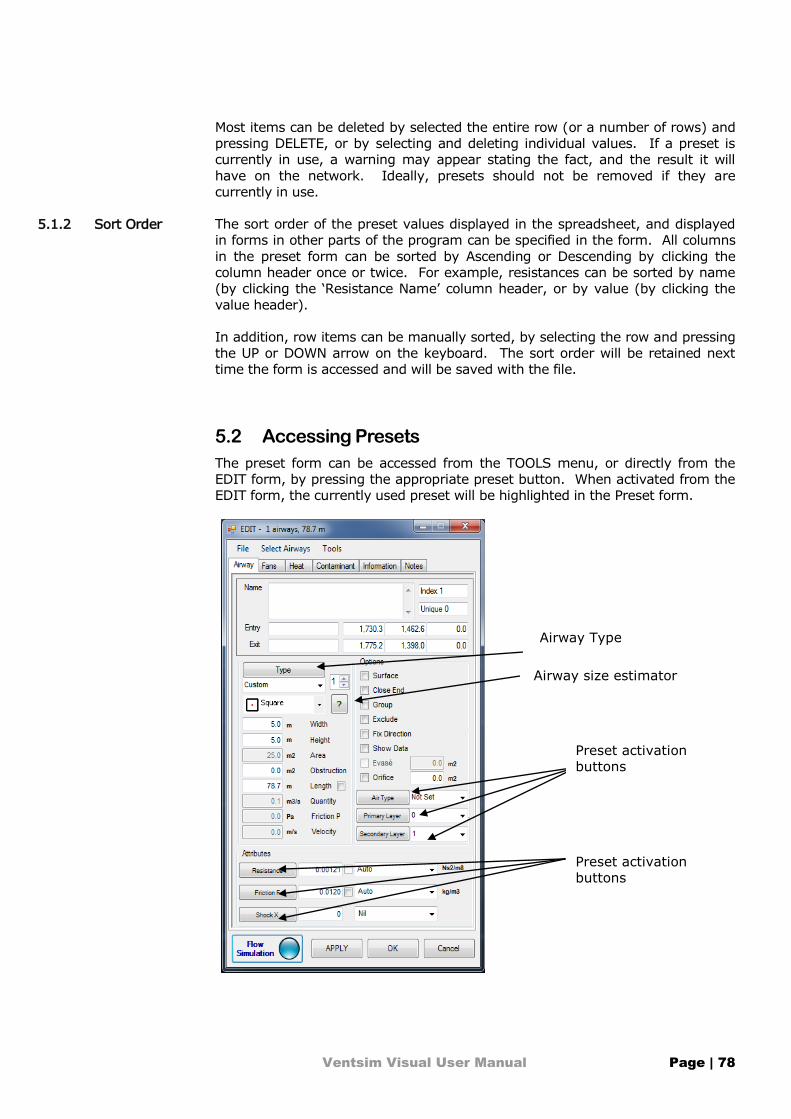
Ventsim Visual User Manual Page | 78
Most items can be deleted by selected the entire row (or a number of rows) and
pressing DELETE, or by selecting and deleting individual values. If a preset is
currently in use, a warning may appear stating the fact, and the result it will
have on the network. Ideally, presets should not be removed if they are
currently in use.
The sort order of the preset values displayed in the spreadsheet, and displayed
in forms in other parts of the program can be specified in the form. All columns
in the preset form can be sorted by Ascending or Descending by clicking the
column header once or twice. For example, resistances can be sorted by name
(by clicking the ‘Resistance Name’ column header, or by value (by clicking the
value header).
In addition, row items can be manually sorted, by selecting the row and pressing
the UP or DOWN arrow on the keyboard. The sort order will be retained next
time the form is accessed and will be saved with the file.
5.2 Accessing Presets
The preset form can be accessed from the TOOLS menu, or directly from the
EDIT form, by pressing the appropriate preset button. When activated from the
EDIT form, the currently used preset will be highlighted in the Preset form.
5.1.2 Sort Order
Preset activation
buttons
Preset activation
buttons
Airway size estimator
Airway Type

Ventsim Visual User Manual Page | 79
Up to 100 different resistance presets can be entered. Resistance presets can be
applied to airways from the EDIT form. Any resistance entered in the preset will
be applied to an airway during simulation.
It is important to note that underlying airway resistances due to wall friction
WILL ALSO be applied in addition to the preset resistance. For example if a
preset resistance of ‘10’ for a ‘DOOR’ is applied, and the airway has an
underlying resistance of 0.015, then a total resistance of 10.015 will be applied
during simulation.
The reversing resistance is an optional field which applies a different resistance
should an airflow be reversed during simulation, and the ‘restrict airflow
direction’ flag is chosen for the airway. Reversing resistances may be useful in
situation where resistance increase (such as automatic doors closing, or flaps
sealing) or where resistances decrease (such as doors swinging open
automatically) when airflow direction changes. Such setups may occasionally be
used to prevent recirculation or assist with emergency response design when fan
direction may be reversed. If the value is left at zero (0), then a default
reversing resistance (specified in the SETTINGS) will be applied if an airway is
reversed AND the ‘restrict airflow direction’ flag is selected.
Up to 100 different frictions factor preset can be entered or used. The friction
values in the EDIT box can be applied as presets (entered in the preset form) or
as individual ‘CUSTOM’ values or as AUTO values which defaults to a value
specified in the SETTINGS.
Shock equivalent lengths or shock factors can be entered in the shock preset
area. The application of these factors will depend on which shock loss method is
specified in the SETTINGS. The values for each shock item during simulation will
be applied according to the method chosen. Only the value of the shock loss
method used, needs to be entered.
Up to 250 different heat, moisture and refrigeration sources can be entered.
Each ‘Heat’ source can be a combination of different heat parameters (such as
moisture and sensible heat combined). Airways with a specified heat source will
have these values applied during simulation. The screen also shows the number
of heat sources currently in use.
The form shows current names for these items, and in the case of layers,
whether they are being used or not. The names can be changed at any time,
and new layer names and air type names can be added. Colour can be changed
by clicking on the colour box. There are currently 250 layers reserved for use,
and 25 airway type reserved for use.
Present a summary of current fans, and the basic characteristics of those fans
(eg diameter, air density for the curve etc). While the fan curve data cannot be
directly edited from this screen (you will need to go to the fan database), the fan
names can be changed as well as the other fan parameters, or fans can also be
fully deleted from the network. A read only column states the number of fans in
use in the network.
Airways presets allow a specific size and type of airway to be set with pre-
defined dimensions, friction factors and profiles. These airway can then be
quickly selected in the EDIT box to set airways to the preselected values.
5.2.1 Resistance
5.2.2 Friction
5.2.3 Shock
5.2.4 Heat
5.2.5 Layer Prim,
Layer Sec, Air
Type
5.2.6 Fans
5.2.7 Airways
5.2.8 Profiles
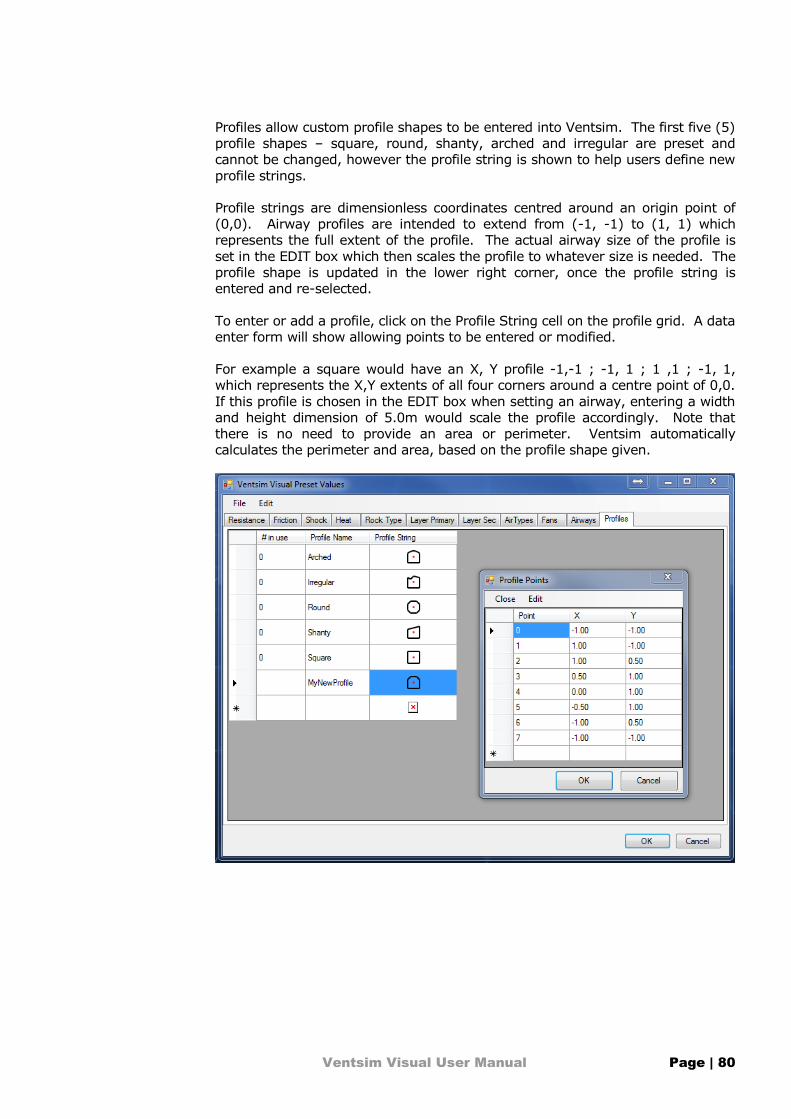
Ventsim Visual User Manual Page | 80
Profiles allow custom profile shapes to be entered into Ventsim. The first five (5)
profile shapes – square, round, shanty, arched and irregular are preset and
cannot be changed, however the profile string is shown to help users define new
profile strings.
Profile strings are dimensionless coordinates centred around an origin point of
(0,0). Airway profiles are intended to extend from (-1, -1) to (1, 1) which
represents the full extent of the profile. The actual airway size of the profile is
set in the EDIT box which then scales the profile to whatever size is needed. The
profile shape is updated in the lower right corner, once the profile string is
entered and re-selected.
To enter or add a profile, click on the Profile String cell on the profile grid. A data
enter form will show allowing points to be entered or modified.
For example a square would have an X, Y profile -1,-1 ; -1, 1 ; 1 ,1 ; -1, 1,
which represents the X,Y extents of all four corners around a centre point of 0,0.
If this profile is chosen in the EDIT box when setting an airway, entering a width
and height dimension of 5.0m would scale the profile accordingly. Note that
there is no need to provide an area or perimeter. Ventsim automatically
calculates the perimeter and area, based on the profile shape given.

Ventsim Visual User Manual Page | 81
6 Settings
6.1 Airway Defaults
Figure 6-1 Airway Default Settings
Default shape of airway.
Default fan motor efficiency to apply to calculated fan shaft power to estimate
the electrical power absorbed by the fan motor. In most cases it will be around
95% for direct drive electrical motors, or as low as 80 – 85% for offset or gear
drive fans.
Default efficiency factor to apply to motor shaft power calculations for fixed
quantities and fans without efficiency curves.
Default friction (K) factor to apply to new airways
The number of the friction factor type to use on a default airway
Default view layers to set to new airways.
Default resistance to apply if resistances are set in airways which have reversed
airflow AND the ‘restrict’ reverse airflow button is pressure. This is only applied
Chapter
6
Airway Shape
Efficiency Fan Motor:
Efficiency Fan Fix:
Friction Factor
Friction Factor Type
Primary Secondary Layer
Reversing Default Resistance

Ventsim Visual User Manual Page | 82
if no reversing resistance already exists for the preset item. For example a
resistance for a door may be 10 during normal flow direction, but may reduce to
0.5 when the airflow is reversed and the door swings open. Once again, this
figure is ONLY applied if the ‘restrict reverse airflow’ option is chosen in the EDIT
box, AND there are no pre-existing reversing resistances set in the resistance
preset spreadsheet.
Default layers to apply for new airways.
Default size of new airways. Imported DXF and text files without specific airway
size will also be set to these values
Hint : Airway defaults are normally only applied if airways are constructed without connection to other airways. Where airways are connected to existing airways, they will INHERIT the settings of the airways the new airways is connected to. This behaviour can be modified from the EDIT > NEW AIRWAYS menu item.
6.2 Colour Settings
Figure 6-2 Colour Setting Options
Control the relative brightness and intensity of the colour displays on screen.
Sets a preset or custom picture to the background of the visual display. This
may provide some visual flair for presentations or may simply suit the users
preferences. An option exists to use a preset background (current CLOUDS
or GROUND), or a custom background picture can be displayed by simply
dragging a picture file from windows on to the screen.
Tints the background picture using the Screen Colour Top and Bottom
settings. Note that a black screen colour will totally hide the pictures, while
a white screen colour will fully show the picture in natural colours.
Layers – Primary and Secondary
Size Width, Size Height, Size Area
Brightness
Background Picture
Background Picture Tinting

Ventsim Visual User Manual Page | 83
Dark and stormy background image
Colour of grid lines.
Colour of semi-transparent edit plane sheet shown during vertical drawing
operations.
Colour of upper and lower halves of background. The colours are smoothly
blended to provide a gradient effect. Lighter colours may be more appropriate for
presentations and report.
Colour of the airway data. Text colours may need to be adjusted to provide
contrast if the background colours are adjusted.
Colour of the airway text names and error messages. Text colours may need to
be adjusted to provide contrast if the background colours are adjusted.
Colour of the airway node names. Text colours may need to be adjusted to
provide contrast if the background colours are adjusted.
Instructs the program to make the background white when printing a graphics
network to a printer or saving the image to a file.
Grid Colour
Grid Sheet
Background Colour
Colour Text Data
Colour Text Airway
Colour Text Node
Print to White Background

Ventsim Visual User Manual Page | 84
6.3 Graphics
Figure 6-3 Graphics Setting Options
An advanced graphics option (not supported by all graphics card) which smooths
the appearance of the edges of solids to give a visually more appealing look.
The option may significantly slow some graphics cards or cause graphics
irregularities. By default, it is set to FALSE.
Figure 6-4 Graphics Setting Options
Hides text while model is rotated or zoomed. Very large models with lots of text
can slow or make smooth rotation movements unresponsive. Use this option to
hide text and make rotation movement much smoother.
The range of elevation to show around a single selected level. Selected levels
may be chosen from the RIGHT CLICK mouse popup menu, and limit the range
of airways data shown on screen.
Anti-aliasing
Hide Text While Rotating
Level Range

Ventsim Visual User Manual Page | 85
Ventsim model rotation results in a short period of continued rotation after the
mouse is released. This is purely for visual appeal and is provided to give
models the illusion of ‘weight’ and solidity. The speed at which rotation is
damped can be adjusted or turned off using these settings.
HINT To allow the model to rotate freely without stopping, choose a damping level of zero (0).
Hide or shows arrow, node and text data by default. This can be used to
improve display clarity by removing unnecessary graphical details. Note that
this function can be overridden from the View menu options or the RIGHT click
context menu options for text and other graphical items.
Shows the thermodynamic setting names on the airways they are attached to.
Size of airway text displayed on model. Larger text sizes are generally clearer to
read, however excessive data may clutter display.
The size of the nodes, icons and arrows. Note that the size reduces in wireframe
mode to improve display legibility. In Solid mode, Icons and Nodes will not be
reduced smaller than the airway size.
Text display defaults to a pseudo 3D mode which show text as horizontal labels
which move dynamically with airway positions. Setting to False presents a
different method of displaying airway data on branches. Data is imprinted into
the airway sidewall and rotated and scaled with the airway model. In some
circumstances it may or may not improve legibility.
The background for text characters is shown as a solid colour, or transparent.
Turning off text transparency can improve clarity of text graphics, but will
obscure the airway graphics behind the text.
[TRUE] Completely hides airways outside the display range.
[FALSE] Airways outside the display range are shown as semi-transparent. The
level of transparency can be adjusted from the Colour Manager.
Note that this function setting has largely been made obsolete by the VIEW >
TRANSPARENCY menu function which can define a number of different
transparency options for different types of data.
The default level of transparency for transparent airways. This can be adjusted
in the Colour Manager
The relative colour of transparent airways. Lower value will make transparent
airways darker.
The size of the nodes, icons and arrows. Note that the size reduces in wireframe
mode to improve display legibility.
[TRUE] Text labels backgrounds are transparent and show graphics under the
label.
Rotation Inertia / Damping
Show All Arrow/ Node/ Text data.
Show Heat Text with Airway Text
Size Data Node Airway Text
Size Node Icons/Arrows
Text2DSolidMode
Text Transparent
Transparency Flag
Transparency Opaque
Transparency Dimming
Size Node Icons Arrows
Text Transparent

Ventsim Visual User Manual Page | 86
[FALSE] Text label backgrounds are solid and do not show graphics underneath.
In some cases, this may improve the legibility of text.
[TRUE] Reduces the size of text labels relative to distance away from view
camera. This make close airways larger and more legible and distant airway
text smaller.
Sets the viewing system to orthogonal or perspective. Orthogonal removes
the effect of perspective, making objects in the distance appear the same
size as close objects. This mode may be of assistance when viewing sections
or plan views, where the perspective appearance would otherwise distorted
the true scale of objects at different distances. The mode has the
disadvantage of a more cluttered and complex display.
Perspective view is more suited to general editing and viewing, where
objects in the distance are obscured by perspective scale, creating a less
cluttered display.
Figure 6-5 Orthogonal Display
Figure 6-6 Perspective Display
Text Scale Relative
Perspective View
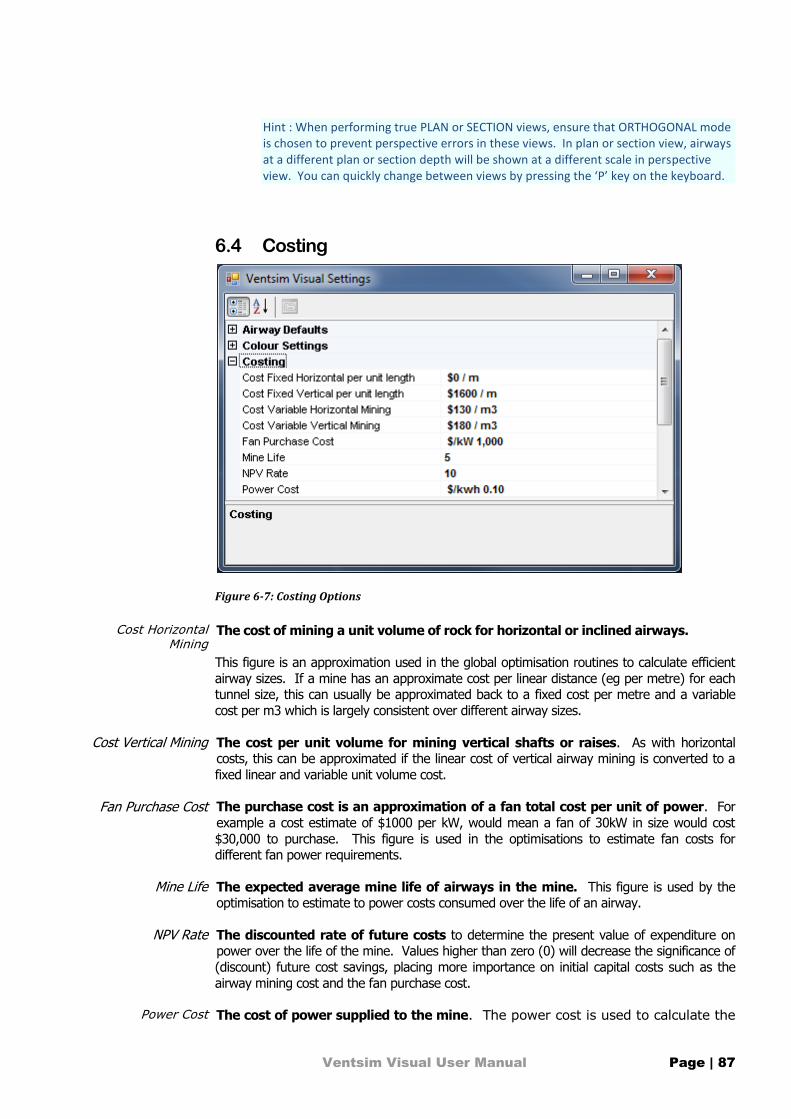
Ventsim Visual User Manual Page | 87
Hint : When performing true PLAN or SECTION views, ensure that ORTHOGONAL mode is chosen to prevent perspective errors in these views. In plan or section view, airways at a different plan or section depth will be shown at a different scale in perspective view. You can quickly change between views by pressing the ‘P’ key on the keyboard.
6.4 Costing
Figure 6-7: Costing Options
The cost of mining a unit volume of rock for horizontal or inclined airways.
This figure is an approximation used in the global optimisation routines to calculate efficient
airway sizes. If a mine has an approximate cost per linear distance (eg per metre) for each tunnel size, this can usually be approximated back to a fixed cost per metre and a variable
cost per m3 which is largely consistent over different airway sizes.
The cost per unit volume for mining vertical shafts or raises. As with horizontal costs, this can be approximated if the linear cost of vertical airway mining is converted to a
fixed linear and variable unit volume cost.
The purchase cost is an approximation of a fan total cost per unit of power. For
example a cost estimate of $1000 per kW, would mean a fan of 30kW in size would cost
$30,000 to purchase. This figure is used in the optimisations to estimate fan costs for different fan power requirements.
The expected average mine life of airways in the mine. This figure is used by the optimisation to estimate to power costs consumed over the life of an airway.
The discounted rate of future costs to determine the present value of expenditure on power over the life of the mine. Values higher than zero (0) will decrease the significance of
(discount) future cost savings, placing more importance on initial capital costs such as the
airway mining cost and the fan purchase cost.
The cost of power supplied to the mine. The power cost is used to calculate the
Cost Horizontal Mining
Cost Vertical Mining
Fan Purchase Cost
Mine Life
NPV Rate
Power Cost

Ventsim Visual User Manual Page | 88
ventilation cost of running a mine network, and applied to all fans, fixed
quantities and fixed pressures. The power cost is local currency unit dependent.
Total power costs for mine network will be displayed as a factor of this value.
HINT : To gain the true operating cost of a ventilation network, it is an option to include a maintenance and depreciation component in the power cost to cover the future cost impact of maintenance, repair and replacement of ventilation infrastructure.

Ventsim Visual User Manual Page | 89
6.5 Simulation – Airflow
Simulation airflow settings directly influence how the airflow simulation operates.
Figure 6-8 Ventsim Visual™ Settings
Defines the default air density to use in the network if incompressible flows
are used (this is standard behaviour with Ventsim Visual Standard and
optional with Ventsim Visual Advanced). All airways, resistance, friction
factors and fan curves will be automatically adjusted to this air density.
There is no requirement to individually adjust fan curves manually – any fan
curves simulated will be adjusted from the fan database defined curve
density, and will show the adjusted curve in the Edit > Fan form. Note that
is Compressible Flows are used, this value is ignored. The program will
instead use the Simulation Environment Temperatures and Barometric
Pressures to calculate true density at every position in the mine network.
Ventsim uses a standard density of 1.2 kg/m3 for predefined friction factors
and resistances. These factors are adjusted to the density specified in this
option.
Defines the level of accuracy Ventsim must resolve down to before an acceptable
solution is displayed. This should normally be set to less than 0.1 m3/s error. If
a final analysis is required it may be advisable to set this to 0.01 m3/s or lower.
The smaller the value, the more accurate the simulation process, but the longer
it may take.
Automatically performs an airflow simulation after every modification to a
Air Density Network Environment
Allowable error
Auto simulation
Ventsim Visual User Manual Page | 90
network. This will conveniently display airflow amounts and directions without
having to simulate the network. For large networks, or networks undergoing
extensive modifications, it may be preferable to turn this function off, as it will
slow down editing and view functions.
Use compressible airflow simulation techniques.
Compressible airflow has a significant influence when simulating deeper mines.
In deeper mines (greater than 500m) or when heat simulation is used, it is
recommended that compressible airflow be set to True.
When set to True, Ventsim Visual™ will assume compressible air, and adjust air
densities, volumes and fan curves according to airway depth and corresponding
density. In the Advanced version, temperature effects on density are also taken
into account when Heat simulation is run in conjunction with air simulation.
Airflows and fan curve performance after simulation is shown according to the
density of air at the location of the airway.
Enables the simulation to adjust the friction factors to the local airway density.
As resistance is a factor of friction, this will in turn adjust the airway resistance
value. This setting is set to YES by default.
When set to YES, all preset friction factors are assumed to be specified at a
standard density of 1.2kg/m3. If compressible airflows are enabled, the factor
will be adjusted to the simulated local air density, otherwise the factor is
adjusted to the standard environment density setting.
If this setting is not enabled or the airway EDIT form has set the value to
‘Already Adjusted’, then the actual value entered in the preset will not be
adjusted.
Enables the simulation to adjust the preset resistance values to the local airway density. Preset resistance values do not use friction factors, therefore any
friction factor setting is ignored.
When set to YES, all preset resistances are assumed to be specified at a
standard sea level density (set usually to 1.2kg/m3) and will be adjusted to suit
the local airway conditions. If compressible airflows are enabled, the preset
value will be adjusted to the simulated local air density, otherwise the value is
adjusted to the standard environment density setting.
If this setting is not enabled or the airway EDIT form has set the value to
‘Already Adjusted’, then the actual value entered in the preset will be used.
HINT : Density adjusted friction and resistance values are a potential source of confusion. Most text books will quote friction and resistance values standardized to a 1.2kg/m3 air density. If standard values are used, ENSURE that both of the Density Adjust options are set to YES
If resistance or friction values are measured locally however, then the values obtained are only valid for the density at which they are measured. To use measured values in Ventsim, you will need to consider one of the following options.
Compressible Airflows [Advanced]
Density Adjust Friction Factors
Density Adjust Resistance Factors

Ventsim Visual User Manual Page | 91
OPTION 1 : If all preset values are measure at the true mine density and will not be used or duplicated elsewhere in the mine, then simply turn off the density adjust setting for resistance and/or friction values.
OPTION 2 : If only some values are measured and other values are standardized to 1.2kg/m3, then you will need to use the EDIT form setting to set individual airways to ‘Already Adjusted” (the check box next to the resistance or friction value)
OPTION 3 : To avoid the potential confusion of Option 2, you may want to simply convert all of your measured values (at the local mine density) to a 1.2kg/m3 standard and set both settings to YES. This also has the benefit of allowing the setting to be used elsewhere in the mine at different densities.
Specifies the fan pressure simulation method to use. Ventsim has historically
allowed use of a combination of static and total pressures to simulate air flow
through underground and surface fans. To maintain compatibility, this option
has been kept, however two alternative methods are presented.
Total Pressure Method
The use of fan total pressures is considered the technically correct method for
simulating airflows. All fan curves in the fan database must at least have a total
pressure component. If only a fan static pressure curve is available an error will
be raised during simulation. Ventsim Visual™ can help predict a fan total
pressure curve from an existing static pressure curve using tools in the Fan
Database Editor.
The total pressure method assumes the full fan total pressure is available to
‘push or pull’ air through a mine. The method also considers system velocity
pressure losses to the atmosphere (for example from exhaust shafts) and
incorporates these into the simulation. The fan total pressure method relies on
the user accurately considering fan exit losses with appropriate shock loss factors
and resistances, as total fan pressure is rarely fully available to deliver pressure
to network air flow. Fan outlet configuration, outlet flow direction changes and
the inclusion of evasé s (which boost static performance and reduce exit shock
losses) or other exit devices such as fan shutters need to be fully considered if
they have not been incorporated into the fan curve, otherwise the network may
over predict the available pressure and flow.
Static Pressure Method
A more traditional approach is to use fan static pressure, which assumes that fan
velocity pressure is wasted and does not contribute to the system ventilation
pressure and flow. While this is not technically correct, this assumption removes
some of the criticality of defining accurate exit losses, and while exit losses
should still not be ignored, the resulting simulation will provide a more
conservative result to simulation estimates of pressure and flow. The Fan Static
Pressure (FSP) method also ignores system exit velocity pressure losses. For a
primary (surface) fan driven network systems, there is negligible difference
between the FSP and FTP methods (as the FTP methods considers velocity
pressure losses as part of the system pressure), however where underground
booster fans contribute to a significant portion of ventilation flow, the difference
between the two methods will increase.
To use this method, all fan curves used from the database must have a static
pressure component. If only a total curve is available an error will be raised
Fan Pressure Simulation Type

Ventsim Visual User Manual Page | 92
during simulation. As with the FTP method, the fan database form has tools to
assist the user in estimating FSP curves if not available.
Mixed Pressure Method
The mixed pressure method maintains compatibility with Ventsim Classic 3.9,
which allows both pressure types (static and total) to be used for fans in
networks. The mixed pressure method is similar to the static method, in that it
does not considerer system velocity pressure exit losses. Fan pressure curve
types can be specified for each fan location in the network. This may be of
assistance if some static or total pressure curves are not available for the fan,
and the user does not wish to estimate a curve. The mixed pressure method is
considered to be the least consistent method to use, and should be avoided if
possible. In particular, the use of fan total pressures for surface exhaust fans
will overestimate the performance in a network as the system velocity pressure
losses will not be considered
Ventsim Classic 3.9 networks will be automatically imported into Ventsim Visual™ as a ‘mixed pressure network’. It is recommended for consistency, the network be either set to a StaticMethod network or a TotalMethod network. Some fan curves may need to be modified to allow this to be done.
Defines the default reverse fan performance relative to the original fan curve for
the pressure and quantity of a fan running in reverse. These factors decrease
the performance of fans set to run in reverse (for emergencies for example) in
the EDIT box. Note that the default values may be overridden by values directly
placed in the Fan Database for individual fans.
[TRUE] Ventsim Visual™ will ignore all warnings related to No Entry or No Exit errors found during simulation (airways with no other airways joining)
[FALSE] Ventsim Visual™ will only ignore airways which have been set to Allow Closed End in the Edit box. Any other ‘orphaned’ airways will cause the
simulation to halt.
Sets the number of attempts Ventsim Visual™ can take to achieve an acceptable
error, before the program abandons the simulation process.
The maximum pressure the simulation will allow between airway before a
simulation error is reported. This error may indicate unreasonable fixed flows or
resistances which interact and causes large pressure build ups or drop.
The number of recirculated airways beyond which Ventsim will first ask
permission to simulate recirculation. The simulation routine to calculate
individual airway recirculation is complex and time consuming. If there are more
than (say) 500 airways, this may take a minute or two to simulate. Therefore
the option will be given to abandon the simulation, or simply show the airway
which recirculate without actual % amounts. On faster computers, it may be
desirable to life this limit, to prevent Ventsim pausing and asking permission.
The volume of air that is allowed to recirculate before the Check Recirculation
routine flags a warning and initiates a full recirculation check.
Defines the shock loss method to use. Ventsim Visual™ can be set to calculate
shock losses using the equivalent length method, or the shock factor (X)
method. Shock loss calculations are necessary to estimate pressure loss due to
air turbulence cause by a change in airway direction, a junction or a change in
Fan Reverse PFactor, Fan Reverse QFactor
Ignore Warnings
Iterations
Maximum Simulation Pressure
Recirculated Airway Limit [Advanced]
Recirculation Limit Volume [Advanced]
Shock Loss Type

Ventsim Visual User Manual Page | 93
airway size. Note that changing this value in an existing network will result in
Ventsim Visual™ requesting to recalculate the shock losses using the alternative
system.
The equivalent length method requires the user to estimate an equivalent extra
airway length required to approximate pressure loss due to shock. The shock
factor (X) method uses a calculated factor derived from both empirical and
calculated changes in airway areas and velocities. Both methods are described
in any number of ventilation texts.
Once the method is set, the Edit Box will require an appropriate shock loss value
for each airway. The Edit Box can accept a manually entered number, but also
has a number of preset values, as well as an AUTO function which will force
Ventsim Visual™ to attempt to calculate a shock loss factor or an equivalent.
length.
The standard air density used for simulation of airflow, where compressible
airflows are not set, or Ventsim Visual Standard is used. The air density is
uniformly applied throughout the mine, and all pressure and heat calculations
are referenced back to this standard value. Note that this value is ignored when
compressible airflows have been selected.
Defines the minimum resistance at which Ventsim Visual will completely stop all
airflow in an airway. All preset resistances above this value will cause airflow in
the set airway to completely stop. No more than one Preset Resistance value
should be greater than the Stop Resistance value. This function artificially
restricts airflow and has the potential to cause simulation problems if used on too
many airways. The simulation will check and ensure that only one (or nil)
preset resistances are greater than this value.
If set to TRUE, Ventsim Visual™ compares airway directions before and after a
simulation and alerts the user which airways have airflow that have changed
direction during simulation.
If set to TRUE, Ventsim Visual™ will perform a check on all up casting vertical or
semi vertical (>45 degrees) airways. The water suspension phenomena occurs
on water droplets where the up casting air velocity friction is counteracted by
gravitational forces, forming a suspended column of water droplets which can
greatly increase shaft resistance and pressure. This can only be overcome by
reducing airflow velocity allowing water to fall to the shaft bottom, or increasing
velocity to carry the water out of the top of the shaft. The exact critical velocity
depends on shaft size and geometry, as well as water droplet size and geometry
of entry into the shaft.
The upper and lower limits at which Ventsim Visual will flag a warning if water
suspension checking is optioned. Warnings do not affect simulation, but simply
alert users to potential problem areas.
The flow at which Ventsim Visual assumes ‘zero’ flow. This function does not
directly affect simulation, and is simply used to determine whether airways are
displayed when the ‘zero flow’ graphical option is used to hide airways with no
flow.
Standard Air Density
Stop Resistance
Warn On Change Direction
Water Suspension Checking
Water Suspension Upper and Lower
Velocity
Zero Flow Limit

Ventsim Visual User Manual Page | 94
6.6 Simulation – Heat [ADVANCED]
Adjusts settings which directly influence how the heat simulation operates.
Figure 6-9 Simulation Heat Settings
The default desel emission factor to use, if the preset heat sources do not have a
factor specified. It is normally recommended that preset heat source each have
their own defined diesel particulate emission value. See DPM Simulation for
further information.
Airway segment divisions for heat calculations.
The heat simulation process in Ventsim Visual™ progressively calculates heat
affects along each airway by dividing it into sections. When a rapid change takes
place or where the airway is very long, this allows the psychrometric process to
continually adjust pressures, temperatures and moisture content, resulting in a
more accurate estimate. Ventsim Visual™ automatically adjusts the number of
divisions according to airway length and heat inputs. The number of divisions
used is restricted by the min and max values in the settings. Higher division
values will theoretically give more accurate heat estimates but will increase the
time required for simulation.
Performs multiple airflow and heat simulations.
When set to more than one (1) performs multiple heat and airflow simulations,
adjusting densities and airflows between each simulation. Manually pressing the
HEAT simulation button has the same effect.
Heat simulation in Ventsim Visual™ Advanced is performed as two discrete
simulations, first as an airflow balance, followed by a heat balance simulation.
While the mass flow balance from the airflow simulation is kept constant during
heat simulation, the new temperatures and air densities calculated after heat
Diesel Particulate Emissions
Heat Divisions Min/Max
Multi Heat Iterations

Ventsim Visual User Manual Page | 95
simulation, result in a theoretical mass imbalance of airflows. This can be
corrected by a subsequent airflow simulation; however subsequent heat
simulations will again affect the balance. This imbalance normally reduces with
subsequent simulations, as temperatures and airflow changes reach equilibrium.
Multiple pass iterations can be set which will automatically force Ventsim Visual™
to simulate the network a number of times, to account for some of the potential
imbalance. This will significantly slow down simulation time. Iteration values
larger than one are usually unnecessary if a network has already been heat
balanced, or if the HEAT simulation button has already been pressed a number
of times.
HINT Performing a multiple pass heat simulation may have value if the network shows some heat instability (changes in temperatures between simulations). Heat instability is often caused by unstable natural ventilation changes driven by conflicting changes in airflow, strata heat and evaporation.
For example a heat source which causes an increase in temperature may cause an increase in airflow due to natural ventilation – in subsequent simulations, the higher airflow causes lesser temperature increase from the heat source, which in turn reduces the airflow due to natural ventilation. Evaporation from strata moisture may also causing conflicting density changes, with strata heat density changes offset by cooling evaporation. The process may then oscillate between solutions for each heat simulation. As a final pass performing a multiple pass simulation of 10 or 20 (which may take a long time) may help resolve this instability.
Extreme changes in airflow temperatures along airways or at junctions may
create difficulties for Ventsim Visual™ to calculate the new psychrometric
properties in an acceptable number of iterations. Normally the error is small and
may be resolved during the simulation process as surrounding airways are
adjusted, and the degree of change is reduced in subsequent iterations.
Setting this value to TRUE allows the simulation process to ignore imbalances
and continue towards an acceptable solution.
CAUTION: Allowing heat balance errors to be ignored may propagate an extreme heat balance error along other airways. This will normally result in the simulation process halting due to other heat related errors (such as over-temperature). For this reason, unless there are continued heat balance issues, it is recommended this normally be left as FALSE unless all other options to resolve a poorly simulating network are explored first.
For diesel heat sources, this value defines the amount of water emitted to the air
as latent heat is per unit weight of diesel fuel consumed. Although the
theoretical combustion reaction portion of water produced to fuel consumed is
only around 1.1, the operation of a diesel machine in a mine environment results
in a greater release of water into the air due to accelerated evaporation of water
around the machine (from a wet roadway or walls for example), compounded by
other sources such as handling of moist or wet material, wet exhaust scrubbers
and cooling systems used by the machine, result in a much higher value. A
value of five (5) or more is generally recognised as giving a more realistic result
for water introduced to the air by mobile machines. Stationary machines may be
closer to the theoretical value.
Ignore Heat Balance Errors
Water to Diesel Ratio

Ventsim Visual User Manual Page | 96
The default water to diesel ratio is used on all diesel sources in the network. To
use values other than default, the sensible and latent heat will need to be
entered separately instead of a single diesel heat source.
Describes the default amount of diesel particles emitted from a diesel engine, per unit of diesel engine power. This value is applied to diesel heat sources placed
in a network, to assist in diesel particulate matter (DPM) simulation for the
model. The value is highly dependent on the type of diesel engines, catalytic
converters and scrubbers being used on the exhaust, as well as the type of
diesel fuel used. In most cases, tests will need to be done on engine exhausts,
or information gained from diesel engine manufacturers to find the correct value
to use. Ventsim Visual™ will apply this default value to diesel sources which
have not been assigned a specific emission rate. Specific rates for diesel
equipment and airways that will override this default value can be assigned in
the Presets or in the Edit box.
The temperature limit above which Ventsim Visual™ will halt simulation and
display an error if it occurs. Temperature limits can be exceeded when too
higher heat input is placed in an airway with not enough airflow.
Heat simulation uses a number of empirical formulas which are designed to work
within a specific temperature range. In general, temperatures above 70 degrees
centigrade will start to result in a reduction of accuracy of heat estimation.
The minimum mass flow that Ventsim Visual™ will perform a heat simulation on.
Below this limit, Ventsim will assume the air is stationary, and adopt the local
virgin rock temperatures as the air temperature. This value must be set above
zero, as portions of the program which calculate heat and moisture derived from
rock surfaces must have some airflow velocity to work. While there is some
potential for heat imbalance errors by not taking into account low flow airways, it
is generally small due to the limited heat energy flow able to be carried by these
low flow airways.
The ratio of output refrigeration power (kWR) generated by the refrigeration
heat exchange process, versus the input electrical power (kW) required to
produce this heat exchange. This factor is not used by the simulation, by rather
by the power and cost calculation of a network in the Summary section.
[TRUE] Forces Ventsim to calculate natural ventilation pressures derived from air
heat and density in the underground network. Natural ventilation pressures can
sometimes produce unstable simulation air flows due to dynamic changes in
airflow affecting subsequent heat balance simulations. This is discussed further in
the Heat Simulation section. If this problem impacts heat simulation, providing
natural ventilation pressures are not critical, it is suggested to set to it to False to
produce a stable simulation.
[FALSE] Ignore natural ventilation pressures. Where heat simulation is not
required, or natural ventilation pressures are not likely to be significant in a
mine, it is suggested that this setting be set to FALSE.
Limits the number of internal iterations permitted by Ventsim Visual™ to
converge and find an acceptably balanced heat solution. Where recirculation
occurs or large numbers of very low airflows are present, a simulation may take
a large number of iterations to fully balance. In most cases, the main airflows
will quickly balance, and even if the simulation fails to complete within the set
number of iterations, this will usually be in the low flow airways which have little
Diesel Particle Emissions
Temperature Limit
Mass Flow Limit
Refrigeration COP
Use NV Pressures
Heat Iterations

Ventsim Visual User Manual Page | 97
effect on the main flow airways. The status bar at the base of the Ventsim
Visual™ window will show the progress of a heat simulation, including the
number of iterations and the heat balance errors. Increasing the number of
iterations may help resolved unbalanced networks, but will take longer to
simulate.
HINT A leading cause of heat flow convergence issues is recirculating airways in low flow airways due to natural ventilation pressures. Natural ventilation pressures can create internal ‘eddies’ of air in disused or low flow airways which can affect heat simulation convergence. To prevent this, and speed up heat simulation, either turn off natural ventilation simulation (if natural vent pressures are not significant) or block disused airways so they simulate as no flow.
Sets the temperature balance limit Ventsim Visual™ must achieve for all airway
mixing at junctions in a network, to consider a simulation as balanced. If the
balance is not achieved for EVERY airway and junction, iteration is performed
until the iteration limit is reached or temperatures are resolved.
HINT The smaller the temperature accuracy set, the longer a simulation may take to complete. In most cases, the vast majority of airways will fall well under this limit, and any temperature accuracy issues will be limited by very low flowing airways which have little impact on the main network.
Limits the amount of heat that can be put into a single airway. This is mainly
included as a check to ensure excessive heat is not placed in an airway (such as
a point heat source value accidently being entered as a linear heat value).
The environment factors describe values used by physical items within the
network. They are critical to identify the base starting points of a ventilation
simulation, or providing default air or heat simulation parameters to airways that
do not have specific values set.
Temperature Accuracy
Maximum Heat Input
6.6.1 Simulation
Environments
[ADVANCED]

Ventsim Visual User Manual Page | 98
Figure 6-10 Simulation Environment Settings
The calendar year at which the simulation is taking place.
Ventsim Visual™ uses this value to calculate the age of an airway underground,
if the individual airway age is entered as a calendar year (such as ‘2005’ in the
EDIT box). Where an airway age is entered as a time value (such as ‘3.5’
years), the CurrentYear value is ignored.
HINT Where true airway ages have been entered as calendar years within a network, the CurrentYear setting is useful for ‘ageing’ a mine and determining future cooling requirements. Heat input or ‘flux’ from virgin rock strata decreases exponentially over time as the rock is cooled, and future cooling requirements can potentially be lower than current cooling requirements as a result.
The rate at which rock increases in temperature at depth. This is assumed to be
a linear value. Geothermal gradients show significant differences at different
points around the earth, and can be as low as 1 degree Celsius per 100m to
more than 10 degrees Celsius per 100m. This value should always be adjusted
to suit the conditions at or near your mine.
HINT In rare cases, the temperature gradient may not be close to linear, particularly in near surface portions of the mine. The best approach is to calculate to gradient over the main underground portion of the underground mine (which a subject to the majority of heat influence), and project this temperature gradient to the surface. Enter the ‘SurfaceRockTemp’ settings as this calculated value, not the true surface rock temperature.
Current Year
Geothermal Gradient
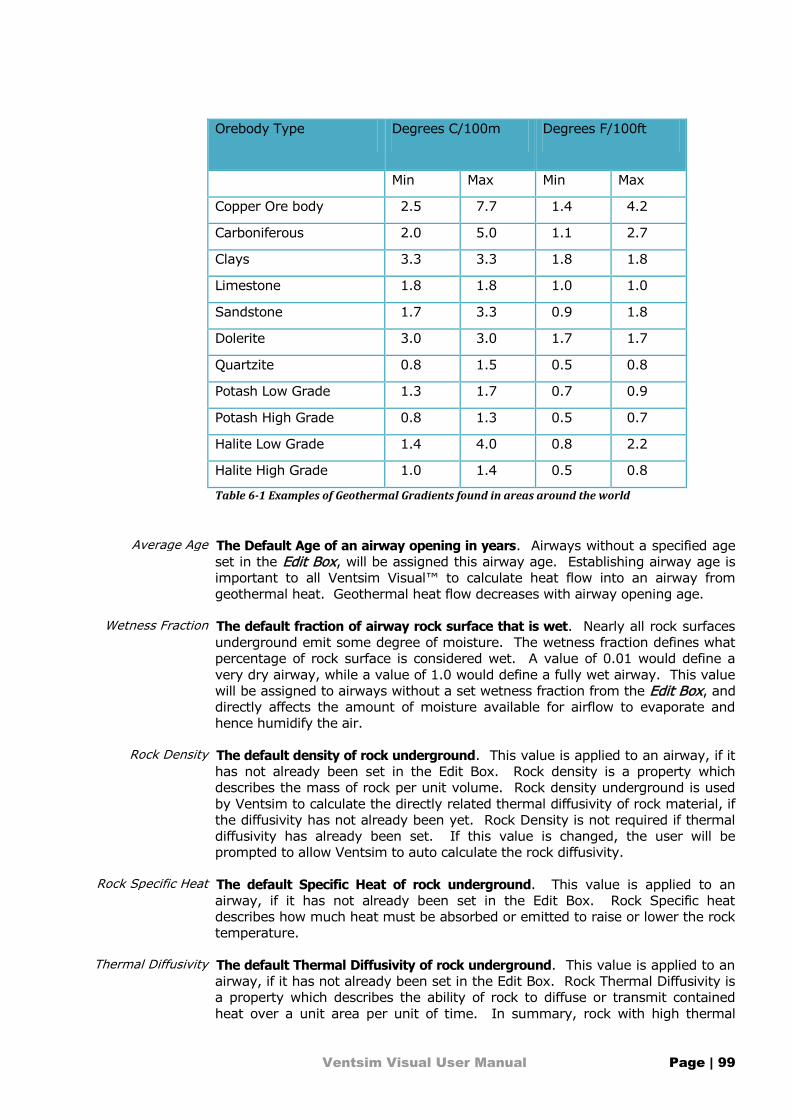
Ventsim Visual User Manual Page | 99
Orebody Type Degrees C/100m Degrees F/100ft
Min Max Min Max
Copper Ore body 2.5 7.7 1.4 4.2
Carboniferous 2.0 5.0 1.1 2.7
Clays 3.3 3.3 1.8 1.8
Limestone 1.8 1.8 1.0 1.0
Sandstone 1.7 3.3 0.9 1.8
Dolerite 3.0 3.0 1.7 1.7
Quartzite 0.8 1.5 0.5 0.8
Potash Low Grade 1.3 1.7 0.7 0.9
Potash High Grade 0.8 1.3 0.5 0.7
Halite Low Grade 1.4 4.0 0.8 2.2
Halite High Grade 1.0 1.4 0.5 0.8
Table 6-1 Examples of Geothermal Gradients found in areas around the world
The Default Age of an airway opening in years. Airways without a specified age
set in the Edit Box, will be assigned this airway age. Establishing airway age is
important to all Ventsim Visual™ to calculate heat flow into an airway from
geothermal heat. Geothermal heat flow decreases with airway opening age.
The default fraction of airway rock surface that is wet. Nearly all rock surfaces
underground emit some degree of moisture. The wetness fraction defines what
percentage of rock surface is considered wet. A value of 0.01 would define a
very dry airway, while a value of 1.0 would define a fully wet airway. This value
will be assigned to airways without a set wetness fraction from the Edit Box, and
directly affects the amount of moisture available for airflow to evaporate and
hence humidify the air.
The default density of rock underground. This value is applied to an airway, if it
has not already been set in the Edit Box. Rock density is a property which
describes the mass of rock per unit volume. Rock density underground is used
by Ventsim to calculate the directly related thermal diffusivity of rock material, if
the diffusivity has not already been yet. Rock Density is not required if thermal
diffusivity has already been set. If this value is changed, the user will be
prompted to allow Ventsim to auto calculate the rock diffusivity.
The default Specific Heat of rock underground. This value is applied to an
airway, if it has not already been set in the Edit Box. Rock Specific heat
describes how much heat must be absorbed or emitted to raise or lower the rock
temperature.
The default Thermal Diffusivity of rock underground. This value is applied to an
airway, if it has not already been set in the Edit Box. Rock Thermal Diffusivity is
a property which describes the ability of rock to diffuse or transmit contained
heat over a unit area per unit of time. In summary, rock with high thermal
Average Age
Wetness Fraction
Rock Density
Rock Specific Heat
Thermal Diffusivity
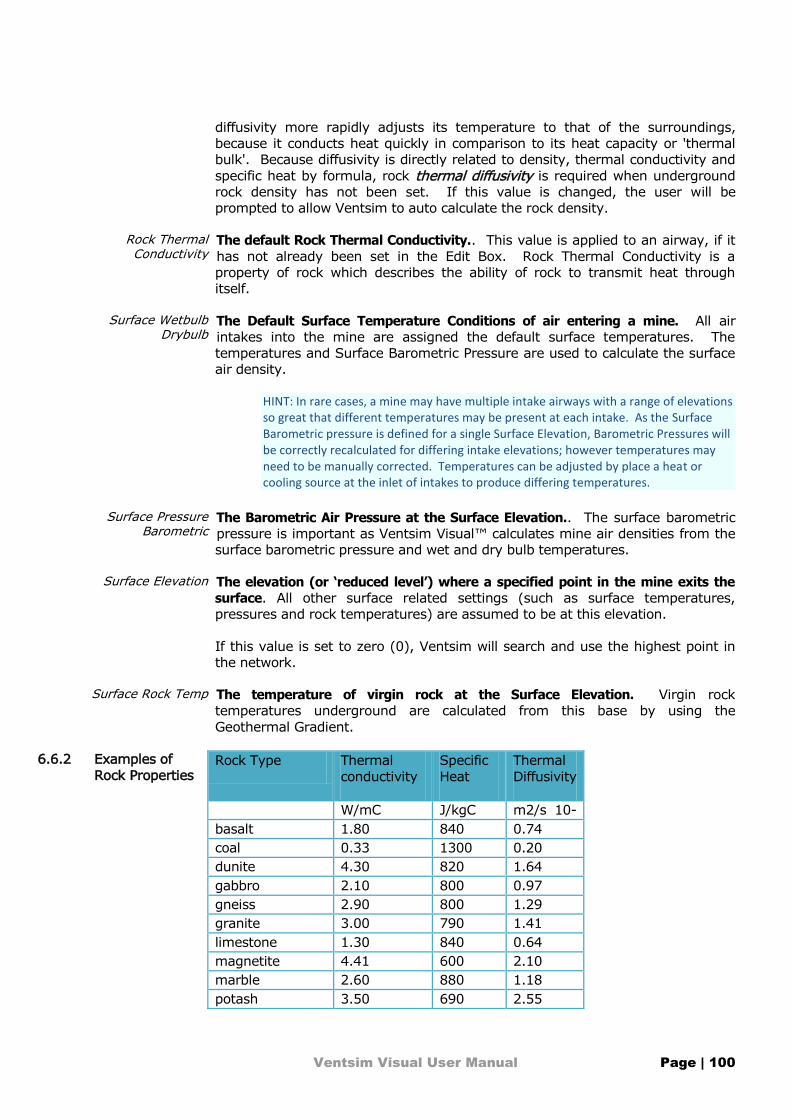
Ventsim Visual User Manual Page | 100
diffusivity more rapidly adjusts its temperature to that of the surroundings,
because it conducts heat quickly in comparison to its heat capacity or 'thermal
bulk'. Because diffusivity is directly related to density, thermal conductivity and
specific heat by formula, rock thermal diffusivity is required when underground
rock density has not been set. If this value is changed, the user will be
prompted to allow Ventsim to auto calculate the rock density.
The default Rock Thermal Conductivity.. This value is applied to an airway, if it
has not already been set in the Edit Box. Rock Thermal Conductivity is a
property of rock which describes the ability of rock to transmit heat through
itself.
The Default Surface Temperature Conditions of air entering a mine. All air
intakes into the mine are assigned the default surface temperatures. The
temperatures and Surface Barometric Pressure are used to calculate the surface
air density.
HINT: In rare cases, a mine may have multiple intake airways with a range of elevations so great that different temperatures may be present at each intake. As the Surface Barometric pressure is defined for a single Surface Elevation, Barometric Pressures will be correctly recalculated for differing intake elevations; however temperatures may need to be manually corrected. Temperatures can be adjusted by place a heat or cooling source at the inlet of intakes to produce differing temperatures.
The Barometric Air Pressure at the Surface Elevation.. The surface barometric
pressure is important as Ventsim Visual™ calculates mine air densities from the
surface barometric pressure and wet and dry bulb temperatures.
The elevation (or ‘reduced level’) where a specified point in the mine exits the
surface. All other surface related settings (such as surface temperatures,
pressures and rock temperatures) are assumed to be at this elevation.
If this value is set to zero (0), Ventsim will search and use the highest point in
the network.
The temperature of virgin rock at the Surface Elevation. Virgin rock
temperatures underground are calculated from this base by using the
Geothermal Gradient.
Rock Type Thermal
conductivity
Specific
Heat
Thermal
Diffusivity
W/mC J/kgC m2/s 10-
6 basalt 1.80 840 0.74
coal 0.33 1300 0.20
dunite 4.30 820 1.64
gabbro 2.10 800 0.97
gneiss 2.90 800 1.29
granite 3.00 790 1.41
limestone 1.30 840 0.64
magnetite 4.41 600 2.10
marble 2.60 880 1.18
potash 3.50 690 2.55
Rock Thermal Conductivity
Surface Wetbulb Drybulb
Surface Pressure Barometric
Surface Elevation
Surface Rock Temp
6.6.2 Examples of
Rock Properties

Ventsim Visual User Manual Page | 101
quartzite 5.25 800 2.43
quartzite 3.00 800 1.39
rock salt 4.48 880 2.04
sandstone 1.70 920 0.71
shale 1.23 850 0.55
Table 6-2 Metric Examples of Airway Rock Physical Parameters
Rock Type Thermal
conductivity
Specific
Heat
Thermal
Diffusivity
Btu/h/ftF Btu/lbF ft2/h
basalt 1.04 0.20 0.029
coal 0.19 0.31 0.008
dunite 2.48 0.20 0.064
gabbro 1.21 0.19 0.038
gneiss 1.68 0.19 0.050
granite 1.73 0.19 0.055
limestone 0.75 0.20 0.025
magnetite 2.55 0.14 0.081
marble 1.50 0.21 0.046
quartzite 3.03 0.19 0.094
potash 2.02 0.18 0.099
quartzite 1.73 0.19 0.054
rock salt 2.59 0.21 0.079
sandstone 0.98 0.22 0.028
shale 0.71 0.20 0.021
Table 6-3 Imperial Examples of Airway Rock Physical Parameters
Warning – These are examples only. Rock characteristics vary widely for different rock types and locations. Where possible, characteristics should be measured by laboratory analysis.
6.7 Simulation Contaminants
The default contaminant values and factors to use in simulation. In most cases
these values can be overridden in the Edit > Contaminant box.

Ventsim Visual User Manual Page | 102
Figure 6-11 Simulation Contaminant Settings
An arbitrary unit defining the volume concentration value of the contaminant simulation. Ventsim default to a unitless value, which represents a
percentage, however any unit such as ppm or mg/m3 could be used.
Results of the simulation shown will be representative of the original value
entered in the contamination value field.
The default amount of contamination to place in an airway if the smoke tool
button is clicked. For steady state simulation, this would normally be the
maximum concentration expected through the network unless recirculation
or upstream contaminant sources are present. For dynamic state simulation,
this should be considered the average concentration of the contaminant
volume to be cleared. If a high dispersion rate is chosen, the actual
simulation concentration may initially be higher than to ensure that the
required factor is removed within the initial air regeneration.
The default amount of explosive to place for dynamic contaminant
simulation. The higher the amount placed, the more initial contaminant that
must be dispersed into the network.
The value at which dynamic contaminant simulation will stop if every airway
in the mine is below this number. It is suggested this threshold should be
set to a number equivalent to safe access for the area.
The inverse factor rate at which contaminant will be dispersed every air
regeneration. For example a number of 2 represents the contaminant
halving every regeneration of air. Higher values will simulate more rapid
dispersion of contaminant from the initial contaminant source. It does not
affect dispersal rates once the contaminant has entered the main network
airstreams.
The frequency at which the display updates the dynamic contaminant
simulation. The simulation perform a simulation every second, however the
updated may only show every 10 or 15 second results to improve simulation
speed.
The explosive volume expansion factor at which a volume of explosive
Contamination Unit
Default Contamination Value
Default Explosive Amount
Dynamic Contaminant
Threshold
Dynamic Dispersion Rate
Dynamic Display Update
Explosive Fill Factor

Ventsim Visual User Manual Page | 103
contaminate a volume of air immediately after an explosion due to blast gas
expansion and throwback of fumes, dust and blasted material.
Further information regarding contaminant simulation can be found in the
Run > Contaminant section.
6.8 Ventsim Program Settings
Ventsim Program settings control over-arching settings which influence all parts of the program.
Figure 6-12 Ventsim Visual™ General Settings
The type of units to use in Ventsim Visual. The program operates natively in SI
Metric, with underlying calculations performed in metric units. To display
imperial values and accept imperial input, set the unit type to Imperial. The
imperial setting uses a conversion table to calculate the conversion from metric,
and can be customised to suit mine preferences. The imperial conversion table
can even be set to use a combination of Metric values (by setting the table
multiplication factor to ‘1’ and the name to a Metric name).
Warning – the conversion table has set limits of decimal accuracy to convert from metric to imperial and back again. If the decimal accuracy is too low, some accuracy may be lost in the conversion process, and the value input as an Imperial number, may be returned slightly differently.
Forces Ventsim to make a backup of the currently worked network every 5
minutes. If the program crashes, or is forcibly exited, the backed up network
will be loaded automatically next time the program is run.
Warning – if the network has become corrupted for some reason, there is a possibility that the auto-saved network may also be corrupted. For this reason, it is
Unit Type
Auto Backup
Ventsim Visual User Manual Page | 104
recommended that a network be regularly saved to ensure that good working copies are available as backups if required.
Two options are available to automatically simulate networks when they are
loaded. Some ventilation simulation variables including some values shown
in the network summary box are only temporarily calculated after a
simulation and will be lost when the program is closed. To force the
program to perform an airflow or heat simulation, the following options are
available. Note that if both an airflow AND a heat simulation is required,
only the Simulate Heat On Load option needs to be selected. The features
are not recommended for very large files (due to the time it takes for a
simulation) or for files that are not fully balanced or working yet.
Automatically performs an airflow simulation when the file is loaded. This
will update simulation summary parameters and a number of calculated
parameters only available after a simulation
Automatically performs an heat simulation when the file is loaded. This will
update heat simulation summary parameters and a number of calculated
heat parameters only available after a simulation
Automatically performs an heat simulation when the file is loaded. This will
update heat simulation summary parameters and a number of calculated
heat parameters only available after a simulation
Turns on an option to use a Connexion™ 3D mouse. This type of input
allows for models to be rotated, panned, and zoomed with a single control,
leaving the regular mouse free to operate menus and selection duties. This
option will have no effect if a Connexion™ 3D mouse is not present.
Replaces fixed flow input in airway edit forms, with a fixed mass flow option.
Some countries utilise mass flows to specify air quantities in mine
ventilation.
Adjust the willingness of the Ventsim cursor to adjust or join to other
airways while drawing or moving airway items. For finer control (less
propensity to connect to close airways) reduce this number (minimum 1,
maximum 100)
Auto Simulate When Loading
Simulate Airflow On Load
Maximum Airway Numbers
Maximum Reference Elements
Use 3D Mouse
Use Mass Flow
Snap Tolerance

Ventsim Visual User Manual Page | 105
7 The Toolbar
The toolbar allows quick access to commonly used Ventsim Visual™ functions.
The toolbar will be slightly different between Ventsim Viewer, Standard and
Advanced versions.
7.1 File Input and Output Functions
Creates a new file. The current file will be cleared.
Open the file dialog to load a new file
Saves the existing file. If no name has yet been set, a Save File dialog will be
displayed.
Copies selected airways onto the Windows clipboard. The airway can then be
pasted into a different network.
Pastes the airways in the Windows clipboard, back into the currently loaded
network. Note that multiple instances of Ventsim Visual™ can be loaded, and
the airways can be pasted into another instance of Ventsim Visual.
7.2 Utility Functions
Reverses the last action performed in Ventsim Visual
Cancels to previous Undo, restoring any changes made.
Searches for specific items within a ventilation network. Pressing the
‘searchlight’ icon directly, repeats the previous find action. Pressing the
submenu arrow next to the icon, activates the find submenu as shown below.
Chapter
7
7.1.1 New File
7.1.2 Open File
7.1.3 Save File
7.1.4 Copy
7.1.5 Paste
7.2.1 Undo
7.2.2 Redo
7.2.3 Find

Ventsim Visual User Manual Page | 106
Figure 7-1 Find specific airways
Find the name of an airway name or node. Entering any part of the name will
find airways containing the name part.
Find an airway with the specified index or unique number
Find airways with operating fans, fans that are turned off, or fans that are
performing outside of their rated fan curves.
Find airways with fixed flows or pressures.
Find airways with artificially heat, cooling, diesel or moisture sources.
Find airways with contaminant sources set.
Find network errors defined during the previous simulation.
Limits the data types shown in the adjacent pull down menu, to the category
type specified.
Figure 7-2 Select a data category, followed by a data type
Show data types such as air flow volume, velocity, mass flow and density
Shows pressure related data such as relative to surface, barometric and friction
loss.
Name
Number
Fans
Fixed
Heat sources
Contaminants
Errors
7.2.4 Data Category
Airflow
Pressure

Ventsim Visual User Manual Page | 107
Shows airway resistances, friction factors and shock loss numbers
Shows power and cost calculations for airflow, fan and fix inputs
Shows heat related data, such a temperatures, internal heat content, humidity.
Show airway specific indentifying traits, such as index or unique numbers and
primary and secondary layers numbers
Shows airway contaminant factors, source values, simulated values, spread
times and diesel particulate levels.
Show airway rock conditions, such as wetness fractions, specific heat and other
rock parameters.
Not currently used.
Displays screen data of the type specified in the pull down menu.
Warning: some data types (such a pressures) may not be correctly set until after a successfully simulation. While Ventsim Visual™ records previous simulated values in a saved file, these values may not be valid if further changes and modifications have been made to the network.
7.3 Airway Editing Functions
Places the program in view mode
Draw a window to zoom into part of a network. The front most airway in the
view window will define the point of focus for the zoomed in area. To zoom into
area behind other airways, ensure the zoom window does not contain any
portion of the front airways.
Edit the airway. Left clicking the mouse on top of an airway will show the Edit
Box for that airway.
Press and hold to pan the screen horizontal around the current Edit Plane
Click to centre the Edit Plane and rotation point about a specific airway or point
on the Edit Plane.
Rotate the network graphics about the point of focus. Hold and move the mouse
vertically to tilt the network. Hold and move the mouse horizontally to spin the
network.
Places the program into draw (add) mode to allow creation of new
airways or measurement between airways. The function has several
sub-functions available by clicking the small arrow at the right.
Attributes
Energy
Heat
Identifiers
Contaminants
Rock
Measured
7.2.5 Data Type
7.3.1 View
Left Mouse Drag
Left Mouse Click
Middle Mouse Drag
Right Mouse Click
7.3.2 Add

Ventsim Visual User Manual Page | 108
In normal (free draw) mode, airways that are constructed joining from other
airways will adopt the attributes of the joined airway (such as size and wall
friction factors types).
Airways that are constructed away from other airways will adopt the default set
in the Settings menu.
Edit the airway. Left clicking the mouse on top of an airway will show the Edit
Box for that airway.
Constructs a new airway from where the mouse is initially pressed, to the point
where the mouse button is released.
To manually control the coordinates of the airway being constructed, select the
sub-menu functions of the add button as shown below.
Figure 7-3 Manual airway drawing options
Draw Single – allows the mouse to draw both ends of a single airway. Airways can be drawn vertically by hold the SHIFT key down.
Draw Continuous – allows the mouse to continuously draw joined airways until either the ESCAPE button is pressed, or the airway joins into another airway. Airways can be drawn vertically by hold the SHIFT key down.
Draw Gradient – allows the mouse to continuously draw joined airways at a predefined gradient until either the ESCAPE button is pressed, or the airway joins into another airway. The defined gradient is request when activating the function and can be entered as a percentage (eg 10%), degrees (eg 12.5) or a ratio of horizontal to vertical distance (eg 1:10).
Draw Coordinates – show the coordinate entry box after the airway is drawn to allow manual entry of airway end coordinates.
Vent Duct – a tool for quickly building ventilation ducting which follows existing airways. Select the airways you wish to construct ducting along with the SELECT button. Chose the Build Vent Duct option.
Left Mouse Click
Left Mouse Drag

Ventsim Visual User Manual Page | 109
7-4 The Vent Duct Builder Dialog Box
Once selected, the vent duct builder box requires a number of values to be
entered
Diameter – the diameter of the duct
Friction Factor – the friction factor of the duct
Leakage Factor – allow a leakage factor to be specified, representing the
resistance of the leakage of air from the duct over 100m (or feet). Higher
values represent lower leakage. Placing a zero (0) in this box represent no
leakage. Leakage factors are largely an imperical estimate, best calculate
from actual installations of vent duct. Metric values of greater than 5000
represent low leakage, from 1000 – 5000 moderate leakage, and less than
1000 high leakage.
Leakage Intervals – leakage from a duct must be built in Ventsim to re-enter
the airway along the duct length at regular intervals. This specification
instructs Ventsim to build a path (another duct) into the airway to allow air
to leak back into the main airway. The resistance of this path is calculated
automatically and is a function of the leakage factors and the leakage
interval. Smaller leakage intervals will theoretically give more accurate
answers, but will increase the clutter and complexity of the display.
Offset – specifies where the duct will be built in relation to the airway. It is
advantageous to build the duct outside of the main airway as it is easier to
see and manipulate. Do not use an offset of (0, 0, 0) as this will interfere
with the airway position and may not simulate correctly.
Build Duct – starts the duct building process. A duct and leakage paths are
place on a single group to allow the system to be selected with a single
Select click in future.

Ventsim Visual User Manual Page | 110
7-5 Example of duct built with automatic leakage paths
Modify Duct – modifies existing selected ducting with any new factors
entered into the duct builder. Note that the leakage intervals cannot be modified. If this is required, the duct should be removed and re-built.
Remove Duct – deletes any existing selected ducting from the model. If
normal airways are also selected, then this function will only delete ducting
and leakage paths.
Hint – Things you may want to do next - Correctly enter the duct size and friction factor in the EDIT box. - Place a suitable fan at the start of the ducting airway - Consider placing an obstruction in the main airway if the duct is
significant in size, and airflows along the main airway are high.
Measure – allows the mouse to measure distances between two
points. Click on the start point of where the measurement will start,
and drag the mouse to the end point. The measurement will display in
the bottom left Status Bar area of the screen.
Convert Centreline – allows the selective direct conversion of DXF
reference lines to airways. If imported DXF centrelines are shown as a
reference layer on screen (instead of automatically being converted to
airways on import), then this function can be used to selected click or
fence the reference lines that are to be converted to airways. Note
that each reference line can only be selected once, as the program will
not duplicate multiple selected lines.
Convert Any – where centre lines may not be available, this is an
experimental feature which agglomerates groups of reference graphics
to try and establish an airway path which could be constructed.
Examples may include survey string data showing wall, floors and
backs, or 3D solids of actual mine development or shafts. Note that
the results from this function are very approximate and will likely
require significant manipulation with the MOVE and DELETE tool
function after being done, to create a workable network.
7.3.3 Draw - Convert

Ventsim Visual User Manual Page | 111
Place the program into Edit mode
Edit the airway. Left clicking the mouse on top of an airway will show the Edit
Box for that airway.
Selects the airways within the fence box being drawn. Selected airways can
then be edited by clicking on any of the selected airways.
Hint : Selecting Multiple airways permits attributes for a large number of airways to be changed simultaneously. This can greatly speed up creating a network.
Selects a group of airways. Selected airways are considered ‘attached’ as a
group by a number of other Ventsim Visual™ functions such as Edit, Delete,
Move or Copy, which all treat selected airways are joined together.
Selects or de-selects the airway under the current mouse cursor.
Fences a number of airways for multiple selection.
De-selects all currently selected airways
Deselects fenced airways
Figure 7-6 Multi Selection Options
Permits groups of airway to be automatically selected, based on either an initial
airway selection, or subsequent selections with the mouse. The selection mode
will remain set, until it is reverted back to the single airway select option, or the
<escape> key is pressed twice.
7.3.4 Edit
Left Mouse Click
Left Mouse Drag
7.3.5 Select
Left Mouse Click
Left Mouse Drag
<Escape>
<Shift>
7.3.6 Multi Select
Options

Ventsim Visual User Manual Page | 112
For example, to select all airways of the same size, either select a single initial
airway with the select button, and then select the mult-select option “Same
Size”. OR select the “Same Size” option first, and then click on an airway. All
airways of the same size as the initial selection will be selected. Once selected,
the airways can be edited, deleted, move etc.
Deletes an airway or airways from a network
Delete the airway. Left clicking the mouse on top of an airway will delete the
airway beneath the mouse cursor. If multiple airways have been selected, it will
delete all selected airways.
Selects the airways within the fence box being drawn. Selected airways can
then be deleted by clicking on any of the selected airways.
Figure 7-7 Deletion options
Presents a number of deletion options.
Delete airways outside fence will delete all airways not inside the fenced area.
This can be useful to remove errant airways which may be located a long way
away from the main network.
Delete references removes DXF graphics within the fence area. Delete
references outside fence remove DXF graphics not within the fenced area.
Blocks or unblocks an airway with the highest resistance available (as
defined in the Settings menu). This will restrict nearly all airflow through the
airway.
Figure 7-8 An airway stopping
Warning: Ensure that fans or fixed flows are not present in blocked airways, or in airways leading to or from blocked airways. This will create a simulation error, as
7.3.7 Delete
Left Mouse Click
Left Mouse Drag
7.3.8 Deletion Options
7.3.9 Block

Ventsim Visual User Manual Page | 113
airflow will be unable to travel through the blocked airway without unreasonable pressure or heat build-up.
Moves the selected airway, airways, airway ends or icons to a new location
To move an airway end (and all other attached airway ends), click on
of close to the end node of an airway
To move an airway end away from other airways, click slightly back
from the airway end node. The airway should ‘break’ away from other
connected airways.
To move an entire airway (both ends), first select the airway with the
select button, or fence the airway to be moved, and then drag the
selected airway(s) to the new location.
Multiple airways can be moved by first selecting the airways and the
dragging any one of the selected airways to the new location.
To move an icon (such as a fan, heat source or resistance) along an
airway, simply grab the icon with the left mouse button and drag the
icon along the airway to the new location. Icons can also be dragged
to other airways.
Opens the coordinate entry dialog box to allow the move to be specified as a
coordinate or offset from the current position.
Drags the airway or node to a new location in the same horizontal elevation
plane. A ‘true vertical’ line is displayed showing where the move point is in
relation to other airways.
Drags the airway or node to a new location in the vertical plane, adjacent to the
viewing screen. The Edit Plane is moved with the dragged airway to indicate
where the elevation is in relation to other airways.
Copies the selected airway, airways or icons to a different location. The
original airways or icons remain in place.
Opens the coordinate entry dialog box to allow the copy to be specified as a
coordinate or offset from the current position.
Drags the copied airways or icons to a new location. If the ICON is being copied,
it will show on airways under the mouse cursor. When moving airways, a ‘true
vertical’ line is displayed showing where the move point is in relation to other
airways.
To copy an icon (such as a fan, heat source or resistance) along an airway,
simply grab the icon with the left mouse button and drag the icon to another
airway.
7.3.10 Move
Left Mouse Click
Left Mouse Drag
Left Mouse Drag + Shift
7.3.11 Copy
Left Mouse Click
Left Mouse Drag

Ventsim Visual User Manual Page | 114
Drags the copied airways to a new location in the vertical plane, adjacent to the
viewing screen. The Edit Plane is moved with the dragged airway(s) to indicate
where the elevation is in relation to other airways.
Reverses the direction of the selected airway. The direction of the
airway, and the airflow within the airway is reversed. Fan, fixed flows
and pressures are also reversed.
Inserts a node or junction within an existing airway. The airway is split
into two airways as a result. This node can then be moved or joined into
by other airways.
Hint : Drawing an airway into the middle of another airway will automatically create a new node or junction into the joined airway.
Places a contaminant type within an airway. A number of different
contaminant types can be chosen.
Figure 7-9 Contaminant placing options
Contaminant
Places a standard contaminant value (defined in the Settings > Contaminants) in
an airway. Standard contaminants are considered unit less, however different
units can be specified in the settings. All downstream simulation value will be
related to the initial concentration of a contaminant in the airway’s airflow.
Downstream contaminants are diluted proportionally to this value. See the
contaminant section for further detail.
Report Smoke
Used in the contaminant tracking routines, this will place a smoke report within
an airway. After a contaminant tracking simulation, all airways below this point
will be considered as contaminated. All airways upstream from this point will be
considered as a potential source of the contamination.
Report Fresh
Again, used in the contaminant tracking routines, this will place a fresh air report
within an airway. After a contaminant tracking finding simulation, all airways
above this point will be considered as fresh air.
Left Mouse Drag + Shift
7.3.12 Reverse
7.3.13 Insert Node
7.3.14 Contaminant

Ventsim Visual User Manual Page | 115
Places or removes one of the above types of contaminants.
7.4 Viewing Functions
Shows the Display Manager dialog box, which floats on top of the Ventsim
Visual™ windows, and can be kept open at all times if desired.
The Display Manager control provides options as to what graphics details to
display, primary and secondary layers, elevations levels, saved views and copy &
paste options. Because complex display can quickly become cluttered with data
and information, this dialog box is useful to reduce the amount of data (and
hence clutter) in the display.
Hint : The Save View function from the Saved View Menu can be used to store specific display options settings, without having to go back through the dialog box and click specific items.
Figure 7-10 Display Manager Settings
Displays the graphics details to show in the main window. To show or hide
detail, simply click the check box adjacent the item (such as nodes, or airflow
arrows). To select ALL graphics, or HIDE all graphics, select the root check box
adjacent Graphics.
Select the text data that is displayed on screen.
Value displays text data associated with the data type selected in the
main menu
Airway displays the name of an airway (if set)
Node displays the name of a node (if set)
Text data can be further limited by restricting which airways show text (from the
Edit Box) and choosing Text Data > Show Limited under the View Menu
Selects which levels (elevation ranges) are displayed on screen. To select or de-
Left Mouse Click
7.4.1 Display Manager
Graphics
Text
Levels

Ventsim Visual User Manual Page | 116
select all levels, choose the root check box adjacent to ‘Levels’.
To change a level name, right mouse click on the existing level name and type in
the new name.
Selects which primary layers are displayed on screen. Layers are a way to show
selected airways (such as a decline system or a shaft system) on screen while
hiding other airways. Primary layers can be set to individual airways in the Edit
Box. To select or de-select all primary layers, choose the root check box
adjacent to ‘Secondary Layer’
To make a Primary Layer Active (which results in all new or imported airways
adopting the layer name), click on the primary layer name so that it turns RED.
To change a Primary Layer name, right mouse click on the name and type in the
new name. Primary names can also be changed directly from the airway Edit
Box.
Figure 7-11 Setting Active Layer (Crusher) Display with the Display Manager.
Selects which secondary layers are displayed on screen. Secondary layers are
similar to primary layers, and simply allow another level or layers to be
displayed. Primary and Secondary Layers work in conjunction with each other,
and must both be set to allow an airway with the primary and secondary layers
attributes to be displayed
For example, if a particular airway is set in the Edit Box to a primary layer of ‘Decline’ and a secondary layer of ‘East Mine’ then both the Decline and ‘East Mine’ layers would need to be selected in the Display Manager. If either or both layer was not set, the airway would not be displayed.
To select or de-select all secondary layers, choose the root check box adjacent to
‘Secondary Layer’
Again, to make a Secondary Layer Active (which results in all new or imported
airways adopting the secondary layer name), click on the secondary layer name
so that it turns RED.
Primary Layer
Secondary Layer

Ventsim Visual User Manual Page | 117
For example, if a DXF string file is to be imported into Ventsim Visual, it is often of benefit to place it on a separate layer so it can be viewed or edited in isolation of other network airways. In this case, the primary and secondary layers to place the import would be clicked RED and the imported file would then appear on these layers. The layers could then be shown in isolation from other airways, by turning OFF the other layers.
To change a Secondary Layer name, right mouse click on the name and type in
the new name. Secondary names can also be changed directly from the airway
Edit Box.
Recalls views saved under the SAVED VIEW main menu. This function
duplicates the functionality already found under this menu.
Selects what airway attributes are copied and paste when the copy / paste attributes function is selected under the Edit menu. The copy paste attribute
function allows rapid copy of existing airway attributes on to other airways. This
function duplicates the Edit Box functionality which also allows multiple airways
to be selected and simultaneously changed.
Figure 7-12 Copy and Paste attribute options selection
Example : An existing airway has been set as an exhaust airway with custom primary and secondary layers. To copy these attributes on to other airways,
Select Primary, Secondary and Air Type options on the Select Box
Select Edit > Copy Attributes
Click the airway you wish to copy the attributes from.
Select Edit > Paste Attributes
Click or Fence the airways you wish to copy the attributes to.
Saved Views
Copy Paste
7.4.2 Colour Manager

Ventsim Visual User Manual Page | 118
The Colour Manager controls many of Ventsim Visual™ advanced display
functions. At the core of the manager is the ability to display any type of
ventilation data as a colour range, including the ability to hide or make
transparent data outside of a set range.
Ranged Data. The data which creates the colour legend is automatically ‘ranged’
to fit the network data values. It may occasionally require resetting if new or
changed values are present in a network (after a simulation for example), or the
values do not divide the colours as you would like. The data can be re-ranged by
either manual typing in new values, or allowing Ventsim to automatically choose
new values by selecting the Options menu.
Median Range, will divide airways into a number of equal groups from highest to
lower value, and take the average value for each group (useful for non-linear
data like resistances which have a few very high values and lots of very low
values).
Average Range establishes a linear legend from highest to lowest.

Ventsim Visual User Manual Page | 119
Data range of airway data,
equally divided by airway
numbers. To manually
change, simply enter a
new value in the box.
Upper and lower
range limiters
Transparency level
slider, for data outside
of data range values Hide or make
transparent
data outside of
range
Selectable data type to
display as a colour
range
Recalculated colour
range derived from the
top data range and the
range limit sliders
Unit type of displayed
data type.
Adjustable colours
for each range. To
change a colour,
click the colour
square and select a
new colour from
palette

Ventsim Visual User Manual Page | 120
OPTIONS
Reverses the colour range direction
Restores the colours to the default Ventsim Visual™ palette.
Restores the range to the full spectrum of available airway data values.
Hint: The Colour Manager will initially default to automatically range and set colours for the displayed data. If the range values are manually adjusted, or the colours are changed, the Colour Manager will no longer automatically range and adjust colours for the data displayed. To restore or recalculate the range and colours, simply click the ‘Auto Range’ or ‘Restore Colours’ buttons.
Hint: Ventsim Visual™ will store a custom colour and data value range for each type of data type. This setting is saved with the Ventsim Visual™ file.
See Colour Manager for further information.
Figure 7-13 The Colour Manager sub menu
Shows the colour manager on screen. The Colour Manager will remain on top of
all other windows while displayed.
Hides the Colour Manager form
Automatically matches the colour display, to the data type shown on the screen
as text. The colour display and the text display are totally independent. This
function will match the two items, to that text displayed on the airways on
screen, matches the colour range displayed.
The animation ‘play’ button animates the airflow arrows in the network.
The airflow animation is performed at true scale speeds, with airflow arrows
travelling at the simulated air velocities in the network. Providing the model is
designed true to scale, the progress of airflow can be tracked at the same speed
as expected airflow in the underground mine.
Reverse Spectrum
Restore Colours
Auto Range
7.4.3 Colour Manager
Sub Menu
Show
Hide
Colour Data
7.4.4 Flow Animation

Ventsim Visual User Manual Page | 121
Figure 7-14 Animation Speed Control
The animate toolbar button has a number of sub menu items
Animates airflow at scale speed.
Animates airflow at five (5) times the scale speed
Animates airflow at ten (10) times the scale speed
Halts the flow animation process.
Hint: Clicking the main flow animation icon will cycle the airflow speeds through all available ranges.
7.5 Simulation Functions
The simulation functions control the major simulation capabilities of Ventsim
Visual. The buttons assumes that a valid network has been created and all
required data has been entered in preparation for simulation.
Performs an airflow simulation on the network data.
For more information, see Airflow Simulation
Performs a thermodynamic simulation on the network data
For more information, see Thermodynamic Simulation
Performs a contaminant simulation on the network data. Contaminant sources
or flag must be present in the network to work. Three different types of
contaminant simulations are available from the sub menu pull down (arrow to
the right of the icon). See the Run Contaminant Menu bar for more information.
Figure 7-15 Contaminant Options
X1
X5
X10
Stop
7.5.1 Airflow
Simulation
7.5.2 Heat Simulation
7.5.3 Contaminant
Simulation

Ventsim Visual User Manual Page | 122
Spreads contaminant sources through the network as a never ending continuous
stream. The display and colour legend automatically switch to a contaminated
concentration display, showing the simulated spread and contamination of the
contaminants. See Contaminant Spread from the menu bar section for further
information.
Hint : A number of additional contaminant data types are available including the ‘spread time’ of data.
Spreads contaminant sources from a dynamic source such as an explosive blast which changes over a period of time. See Contaminant Spread from the menu
bar section for further information.
Hint : A number of additional contaminant data types are available including the ‘spread time’ of data.
Performs a source simulation, where the sources of airflow through the
contaminant are tracked back to an origin. The contaminant markers are used
to define the point(s) at which the simulation searches upstream for paths. The
display and colour legend automatically switch to a source concentration display,
which shows the relative amounts of airflow along different airway paths which
eventually flow through the contaminant marker. See Contaminant Source from
the menu bar section for further information.
Performs a contaminant search simulation which tracks the likely paths of fresh
and contaminated air. See Location Tool from the menu bar section for further
information.
Performs a diesel particulate matter spread simulation based on diesel heat
sources in a mine network. The result is displayed as a concentration per unit
volume of airflow. The diesel heat sources are defined under the thermodynamic
Heat Tab from the Edit Box form. Diesel heat sources are converted to a diesel
particulate emission rate per unit of engine power, based on either a default
setting, or entered directly in the Edit Box or Preset form. Diesel emissions are
spread throughout the network using a steady state, complete mixing algorithm
that assumes perfect mixing and no settling or deposition of particles. Diesel
sources are assumed cumulative, and downstream sources or recirculation may
increase concentration higher that the initial source.
The simulated air concentrations are given in the same emission type as
specified in the exhaust emissions. For example if a total diesel particulate
matter rate is given for a diesel engine (which includes elemental and organic
carbon, as well as other matter such a sulphates and non-carbon matter), then
the air concentration rates will also include this material. Most air quality
standards will quote either an Elemental Carbon limit or a Total Carbon limit.
To convert to an Elemental or Total Carbon concentration, a factor will need to
be applied either to the original emission rate, or to the simulated air
concentrations.
See DPM emissions for further information.
Steady State Distribution
Dynamic Distribution
Source Distribution
Finder Tool
7.5.4 Diesel DPM
[Advanced]

Ventsim Visual User Manual Page | 123
Performs a recirculation search simulation which attempts to find any paths
or portions of paths which recirculate in the mine. Any recirculation paths are
highlighted after simulation and the portion of each airflow recirculating through
each airway will be shown on the screen as colour and text. For further
information, see Recirculation Simulation under the Menu Bar Chapter.
Performs a financial and airflow simulation for multiple airway sizes, to assist
in determining the optimum airway size for mine ventilation flows. For further
information, see Financial Simulation under the Menu Bar Chapter.
7.5.5 Recirculation
Simulation
[ADVANCED]
7.5.6 Financial
Simulation
[ADVANCED]

Ventsim Visual User Manual Page | 124
8 The Edit Box
The edit box is a powerful tool required to manipulate and display airway attributes. In summary, the Edit Box can perform the following functions
Set airway attributes for airflows and pressure simulation.
Set airway attributes for heat simulation.
Set contaminant and gas attributes for airways
Allow custom comments and information (such as survey results) to
be set for each airway
Display working fan duty curves
Display airway information derived from simulation
The Edit Box can be activated by clicking on an airway while in the View, Edit or
Add modes selected from the main toolbar. The Edit Box is divided into a
number of TABS to allow quick access to each function.
Figure 8-1 Edit Box Tabs
Edit Box Menu
Creates a picture of the current airway information. This picture can be saved
(by right clicking the form) or used to compare results with an updated
simulation.
Allows the selection of multiple airways based on a selection criteria.
Multiple selected airways can be edited simultaneously from the Edit Box.
The number of airways selected will be displayed in the form Caption Box (at
the top of the form).
Selects all airways directly joined to the initial airway (for example a decline
loop). The selection will stop when the airways reach a junction.
Selects all airways with the same primary layer
Selects all airways with the same secondary layer
Selects all airways of the same size
Chapter
8
8.1.1 File > Create
Picture
8.1.2 Select Airways
Select Joined Airways
Select Same Primary Layer
Select Same Secondary Layer
Select Same Size

Ventsim Visual User Manual Page | 125
Selects all airways with the same resistance type (eg bulkhead). This may
be useful for group changing and testing different regulator types on
network performance.
Selects all airways with the same friction type (eg ‘rough blasted’ walls).
Selects all airways with the same shock type.
Selects all airways with the same fan. Note that while fan types cannot be
changed in multiple headings, however fans can be turned on or off over
multiple headings.
Selects all airways with the same air type (for example ‘exhaust’)
Selects all airways with the same heat type (eg trucks). This may be useful
for example to rapidly change all similar heat sources in a network to a
different heat source (for example change all Truck Models from ABC500’s
to ABC750’s)
Selects all airways with one end that are not connected to others, and which
are not flagged as connected to surface or marked as ‘allow closed end’.
This function is useful for quickly editing new network creations (from a DXF
file for example) which may have lots of dead ends and development stubs
(eg truck bays) that need to be flagged or deleted to prevent no entry / exit
errors in the simulation. Note that this function should only be used when all
valid connections have been accounted for.
Similar to the loose end selection, but only selected airways with no
connection on both sides.
Select airways with the same sourcing contaminant type. This selection was
included to allow rapid definition of different air types in a mine by using the
contaminant finding function. For example is a ‘smoke’ sourcing pin was
placed, all airways downstream will be turned ‘red’ for contaminated air. If a
‘fresh air’ sourcing pin is placed, all airways upstream will be turned ‘blue’ for
fresh air. Once all entries and exhaust pathways to the mine are marked,
similar airways can be selected and the air type for those airways could be
changed to ‘Fresh’ or ‘Exhaust or ‘Intermediate’ etc.
Allows the selection of multiple airways based on a selection criteria. Where a
fixed flow has been used to retard or resist normal airflow, the resulting
resistance can be used instead of the fixed flow. Select this option to convert the
fixed flow into a custom resistance. If multiple airways are selected, then all
selected fixed flows will be converted to resistances. The fixed flow is removed
once this action is done.
Pressure surveys of airways or shafts allow more accurate resistances to be
calculated and used in Ventsim. These options provide tools to convert
differential or barometric pressure survey information into resistances or friction
factors. Select the airways along which the pressure survey was performed and
select the menu option. A dialog form will show which allows the survey
information to be entered and the resistance or friction factor to be calculated.
Select the desired resistance method (fixed resistance, linear resistance or
friction factor) and select OK to update the model airways.
Select Same Resistance Type
Select Same Friction Factor Type
Select Same Shock Type
Select Same Fan
Select Same Air Type
Select Same Heat Type
Select Loose Ends
Select Both Loose Ends
Select Same Contaminant Type
8.1.3 Tools – Convert
fix to resistance
8.1.4 Pressure Survey
Tools
Ventsim Visual User Manual Page | 126
Note that if Friction Factor is chosen, then an accurate survey of the airway dimensions is required if the factor is to be used elsewhere.
Applies a gradient or slope to the selected airways. The gradient will start from
the end selected first in the EDIT box. This tool assist in creating ramps between
levels, particularly if survey data has been entered in 2D and requires to be
converted into 3D.
Distributes rock opening ages evenly along a series of connected airway
segments. The rock age distribution will start at the end selected first in the
EDIT box. Ensure that the airways selected do not have split airways into
other areas otherwise the function will fail to distribute the ages properly.
Convert any custom resistance in the edited airways to friction factors, and
resets the resistance to AUTO.
Converts any custom linear resistance in the edited airways to friction factors
and reset the resistance to AUTO.
8.2 Airway Tab
Changes made to the airways in the Edit Box are highlighted in BLUE. The
changes are applied to the airway when;
Apply is pressed. – the Edit Box form will remain open
OK is pressed – the Edit Box form will then be close
If another airway is selected, the changes will be applied, and the next airway
data will be displayed.
Multiple airways can be selected and simultaneously edited from the Edit Box.
Note that not all Edit Functions are available for multiple editing and some
function may be hidden. To utilise multiple airway editing, simply Select the
required airways before the Edit Box is opened. Only attributes that are changed (and therefore highlighted in BLUE) are applied to the selected airway(s)
The airway Tab Page controls most of the airway attributes associated with
airflow and pressure simulation, as well as basic airway information such as
names and airway coordinates.
8.1.5 Apply Gradient
Slope
8.1.6 Distribute Rock
Age
8.1.7 Custom
Resistance to
Friction Factors
8.1.8 Customer Linear
Resistance to
Friction Factors

Ventsim Visual User Manual Page | 127
Figure 8-2 Airway Edit Box Form
Sets the airway and node names, and airway coordinates. To set new names or
coordinates, simply type the information into the relevant text boxes.
Figure 8-3 Set airway names and coordinates
Set the physical characteristics of the airway
8.2.1 Airway Names
and Coordinates
8.2.2 Airway Size

Ventsim Visual User Manual Page | 128
Figure 8-4 Set airway physical characteristics
Allows a preset type of airway to be specified, which will automatically set the airway
profile, dimensions and friction factors. Pressing the TYPE button will open the PRESET
form where more airway preset types can be entered.
Sets the profile of the airway. If the shape chosen is ‘irregular’, the Width and
Height input boxes will be changed to Perimeter. The Area box can be used to
enter the actual airway area.
Square
Round
Arched – an airway with arched upper corners.
Shanty – an airway with one side higher than the other.
Irregular – an undefined shape characterised by area and
perimeter
If the shape chosen is ‘round; the Width input box will be changed to
Diameter.
If the shape chosen is ‘irregular’ the Width input will be changed to
Perimeter.
Further profiles can be created in the Presets form.
Recommends an airway size based on the current simulated or fixed
flow. Note that this is a recommendation based exclusively on the
current flow and airway attributes. If these values have not been
established yet, do not use this feature to estimate the most efficient
airway size. Also note that if the airway size is accepted, this may
actually change simulation results, and other adjustments elsewhere
in the network to fans or regulators may be required to return the
airway to original flow rates.
Warning – do not use this feature unless the required airflow rate has currently been simulated or fixed in the airway, and the default COST settings have been set in the Tools > Settings.
Removes wall contacts from the airflow to simulate open airways or stope
panels that follow each other, but do not have (for example) side wall
connecting the airways. The air friction and heat transfer factors on these
excluded walls are removed from the simulation.
The number of parallel airways defined by the single airway. This allows
multiple airways in parallel to be represented and simulated by a single displayed
airway.
The width of the airway
The height of the airway. For vertical airways, the width and height are
interchangeable. For ‘Arched’ or ‘Shanty’ airways, the height is assumed to be at
the centre of an airway.
Type
Shape
Number of Airways
Width
Height

Ventsim Visual User Manual Page | 129
The calculated area of the airway, derived from the width, height and shape. If
the shape chosen is ‘irregular’ then the Area box can be edited, otherwise it will
remain as Read Only.
Assumes a continuous area obstruction along the airway (for example a duct or
some services) and removes this value from the available area of the airway.
Note that this should not generally be used for short fixed objects (such as a
vehicle); in this case the orifice function may provide a better simulation result.
Assumes a continuous % obstruction of backfill along the length of the airway
and removes this value from the available area of the airway. In addition, it
removes the area of covered airway that transmits heat into the airway, to assist
in heat transfer calculation in backfilled stopes.
The calculated length of the airway. The calculated length is derived from the
airway coordinates. To change the length, click on the Check Box, and type in
the new length. This may be required if an airway is moved to allow easier
viewing, but the true original airway length still needs to simulated in the
network.
The calculated flow in the airway. This number is Read Only and cannot be
changed. To fix the flow in an airway, use the Fix Flow box in the Fan Section
The calculated pressure drop in the airway. This number is Read Only and
cannot be changed. To fix the pressure in an airway, use the Fix Press box in
the Fan Section
The calculated velocity of air in the airway. This is the average velocity of air
across the airway area, and is ‘Read Only’ and cannot be changed.
Control various attributes relating to the airway behaviour and identifiers within
a network
Figure 8-5 Further Airway Options
Connects the airway to the surface, allowing it to freely exhaust and intake air
from the surface atmosphere. The airway end which is not connected to any
other airway is assumed to be the end connected to the surface. If both airway
Area
Obstruction
Backfill
Length
Quantity
Friction P
Velocity
8.2.3 Airway Options
Surface

Ventsim Visual User Manual Page | 130
ends are connected, this item is ignored by the simulation. The exit to the
surface is assumed to be at the elevation of the airway end. Barometric
pressures at this point will be adjusted for any difference in height between the
airway elevation and the defined surface elevation.
Allows Ventsim Visual™ to assume the airway ends without connecting to other
airways or to the surface. Examples of this may include a dead end, blind
developing heading or undeveloped heading. The simulation process will assume
this path is blocked, and allow no airflow along the airway. Without setting this
option, a simulation may end with a ‘no entry’ or ‘no exit’ error.
Groups any selected airways into a single selectable group that can be selected
with a single Select click. Individual airways can still be individually edited by
clicking on them directly with the EDIT button instead of using SELECT first.
Group airway are a convenient way to collect airway systems together (for
example shafts or decline sections), so they are easier to select and edit
simultaneously. It has no effect on simulation.
Excludes the airway from the simulation process. Any errors or problems with
the airways are ignored during simulation and no flow is allowed through the
airways. Any non-excluded airway which join with excluded airway will be
assumed to be blocked. This function is handy for excluding sections of a mine
which have yet to be mined, or perhaps old sealed of filled sections of a mine
which no longer carry ventilation.
Prevents Ventsim Visual™ from changing the airway’s airflow direction during
simulation. An error is displayed after simulation if an attempt to reverse is
made. This function is useful to ensure critical airflow locations underground are
not arbitrarily changed without first warning the user.
Always shows text data for this airway when the text view option is set to
limited.
Specifies the gradient of the airway as a percentage. For example a gradient of
10% results in an airway increasing 1m in height for every 10m in horizontal
length. If a group of selected airways needs to be change simultaneously, use
the TOOL > APPLY GRADIENT option in the EDIT form menu. Note that the first
selected airway clicked with the EDIT button will be the airway from which the
gradient is applied.
Specifies an evasé or diffuser for the airway outlet. This function will only be
simulated on a surface connected airways, and will only have an influence on an
exhaust airway. An evasé or diffuser reduces exit velocity pressure losses to the
mine, lowering overall total system pressure requirements to produce the same
airflow. Where fans are present, an improvement in the performance of the fan
will be noted with increasing evasé sizes. Note that the simulated evasé effect is
theoretical only, and will ultimately depend on the efficiency and placement of
the design to produce the simulated effects in a real mine. As with all ventilation
structures, there will be some efficiency and shock loss factors that will reduce
performance from the theoretical calculation. These should be considered when
observing the effects of simulated evasés.
Note that only the Total Pressure simulation method simulates lost total
pressure, in the form of escaping velocity pressure from a mine, by calculating
lost velocity pressure to the mine, and applying this against available Fan Total
Pressure installed in the model.
Close End
Group
Exclude
Fix Direction
Show Data
Gradient
Diffuser

Ventsim Visual User Manual Page | 131
Places a sudden restriction in the airway, with a hole equivalent to the specified
area. The resulting shock loss and resistance of the orifice will be added to the
resistance of the airway. Orifice settings are normally used to simulate the effect
of regulators, holes in wall, partly open doors or other sudden restrictions which
may occur in underground headings.
Sets the type of air the airway is carrying, for example fresh, exhaust, mixed
etc. The air type can be shown as a separate colour on screen by selecting air type under the favourites menu on the Colour Manager.
Figure 8-6 Example of use of fresh / exhaust airway colouring
Hint : Most mines have designated fresh and exhaust airways, and may also have airways which may be designated as potentially either, depending on production activities. Ventsim Classic 3.9 defaulted to a blue / red / green colour scheme for these three types of airways. Ventsim Visual™ uses these three air types, but also has potentially 35 other types (and colours) which can be specified under the Edit Box. Potential other air types could be set by the user as ‘emergency access’, flooded’ etc.
Sets the primary layer type of the airway. Once set, primary layers can be
independently displayed using the Display Manager. The name of the primary
layer can be changed by clicking the Primary Layer button, and entering a new
name in the preset spreadsheet.
Sets the secondary layer type of the airway. Once set, secondary layers can be
independently displayed using the Display Manager. The name of the secondary
layer can be changed by clicking the Secondary Layer button, and entering a
new name in the preset spreadsheet.
Sets airway resistance, friction factors and shock loss factors for an airway.
The sort order of the attribute items in the list boxes can be specified in the
Preset Manager
Orifice
Air Type
Primary Layer
Secondary Layer
8.2.4 Airway
Attributes

Ventsim Visual User Manual Page | 132
Figure 8-7 Resistance, Friction and Shock Factors
Set the resistance for the airway. Resistance can be set to automatic, preset or
fixed.
To set to automatic, and allow Ventsim Visual™ to calculate the resistance from
the airways size and wall friction factors, choose Automatic from the pull down
menu.
To use a preset value, selection of one of the one hundred preset airway
resistances from the pull down menu. To set a new Preset Resistance or change
an existing one, select the Resistance Button to enter the Preset Spreadsheet
and enter or change any existing resistance values from the Preset Spreadsheet.
When the Preset Spreadsheet is closed, the new preset resistances will be
available in the pull down menu for all airways.
To enter a fixed or one-off resistance value (which may be measured or pre-
calculated elsewhere), enter the value directly into the resistance text box.
Resistances are normally set to apply equal resistance to airflow in either
direction, however in Ventsim Visual, resistances can be specified to apply a
different resistance when airflow is reversed. To enable this function, ensure a
preset resistance is present in an airway and select the ‘Restrict/Prevent Airflow
Reversal’ option in the Edit box. This will force the simulation to consider an
alternative resistance if the airflow is reversed. Example of use for this function
include resistances such as hanging flaps or swinging doors which may either
seal better, or alternatively swing open if airflow is reversed.
To specify the reverse resistance, use the preset spreadsheet to enter the
values. To apply a default reversal resistance (specified in the Settings menu)
leave the reversal resistance at zero (0).
Next to the resistance text box is the density adjustment check box. Resistance
can change according to the air density at which it is applied. Ventsim Visual™
will internally adjust resistances during simulation according to the local air
density.
If this box is not checked, the resistance entered is assumed to be
derived from a standard air density as specified in the Settings Menu
for Simulation – Air (which is normally 1.2kg/m3 unless set
otherwise). In most cases, resistances are likely to have been derived
from preset values and standard air densities, and this option should
remain unchecked.
If the box is checked, Ventsim Visual™ will assume an adjustment has
already been included and will not attempt to adjust the resistance
from density changes further. Examples of this may be if the
Resistance
One way Resistances
Resistance Density Adjustment

Ventsim Visual User Manual Page | 133
resistance has been measured at a specific site underground at a
density similar to that simulated by the program.
Set the friction factor for the airway. Friction factors describe the unevenness of
wall profiles, which produces airflow turbulence and hence pressure loss. The
value can either be entered directly in the Friction F text box, or can be selected
from the pull down menu. As with resistance, new preset values can be entered
by clicking the Friction button, and entering new preset values in the Preset
Spreadsheet. The new Preset Friction Factors will be available for all airways.
Similar to the resistance density adjustment, friction factors are also
standardised to an air density, and need to be adjusted for different air
densities. Ventsim Visual™ will internally adjust friction factors during simulation
according to the local air density. If this box is not checked, the friction factor
entered is assumed to be derived from a standard air density as specified in the
Settings Menu for Simulation – Air (which is normally 1.2kg/m3 unless set
otherwise). In most cases, friction factors are likely to have been derived from
preset values and standard air densities, and this option should remain
unchecked.
If the box is checked, Ventsim Visual™ will assume an adjustment has already
been included and will not attempt to adjust the friction factor further. Examples
of this may be if the friction has been measured along a specific airway
underground at a density similar to that simulated by the program.
Sets a shock loss factor for the airway. Shock losses can be set as an equivalent
length, or as a shock loss factor (X). The method used is defined in the Settings.
Only one method can be used for all airways, so ensure shock values are
consistent with the chosen method throughout the network.
Shock values can be manually entered in the text box or set to a Preset Value or
to Automatic value from the pull down menu at the right. To change or establish
new preset values, press the Shock button, and enter or change the values in
the Preset Spreadsheet.
If Automatic is chosen, Ventsim Visual™ will attempt to recalculate a new value
during simulation, by observing airflow direction, airway geometries and airway
size changes. Note that this is a rough estimation only and may change slightly
with every simulation due to changing airflow and directions. In critical areas
which are subject to high airflows and large shock losses, a more thorough
examination of airways should be performed, and the shock factor settings
manually calculated and used. Guides in setting Shock Value are available in
most quality ventilation texts.
8.3 Fans
Displays a form allowing fan and fixed flow and pressure settings to be
established in an airway. If a fan is present, a fan curve graph and duty will be
displayed after simulation showing fan performance in a simulated network
airway. If no fan is present in the airway being edited, a blank window will be
displayed.
Friction F
Friction F Density Adjustment
Shock Loss Factors

Ventsim Visual User Manual Page | 134
Figure 8-8 Edit Box Fan Information
Sets fans, fixed flows or fixed pressures within the airway. This setting provides
the motive force which moves air around a flow network. Without at least one
airway within a network containing a fan or a fix, there will be no airflow within a
network (unless natural ventilation pressures are present)
Selects a fan for the airway. The upper pull down menu allows a fan to be
selected from the fan database. Fans are sorted alphabetically. Adjacent to the
fan name, is the number of fans to be included in the network, and below this is
the configuration of the fans (parallel or series). Fans installed in series will
increase available fan installation pressure according to the number of fans
available, while fans installed in parallel will increase available airflow.
Selecting the X will remove the fan from the airway. Selecting EDIT will jump
straight to the fan curve database edit screen.
Selecting the ? will recommend a fan if only a fixed flow has been simulated.
The program will examine the pressure and flow required to achieve the flow,
and then search the fans in the program database for a suitable match. The
program will consider up to 4 parallel fans as being a viable match, and display
them in descending match order. To swap the fixed flow for a recommended
fan, select the desired fan from the list.
Fan, Fix Settings
Fan Name, Number and Configuration

Ventsim Visual User Manual Page | 135
Selects the type of fan curve to use in the network simulation. FTP is a Fan Total
Pressure curve while FSP is a Fan Static Pressure curve. This is normally
automatically controlled from the Simulation Settings for Fan Pressure Type
under the Simulation – Air menu, which defines whether a Static, Total or Mixed
pressure solution will be used.
If a Mixed Pressure solution setting is selected, individual airways can be set with
different fan curve types. If the Static or Total method is selected in the
Settings, Ventsim Visual™ will automatically use the corresponding fan curve,
and the user will be unable to change the curve from the Edit Box.
Hint: As discussed elsewhere in the manual, the Total pressure method is the technically correct way to simulate a network, while the Static pressure method produces more conservative pressure and airflows which are potentially more robust if shock losses and airway resistance are not correctly set. The Mixed method allows complete control over fan curves used and may be a choice if some types of fan curves are unavailable, or complete compatibility with Ventsim Classic 3.9 is required.
Forces the simulation to produce an airflow equivalent to the entered value in
the box. A fixed flow cannot be set when a fan is present, and a fan will be
removed if the fixed flow is checked. To remove the influence of the fixed flow,
simply uncheck the fix check box. When a fixed flow is simulated, the program
will calculate a required pressure and power to produce the fixed flow. Where
the fixed flow is less than what would normally be simulated, the fixed flow acts
as a ‘resistance’ or negative pressure influence, and restrict flow. In both cases,
the results of fixing a flow will be displayed in the INFO box.
Restrict is similar to a fixed flow in that a certain air flow rate is targeted during
simulation. The main difference however is the ‘restrict’ is designed to resist
flow and provide an equivalent resistance. If the restrict value is greater than
what would normally be required to restrict airflow (ie it boosts the airflow) a
warning will be displayed during the network simulation.
Forces the airway to produce a constant positive pressure equivalent to the
entered value in the box. This pressure will be in addition to any losses from
friction within an airway. A fixed pressure cannot be set when a fan is present,
and a fan will be removed if the fixed pressure is checked. To remove the
influence of the fixed pressure, simply uncheck the fix check box. When a fixed
pressure is simulated, the program will calculate the required airflow and power
to produce the fixed pressure. The results of fixing a pressure will be displayed
in the INFO box.
Turns on the fan or fix during simulation enabling the item to influence airflow
within the network
Turns off the influence of the fan or fix during simulation. The airway and
network will behave as if the fan or fix is not present.
Reverses the fan blade direction during simulation. This item is useful for
emergency simulation where fans are available in the network to reverse airflow
at specific locations. The fan curve is adjusted by the reverse factors set in the
fan database, to reflect the poorer performance of fans with blades run in
Use FTP Use FSP
Fix Flow
Restrict
Fix Press
ON
OFF
REV
Ventsim Visual User Manual Page | 136
reverse. The reverse function is only available for fans, not fixed flows or
pressures.
Enters the fan database screen to view or adjust fan data. Note that any fan
changes will not be reflected in the EDIT box until after a simulation.
Closes the airway when a fan or fix is turned off.
Many actual fan installations have a mechanical device which shuts off airflow
when a fan is turned off or loses power. The self closing option allows the
simulation to reflect this. If this option is unchecked, airflow will be allowed to
flow freely back through the airway, just as if the fan is not present. Activating
this option will close the airway; preventing airflow when the fan is switched off.
Adjusts the fan blade rotation speed from the standard setting defined in the Fan
Database. Note that this is a theoretical pressure and flow adjustment which
may not exactly meet true fan performance at different speeds.
Hint: While the simulated speed adjustment to a standard fan curve should be reasonably accurate, if an exact fan pressure and flow curve is required for fan performance at different revolutions, it is suggested a separate manufacturer guaranteed fan curve be entered for the adjusted variation.
The fan duty point states the air density the fan is running in, as well as an exact
fan pressure and airflow volume the fan is simulated to operate at. Note that
either an individual fan duty can be selected, or if multiple fans are present at
the installation in parallel or series configuration, the entire combined installation
duty can be displayed. Due to density adjustments, the fan curve may actually
be different to the one defined in the Fan Database.
The fan pressure will be returned as a Static or Total pressure, depending on the
pressure method set in the Settings – Air Simulation section. The efficiency
returned reflects the efficiency curve entered with the fan. The efficiency curve
is the shaft efficiency of the fan. It does not include electric motor or drive
inefficiencies, which are considered separately in the Settings menu.
Hint : Fan operating density is an important specification for designing fan types and installations. Higher air densities will increase the available operating pressure curve (and power draw) for the fan, while lower air densities will have the reverse effect. This can be an important consideration when selecting or designing a fan for a particular area in a mine. Note that for Ventsim Visual™ Standard, air densities are assumed fixed at all locations in a mine.
If fans are forced by other network conditions to run beyond the limits of the fan
curve, a warning showing stalled, low pressure or negated will be shown during
network simulation.
Stalled fans occur when the fan pressure build-up is greater than the capacity of
the fan curve to accommodate. Ventsim Visual reduces the airflow quantity to a
point where the fan pressure is no more than the maximum pressure specified in
the fan curve.
Low Pressure fans occur when fan pressure falls below the lowest pressure point
of the fan curve, but are still operating above a zero pressure. This may occur
EDIT
Close
%RPM
8.3.1 Fan Duty Point
8.3.2 Fans Stalled,
Low Pressure or
Negated

Ventsim Visual User Manual Page | 137
when a fan is run with too little resistance or the fan is a high pressure type,
being used in a low pressure application. The fan pressure curve in this case will
not extend down to the point the fan is operating at. This is undesirable as the
program must make assumptions as to what duty point the fan is actually
running at. In addition the fan in unlikely to be running efficiently at this duty
point.
Negated fans occur when the fan offers no useful pressure to the system
ventilation pressures, and may even retard airflow that would otherwise flow
more freely without the fan. This may be a result of other network factors or
fans forcing air through the fan.
When Ventsim Visual encounters a low pressure or negated fan situation, it
applies a resistance for airflow through the fan above the highest curve quantity.
This mimics real life performance of fans and effectively restricts airflow moving
through a fan above its limit. The induced resistance results in an additional
pressure drop and in negated situations, the fan may apply a negative or
‘resisting’ pressure, effectively acting as a ‘brake’ for the airflow.
Any of these situations are not desirable, as fans are not designed to run beyond
their fan curves, and without a fan curve Ventsim Visual is forced to approximate
fan performance and power consumption. While stalled, low pressure and
negated warnings can be ignored, every effort should be made to reduce or
eliminate these occurrences within a network.
The fan pressure curve associated with the fan (or fans if combined is selected)
in the airway. Note that the fan curve may have been adjusted by the
simulation from the curve entered in the fan database, to reflect the change in
air density at the fan location. The fan operating duty point is shown at the
intersection of the horizontal and vertical lines.
The efficiency curve and the airflow volume intersection point define the
efficiency the fan is operating at. The efficiency value is used to calculate the
estimated fan shaft power. If fan shaft power is entered in the database directly,
a fan power curve will be shown and the program will derive shaft power from
this curve instead.
If a power curve has been entered for the fan, the power curve and the airflow
volume intersection point will define the shaft or absorbed fan blade power the
fan(s) are operating at. If the power curve has not been entered for the fan, the
efficiency curve will be used to calculate power. If this is not present, the default
efficiency in the settings menu will be used.
8.4 Heat Tab (Advanced Version)
The heat Tab Page controls most of the airway attributes associated with heat
and moisture simulation.
8.3.3 Fan Pressure
Curve
8.3.4 Fan Efficiency
Curve
8.3.5 Fan Power Curve
[ADVANCED]

Ventsim Visual User Manual Page | 138
Figure 8-9 The Edit Box Heat Entry Tab (Advanced Version Only)
Sets the heating, cooling and moisture inputs for the airway.
Figure 8-10 Heat Cooling and Moisture Settings
The Heat Assistant helps the user calculate or estimate heat and moisture
values to place within airways. The heat assistant calculator is described further
in the next Chapter.
8.4.1 Heat and
Cooling
Heat Assistant Calculator

Ventsim Visual User Manual Page | 139
The check box allows heat and cooling presets to be turned on or off, while
leaving the preset in the airway. If the box is unchecked, the preset will have no
effect on the network thermodynamics. Presets which are turned off will show in
the network as a grey colour. Note that custom heat values which are not
presets cannot be turned on or off, and must be removed if no thermodynamic
effect is desired.
Adds (+ve) or removes (-ve) sensible heat from the airflow. The number will be
coloured RED (+ve) or BLUE (-ve) according to the heating or cooling effect of
the value. Sensible heat is added or removed without changing moisture
content. If sensible heat is removed, and the air temperature dips below the
dew point, moisture will condense and will be removed from the air by the
simulation.
Adds (+ve) or removes (-ve) latent heat from the airflow. Latent heat is
sometimes describe as a ‘moisture’ heat and does not directly change the air
temperature, but rather increases (+ve) or reduces (-ve) water vapour from the
air. The Sigma Heat and Enthalpy increase with latent heat addition.
Removes sensible heat from the airflow. If heat is removed, and the air
temperature dips below the dew point, moisture will condense and be removed
from the air by the simulation. Refrigeration is essentially the same as placing a
negative Sensible Heat, and is included as a separate item to clarify its intended
function within the network analysis.
Adds a combination of sensible and latent heat to the air to simulate a diesel
heat source. The result is generally a warmer moister air flow after application.
The ratio of sensible and latent heat added is controlled by the diesel to water
ratio set in the settings menu.
An optional value used for Diesel Particulate Matter simulation which defines the
total amount of diesel particulates emitted by an engine over a period of time for
each unit of engine power. This can be derived from manufacturer’s
specifications or by practical testing of exhaust emissions.
Note this value is likely to include all particulate matter including elemental
carbon, organic carbon and other trace matter. Atmospheric levels are normally
limited to elemental or total (elemental + organic) carbon levels, therefore either
emission rates or final simulated results will need to be scaled accordingly.
The amount of heat per linear length generated by oxidising material in airway walls. While oxidisation is not a significant factor in most mines, exceptionally
reactive sulphide or carbonaceous material may have a significant effect where
airflows are low or airway drives travel an exceptional length through highly
oxidisation material.
Adds sensible heat per unit length of the airway. The value is intended to define
heat sources which emit heat over a long length (such as conveyor belts).
Setting a single equivalent point sensible heat to each airway will produce the
same heat result.
Adds (or removes) moisture in an airflow. Moisture addition has a neutral effect
on airway heat content, and is therefore added without changing the Sigma Heat
content of the airway. The effect of adding moisture is therefore an ‘evaporative’
effect which reduces dry bulb temperature. Removing moisture will produce the
opposite effect. Example of adding moisture to the air may include an
Preset On or Off (check box)
Heat Sensible
Heat Latent
Refrigeration
Diesel Engine
Diesel Emission
Oxidisation
Linear Heat
Moisture Point

Ventsim Visual User Manual Page | 140
evaporative cooling chamber or a dust suppression scrubber. Directly removing
moisture from air (without cooling) although technically possible, is not a
common mine process, and this option in Ventsim Visual™ would only normally
be used to ‘condition’ air to a certain temperatures and humidity for simulation
purposes.
Adds (or removes) moisture per unit length of airway. Similar to the moisture
point addition, this less commonly used function may be of value is simulating a
long length of airway water addition, such as decline dust suppression sprays.
Hint : How much moisture as being added to your airways from sprays? To practically assess the amount, take a wet and dry bulb temperature above and below the sprays, and use the Ventsim Visual™ Heat and Moisture Calculator to estimate the change in moisture content.
Allows the use to fix the wet and / or dry bulb temperature of the outlet air from
the airway. This forces the heat simulation to adjust the air temperature from
any previous simulated heat temperature upstream, to the fixed values. The
corresponding heat and moisture values required for the transition will be
calculated and reported after simulation. This function may have several useful
functions
To adjust air temperature to a known value at a certain location, without having
to modify simulated results above this location
To predict the heat or cooling required to condition the airflow to the fixed
temperatures.
Hint : Fixing the air temperature requires an adjusted to both sensible and latent heat content of the air. Entering the wet and dry fixed values as the same temperature forces the simulation to assume a pure ‘refrigerative’ condition which is converted to sensible heat and condensation, instead of the normal sensible and latent heat calculation. This is useful for determining refrigerative loads required for producing particular airway conditions. Note that there still may be some residual latent heat reported for the airway due to strata heat and moisture transfer.
Sets specific rock conditions for the airway. Airways will normally source these
values from the default values in the Settings menu, however they can be
individually overridden for each airway. Using these functions, it is possible to
set parts of the mine with different rock parameters types or wetness fractions.
Moisture Linear
Fix Temp WB, DB
8.4.2 Rock Conditions

Ventsim Visual User Manual Page | 141
Figure 8-11 Rock Condition entry for airways
Specifies a rock type that has been pre-defined in the Preset menu (click on
Rock Type) to enter the menu. Selecting a preset value overwrites any manually
defined rock parameters.
The thermal conductivity of rock surrounding the airway.
The thermal diffusivity of rock surrounding the airway. This value is optional
and can be derived by entering the rock density instead.
The specific heat value of rock surrounding the airway.
The density of rock surrounding the airway. This value is optional and can be
derived by entering the thermal diffusivity instead.
The fraction of the airway surface which is wet. A value of 0.01 would describe
a nearly dry surface, while 1.0 would describe a fully wet surface.
The age in years since the start of the airway was mined (in decimal years, for
example 4.5), or the calendar year of mining (in decimal format, for example
2005.5)
The age in years since the end of the airway was mined (in decimal years, for
example 4.5), or the calendar year of mining (in decimal format, for example
2005.5)
Airway ages can be a mixture of calendar years and age in years. Ventsim Visual™ determines which age type has been entered by the number of digits in the date field. Four (4) digits indicate a calendar year age. Where calendar year ages are entered, airway ages are calculated from the Current Calendar Year age set in the Settings Menu.
Rock Type
Thermal Conductivity
Thermal Diffusivity
Specific Heat
Rock Density
Wetness Fraction
Age or Year Entry
Age or Year Exit

Ventsim Visual User Manual Page | 142
Manually sets the Virgin Rock Temperature at the start and end of an airway. This function is unlikely to be used often. It forces the heat simulation to use
preset rock temperature values, instead of calculating the rock temperature from
the geothermal gradient. This function may be of assistance if the rock does not
conform to the geothermal gradient parameters (for example mining through
backfill) or the rock temperature is being modified by other factors such as local
geothermal sources or reactions.
Note that the values normally reported in these cells are calculated from the
simulation and will change with depth and time. To FIX the values to permanent
temperatures, simply overwrite the pre-existing calculated values.
Reset the rock conditions to those specified in the Settings menu. If any value is
entered in the above categories, the item will be ‘hard coded’ and will not change
even if the default settings are changed. To reset all items, press this button.
To reset an individual item, simply enter zero (0) in the field.
Displays the results of heat simulation at the entry and exit of the airway. The
data displayed is ‘Read Only’ and is for information purposes only. Most of the
values displayed are self-explanatory. More detailed airway information is
available under the Information Tab.
Figure 8-12 Heat Simulation Information
The calculated elevation of the start (left) and end (right) nodes of the airway.
The calculated wet bulb temperature at either end of the airway.
The calculated dry bulb temperature at either end of the airway.
The calculated relative humidity and the moisture content of the air.
The calculated virgin rock temperature at either end of the airway. This value is
calculated from the geothermal gradient, the elevation of the airway and surface
rock temperature settings.
The total sensible (dry) heat addition to the airway, from rock strata and any
user sensible heat inputs into the airway
The total latent (wet) heat addition to the airway, from rock strata and any user
latent heat inputs into the airway.
VRTemp Entry / Exit
RESET ROCK
8.4.3 Heat Simulation
Results
Elevation
Wet Bulb
Dry Bulb
RH Moisture
VRT
Sensible Heat Addition
Latent Heat Addition

Ventsim Visual User Manual Page | 143
8.5 Contaminant
The contaminant tab display several options and settings required for
contaminant simulation in a network.
Figure 8-13 Edit Box Contaminant Input
Places an initial average contamination value into the airway. The value can
either be unitless or represent a volume concentration value of a particular type.
It is proportional to the airflow in which it is entered, and could be considered as
a percentage, part per million (ppm) unit or any other unit which is
representative of a value per unit volume of air. Clicking on the check box
adjacent the value box, will automatically set or remove a value specified in the
Setting defaults.
Specifies dynamic contaminant simulation options which can be modified for the
airway.
Specifies a constant concentration release of contaminant into the airstream
for a specified number of seconds.
Specifies a reducing concentration release of contaminant into the airstream
for a specified number of seconds. The concentration initially starts at the
specified amount, and decreases at a linear rate over the specified number
of seconds.
Contaminant Concentration
8.5.1 Contaminant
Options
(Dynamic)
Fixed Release
Linear Decay

Ventsim Visual User Manual Page | 144
Specifies a logarithmically decreasing concentration release of contaminant
into the airstream for a specified number of seconds. This means the
concentration of contaminant will start at the initial concentration and rapidly
decrease over the initial time frame, with a longer lower concentration period
after that.
The default amount of explosive to place for dynamic contaminant
simulation. The higher the amount placed, the more initial contaminant that
must be dispersed into the network during simulation.
The inverse factor rate at which contaminant will be dispersed every air
regeneration. For example a number of two (2) represents the contaminant
halving for every regeneration of air. Higher values will simulate more rapid
dispersion of contaminant from the initial contaminant source. It does not
affect dispersal rates once the contaminant has entered the main network
airstreams.
A read only value demonstrating the volume of initial explosive contamination
and the length of time the prevailing airflow will take to clear the volume.
Activates the Ventsim Visual™ contamination source simulation process. Results
are displayed on the screen if the simulation is successful.
See Contaminant Sourcing menu item for further information.
Provides options for setting contaminant reports and simulating possible location
sources of contaminants underground.
Places a smoke report in the airway.
Places a fresh report in the airway.
See Location Tool menu item for further information.
8.6 Information
The information tab provides a list of detailed information of settings and
simulated values for an airway. The list may be copied to the Windows clipboard
for pasting in another application such as Word or Excel. This can provide a
valuable tool for comparing changes in specific airways before and after
simulation.
Logarithmic Decay
Explosive Amount
Dispersion Rate
Regeneration Volume and Time
8.5.2 Contaminant
Source Button
8.5.3 Sourcing
Location Tools
Report Smoke
Report Fresh

Ventsim Visual User Manual Page | 145
Figure 8-14 Airway Information Tab
While most data values are self explanatory, some notes below provide further
explanation.
An airway with a fan, fixed flow or fixed pressure will display the specific
pressures, power and cost of the fan or fix for the airway installation. Unlike the
Fan Tab, the pressures and volumes displayed will be for the entire fan
installation (if more than one fan present), not for individual fans.
Fan Present
Fan pressures are derived directly from the pressure volume curve of the fan. If
the Fan Total Pressure (FTP) method is used, the duty point will be simulated
from the FTP fan curve, and static pressure will be derived from the fan diameter
or airway size. For the Static Pressure (FSP) method, the duty point is simulated
from the FSP fan curve and the total pressure derived for the fan or airway size.
Special consideration is required for surface exhaust fans. For an exhaust
surface fan, by definition, the Mine Total Pressure (loss of total pressure across
all mine resistances) at the collar (inlet) to the fan is equal to the required Fan
Static Pressure (FSP). The Fan Total Pressure includes the velocity pressure loss
8.6.1 Fan and Fixed
Information
Fan Pressure
Ventsim Visual User Manual Page | 146
of the fan to atmosphere. The value provided by the simulation (FTP) considers
evasé and discharge area size, but is theoretical, and does not include shock or
frictional losses between the fan collar and the fan discharge outlet. As a result,
for an actual fan installation, additional FTP beyond the simulated result may be
required to achieve the simulated results. As every fan and installation is
different, it is best to discuss this with your fan manufactures in pressure critical
installations.
The fan power is calculated on Fan Total Pressure (FTP) and represents the
power the fan motor is applying to the fan blades to generate the pressure and
flow through the fan. The fan shaft (absorbed) power is calculate from the fan
power curve. If a power curve has not been set for the fan, the fan total
efficiency curve is used in conjunction with fan total pressure and volume flow, to
calculate shaft power. If this is unavailable, the default fan efficiency is used.
Fan Electrical power is the estimated electrical power drawn by the fan motor. It
is calculated from the Fan shaft power factored up by the motor efficiency factor
set in the Settings menu.
The annual cost figure is derived from the power cost set in the Setting Menus
for a fan operating at this duty point continuously for a full year.
Fix Present
Fix flows or pressures are often entered where a specific fan is not available or
needs to be calculated. The fixed flow information in particular is useful for
identifying duty points for fan pressure at a specific volume. This point can then
be used to specify and source a suitable fan with a curve that can matches the
pressure and flow.
A fixed flow will show a required fan static and total pressure for an equivalent
fan in the airway. This is similar to a duty point for a fan. Fixed flows are
calculated as a Fan Static Pressure and a Fan Total Pressure and take into
account airway or fan discharge area size. For intake fan or underground
booster fans, only the Fix Total Pressure (FTP) should be considered in specifying
a fan.
For a Surface Exhaust Fan, the Fix Static Pressure is arguably the critical
pressure value, as the velocity portion of the Fix Total Pressure is lost to
atmosphere. As with fan, the Fix Static Pressure is equivalent to the Total
Pressure across the underground mine network, and the Fix Total Pressure
includes the discharge velocity pressure but EXCLUDES any shock or frictional
losses between collar and discharge. If an operating point for a surface exhaust
fan is being simulated and potential fan evasé size is not known at the time, it is
recommended that the FSP duty point value be used for specifying a duty.
For accurate and more detailed duty point analysis, the Total Pressure method
should be chosen in the Settings > Airflow simulation options, which forces the
program to consider all velocity pressure losses to the surface across a mine
network.
The power value will utilise the default efficiency set in the Settings Menu and
describe a minimum motor size (shaft power) for the required fixed flow, and
estimated power (electrical) consumption for the fixed flow.
Fan Power
Fan Cost
Fixed Duty Point
Required Power

Ventsim Visual User Manual Page | 147
The annual cost figure is derived from the power cost per kilowatt hour set in the
Setting Menus for a fixed flow or pressure operating at the duty point
continuously for a full year.
Describes various pressure conditions at either end of the airway.
The pressure at either end of the airway in relative to the equivalent surface
pressure at the same elevation. Negative values indicate the relative pressure is
lower than the surface pressure, while positive values indicate the opposite.
Relative pressure in different parts of the mine can help show which direction air
would flow if they joined. Air will always flow from higher relative pressures to
lower relative pressures if a path is available.
Note : As the relative pressure describes airway pressure at an equivalent elevation, if effectively ignores elevation and barometric effects of depths.
Describes the calculated barometric pressure at the start and end of an airway.
Barometric pressure increases with elevation depth, and is in addition to any
pressure influences on the network by fans or other pressure sources.
Barometric pressures and the resulting densities are an important factors in fan
performance and heat simulation.
Describes the frictional pressure losses along an airway, plus pressure additions
due to fans or other pressure sources. A negative value indicates frictional
pressure drops are larger that pressure additions to an airway. A positive value
indicates pressure additions from fans or fixes have more than overcome
frictional losses and contribute to system pressure increases elsewhere in the
network.
Heat data shows various air conditions derived from heat simulation.
Figure 8-15 Heat Data
Wet bulb and dry bulb temperatures at the start and end of the airway
The Sigma Heat content of the air at the start and end of the airway. This value
describes the heat content of air per unit weight, and is therefore independent of
air or mass flow rates.
The amount of sensible and latent heat added to the airflow per unit length. The
heat may be sourced from rock strata, auto compression or a heat or
refrigeration input value.
Annual Fix Cost
8.6.2 Pressure
Information
Relative Pressures
Barometric Pressures
Pressure Loss
8.6.3 Heat Data
Temperatures
Sigma Heat
Heat Addition / l
Heat additions total

Ventsim Visual User Manual Page | 148
The total amount of sensible and latent heat added for the full airway length.
The amount of heat added by the user in the form of sensible, latent or diesel
heat input.
The amount of sigma heat present in airflow, multiplied by the mass flow of the
air through the airway. The difference in these values should be equivalent to
the total heat addition to the airway.
The moisture content of the air relative to the total saturation potential of the air
at the current temperature and pressure conditions.
The volume flow of moisture condensation from airflow due to environmental
conditions changes which result in air temperatures or pressures falling below
the saturation point of air. This normally results from a refrigeration source
chilling air below the dew point temperature, or a reduction in barometric
pressure (from air travelling up a shaft for example) reducing air moisture
carrying capacity.
8.7 Notes
The Notes Tab allows detailed information to be recorded for any airway.
Figure 8-16 Recording sheet for entering general airway information
Notes may include specific network setup information, or may consist of
ventilation survey results of airflow, temperatures or gas levels for actual
underground ventilation conditions. Such information could be used to help
validate simulated networks, or could provide a useful ventilation recording tool
to demonstrate ventilation conditions underground over a period of time, or
provide a Statutory record of ventilation information.
Manual addition
Contained energy
Relative Humidity
Condensate
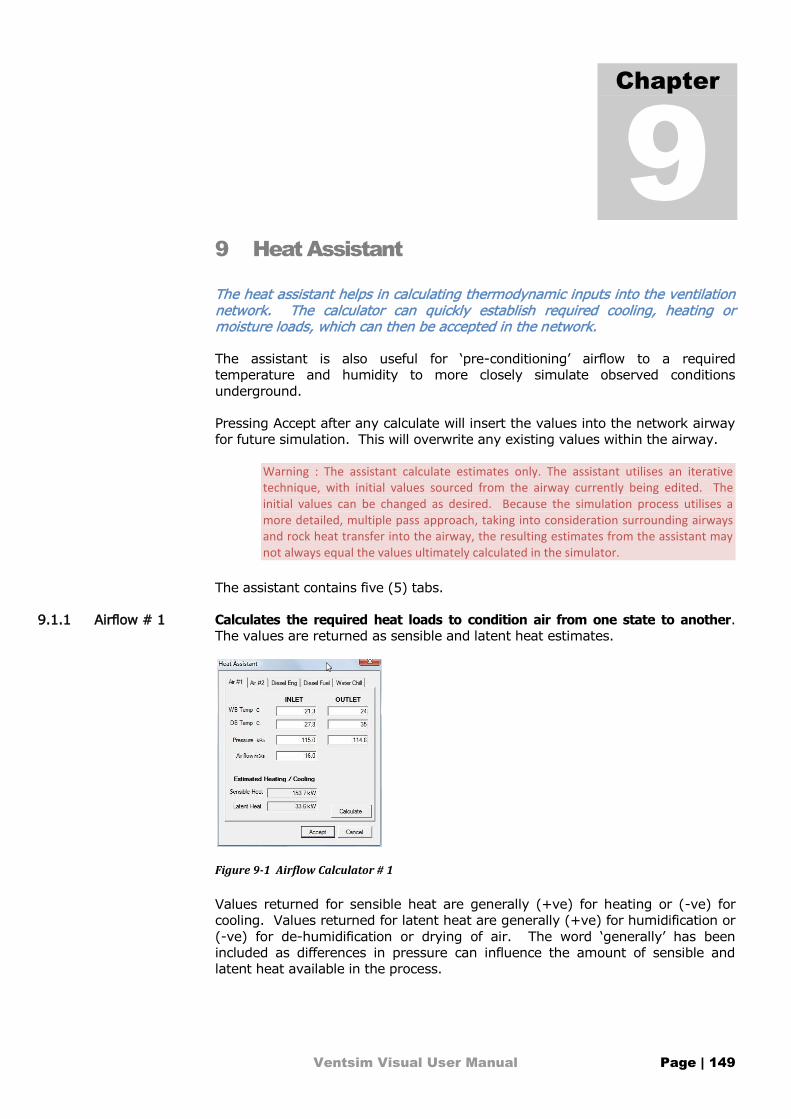
Ventsim Visual User Manual Page | 149
9 Heat Assistant
The heat assistant helps in calculating thermodynamic inputs into the ventilation network. The calculator can quickly establish required cooling, heating or moisture loads, which can then be accepted in the network.
The assistant is also useful for ‘pre-conditioning’ airflow to a required
temperature and humidity to more closely simulate observed conditions
underground.
Pressing Accept after any calculate will insert the values into the network airway
for future simulation. This will overwrite any existing values within the airway.
Warning : The assistant calculate estimates only. The assistant utilises an iterative technique, with initial values sourced from the airway currently being edited. The initial values can be changed as desired. Because the simulation process utilises a more detailed, multiple pass approach, taking into consideration surrounding airways and rock heat transfer into the airway, the resulting estimates from the assistant may not always equal the values ultimately calculated in the simulator.
The assistant contains five (5) tabs.
Calculates the required heat loads to condition air from one state to another.
The values are returned as sensible and latent heat estimates.
Figure 9-1 Airflow Calculator # 1
Values returned for sensible heat are generally (+ve) for heating or (-ve) for
cooling. Values returned for latent heat are generally (+ve) for humidification or
(-ve) for de-humidification or drying of air. The word ‘generally’ has been
included as differences in pressure can influence the amount of sensible and
latent heat available in the process.
Chapter
9
9.1.1 Airflow # 1

Ventsim Visual User Manual Page | 150
Figure 9-2 Airflow Calculator # 2
Similar to the Airflow #1 calculator, this calculates the required heat loads to
condition air from one state to another, but instead returns values as sensible
and moisture flow estimates. This may be useful for calculating moisture being
evaporated from underground processes such as decline dust suppression
sprays, or evaporative cooling chambers.
Diesel engine heat loads can be more accurately calculated by considering the
environment and utilisation of the diesel engine within the network. The diesel
engine calculator assists with this. The output of the calculator is return as an
averaged diesel engine output. The corresponding sensible and latent heats are
also provided as a reference, however are not transferred to the network as
Ventsim Visual™ automatically calculates these values in the network from the
diesel power value.
Figure 9-3 Diesel Heat Estimator
The percentage of diesel calorific energy converted into mechanical energy. This
diesel efficiency is an estimated value for a typical diesel engine and generally
should not be changed unless specifically known for a type of engine or particular
9.1.2 Airflow # 2
9.1.3 Diesel Engine
Diesel Efficiency

Ventsim Visual User Manual Page | 151
type of fuel. The value dictates the amount of heat placed in a network per unit
of engine power used.
For example a 200kW rated diesel engine, will consume nearly 600kW in diesel fuel energy, initially rejecting 400kW of waste heat through engine friction and exhaust. In most cases, the remaining 200kW of mechanical power will also be converted to heat through further friction losses, except where the mechanical power may be partially passed to other energy absorbing processes (such as water or transfer of rock uphill). If required, this can be accounted for under the potential energy conversion item.
Diesel engines underground rarely operate at full power 100% of the time. It is
important to consider the actual weighted percentage of time engines are
operated at full power to gain the true heat input into the mine network.
For example, a load haul dump unit (LHD) operates continuously, but uses only full power (100%) while loading buckets and hauling up a ramp for 15 minutes per hour, operates at 50% maximum power tramming horizontally or downhill for 30 minutes per hour, and idles at 10% maximum power for the remaining 15 minutes per hour
=52.5% peak utilisation
In some processes, diesel mechanical engine power can be converted into other
useful energies. For example a truck hauling rock up a decline will impart a
portion of its mechanical energy into the potential energy difference of the
change in elevation of the hauled rock. This can be calculated as a percentage of
the mechanical output of the diesel engine, and will reduce the amount of heat
input into the network. In most cases, this will only be a small fraction of the
diesel engine power, and in many cases can be ignored.
The diesel fuel calculator provides an alternative way to calculate engine power
within a ventilation network, overcoming the need to estimate engine utilisation.
It calculates diesel engine power by using the calorific heat value of fuel, and
back calculating engine power using 35% diesel efficiency.
Figure 9-4 Diesel Fuel Consumption Assistant
Peak Utilization
Potential Energy Converson
9.1.4 Diesel Fuel

Ventsim Visual User Manual Page | 152
By entering the average fuel usage of a diesel engine, Ventsim Visual™ can
calculate the equivalent average engine output for use in the network. If this
value is derived from actual engine diesel fuel usage of a particular unit in
operation (many modern machines automatically record average fuel flow), this
therefore already includes time the machine is not operating at full capacity.
As with the previous tab, a portion of the diesel engine power can be included as
potential energy to another process. This reduces the effective diesel heat input
into the network.
Similar to the diesel engine calculator, this allows the user to estimate the heat
emitting from an electric motor, based on its duty cycle and conversion of work
into useful energy.
Figure 9-5 Electric motor heat estimation
The water flow calculator estimates the amount of heat imparted into a network
from water flow source.
Figure 9-6 Heat Assistant Screen
9.1.5 Electric
9.1.6 Water Flow

Ventsim Visual User Manual Page | 153
The Water Chill tab may be useful for estimating;
How much cooling power a cooling tower or spray chamber is producing from a
refrigeration water source.. Ventsim Visual™ will calculate how much cooling is
being generated from the flow and temperature change of the water into the
airflow.
How much heat a geothermal water source may be putting into a network. To
calculate the heat input, simply input the average water temperature entering
the mine (from a rock fissures for example), and enter the average water
temperature and flow exiting the mine (at a pump station discharge for
example). Ventsim Visual™ will calculate how much heat is being lost from the
water and ultimately enters the airflow.

Ventsim Visual User Manual Page | 154
10 Popup Context Menu
The popup menu, activated at any time by a Right Mouse Click, provides a useful collection of commonly used function. While most of the functions are also available from the toolbar or top menu, the popup feature can save considerable time as the mouse cursor is not required to return to the top of the page when a new function is selected.
Scale view window, so all network graphics fit on the
screen.
Figure 10-1 Save Views
Saves the current view for recall at a later date.
Deletes the current view from the menu list
Pre-saved views which will orientate the screen in the
selected direction
Increases the distance away from the point of focus by a
factor of two.
Animates flows arrows around an airway network. Flows
can remain animated while other functions are
performed.
Animate flows in true real time. Arrows travel at the same scale speed as
calculated air velocity.
Chapter
10
10.1.1 Fit All
10.1.2 Saved Views
Save
Delete
Plan, Iso, SectionEW, SectionNS
10.1.3 Zoom Out
10.1.4 Animate
X1
X5
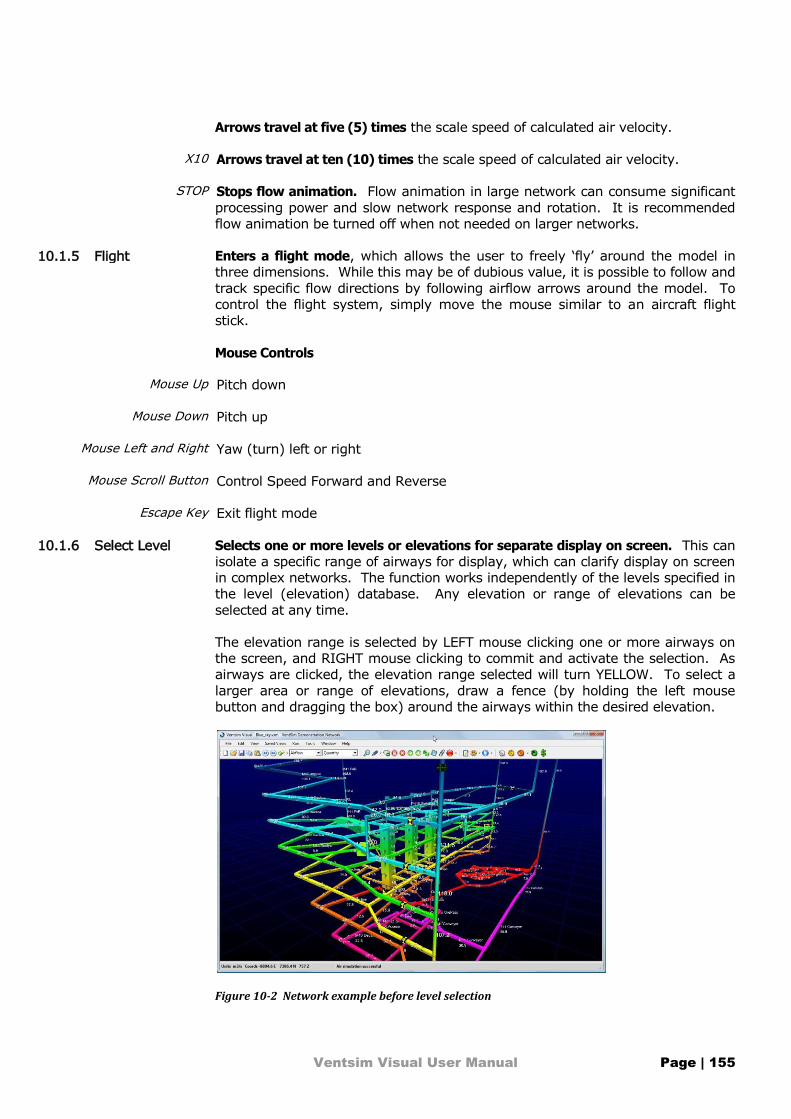
Ventsim Visual User Manual Page | 155
Arrows travel at five (5) times the scale speed of calculated air velocity.
Arrows travel at ten (10) times the scale speed of calculated air velocity.
Stops flow animation. Flow animation in large network can consume significant
processing power and slow network response and rotation. It is recommended
flow animation be turned off when not needed on larger networks.
Enters a flight mode, which allows the user to freely ‘fly’ around the model in
three dimensions. While this may be of dubious value, it is possible to follow and
track specific flow directions by following airflow arrows around the model. To
control the flight system, simply move the mouse similar to an aircraft flight
stick.
Mouse Controls
Pitch down
Pitch up
Yaw (turn) left or right
Control Speed Forward and Reverse
Exit flight mode
Selects one or more levels or elevations for separate display on screen. This can
isolate a specific range of airways for display, which can clarify display on screen
in complex networks. The function works independently of the levels specified in
the level (elevation) database. Any elevation or range of elevations can be
selected at any time.
The elevation range is selected by LEFT mouse clicking one or more airways on
the screen, and RIGHT mouse clicking to commit and activate the selection. As
airways are clicked, the elevation range selected will turn YELLOW. To select a
larger area or range of elevations, draw a fence (by holding the left mouse
button and dragging the box) around the airways within the desired elevation.
Figure 10-2 Network example before level selection
X10
STOP
10.1.5 Flight
Mouse Up
Mouse Down
Mouse Left and Right
Mouse Scroll Button
Escape Key
10.1.6 Select Level

Ventsim Visual User Manual Page | 156
Figure 10-3 Network example after level selection
Hint : Ventsim Visual™ initially defaults to displaying a 10 metre window range around the selected levels. Airways outside of this range will not be displayed, or will be made transparent. The range can be changed from the Settings menu.
Display all elevation ranges. This function will reset any levels selected from the
previous function.
Enter the view mode. See toolbar view for more information.
Enter the selection mode. Airways selected can be deleted, edited, moved or
copied. See toolbar selection for more information.
Enter the airway construction mode. Airways can be drawn by dragging the
mouse or edited by clicking the mouse. See toolbar add for more information.
Enter the airway edit mode. Airways clicked or fenced can be edited in the Edit
box. See toolbar edit for more information.
Enter the airway block mode. Airways clicked can be blocked or unblocked to
prevent or allow airflow. See toolbar block for more information.
Enter the airway delete mode. Airway clicked, or fence selected and clicked are
deleted from the network. See toolbar delete for more information.
Enter the airway move mode. Airways clicked can be moved via coordinates.
Airways dragged can be moved with the mouse. See toolbar move for more
information.
Enter the airway copy mode. Airways clicked can be copied via coordinate entry.
Airways dragged can be copied with the mouse. See toolbar copy for more
information.
Enter the copy attributes mode, which copies selected attributes from one airway
in preparation for pasting the attributes on another airway.
10.1.7 Show All
10.1.8 View
10.1.9 Select
10.1.10 Add
10.1.11 Edit
10.1.12 Block
10.1.13 Delete
10.1.14 Move
10.1.15 Copy Airway
10.1.16 Copy Attributes

Ventsim Visual User Manual Page | 157
Enter the paste attributes mode, which pastes copied attributes onto one or
more airways. Click or fence the desired airways to apply the attributes. Further
information is available at Menu-Edit-Copy Paste Attributes.
Enter the reverse airway mode. Airways clicked are reversed along with any
fixed flows, pressures or fans. See toolbar reverse for further information.
Select solid or wireframe graphics. Wireframe graphics may be more suitable for
cluttered display, or where solid graphics tend to become too small or narrow
with distance. Wireframe airways are always shown with the same intensity,
regardless of distance from the viewer.
Display the coordinate grid. Grids coordinates and spacing can be adjusted in
the Settings menu.
Selects text data to display
Display airway junctions as spheres. Nodes display where airways are joined
and can assist with construction and editing of airways.
Displays icons on airways associated with specific airway attributes such as fans,
resistances, fixed flows and pressures. Airways with multiple attributes are
displayed with icons side by side.
Displays the model with or without perspective. Ventsim Visual™ is optimised to
work with perspective driven display, however there may be specific occasions
where perspective is not desirable.
Displays airflow directions arrows. The arrow can be animated to show airflow
speed. See toolbar – animation for further information.
Displays referenced graphics that have been imported via a DXF file. This
function turns all referenced graphics on or off. To individually turn the graphics
on or off, use the Reference Manager under the File menu.
Connects the Windows operating system to the graphics hardware device. The
software link may occasionally become disconnected or corrupted, resulting in a
blank display. Reconnect the DirectX interface will reset the graphics software to
hardware link and re-establish the display.
10.1.17 Paste Attributes
10.1.18 Reverse
10.1.19 Solids
10.1.20 Grid
10.1.21 Text
10.1.22 Node
10.1.23 Icons
10.1.24 Perspective
10.1.25 Arrows
10.1.26 References
10.1.27 Reconnect
DirectX

Ventsim Visual User Manual Page | 158
11 Building a Network
A ventilation network must have a number of key components to successfully run.
Simple Rules for Constructing a Network
All airways in a network must be connected at both ends to another airway, unless connected to the surface or ‘blanked’ off as a closed end.
A network must have a device(s) to produce pressure within the network and induce airflow. Pressure producing methods use in Ventsim Visual™ includes placing fans or a fixed airflow or pressure within an airway.
Any fixed flow in an airway must not restrict another fixed flow elsewhere in a network.
11.1 Overview
There are many different ways and combinations to build a computer ventilation
model. Ventsim Visual as the name suggests utilises a visual approach to
creating models, and the fundamental structure (shape) of models can be built
either by hand with the mouse, or imported from a CAD program.
While a ventilation model can be built schematically in Ventsim, it is highly
recommended building a true to scale 3D model if possible, to allow Ventsim to
automatically use parameters such as size, length and depth for simulation. For
compressible airflow models, this allows for automatic density adjustment and
natural ventilation pressure application, resulting in more accurate and realistic
results.
11.2 Type of Models
A ventilation network must have a framework of connected airways or branches.
For airflow to successfully travel along an airway, each airway must have a
connecting airway at the entry and exit. Airways with no connection at either
end will not carry airflow unless connected to the surface.
A ventilation network can be developed as either a closed or open network.
A closed network does not have any airways connecting to the surface. While
this would be unusual for a real mine, for diagnostic purposes it is possible to
build and simulate an entirely closed network, which continually circulates air
Chapter
11
11.2.1 Network Types
Closed Network

Ventsim Visual User Manual Page | 159
around the networked airways. To construct a closed network, simply connect
and loop all airways so that they form a continuous path and all airway ends are
connected to at least one other. Because a closed system is entirely self-
contained, pressures and energies placed within the network to distribute flows
are entirely consumed by the airways in the network. No ventilation energy is
lost to outside sources.
Figure 11-1 Example of a Closed Network
An open network has at least two airways which connect to the surface, at least
one of which is an intake airway, and another which is an exhaust airway. Most
(if not all) mines will be established as open networks. Airflow which exits an
exhaust airway, in no way influences the pressure (or temperature) of the
airflow which enters an intake airway. Airflow velocity pressures and energies
lost from an exhaust airway are assumed lost to the network system. To link
any airway to the surface, simply use the Connect to Surface function under the
Edit Form.
Figure 11-2 Example of an Open Network
Open Network

Ventsim Visual User Manual Page | 160
11.3 Initial Model Construction
Airways can be constructed in a number of ways.
Manually draw scaled airways using the toolbar functions
Manually draw schematic airways using the toolbar functions
Import airway data from a formatted spreadsheet using the TXT
import function
Import airway data from a DXF graphics file, exported from a CAD or
mine planning package.
Regardless of the method used, in summary the recommended steps for
constructing a ventilation model are:
1. Construct the airways either manually using the DRAW function, or via
the IMPORT function, ensuring all airways join correctly to each other.
Tools are available in Ventsim to assist with this.
2. Use the EDIT button to edit the airways which connect to the surface,
and mark SURFACE option on the form.
3. Set the correct size and shape for all airways. Insert any ventilation
controls or regulators in the model, and specify airway characteristics
such as friction factors and shock losses.
4. Place a FAN or FIXED flow in an airway again using the EDIT button, and
selecting the FAN tab of this form. This will provide pressure to drive the
airflow through the model
5. Finally, press the SIMULATE button to show the result of the model
construction. If everything has been constructed correctly, the airflow
data and arrows should show the result of the simulation.
6. If some airways are dead ends, then simulation warnings can be
prevented by setting the “CLOSED END” option in the airway EDIT form.
7. If any error or warnings show, then correct the mistakes individually or
grouped as required.
To manually construct airways, simply use the construction tools (the draw,
move, copy and delete buttons) from the toolbar.
Airways can be drawn freehand on the screen with the mouse, using the
coordinates displayed in the status bar to guide the airway location. Additionally,
coordinates for airways can be entered manually using the coordinate entry
function or by simply clicking on an airway end while in the draw mode.
This method is generally suitable for small networks (less than several hundred
airway segments). Most airway networks are generally fairly tolerant of
misaligned or slightly misplaced airways, providing approximate airway lengths
are close to reality. In many cases, to assist with clarity, airways can be
11.3.1 Manual Scaled
Construction

Ventsim Visual User Manual Page | 161
deliberately moved aside, and a fixed length function used to correct airway
length to actual lengths.
If the model is required to be true to scale, then more accurate construction may
be required, and it is often better to import actual mine designs from CAD
programs into Ventsim to use as a template to constructing a true to scale
model.
In some cases, a network schematic can be constructed to simulate a network.
A network schematic may look nothing like a real mine, but simply represent
airways by a series of conveniently located two dimensional lines. Correct
airway lengths can be entered by fixing the length under the Edit From.
Warning: Schematic Networks, although convenient in simplifying mine airway networks, have major restrictions which can affect their functionality in Ventsim Visual. Ventsim Visual™ uses true airway locations to calculate changes in air density and heat properties of rock and airflow, and as such, schematic networks are largely unsuitable for Ventsim Visual™ Advanced networks which simulate deep mines with compressibility effects or for heat simulation.
Where a list of airway coordinates and sizes may be available (from a database
or another ventilation program for example), these can be directly imported into
Ventsim Visual™ using the File Open Text Function. Data to be imported must
meet a specific TAB delimited data format. This format can be loaded and saved
by most office application software such as Microsoft Excel or Word. This format
can be viewed by saving any existing network file as a TXT file format under the
save menu.
For large networks, that need to be built to scale from existing mine workings or
designs, the best method is to import line string data (AutoCAD Drawing
Exchange Format, DWG, Datamine or Surpac), and allow Ventsim Visual™ to
construct a network from the imported data lines. The import function can be
activated from the File Import menu.
STEP 1 – Create and Import a DXF file into Ventsim Visual
This method relies on passing line or string graphics data from a CAD or Mine
Planning package to Ventsim Visual. The data may simply be the centre lines of
surveyed mine floors or mine designs. To allow Ventsim Visual™ to efficiently
use this data without excessive post import editing, the following criteria should
be considered.
Only import the minimum data required. Excessive detail or headings
which do not form part of the ventilation network should not be imported
if possible. In many cases, is may be quicker and more accurate to
construct a skeleton ventilation network consisting of interconnected lines
within the Mine Planning or CAD package, before import into Ventsim
Visual. The skeleton lines should simply trace over existing mine
workings or designs.
Try to ensure the lines join into each other, so Ventsim Visual™ knows
they are junctions through which air can flow. Lines that simply cross
each other without a junction, or which terminate close to each other but
not join, will not carry airflow, and may result in a no exit/entry error in
Ventsim which will need to be corrected in Ventsim.
11.3.2 Manual
Schematic
Construction
11.3.3 Spreadsheet
Text Import
11.3.4 DXF Graphics
Import
Import DXF Graphics Line Data
Ventsim Visual User Manual Page | 162
When importing data, the lines can be converted to airways during the import
process (by selected the option “Convert to airways’), or selectively after
importing using the DRAW > CONVERT button to click or fence which lines are to
be converted. The second option has the advantage of overlaying the updated
DXF files with new development over the existing Ventsim airways, and
selectively choosing where to update the Ventsim model.
Hint : To efficiently add DXF data to Ventsim Visual, keep a ‘layer’, ‘object’ or ‘file’ within your Mine Planning or CAD package dedicated to Ventsim Visual™ data, As new airways or designs become available, simply export the additions as separate DXF files, and import them into Ventsim Visual™ to add to the existing network.
Warning : Three dimensional solids (such as survey mine solids) will import into Ventsim Visual, but cannot directly be converted to airway. They can however be used as a guide to manually draw and construct new airways in the network
A number of options exist when imported a DXF file into Ventsim Visual
STEP 2 – Modifying and Validating Import Data
Once imported into Ventsim Visual, the program will assign default airways sizes
and shapes to all the imported airways. Ensure you have default sizes and
shapes set in the Settings menu that will approximate the typical sizes that are
imported. This will prevent having to re-edit of ALL of the airway sizes and
shapes (although this can still be quickly done using the group edit command)
Unlike line string data, solid or wireframe graphics cannot be directly
converted to airways. The data can still however be used to help construct
airways, by either using the referenced (imported) graphics as guides to
manually draw airways, or by using a special function in Ventsim to group
the data and construct an airway of best fit through the data.
OPTION 1 – Turn on Edit > Lock on References menu option and select the DRAW
button.
Simply use the mouse to DRAW airways over the top of the imported graphics.
The airways will ‘connect’ to the same position as the reference graphics
(providing the Edit > Reference Lock is enabled), allowing the ventilation model
to be drawn in true 3D coordinates.
OPTION 2 – Convert ANY (references to airways). Use the Draw Sub-Option > Convert Any.
This option converts groups of referenced graphics to an expected airway path,
and may be of use to attempt to convert large amounts of wireframe or multiple
string (for example floor outlines) to an expected airway. It is likely that
significant editing may be required after using this function to adjust airway
locations and correct errors. For further information on this method see Convert
Any option.
To quickly sort and validate (check) the imported airways, click on airflow
simulation. While the network is unlikely to correctly simulate at this stage, this
function will check the airways for duplicates and unconnected airway ends,
which will speed up the process of establishing a working network.
Import DXF Graphics Solid or Wireframe
Data
11.3.5 Correcting Errors

Ventsim Visual User Manual Page | 163
In most cases, errors will result from airways not exactly joined into other
airways, or remaining unconnected as dead ends, resulting in no exit or entry
errors. If many of these can be corrected before starting an airflow simulation,
this will improve the ease of creating a working model.
To help tidy up models and correct initial errors, a number of tools are provided
in the TOOLS > FILTER menu, to bind disconnected airways, and find duplicated
airways.
Alternatively, for airways which are disconnected use the toolbar move function
to move the airway end onto the other junctions ends. If this is done correctly,
moving the node after joining will then result in all airway ends moving
simultaneously.
Under Tools > Utilities > FILTERING TOOLS
BINDING : Bind Nodes (use a value up to 4-5m or more to bind ends that are
close to each other). Bind Junctions (Binds loose nodes that are close to a
passing airway which has no corresponding node or junction). Bind Intercepts
(find and/or join airways that cross each other, but have no joining nodes)
SIMPLIFY (removes a lot of the small airways and unnecessary detail). In many
cases, importing a DXF files directly from a mine planning will create an overly
detailed network file, which will slow down the system graphics and simulation,
resulting in a more unwieldy network.
For example, a nice smoothly rounded decline airway which produces many
airway segments is simply not required for accurate ventilation simulation and in
most case can be designed with less segments and detail. The Simplify function
in Ventsim Visual, will sort through a network, identifying unnecessary detail,
which can be removed without adversely affecting simulation.
Figure 11-3 Example show the effect of the Simplify Function to reduce airway data
Alternatively, airways can be manually simplified by using the toolbar delete
function to remove node junctions between airways.
DUPLICATES (find and/or remove any duplicated or overlapping airways)
A critical part of developing new models is ensuring air can move through new
airways. Place a Fan or a Fixed flow in the model to SIMULATE and start air
moving through the network. This does not need to be accurate at this stage –
Filtering Tools
11.3.6 Ventilation
Pathways
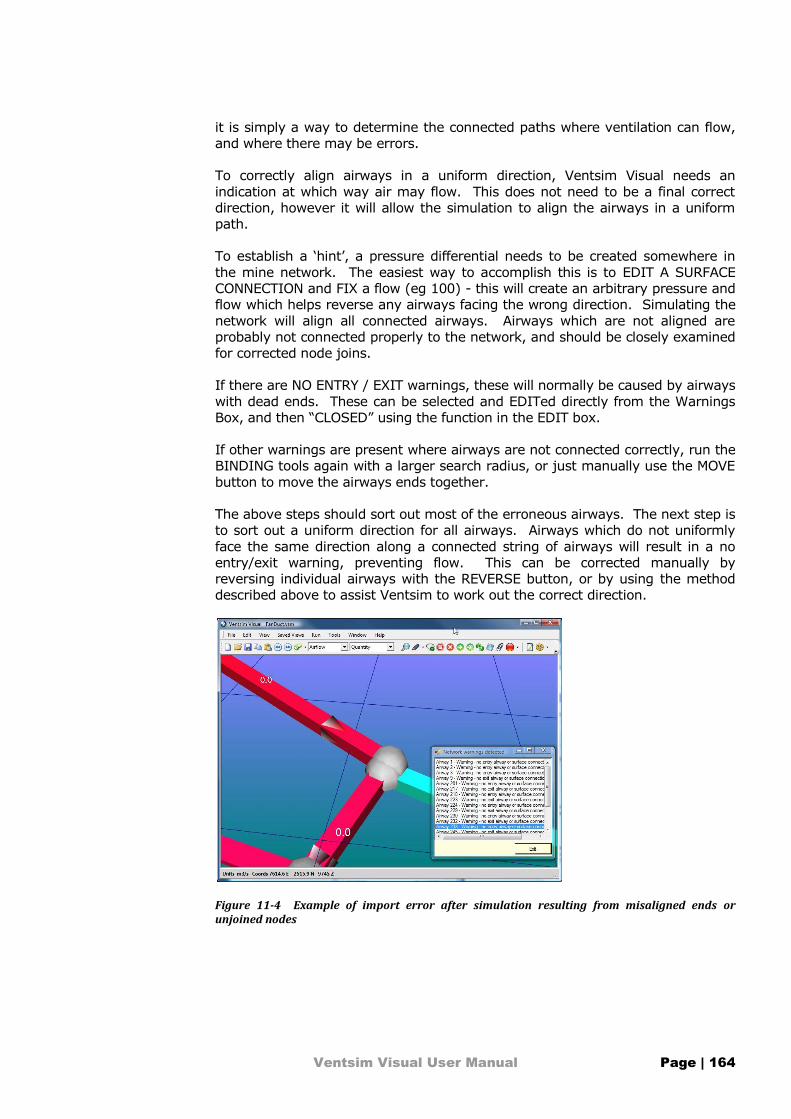
Ventsim Visual User Manual Page | 164
it is simply a way to determine the connected paths where ventilation can flow,
and where there may be errors.
To correctly align airways in a uniform direction, Ventsim Visual needs an
indication at which way air may flow. This does not need to be a final correct
direction, however it will allow the simulation to align the airways in a uniform
path.
To establish a ‘hint’, a pressure differential needs to be created somewhere in
the mine network. The easiest way to accomplish this is to EDIT A SURFACE
CONNECTION and FIX a flow (eg 100) - this will create an arbitrary pressure and
flow which helps reverse any airways facing the wrong direction. Simulating the
network will align all connected airways. Airways which are not aligned are
probably not connected properly to the network, and should be closely examined
for corrected node joins.
If there are NO ENTRY / EXIT warnings, these will normally be caused by airways
with dead ends. These can be selected and EDITed directly from the Warnings
Box, and then “CLOSED” using the function in the EDIT box.
If other warnings are present where airways are not connected correctly, run the
BINDING tools again with a larger search radius, or just manually use the MOVE
button to move the airways ends together.
The above steps should sort out most of the erroneous airways. The next step is
to sort out a uniform direction for all airways. Airways which do not uniformly
face the same direction along a connected string of airways will result in a no
entry/exit warning, preventing flow. This can be corrected manually by
reversing individual airways with the REVERSE button, or by using the method
described above to assist Ventsim to work out the correct direction.
Figure 11-4 Example of import error after simulation resulting from misaligned ends or unjoined nodes

Ventsim Visual User Manual Page | 165
In most mines, a number of blind or ‘dead end’ headings will exist. By network
definition, a blind heading cannot carry airflow, as it does not have a continuous
path of airways leading to and from each end. In many real cases however,
these headings are effectively ventilated by duct, and often need to be simulated
within a network, if only for the fact that development fans blowing into
ventilation duct are moving air from one part of the mine to another, or that the
geothermal heat and moisture generate by these headings needs to be included
in the mine heat balance.
To satisfy a network requirement for a continuous air pathway, ventilation duct
needs to be included as a separate airway. For clarification, this airway is best
placed outside of the mined airway, and sized according to true ventilation duct
size. The ventilation duct airway will carry air to the blind heading face. The
blind heading airways will carry airflow back to a network junction, and then join
any other airflow beyond the blind heading.
The DUCT construction tool (in the drop down option box next to the DRAW
button) will automatically construct a duct airway parallel to a SELECTED series
of airways. Once constructed, a fan or fixed flow just needs to be added to one
section of the duct to simulate flows.
Hint : Make ventilation duct airways into another airway type under the Edit Form., and specify the air type as a ventilation duct. Airway type number #5 is yellow if colour, and can be renamed to a ventilation duct, to clearly show the colour differentiation when air type is selected from the Colour Manager. In addition, the vent duct airway could be placed on a separate layer, so the vent duct in the view could be turned off or on.
Figure 11-5 Example showing ventilation duct into blind heading. Note the two leakage paths included to ‘simulate’ vent duct leakage
In some mines, airways may connect to other parts of a mine which are not
simulated or included in the network. The airflow to or from these other parts
must be included into the local network. To include airflows to areas not
simulated or included in the current network, simply run a single airway off the
main network, assign a Connect to Surface attribute under the Edit Form., and
then enter a fixed flow to simulate airflow to or from the area. Ensure the
direction of the airway is correct.
11.3.7 Ventilation
Ducting and
Blind Headings
11.3.8 Interconnecting
Mine Airways

Ventsim Visual User Manual Page | 166
11.4 Create and Install Fans
To produce pressure within a network to motivate airflow, the following three
methods can be used.
Fans : Utilise and fan curve to establish accurate working flows and
pressures in a ventilation model.
Fixed Pressures : Uses a consistent positive pressure to induce an airflow
in a ventilation model. Airflow will vary based on resistance encountered
by the pressure.
Fixed Airflows : Uses a consistent airflow to induced flow through a
model. Pressure required will be adjusted to whatever is required to
produce the airflow.
Without at least one of the above methods to produce network pressures, airflow
will simply remain stagnant.
In Ventsim Visual™ Advanced, a fourth method uses natural ventilation pressures to also induce flow, although this is entirely derived from heat and density air changes throughout the mine. It is possible to build a ventilation network with airflow driven entirely by geothermal heat or evaporative cooling, however the simulation results can sometimes be unreliable due to changing airflow and pressures continuously affecting natural ventilation pressures.
To construct a fan database from an existing fan manufactures curve, follow the
steps below.
1. Identify the type of fan pressure curve used, the fan configuration and exit
diameter, and the air density the fan curve is established at.
2. Divide the curve into ten (10) points. Do not include the STALL region of
the curve in the fan database. Entering the stall region of a fan may result
in an unstable network simulation at it oscillates between the two pressure
and volume flow states..
3. Note that less than ten (10) points can be entered if desired, however this
will increase interpolation errors between points resulting in a less accurate
simulation.
4. Enter the curve points and fan information in the Fan Database edit form.
5. To utilise the fan within the network, ensure the Fan Total Pressure method
is selected in the Settings, and use the Edit Box to place a fan within an
airway.
11.4.1 Fans

Ventsim Visual User Manual Page | 167
Figure 11-6 Manufacturers Fan Curve entered into Ventsim Visual
The standard fan curve is defined at a set speed and air density. The fan speed
can be adjusted from the Edit Box, while the actual fan operating density is
calculated from surface and underground pressures and temperatures. This will
alter the default fan database curve within the simulation to produce different
flow results.
More information on fans is available from the Tools menu Fan Database function
Fixed airflows can either be used to simulate the effect of a fan, or for forcing
airflow into parts of a network to reproduce observed flows.
In general, unless estimating the requirements for a fan, the use of fixed flows to
reproduce observable underground airflow is generally discouraged at it may
adversely affect other parts of a network and does not provide a realistic
behaviour for changes in underground network systems. In many cases it can
mask real problems with the network construction.
11.4.2 Fixed Airflow

Ventsim Visual User Manual Page | 168
A fixed flow will force Ventsim Visual™ to calculate a pressure required to induce
flow to the set amount. This pressure can be substantial if the airflow needs to
be pushed through a high resistance. Conversely, the pressure may actually be
negative, if the fixed flow forces the airflow to be lower than would otherwise
simulate, effectively resulting in the fixed airflow acting as a higher resistance.
Hint : Ventsim Visual™ limits fixed airflow pressure build up to around 15,000 Pa. Pressures beyond this can result in serious network imbalances and heat build up, and in most cases are likely to be erroneous in nature anyway (for example, an airflow fix may be forcing air through a very high resistance). Ventsim Visual™ will raise a simulation error in this case to warn the user of unacceptable pressure build up. This can normally be easily fixed by finding the restricting airway.
In all cases, the results of a fixed flow can be observed from the Edit Box
information function, which describes the pressure and power or resistance
required to produce the flow. This can be directly used to estimate a fan duty
point which would be required to produce the same results. This fix pressure
can be equivalent to Fan Static Pressure or Fan Total Pressure, depending on the
simulation type and location of fan.
Where the Total Pressure method has been chosen in the Settings – Air
Simulation menu, the Pressure given for fixed flows will be an estimate of the
Fan Total Pressure (FTP) requirement. For surface exhaust fans, an estimated
Fan Static Pressure (FSP) will also be provided. Note that for surface exhaust
fans, both the Fan Static and Total Pressure requirement is theoretical only and
does not include internal fan losses between the collar and discharge outlet,
therefore the estimated Fixed Total pressures are likely to be slightly
underestimated and the fan manufacturer will need to take this into account
when selecting a suitable fan. Also note that the simulated pressures provided
will be influenced by the simulated Fan or Airway Discharge diameter (evasé) so
ensure this is noted and specified when quoting the duty point summary.
Where the Static Pressure or Mixed method has been chosen (which is the
default in networks imported from Ventsim Classic 3.9), the pressure provided
will be an estimate of the Fan Static Pressure (FSP). Note that this estimate
ignores velocity pressures derived from fan discharge diameters and airway
discharge areas, as well as internal fan losses, and is considered to be a less
accurate method of estimating fan requirements when compared to the total
pressure method.
It is important to note that fixed flows contribute to network power consumption
and heat, in much the same way as fans. The fixed power and heat within a
network is summarised from the Run Summary menu item.
When calculating power and heat for a fixed airflow, the default fan/fix efficiency
from the Settings Menu is used.
More information on fixed airflow and pressure is available from the Edit Box
functions.
Finally, when specifying a fan duty point based on a fixed airflow, it is important
that the air density the fixed flow was simulated in is noted. Fan performance
varies substantially in different densities and a fan manufacturers will need to
know the required density to the fan curve can be adjusted for the local condition
accordingly.
Fan Selection (total pressure method)
Fan Selection (static or mixed pressure
method)
Fan Air Density
Ventsim Visual User Manual Page | 169
For Ventsim Visual Standard, incompressible air is assumed and the air density
remains constant and is specified in the Settings menu. For Ventsim Visual
Advanced, this value varies throughout the mine, and may be significantly
different from the surface or standard density value.
The Air Density is specified in the airway, or in the Fan or Fix summary page in
the Edit Box.
Fixed pressures work in much the same way as fixed airflows, but instead forces
Ventsim Visual™ to calculate a resulting airflow to match the input pressures.
As with fixed flows, fixed pressures consume power and produce heat, which
again is summarised in the Edit Box information summary, or from the Network
Summary menu item.
When calculating power and heat for a fixed pressure, the default fan/fix
efficiency from the Settings Menu is used.
More information on fixed airflow and pressure is available from the Edit Box
functions.
11.5 Utilizing Layers
Layers are a way to individually layer or identify and view parts of a network
separately from other parts of the network. Some examples may include a
stope system, an orepass or ventilation raise system, a workshop area, or any
other collection of airways. Note that there is no requirement for the user to
utilise viewing layers. They are only present to allow easier manipulation and
viewing of a network.
Layers work by allowing the user to 'overlay' multiple layers of airways or
information on a screen. By doing this, unnecessary detail can be 'turned off' so
only airways of interest are viewed.
Layers may be made active or displayed using the Display Manager. Layers
names can be changed from the Edit Box, by clicking the button adjacent to the
layer name.
Primary Layers consist of 250 layers. It is intended that the Primary Layers be
used for identifying types of airways. For example, Layer 1 could be Primary
Shafts, Layer 2 could be Main Airways, Layer 3 - Raises, Layer 4 - Stopes, Layer
5 - Minor Airways etc.
Secondary Layers, consist of 250 discreet layers. It is intended that the
Secondary Layers be used for isolating parts of a network that could be viewed
independently from the rest of the network. As mentioned above, this could
include working areas, stope, raises, declines or any other feature of interest.
There is no limitation on the number of airways belonging to a layer, however an
airway can belong to only one secondary and one primary layer. Primary layers
and secondary layers can be set and viewed independently of each other.
11.4.3 Fixed Pressure
11.5.1 Primary Layers
11.5.2 Secondary
Layers

Ventsim Visual User Manual Page | 170
See the DEMO.VSM and BLUE_SKY.VSM examples that come with Ventsim
Visual.
Hint : To quickly save and recall a ‘layer state’ use the Save View function to save and recall views with the Primary and Secondary Layers settings.
The easiest way to use Layers may be to create the network first (all airways will
default to Layer 1 of both Primary and Secondary Layers, and then editing
individual or group airways to change the layers to the desired number.
Hint : The Edit Box has a function which will select and group all similar airways (for example all round airways with a diameter of 3.0m. This can provide a quick way to group edit and change layers for multiple airways.
New airways constructed will inherit the layer numbers of the airway they are
constructed from. If no airway exists, new airways will use the default layers set
in the Display Manager.
11.6 Summary
The information in this Chapter explains only the basic techniques to establishing
working ventilation models. To create a truly representative ventilation model,
airway sizes and resistance must be accurately established, ventilation controls
(such as doors or walls) must be placed in the model with correct resistances,
and many other important factors such as shock losses considered.
For further information,
See the Tutorial part of this manual
Check the www.ventsim.com website for newsletters and forum
information.
Seek a suitable Ventsim Visual training course to undertake advanced
training in the product.
11.5.3 Using Layers

Ventsim Visual User Manual Page | 171
Ventsim Visual User Manual Page | 172
12 Contaminant Simulation
Contaminant simulation allows the tracking concentration and timing of contaminants through a ventilation model. Ventsim Visual has a number of different types of simulations to enable users to predict the paths of any sort of gas, dust, smoke, stench gas or even fresh air through a mine, and may assist in emergency planning, production design, and to
12.1 Introduction
Simulation of contaminants through underground mines can be a complex field
of engineering, particularly if simulations are required to take into account the
complex boundary behaviours of contaminants traveling through a three
dimensional airway.
Ventsim Visual only uses a relatively simple algorithm which distributes
contaminants in a linear velocity fashion, and assumes perfect mixing at
intersections. This method is fine for high level studies through broad mine
areas, but is not recommended for analysis of contaminant diffusion on a small
scale level. In this case, for very small areas requiring detailed analysis,
computational fluid dynamic simulation may be better suited.
A number of different simulation techniques are offered to provide users with a
host of tools to analyse the tracking of air and contaminants through a mine.
Contaminants can either be specified as an in-line concentration of contaminant
within the airway, or they can be injected into an airway using a surface
connected airway to represent an external gas source (see the Gas Simulation
section for further information on this method)
12.2 Contaminant Steady State
Performs a steady state (continuous) contaminant simulation based on the
position of contaminant source(s) placed in the network.
Steady state simulation simulates the spread of contaminants until such time as
the contaminant spreads through all possible pathways, and contaminant levels
have stabilised to a ‘steady state’. Where recirculation may be present, the
simulation will continue simulating until the recirculated air has reached
equilibrium. The simulation will only show result when ‘steady state’ conditions
have been achieved.
Upon completion, the view will switch to a contaminant view of the final results
with airways coloured according to concentration of contaminants. Contaminant
can be placed in a network by using the Edit toolbar function, or the
Contaminant toolbar button. Contaminant strengths are volume unit based and
can be entered either as a proportional unit base, or a volumetric gas
concentration.
Chapter
12

Ventsim Visual User Manual Page | 173
EXAMPLE Entering ‘100’ as a concentration value may indicate 100% of the original contaminated source strength in an airway, and will result in the dilution of the value as uncontaminated air is mixed downstream. In this case, a downstream value of ‘25’ downstream would indicate 25% of the original contamination strength.
Another example of entering ‘2000’ may indicate an initial value of 2000 ppm of CO gas. Downstream values would show diluted concentrations of this value. The units name does not need to be changed, however if desired can be changed in the Settings > Contaminant menu.
The contaminants may be cleared by pressing the Clear button at the base of the
contaminant sub-menu.
12.3 Contaminant Dynamic
Performs a dynamic (short term ‘second by second’) contaminant simulation
based on the position of contaminant source placed in the network.
The simulation will run a continuous second by second time based simulation
showing the track and concentration of fumes. The simulation can be paused at
any time and legend colours or scales changes during the simulation.
Warning: Dynamic contamination in Ventsim uses a simplified homogenous distribution algorithm which ignores the slower turbulent boundary effects of airflow along a rough passage and around corners, and the higher centre airflow velocities. Due to this leading and trailing effect, Ventsim may slightly underestimate the speed of gas distribution, and also underestimate the speed at which all gas is cleared from an airway. The simulation should be treated as a guide, and not replace normal
Dynamic Contaminant can be applied and set in the EDIT box of any airway.
There is no limit to the number of contaminant sources that may be simulated
simultaneously in a network.
Dynamic Contaminant Source may included
Fixed Time Release
Linear Decay Release
Logarithmic Decay Release
Explosive Gas Release
12.4 Fixed / Linear / Logarithmic Release
Selecting these options releases a contaminant for a limited amount of time
into the airstream. The amount of time is set in the EDIT box. FIXED
release emits the same contaminant level throughout the release time.
Linear Decay release a decreasing amount throughout the release time,
starting at the original set contaminant levels, and reducing to zero at a
linear rate by the end of the release time. Logarithmic Decay is similar to
linear decay, but more rapidly reduces at the start of release time according
to a logarithmic power scale.
Time release dynamic contaminants are intended to be used for sudden or
limited time release events, such as a stench gas release, gas burst or

Ventsim Visual User Manual Page | 174
inundation or tracer gas release, or limited emission of smoke or other
contaminants from a source. The simulation is useful for not only detecting
the spread concentration, range and timing of contaminants, but also for
establishing how long it will take to clear contaminated areas of
contaminants.
12.5 Dynamic Blast Contamination
Dynamic blasting contaminant simulation works on the theory that any blasting
source will initially contaminate a certain volume of air in the vicinity immediately
after blasting. The volume of air contaminated depends on the size of the blast
and the subsequent ‘throw back’ of dust and fumes (this volume factor is defined
in Settings). The ventilation system must then remove the contaminated air
from the region, moving it through the rest of the network to the exhaust. The
rate at which the fresh air ventilation can initially remove the contaminant
depends on the efficiency of the
ventilation flow to access and
remove all fumes from the blast
zone.
For example, in an open free
flowing drive with good airflow,
contaminant would be expected to
be removed quickly as the fresh
air forces all pockets of fumes and
gas quickly down the drive. A
blind heading, ventilated by duct
which may be damaged or some way away from the heading end will clear
slowly as the fresh air cannot efficiently reach all parts of the drive and remove
the fume.
Ventsim uses an ‘inverse power’ series to determine the rate of clearance. Every
time the air is replaced in a region (called a regeneration), a certain percentage
of contaminant is removed. For example a clearance rate of “2” – defined as
“slow” in Ventsim, would half the remaining contaminated volume (50%) every
air regeneration. A value of ‘4 – Moderate) would reduce the contaminant to
only a quarter (75% reduction) every air regeneration. Ventsim calculates the
contaminant concentration
downstream by calculating how
much contaminant volume is
‘injected’ into the fresh airstream
over the regeneration period.
The contaminant and explosive
concentration and amount can be
placed with the SMOKE button and
can be changed in the EDIT –
Contamination box. A unlimited
amount of dynamic sources can be placed throughout the network, each with a
different blast size and clearance rate (to simulate a number of development
headings and stopes firing simultaneously for example). The concentration units
entered can be changed to any concentration based unit (eg %, ppm, mg/m3
etc). The unit name can also be changed in the Settings > Contamination menu
section. The simulation is activated from the Run menu or from the Contaminant
Simulation side button access.

Ventsim Visual User Manual Page | 175
EXAMPLE Blasted development headings have been previously measured to initially have up to 2000 ppm of CO carbon monoxide immediately after blasting. Therefore a concentration of 2000 is entered (the setting unit can be changed to “CO ppm” if the user wants to), and the explosive amount set to 200 kg. When dynamic simulation is chosen, the concentration of fumes (in ppm Co) is shown through the network second by second. Clearance times can be established when concentration falls below a specified limit (for example 30 ppm). At any time, the colour legend and limits can be changed to show the concentration as colours.
Warning : Dynamic contaminant simulation has many factors which can initially be difficult to predict. It is highly recommended users calibrate their models with actual data if they have the opportunity. The simulation does not replace real gas measurement or observation when entering blasting areas.
12.6 Contaminant Sourcing
Determines the source of air at a specific location.
A sourcing simulation is similar to a reversed contamination simulation. It tracks
airflow back from a placed contaminant source, and indicates the percentage of
airflow which contributes to the airflow through the contaminant marker. This
function is useful in determining where a location sources its fresh air from, or
for analysing ways to reduce or increase airflow sources from certain areas (such
as increasing airflow sourced from a bulk air cooler or decreasing airflow sourced
from a production area.)
EXAMPLE: Entering ‘100’ as a concentration value and performing an ‘air sourcing’ simulation will show which airways upstream are carrying the relative amounts into the original airway. Back tracking the concentrations to the surface will show which surface airways are providing the airflow and may show values such as (for example) 25% decline adit, 60% main vent shaft, 15% hoisting shaft.
12.7 Location Tool
Assist in finding the location of a contaminant source.
This simulation function was designed to assist in quickly identifying the possible
locations of a fire or contaminant source (e.g. dust or production fumes)
underground. As people report the status of air from different locations (for
example smoky air or clear air), the simulation will colour airways upstream and
downstream as either smoke (red), blue (clear) or yellow (possible smoke
source)
Contaminant reports can be placed by selecting the location tool bar button
under the contaminant button. A RED pin can be placed to designate a
contamination report. Ventsim will assume that all airways downstream from
this report will also be in smoke (coloured red) and all airways above the report
will be a possible source of smoke (marked in yellow). The BLUE pin indicates
clear air. Ventsim will assume that all airways upstream from this point are in
fresh air (coloured blue). Once reports are place, select the location simulation
function to simulate and colour the airways around the reports.

Ventsim Visual User Manual Page | 176
As more reports are received, the YELLOW possible smoke source areas will
decrease and the location of a fire or contaminant source can be narrowed.
EXAMPLE Mine Control receives a radio report that smoke has been smelled in a decline location. Checks reveal that other personnel further up the decline cannot smell any smoke.
The vent officer places a ‘REPORT SMOKE’ tag on the airway where smoke was reported and a ‘REPORT FRESH’ tag on the clear airways. Pressing LOCATION SIM will show the likely paths of the smoke in RED, what areas are likely to be fresh in BLUE, and what airways may be the source of the SMOKE in YELLOW.
After receiving two more reports of smoke in different areas and fresh air in other areas, the simulation suggests the smoke could only be coming from a workshop area in the mine. The vent officer directs emergency personnel to that area, who find a large number of smouldering rags in an industrial waste bin.
Figure 12-1 Example of contaminant sourcing narrowing down a smoke source.
12.8 Fire Simulation?
A question often asked is can Ventsim do fire simulation? Fire simulation is a
complex, dynamic, evolving scenario with many factors such as fuel loads and
burn rates, oxygen supply (rich or deficit), natural ventilation changes, and
numerous other factors to consider over the course of a fire underground. Whilst
hindsight analysis allows these factors to be determined, the predicted effect of a
fire before it may happen is fraught with assumptions.
Ventsim Visual uses a steady state simulation method for airflow and
contaminants (except for the dynamic smoke dispersal simulation). While this
may be suitable for a small continuous fires and smoke with limited heat output,
it is generally unsuitable for large fire simulation, where very large quantities of
heat are involved. This is because the heat generated by the fire can cause on-

Ventsim Visual User Manual Page | 177
going changes in the ventilation system due to natural ventilation pressures,
which may change (or even reverse) the ventilation flows over a period of time ,
as well as affect the fire output due to airflow and oxygen provision to the
source.
However, Ventsim may still be of use to evaluate the potential of a fire to change
underground ventilation systems as it does have automatic heat generated
natural ventilation pressure simulation capabilities. While this will not tell the
user when or by how much ventilation system may be changed, it does give an
indication whether the ventilation model is susceptible to change from a large
heat source such as a fire.
To do this, follow these steps (ADVANCED VERSION ONLY)
1. Insert a heat source where a fire may be located. Estimate the fuel burn
rate and heat output by using the Heat Assistant and placing the
equivalent number of litres per hour of diesel (or similar calorific value
fuel) you would expect to burn.
2. Adjust the Settings > Heat Simulation to allow the program to simulate
heat in excess of 100 degrees Celsius (e.g. make it up to 2000 degrees)
3. Ensure that Natural Ventilation and Compressible Flows are turned ON.
4. Note the ventilation flow and direction.
5. Perform a HEAT SIMULATION
6. Repeat step 4, continuing to note changes in ventilation flow and
direction.
7. If the simulation remains stable, it may indicate the network to be fairly
resilient to fire of the specified size at this location. If the simulation flow
continues to change quantity or even reverse direction, then this
indicates that at some stage the fire may result in changed ventilation.
This finding may prompt further investigation into emergency actions or
escape plans, or perhaps more detailed fire simulation analysis with
another method.
Note that this is a simplistic and broad approach to simulating the effects of fire underground, and is not recommended where critical infrastructure or emergency planning decisions need to rely always on the correct prediction in timing or amount of ventilation affected by the fire (which may be dubious given so many assumptions
anyway). However it provides a method to help assess the risk of fire
driven ventilation change and thus ensure the scope of any developed
plans included the possibility of changed ventilation.
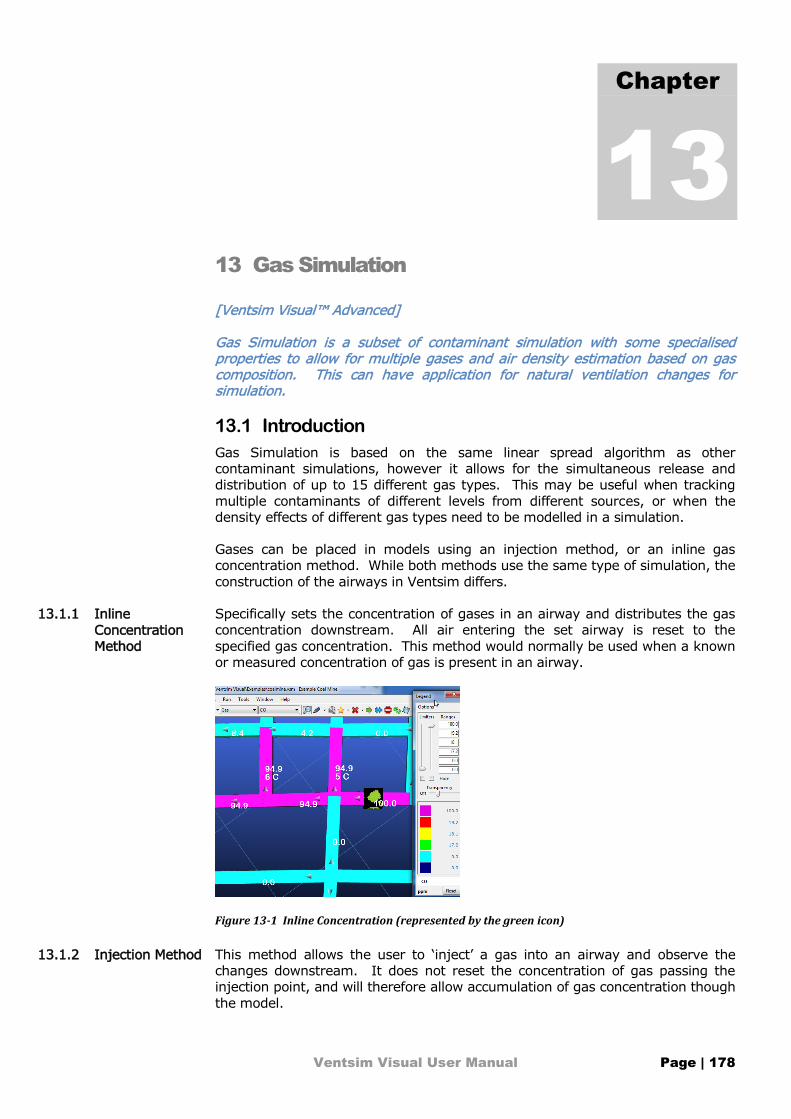
Ventsim Visual User Manual Page | 178
13 Gas Simulation
[Ventsim Visual™ Advanced]
Gas Simulation is a subset of contaminant simulation with some specialised properties to allow for multiple gases and air density estimation based on gas composition. This can have application for natural ventilation changes for simulation.
13.1 Introduction
Gas Simulation is based on the same linear spread algorithm as other
contaminant simulations, however it allows for the simultaneous release and
distribution of up to 15 different gas types. This may be useful when tracking
multiple contaminants of different levels from different sources, or when the
density effects of different gas types need to be modelled in a simulation.
Gases can be placed in models using an injection method, or an inline gas
concentration method. While both methods use the same type of simulation, the
construction of the airways in Ventsim differs.
Specifically sets the concentration of gases in an airway and distributes the gas
concentration downstream. All air entering the set airway is reset to the
specified gas concentration. This method would normally be used when a known
or measured concentration of gas is present in an airway.
Figure 13-1 Inline Concentration (represented by the green icon)
This method allows the user to ‘inject’ a gas into an airway and observe the
changes downstream. It does not reset the concentration of gas passing the
injection point, and will therefore allow accumulation of gas concentration though
the model.
Chapter
13
13.1.1 Inline
Concentration
Method
13.1.2 Injection Method

Ventsim Visual User Manual Page | 179
This method involves constructing a separate dummy ‘airway’ to inject the gas
into the model. The injection dummy airway should connect to the ‘surface’ to
allow the injection to draw a quantity of gas separate from the model simulation.
The injected gas should then be set to the actual concentration (eg 100%
methane) and a fixed flow amount set to specify the rate of injection into the
model. If very small fixed flow values need to be specified, the unit accuracy for
airflow may need to be increased in the Conversion Settings.
The model can then be simulated to show the results downstream. To show the
smaller concentrations of gas, the colour legend display may need to be
manually adjusted to show the full range of colours over a much smaller range.
Figure 13-2 Example of Injected Gas
13.2 Simulating Gas Sources
The EDIT form has a facility to fix the
concentration of gas compositions in any
airway (injected or in-line) in the ventilation
model. All gas concentrations should be
entered as a volume based concentration
value (not mass based) and then ‘FIXED’ to
instruct the simulation to use the specified
amount.
Gases which are not fixed will be
automatically adjusted to ensure the total
volume concentration of all combined gases
remain at 100%. The adjustment is done
proportionally so gases which are not fixed
(for example Nitrogen at 79%) will be
adjusted proportionally more than lower
concentration gases (for example Oxygen
as 21%)
13.2.1 Placing Gas
Sources

Ventsim Visual User Manual Page | 180
Pressing the simulation directly from the Edit form or the Contamination Gas
Simulation sub-button on the toolbar will run a Steady State simulation (a future
version of Ventsim Visual may include a dynamic option as well).
Figure 13-3 Run the gas simulation option
To display the results, the text or colour
display may need to be changed to select the
type of gas to be reviewed. The colour legend
values may also need to be manually changed
to show the full range of colours for the
desired concentrations.
Figure 13-4 Change the text and colour to show gas concentrations
To clear the results of a gas simulation and reset the model back to a
standard atmospheric gas composition, use the Clear Contaminants options.
13.3 Density Based Simulation of Gas
Ventsim Visual Advanced has the ability to simulate the effect of different air
densities on airway resistance and natural ventilation pressures.
This ability is extended to include the effect of gas composition on total air
density and natural ventilation pressures. To use this option, the following
options need to be enabled in the Tools > Settings.
13.2.2 Simulating
Results

Ventsim Visual User Manual Page | 181
a) Compressible Airflows (available from Tools > Quick Settings)
b) Natural Ventilation Pressure (available from Tools > Quick Settings)
c) Gas Density for Simulation (available from the Settings > Contaminants)
Once enabled, any gas distribution simulated in the model will result in changes
to airflow simulation based on the effect of the gas density on air buoyancy, and
the change in effective airway resistance.
For example, if 5% methane is simulated through an area of a mine with a Gas Simulation, then providing the Gas Density Simulation option is turned on, subsequent airflow simulation will predict the steady state buoyancy effect of methane through that region of the mine.
Another option may be to simulate gas drainage through pipe networks, although this process has yet to be validated in Ventsim Visual
Warning : After completing simulation work using Gas Density simulation options, remember to restore the settings and turn off the option, otherwise future simulation will be permanently affected by gas through a model, until the gas it cleared out and removed with the clear contaminant option.

Ventsim Visual User Manual Page | 182
14 Thermodynamic Simulation
[Ventsim Visual™ Advanced]
Thermodynamic (or heat and moisture) simulation is a complex field of mine ventilation and environmental engineering. A comprehensive understanding of psychrometry as well as practical aspects of heating and refrigeration is recommended before using Ventsim Visual™ to assist with major infrastructure decisions for mine planning and development.
14.1 Introduction
Heat in mines is an inevitable part of mining in the earth’s crust at depth. As
mines become deeper, excessive heat may play an increasingly more important
part in the consideration of a ventilation system design. Conversely, cold
conditions, particularly in far northern mines can equally affect a mines
performance, especially in winter where freezing of shafts and collars and worker
discomfort underground become a problem.
The impact of heat on worker physiology is perhaps the key factor in designing a
ventilation system for underground mining that is impacted by adverse
temperatures. The exposure of excessive heat to workers impacts both on their
work performance and output, and ultimately their health and safety.
When designing a ventilation system, in addition to providing ventilation to
provide fresh air and remove noxious gases and dust, we also must design a
climate for people to work in. Even if a mine does not have excessive heat
concerns, worker performance will always be best where sufficient cool air is
available to efficiently remove heat generated from human bodies doing work
duties. Different ventilation strategies can impact on the underground climate,
and this chapter discusses how Ventsim Visual™ deals with different sources of
heat and moisture and explains tools in Ventsim Visual™ to analyse and apply
design changes to improve underground climates.
Heat comes from a variety of sources in underground mining. If we begin with
the heat provided initially in the fresh air entering the mine from the outside
climate, the following sources are important factors in what happens while the
air travels though the mine.
Rock Strata – Dictated by the rock type and geothermal gradient, the
temperature and heat flow from exposed rock increases at depth.
Autocompression – As air travels deeper and is ‘compressed’ under
gravity, the temperature increases theoretically by nearly 10 degrees C
dry bulb per 1000m.
Chapter
14
14.1.1 Sources of Heat

Ventsim Visual User Manual Page | 183
Diesel Equipment – A major source in modern mines, both heat and
moisture are generated by diesel equipment.
Electrical Equipment – Fans, pumps, winders, substation and electrical
distribution system all distribute heat into underground workings.
Blasting – Perhaps more of a transient heat source, blast can cause short
term spikes in heat in a mine, and some heat can be retained in broken
rock for some time.
Oxidisation – Highly reactive ores can produce heat when exposed to
oxygen.
Figure 14-1 Example of Heat in mine calculated by Ventsim after simulation
In addition, moisture can affect the comfort level of air underground. As
moisture levels and humidity increase, this reduced the ability of the human
cooling system (sweating) to adequately cool the body.
Strata – moist or wet rock surfaces from ground water results in increased
evaporation.
Ponded Water – collection of water on the ground or underground dams can
increase evaporation of water.
Diesel Equipment – generates additional moisture in the air through exhaust and
by work activities by as much as 1.5 – 5 litres of water per litre of diesel
consumed.
Dust Suppression / Sprays – used to settle the dust often on main travel routes,
most of the additional water is eventually evaporated into the air.
It is important to note that the evaporation of water into the air does not directly
increase the ‘heat’ of the air – in fact the dry bulb temperature is decreased and
wet bulb temperature remains initially unchanged. However the decreased air
temperature then makes the cooler humid air receptive to collecting more heat
from rock surfaces, resulting eventually in increasing temperatures with already
higher levels of humidity. As a result, air quality and cooling power will more
rapidly decrease and wet bulb temperature increase with the addition of
moisture to the air.
14.1.2 Source of
Moisture
Ventsim Visual User Manual Page | 184
14.2 Application of Heat
While Ventsim Visual™ analysis automatically considers heat from strata,
autocompression and fans, the correct base assumptions or ‘environmental’
factors must be first entered in the Ventsim network settings to establish the
conditions in which the mine is being simulated. See the Settings – Environment
section for further details.
All direct user specified heat into airways is entered via the EDIT box > HEAT.
The most common user heat input source will be diesel heat or sensible (dry)
heat, however the user can also input latent (water vapour) heat and oxidisation
if applicable. In addition, the temperature of the air at a location can be
specifically fixed to match actual data, or to provide simulated feedback from
Ventsim Visual™ on what is required to achieve such temperatures.
Warning : Perhaps the biggest mistake in attempting to simulate heat underground, is trying to apply a heat source to an airway carrying small amounts of airflow. While this may be possible in real life due to perhaps only a short time of exposure, because Ventsim Visual™ uses a steady state thermal simulation, the heat is assumed to apply continuously and can result in extremely high air temperatures. As the thermodynamic equations are only optimised for a certain heat range (up to around 100 degrees), excessive heat will produce a simulation error.
Sensible heat is the application of heat to the air with no change in moisture
content. The situation applies to dry heat sources such as electric motors from
fans or pumps, radiating heat from hydraulic or working equipment or frictional
heat sources from conveyor belts or crushers.
Note that all ventilation power underground such as fans and fixed flows or pressures are automatically assumed to be sources of heat in Ventsim. They do not need to be entered as separate heat sources.
Diesel engine sources underground are internally converted to a mixture of
sensible and latent heat for simulation. A diesel engine of a rated power will
produce nearly three times the heat of the rated engine power, assuming no
energy is converted to ‘useful’ work. Ensure when entering diesel heat sources,
that only the engine power diesel equivalent is entered, not the engine heat
output.
Diesel combustion results in the production of heated exhaust gases and water
vapour, which is transferred to the surrounding air. In addition, additional water
vapour source from engine cooling systems or the surround environment is
added to the air in the form of evaporation. This ratio of diesel fuel to water is
set in the Settings Menu, and is assumed the same for all diesel heat sources. If
separate ratios need to be considered, the sensible and latent heat will need to
be entered instead of a single diesel heat figure.
Perhaps the biggest source of confusion in applying underground heat is the
application of latent heat. In general, latent heat, which is essentially adding
heat to the air in the form of water vapour, should rarely need to be considered
as a separate user input. While latent heat is internally calculated by Ventsim
14.2.1 Network
Environmental
Settings
14.2.2 User Inputs
14.2.3 Sensible Heat
14.2.4 Diesel Heat
14.2.5 Latent Heat

Ventsim Visual User Manual Page | 185
Visual™ in the application of strata heat and diesel equipment, it rarely needs to
be applied directly by the user. The only exception may be to ‘condition’ air to a
required wet bulb and dry bulb temperature, or in the application of heating to a
mine with propane or some other moisture producing fuel source.
Oxidisation heat is included for completeness, but will rarely be required to be
entered into a mine network. For most mines with reasonable ventilation flows,
oxidisation will be generally insignificant in overall heat gain. The exception may
be in highly reactive ores or where there is very low airflow. While there are
formulas to estimate the reactive heat of certain types of ores, it is generally
unreasonable to try to calculate this value theoretically due to the variability of
oxidising ores. In most cases, oxidisation heat can be estimated from empirical
measurements from actual underground areas.
All electrical fans generate heat which is dissipated into the surround airflow.
The heat generated is equivalent to the input electrical power, and is dissipated
into the airflow through a combination of electrical motor inefficiencies, blade
inefficiencies and friction losses. Ventsim Visual automatically includes heat from
fans in a network heat simulation, therefore there is no need to include fans as a
separate heat source
14.3 Application of Moisture
While Ventsim Visual™ automatically considers moisture derived from wet and
damp strata surfaces, direct user moisture application to air from underground
sources is unlikely to be commonly used in most networks.
It is important to note that moisture application to air does not directly alter the
heat content of the airflow (providing the moisture added is the same
temperature as the airflow). Instead, through the process of evaporative
cooling, the dry bulb air temperature is decreased, while air moisture content in
the form of water vapour increases, resulting in net zero energy change. Once
evaporation occurs however, the cooler ambient air temperature may be more
receptive to heat transfer from rock surfaces resulting in increasing wet bulb and
dry bulb temperatures.
Examples of water addition to airflow may be:
Dust suppression sprays
Evaporative Cooling
Conditioning of air for simulation
Dust suppression sprays are often used on dusty roadways, at stope draw points
or on conveyor belts or crushers. Water sprays directly increase the water
content of air through increased evaporation from fine water particles, as well as
wet surfaces around the sprays. In many cases however the uses of sprays is
often sporadic and does not represent a steady state flow network. For sporadic
sprays, a better solution to applying moisture to the airflow in a dust suppression
area may be to increase the wall wetness fraction to closer to one (1). This will
14.2.6 Oxidisation
14.2.7 Fan and Fixed
Flow Heat
14.3.1 Dust
Suppression

Ventsim Visual User Manual Page | 186
assume the area remains wet and also proportionately alter moisture addition
depending on the airflow quantities in the area.
Caution: The amount of water capable of being applied to airflow will be limited by the amount of airflow in the airway. If too much water is attempted to be applied, the excess will appear as condensate in the simulation.
Another application for adding moisture is evaporative cooling, however these
are not commonly used in mines unless very dry warm air is present. To
simulate evaporative cooling, ideally a water balance should be undertaken to
identify water being added to the air from an actual installation. Alternatively, a
temperature difference before and after the evaporative cooling chamber will
allow Ventsim Visual™ to estimate the water balance in the Edit Box Heat
Assistant.
Water may be picked up via evaporation via any wet material or ponded water.
Once again, the problem of directly applying a water flow volume to the air is
that evaporation will change depending on the volume flow and velocity of the
air. A better alternative to applying water over wet or flooded areas is to
increase the wetness fraction of the airways.
14.4 Application of Refrigeration
The application of refrigeration for deeper or hot underground mines has become
a routine requirement as mines push deeper and environmental consideration
become more pressing.
There are several different types of refrigeration processes used in mines.
Refrigeration uses a heat exchange process where a certain amount of input
energy is used to create a heat separation process where heat is removed from
one medium (usually water or air) and exchanged as heat to another location. If
the refrigeration system is surface based and the heat from the refrigeration
electrical input and exchange is rejected to atmosphere, then only the direct
refrigeration input needs to be considered for underground and can be placed
where it occurs (e.g. at a surface shaft collar for a bulk air cooler, or in an
underground airway for a chilled water spray chamber or cooling tower).
If the entire refrigeration plant is placed underground however, then the heat
rejected by the refrigeration plant needs to be placed separately as a SENSIBLE
heat source. This heat source needs to include an equal value to the
refrigeration value used, PLUS the input power to the plant. The ventilation
design implications are of course that the heat should not re-enter the cooled
airflow, and sufficient airflow should be available to remove the heat.
Finally, the ratio of the refrigeration power (heat exchange) generated versus
the electrical (or mechanical) input power is called the refrigeration coefficient of
performance (COP) and is specified in the SETTING > HEAT. Although this factor
is not directly involved in the simulation process (the final Refrigeration Power is
set by the user, not the input power), this setting helps Ventsim calculate the
total electrical power a network consumes. COP normally varies from 2.5 to 5.0
(refrigeration power vs input power) and is dependent on the plant design and
the input and output temperature performance.
14.3.2 Evaporative
Cooling
14.3.3 Wet Material /
Dam / Flooded
airways

Ventsim Visual User Manual Page | 187
Ventsim Visual™ assumes any item placed in an airway is simulated at the icon
location. For this reason, placing a bulk air cooler in the middle of a shaft, would
assume the bulk air cooler is located half way down a shaft, which would clearly
not be the case. This assumption would result in differing air densities and air
temperature, than would be the case if placed on surface.
It is recommended that for fans and thermodynamic items, the icon be placed
where the simulation is required to be performed, or alternatively a short airway
segment (vertical or horizontal) is placed at the top of a shaft airway for the
cooling infrastructure. This will force the program to use surface conditions for
the device.
Ventsim Visual™ assumes all airflow within an airway is equally cooled by a
refrigeration or heating device. If only part of the airflow is actually cooled (and
the other part mixes downstream), because of condensation of the split portion
the mixed airflow results may have substantially different psychrometric
properties than air that was equally cooled.
While the two airflow cases will report similar heat reduction (consisting of sigma
heat and enthalpy flow), the partially chilled airflow case may have the
refrigerated portion chilled to much lower temperatures, resulting in an increase
in condensation and subsequent removal of moisture. The resulting mixed
stream will then be generally warmer, but dryer with a lower relative humidity,
compared to the stream which is evenly chilled.
Whether the installation is on surface or underground, if a cooling device only
chills part of the airflow, ensure a separate airway is included to represent this
chilled portion. The example below shows the substantial difference in
downstream temperatures between the two cases.
Figure 14-2 Example of an inline cooler chilling ALL airflow
14.4.1 Placement of
Refrigeration
Sources
14.4.2 What portion of
the air is cooled?

Ventsim Visual User Manual Page | 188
Figure 14-3 Example showing same inline cooler chilling only 40% airflow
Discussion: It is important to note that in both cases, 3500kW of heat has been removed from the air. Downstream from the refrigeration unit, the difference in psychrometric properties of the mixed versus the whole chilled airflows will actually diminish. The dryer warmer air resulting from the mixed case, will actually enhance evaporative cooling from damp or wet airways, resulting in potentially cooler moister air, while the case with the cooler moister flow will enhance geothermal heat transfer from rock surfaces and reduce evaporative cooling.
The resulting air temperatures some distance from the refrigeration source may be very similar.
The type of refrigeration plant will have subtle differences on the effect on air
temperatures and humidity. A cooling tower versus a spray chamber for
example may result in slightly different relative humidity due to the air to
moisture contact mechanism, particularly if the dew point temperature of the air
is not reached or the air is very dry. Additionally, the presence and location of
electrical pumps and equipment required to run the installation may introduce
heat back into the airflow for an underground installation, but not a surface
installation.
As Ventsim Visual™ only considers the refrigeration output of a plant, the plant
performance in achieving this output is largely irrelevant to the simulation
(although plants will perform differently depending on ambient temperatures to
be cooled). The plant design to achieve this refrigerative output for the ambient
working temperatures is a whole extra design criteria outside of the scope of
Ventsim simulation. For detailed engineering studies it is important to consider
plant design to establish overall economics and effectiveness for the proposed
ventilation circuit. In addition, fouling and subsequent degradation of
refrigeration plants should also be considered when allowing for contingency in
sizing a refrigeration plant.
What type of refrigeration plant is
it?
Refrigeration Plant Performance

Ventsim Visual User Manual Page | 189
15 Diesel Particulate Matter Simulation
[Ventsim Visual™ Advanced]
Diesel Particulate Matter (DPM) concentrations are a relatively new concern for underground mining operations. While prolonged exposure to high levels of diesel particulates has long been suspected as having potential to cause health problems, only recently have mining regulators started imposing strict atmospheric limits for underground mines. Ventsim Visual Advanced provides tools to assist in predicting the distribution and concentration of diesel particulates through an underground mine.
15.1 Application of DPM Simulation
Ventsim Visual Advanced uses a relatively simple, steady state, homogenous
simulation of diesel particulates, with specified emission amounts from diesel
equipment exhaust being mixed uniformly with surrounding airflow and
distributed downstream. While real time variations in diesel output and mixing
of pollutants at junctions will always be variable, because regulatory limits are
normally based on an 8 hour time weight average (TWA) exposure for a person
throughout a shift, most of these variations are smoothed out and can be
ignored.
Every diesel engine emits a certain level of pollutants; which include noxious
gases and solid particulates. In an attempt to impose restrictions on the
amounts of allowable pollutants an engine can emit to atmosphere, regulators in
many countries have introduced steadily decreasing pollution limits on new
engines, known in North America as the Tier standard. Generally speaking, the
higher the Tier rating, the ‘cleaner’ the engine, although there can still be
considerable variation between one engine and the next within a Tier standard.
The recently introduced Tier 4 standard is being implemented over the period
2008 – 2015 and demands emissions be reduced by up to 90% lower than
previous Tier standards. Engine emission results are tested and approved by the
EPA in North America, and many of these test result are available online from
the internet.
The makeup of quoted diesel engine particular matter (PM) can vary depending
on engine type and fuel used, however a widely accepted ratio range is around
50-60% elemental carbon, 20-30% organic carbons and 15-20% other matter.
The two most commonly used standards are the elemental carbon value (EC)
and the total carbon value (TC) which is the sum of the elemental and organic
carbon components. Current North American guidelines state an elemental to
total carbon ratio factor of around 1.3X. Unfortunately, most EPA test results do
not state the different particulate composition, so it will be up to the user to
determine the resulting composition.
Rather than introduce emission standards, mining regulators focus on
Chapter
15
Tier Standards
Composition of Diesel Particulate Matter
(PM)
Atmospheric Standards

Ventsim Visual User Manual Page | 190
atmospheric levels in mining environments. The atmospheric concentration of a
diesel engine emission is a function of the rate and concentration of the exhaust
emission, and the amount of diluting airflow around the equipment. By placing
an engine size and emission concentration in Ventsim Visual, the program can
use simulated airflows to calculate the resulting atmospheric concentration.
Regulators have specified either an ‘elemental’ carbon limit or a ‘total’ carbon
limit for allowable TWA atmospheric levels of diesel particulates. In North
America (2008) a standard of 160ug/m3 Total Carbon (elemental + organic
carbon) has been initially imposed, while Australia looks likely to adopt a
100ug/m3 Elemental Carbon limit.
Diesel Equipment emissions are usually specified as a particular matter (PM)
level, normally factored to engine output (for example 0.15 grams per kilowatt
hour of engine power). This level includes elemental carbon, organic carbon and
other particulate matter such as sulphates. As the atmospheric limits relate only
to carbon emission, care must be taken to either factor the emission rate to
carbon levels accordingly, or factor the final atmospheric concentration limit so
that only the desired carbon levels are used (elemental or total).
Finally, the diesel engine emission outputs may in some cases be further
reduced by the equipment manufacturer or mine utilising catalytic / regenerative
converters and particulate filters. This can further lower the emission rate
further (by 50% or more) and if present, should be considered in the final DP
emission value. Conversely, worn or damaged equipment may produce
significantly higher than expected emissions. Where possible, mine sites should
measure actual equipment exhaust to obtain actual values, however if this is not
possible, then equipment manufacturer advice should be sort, or a conservative
approach from EPA data taken.
Simulated atmospheric concentrations of particulates are only the first step in
what must be a multi-pronged approach to controlling exposure levels.
Operators of machines may be directly exposed to higher concentrations than
predicted due to their proximity to exhaust emissions. Conversely, operators
protected by filtered cabins may be exposed to lower concentrations that
predicted. Also keep in mind that mine concentrations of DPM which are higher
than the allowed standards still may be permissible if other control methods such
as reduced exposure time or personnel protective equipment are used to control
exposure.
Where control of exposure measures cannot be guaranteed to protect workers,
the mine will need to consider implementing engineering strategies such as
increased ventilation flow, or improved engine or emission control. Where
increase ventilation flows are used, ensure that this has a cost benefit against
improve exhaust emission or exposure control. The financial functions in
Ventsim Visual provide useful feedback on the additional cost of ventilation –
cost which may be better invested in exhaust emission reduction.
15.2 How to perform DPM Simulation in Ventsim
Ventsim Visual uses the diesel equipment placed for heat simulation to also
simulate DPM concentrations. Emission rates can be entered either in the Heat
Presets, or directly as a manual entry in the EDIT form. Once again, note the
atmospheric concentration will be given in the same composition units as the
diesel emission assumption (emissions rates are entered as elemental, total
carbon, or total particulate matter)
What is the actual DP value?
Application in a Mining Environment

Ventsim Visual User Manual Page | 191
A diesel engine is listed as having a PM (particulate matter) value of 0.16 g/kW-
hr. The mine is regulated under an Elemental Carbon limit of 100 ug/m3, and
the user has assumed that Elemental Carbon is 50% of Particulate Matter (PM).
Therefore the user must either convert the diesel emission rate to elemental
carbon (50% = 0.08g/kw-hr) or keep in mind that their actual simulated
atmospheric limit is in total DPM instead of Elemental Carbon (200ug/m3).
The Ventsim user decides to convert the PM value to an Elemental Carbon value of 0.08g/kW-hr, and enters this value in the Heat Presets.
Next, the user must decide the average diesel power output of the engine during
the shift. DO NOT ENTER THE MAXIMUM diesel engine power, as no typical
diesel equipment will run at full engine power for the entire shift, and using this
value will over predict DPM concentrations. The best method is to measure
actual fuel consumption for the shift, and use the Heat Assistant in Ventsim to
calculate average engine power output. In most cases, trucks and loaders will
not exceed 50% of their rated power, and auxiliary equipment and light vehicles
will probably be much less.
Figure 15-1 Diesel Equipment with DPM emissions in Preset Values
The user has five loaders with rated diesel engine power of 250kW each. After
observing fuel usage for the shift, the user specifies the machine put out an
average of 125kW of diesel power and enters this value in the Heat Presets.
The five (5) loaders are then placed in typical airways around the mine and the
DPM SIMULATION function is activated.
15.2.1 Example

Ventsim Visual User Manual Page | 192
Figure 15-2 Diesel heat and DPM source placed in airway
The DPM levels can be actively viewed around the mine, and the colour ranges
adjusted in the Colour Manager to view areas of potential concern. Further
changes or increases to air flows will require a re-simulation of the diesel
particulates to recalculate new values.
Figure 15-3 Example showing DPM simulation colouring through mine

Ventsim Visual User Manual Page | 193
16 Saving Money
Ventsim Visual™ provides many useful tools to analyse and develop strategies to save money. While the total ventilation cost for most mines is significant, much of the cost remains largely hidden or ignored and treated as inevitable.
The total cost of ventilation in mines should not only be considered as the direct
costs such as power consumed or ventilation fans purchased, but as a whole of
mine cost, which includes the development and infrastructure mined,
maintenance and upkeep of ventilation system, and productivity gains and losses
due to good or adverse ventilation conditions. When ventilation costs are viewed
as an integral part of all production activities, the cost of poor ventilation
becomes even more substantial.
Ventsim Visual™ includes a number of tools to quickly analyse and help reduce
ventilation costs.
16.1 Financial simulation
[Advanced Versions]
Designed to quickly estimate optimum ventilation infrastructure size, by
considering mining costs as well as life of mine ventilation operating costs, this
function can help optimise airway sizes and save substantial money over the life
of a mine. Keep in mind however, when using estimated mine life to optimise an
airway size, that in many cases mine life extends far beyond initial estimations
as further ore resources are found. Many mines are stuck with an inadequate
ventilation system that is stretched far beyond its useful life, because the
possibility of mine extensions or expansions was not considered in the early
stages of ventilation design.
See the Financial Simulation function for further information
16.2 Cost Data Function
The program contains a number of data types which show ventilation costs per
annum for airways. These include fan/fix power costs, friction losses per airway
and friction losses per unit length.
Perhaps the most useful way to consider ventilation costs is not to look at the
cost of running fans, but rather look at the cost of pushing ventilation through
individual airways away from the fans.
Of all the cost data function, perhaps one of the most useful is the friction cost
per unit length. This describes the friction pressure loss along an airway length,
and is directly proportional to the ventilation cost per unit length of development.
Chapter
16

Ventsim Visual User Manual Page | 194
For example, if a particular airway reports a ventilation operating cost due to friction loss of $800/yr per metre, then over a mine life of 10 years, the total cost of pushing ventilation through the heading is $8000 per metre. It is not hard to see that increasing the mined airway size slightly for (say) an additional mining cost of $500 per metre will quickly pay dividend in reduced ventilation costs.
By using the Ventsim Visual™ Colour Manager, and colouring data to the
ventilation cost per annum per unit length, high cost airways will be highlighted,
and can be quickly identified and analysed for potential different sizes.
In the ‘Blue-Sky’ example presented below, the data colour display is set to Head
Cost/L (friction pressure cost per metre). The colour sliders are adjusted to
show airways costing greater than $2 per metre per year. Airways below this
are made transparent to clarify the display.
The data clearly shows in particular two air shafts with extremely high costs per
metre, one in particular at over $600 per metre per year, as well as a horizontal
connecting airway costing nearly $300 per metre. If the mine life was
substantial, it would not be hard to justify enlarging or installing a second shaft
system to reduce overall ventilation costs.
In this case, increasing shaft size from 3.0m to 3.5m reduced per metre annual
ventilation costs from $600 per metre to $250 per metre. Over 10 years, this
would result in a saving of $400,000 for this relatively short airway.
Figure 16-1 High Cost Airways coloured to show clearly
16.3 Ventilation on Demand.
An increasingly popular method of reducing ventilation costs is applying
ventilation only when and where it is needed. While simple in principle, this
fundamental approach provides significant challenges when applied to complex
networks. Changes or reductions in ventilation flows can significantly impact
other areas of the mine, resulting in recirculation and heat and gas build up.
16.2.1 Example

Ventsim Visual User Manual Page | 195
Using Ventsim Visual, different scenarios can be easily examined by simulating
potential changes, such as reducing or turning off fan flows or reducing
refrigeration.
The network summary will predict savings made in ventilation costs and power
for the change.
The recirculation checker in Visual Advanced will quickly check for any
recirculation resulting from the change.
The contamination and diesel particulate tools (in the Advanced version) will
estimate any change to exhaust and potential fume.
The thermodynamic simulator will identify any unacceptable changes to
temperature
Doors, fans and stopping can be quickly placed to control network airflow to
acceptable levels and provide useful information as to what automatic controls
may be required to achieve the ventilation changes.
16.4 Fan Optimisation
Correctly sized fans can significantly
reduce operating costs.
Ensure airflows are not significantly
overdesigned, and fan curves and duty
points are closely matched to run
efficiently. Many fan curves rapidly lose
efficiency away from the central duty
points, resulting in poor performance and
excessive power consumption.
The fan efficiency and power consumption
can be examined under the Edit Box fan
menu. Ideally, the fan efficiency should
have the operating duty point close to the
maximum fan efficiency.
A further way to boost fan flow and
efficiency is to ensure an evasé is fitted to
surface exhaust fans. Fan evasés reduce
surface velocity pressure losses, increasing
available fan static pressure to overcome
mine resistance. The overall effect is improved airflow at a similar cost.
Finally, overall network efficiency is largely influenced by the configuration of
fans throughout a network. The use of ‘in-series’ booster fans underground for a
single primary ventilation circuit should generally be avoided if possible, as fan
efficiencies are compounded as the same airflow travels through each fan
(booster fans may however be useful in directing airflow into parts of a mine
which would otherwise require inefficient regulators on the primary vent flow to
do so). The result compared to a single pass fan system is higher power for
similar airflow. The overall network efficiency is available from the network
summary function.
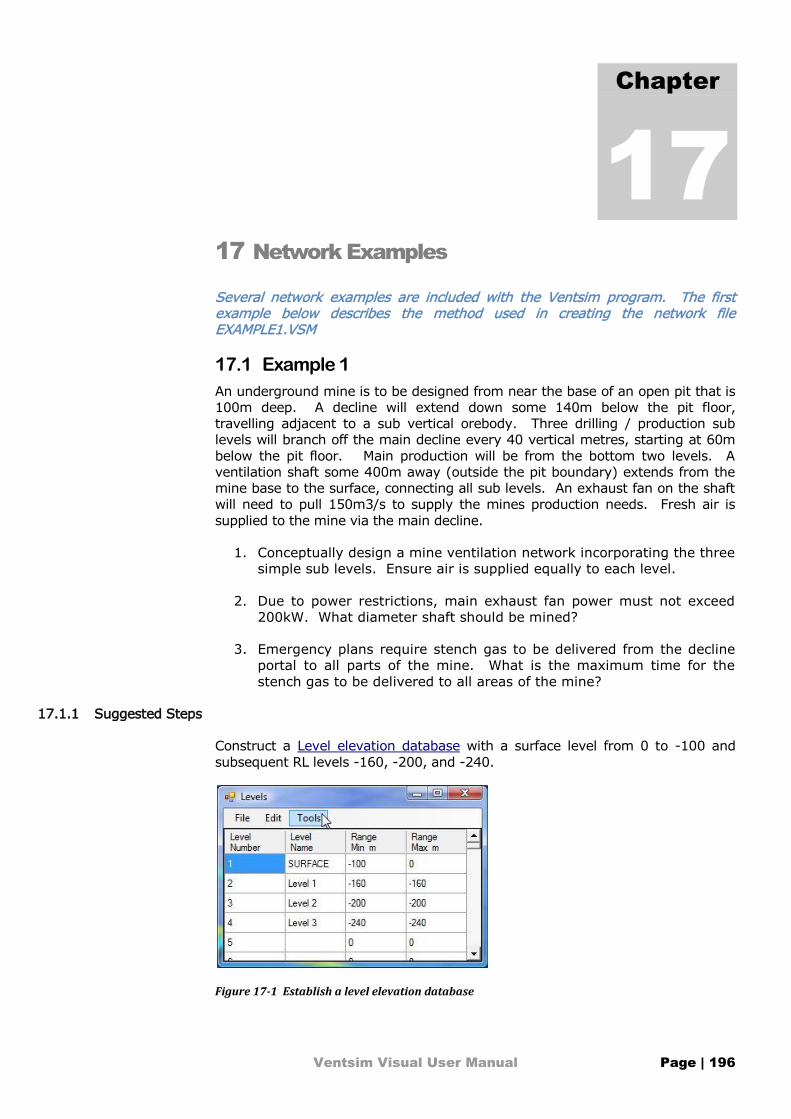
Ventsim Visual User Manual Page | 196
17 Network Examples
Several network examples are included with the Ventsim program. The first example below describes the method used in creating the network file EXAMPLE1.VSM
17.1 Example 1
An underground mine is to be designed from near the base of an open pit that is
100m deep. A decline will extend down some 140m below the pit floor,
travelling adjacent to a sub vertical orebody. Three drilling / production sub
levels will branch off the main decline every 40 vertical metres, starting at 60m
below the pit floor. Main production will be from the bottom two levels. A
ventilation shaft some 400m away (outside the pit boundary) extends from the
mine base to the surface, connecting all sub levels. An exhaust fan on the shaft
will need to pull 150m3/s to supply the mines production needs. Fresh air is
supplied to the mine via the main decline.
1. Conceptually design a mine ventilation network incorporating the three
simple sub levels. Ensure air is supplied equally to each level.
2. Due to power restrictions, main exhaust fan power must not exceed
200kW. What diameter shaft should be mined?
3. Emergency plans require stench gas to be delivered from the decline
portal to all parts of the mine. What is the maximum time for the
stench gas to be delivered to all areas of the mine?
Construct a Level elevation database with a surface level from 0 to -100 and
subsequent RL levels -160, -200, and -240.
Figure 17-1 Establish a level elevation database
Chapter
17
17.1.1 Suggested Steps
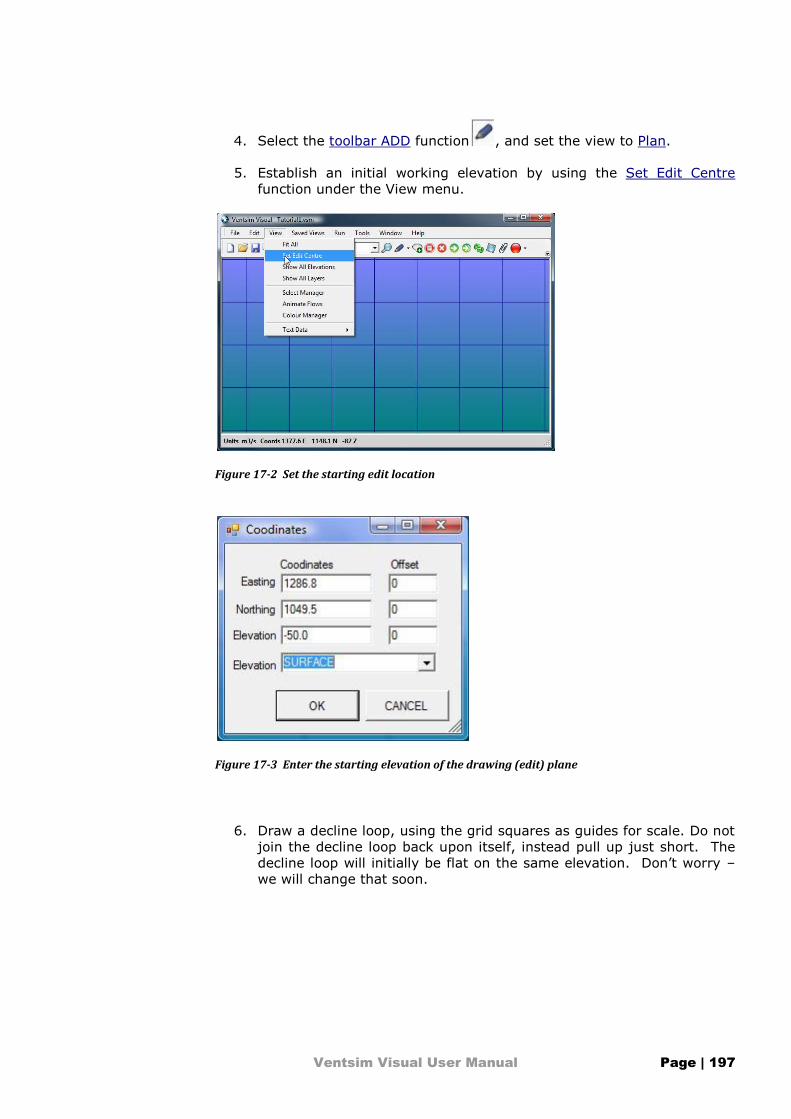
Ventsim Visual User Manual Page | 197
4. Select the toolbar ADD function , and set the view to Plan.
5. Establish an initial working elevation by using the Set Edit Centre
function under the View menu.
Figure 17-2 Set the starting edit location
Figure 17-3 Enter the starting elevation of the drawing (edit) plane
6. Draw a decline loop, using the grid squares as guides for scale. Do not
join the decline loop back upon itself, instead pull up just short. The
decline loop will initially be flat on the same elevation. Don’t worry –
we will change that soon.
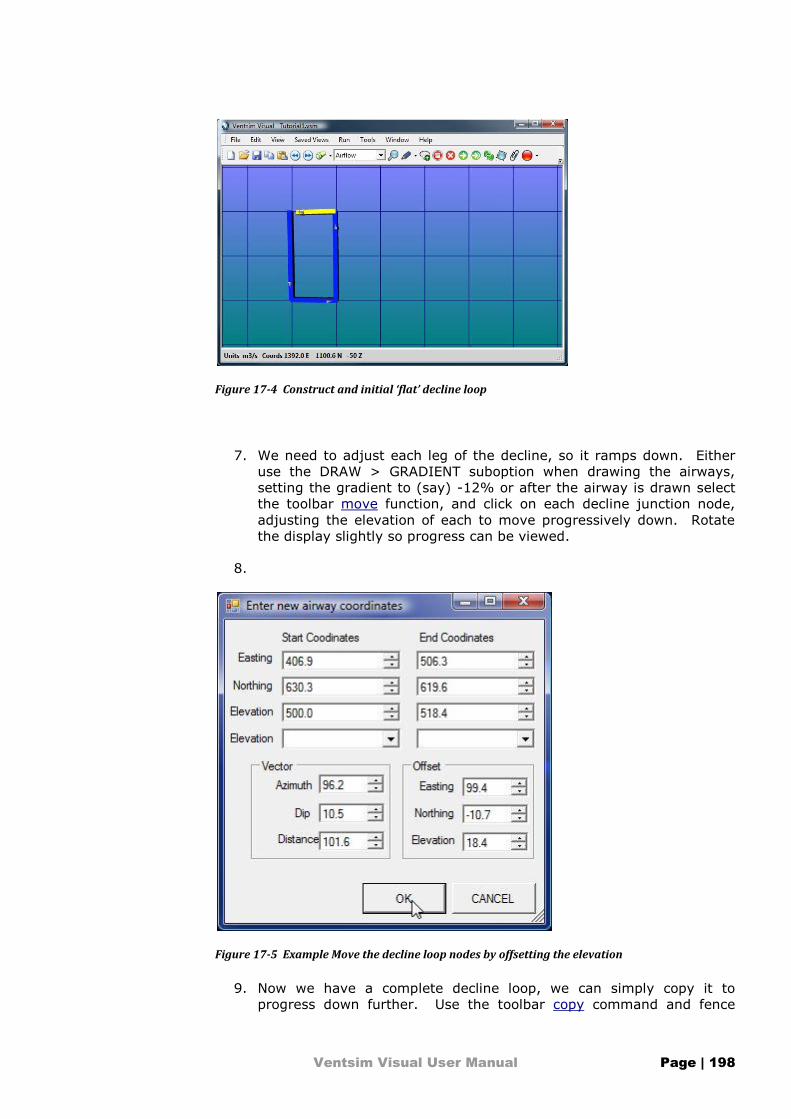
Ventsim Visual User Manual Page | 198
Figure 17-4 Construct and initial ‘flat’ decline loop
7. We need to adjust each leg of the decline, so it ramps down. Either
use the DRAW > GRADIENT suboption when drawing the airways,
setting the gradient to (say) -12% or after the airway is drawn select
the toolbar move function, and click on each decline junction node,
adjusting the elevation of each to move progressively down. Rotate
the display slightly so progress can be viewed.
8.
Figure 17-5 Example Move the decline loop nodes by offsetting the elevation
9. Now we have a complete decline loop, we can simply copy it to
progress down further. Use the toolbar copy command and fence

Ventsim Visual User Manual Page | 199
select the decline loop. Then grab the upper end with the mouse
cursor, and drag it down to join onto the lower leg. A new decline loop
has been made. Repeat this action several more times to construct
the decline to the underground levels.
Figure 17-6 Copy the selected decline loop to lower levels and repeat
10. Once the decline is established to the proposed base level of the mine,
use the Set Edit Centre under the View menu to set the grid to the
first sub level. Draw a sublevel across to a point at the right of the
screen. To draw a shaft, start a new horizontal airway, and then hold
the shift key to draw the airway vertically. Use the edit plane (semi-
opaque sheet) to judge where to finish the shaft at the surface.
Alternatively, you could set the draw function to manually allow
coordinate entry to establish the shaft, or just CLICK the end of the
airway while in the DRAW mode, to enter the coordinate or offset.
Figure 17-7 Construct a shaft to the surface

Ventsim Visual User Manual Page | 200
11. Repeat the above step to produce two more sub-levels. Extend the
shaft at the right to join to the two lower sub-levels.
Figure 17-8 Draw multiple levels for the mine
12. Edit the shaft airways and set them to a required size. Label the
airway, and set the airflow as a fixed airflow to the desired amount of
150m3/s. Ensure the airway has the ‘Surface Connection’ checked.
Click on the top decline airway, and also ensure the ‘Surface
Connection’ is checked. Click on Air Simulation to ensure everything
works correctly.

Ventsim Visual User Manual Page | 201
Figure 17-9 Edit the airway to set the airway size
13. Click on the sublevel entries to the exhaust shaft. Set the 1st and 2nd
sublevel airflows to 50m3/s. The lower sublevel will automatically
simulate to 50m3/s to balance the 150m3/s total airflow into the
shaft. Clicking on the Edit Box info will show the required resistance
to produce this airflow.
Figure 17-10 Add a fixed airflow to the airway
14. Adjust the shaft diameter until the required power constraints are met.
Ensure you simulate the network between each adjustment. In this
case, a shaft size of 3.6m was found to produce the desired result.
The required duty point is 965Pa Total Fan pressure, 150m3/s with a
fan motor size of 181kW and an electrical power consumption of
190kW.
Figure 17-11 Use the Edit – Info to view airway flow, pressure and power
15. To perform a stench gas simulation, place a contaminant in the upper
decline with the Edit Box. Set the contaminant to a strength of 100,

Ventsim Visual User Manual Page | 202
and run the contaminant simulation. The colour display will initially
show a strength of 100 is spread all through the mine, which is to be
expected as the decline is the only source of fresh air. Change the
Colour Manager to show ‘Spread Time’. The lower corner will show
spread times of up to 700 seconds or around 12 minutes.
Figure 17-12 Colouring showing contamination spread time in seconds
If you got this far, congratulations!
The complete example is available from the Ventsim Visual™ installation folder under Examples.

Ventsim Visual User Manual Page | 203
17.2 Example 2
A skeleton network has been created in a mine planning package by tracing over
the existing and planned development and exporting the file as a DXF format
file. Import this file into Ventsim and adjust it to create a workable network.
Note that the decline is 5.5m x 5.5m, the sub level drives are 4.0m x 5.0m and
the ventilation shafts are 2.4m diameter.
1. Create an RL (reduced level) elevation database that separates the
mine into each sub-level. Create a RL that also displays the entire
mine.
2. Create three PRIMARY Layers, and set the DECLINE, SUB-LEVEL and
SHAFT airways to these Layers.
3. Divide the mine into fresh & exhaust air with the DECLINE carrying
fresh air, and the SHAFT and the upper sub level carrying exhaust.
4. Create some saved views showing the;
whole mine with exhaust and fresh air showing.
decline by itself.
two upper sub-levels and corresponding shafts.
5. Initially set the default airway sizes (in the Settings Airway menu) to
4.0 x 5.0m. This will set all imported DXF airways to these defaults
sizes, and therefore the majority of airways will not need to be
adjusted after importing.
6. IMPORT the DXF file into Ventsim, converting the dxf centrelines
directly to airways (import option). Another method is to import the
lines as a reference only, and then selectively choose or fence which
lines to convert using the Airway > Convert Centerline toolbar button
option (next to the ADD button)
Figure 17-13 Initial imported DXF strings in Ventsim Visual
7. Create an RL database with the RL MIN & MAX covering each sub-level
range.
17.2.1 Suggested Steps

Ventsim Visual User Manual Page | 204
Figure 17-14 The Level Elevation database
8. Create the new Primary layer names by entering the Preset Value
forms. Select this from the Tools Menu, or click the Primary Layer
button from any airway in the Edit Box.
Figure 17-15 Set airway layer names
9. Use the group edit function to select the decline airways
10. Use the select toolbar button to select all decline airways

Ventsim Visual User Manual Page | 205
11. Use the edit toolbar button to edit all selected airways.
12. Change the primary layer name to Main Decline
13. Change the air type to Fresh
14. Change the airway dimensions to 5.5m x 5.5m
15. Apply the changes to the selected airways
Figure 17-16 Initial selection of all decline airways
Figure 17-17 Select and edit the decline airways
16. Repeat the above actions to set the other airways parameters for
shafts and sub-levels.

Ventsim Visual User Manual Page | 206
17. Finally, add fans, ventilation controls and stoppings to direct airflow
through the network.
Figure 17-18 Fresh and Exhaust Air Type colouring
18. To limit the view to the decline or shafts only using the layer control in
the display selection to control which layers are displayed.
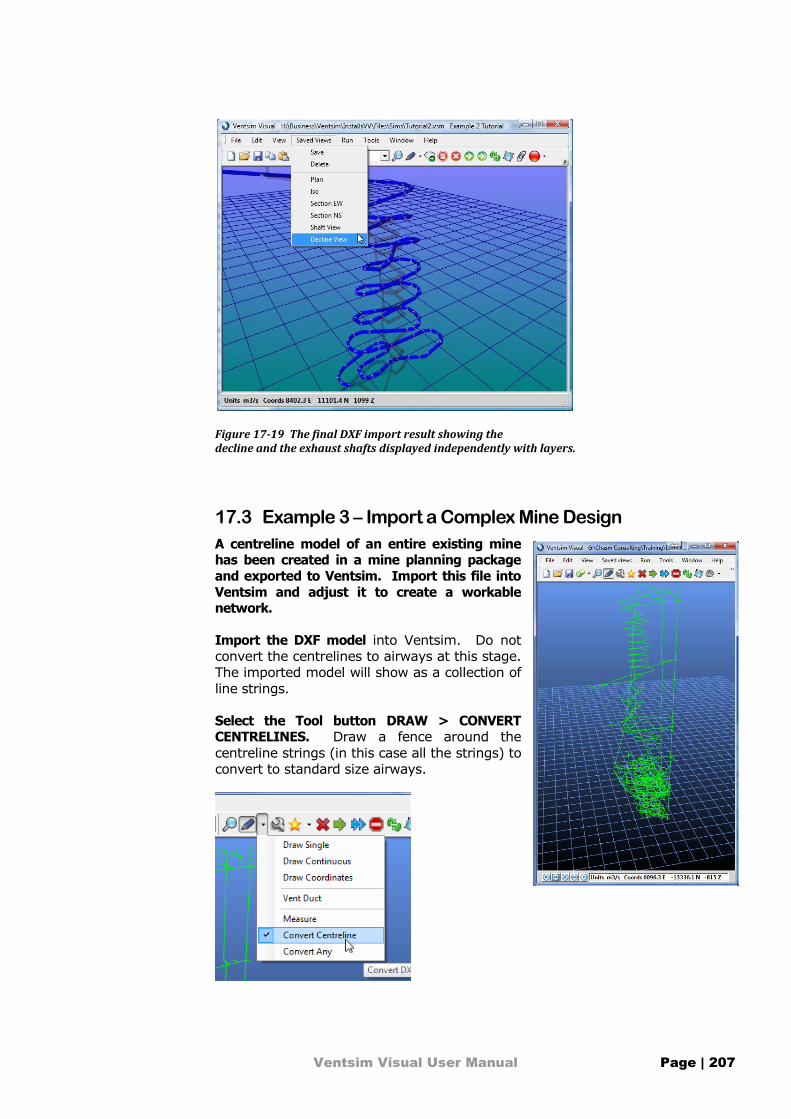
Ventsim Visual User Manual Page | 207
Figure 17-19 The final DXF import result showing the decline and the exhaust shafts displayed independently with layers.
17.3 Example 3 – Import a Complex Mine Design
A centreline model of an entire existing mine has been created in a mine planning package
and exported to Ventsim. Import this file into
Ventsim and adjust it to create a workable network.
Import the DXF model into Ventsim. Do not
convert the centrelines to airways at this stage.
The imported model will show as a collection of
line strings.
Select the Tool button DRAW > CONVERT CENTRELINES. Draw a fence around the
centreline strings (in this case all the strings) to
convert to standard size airways.
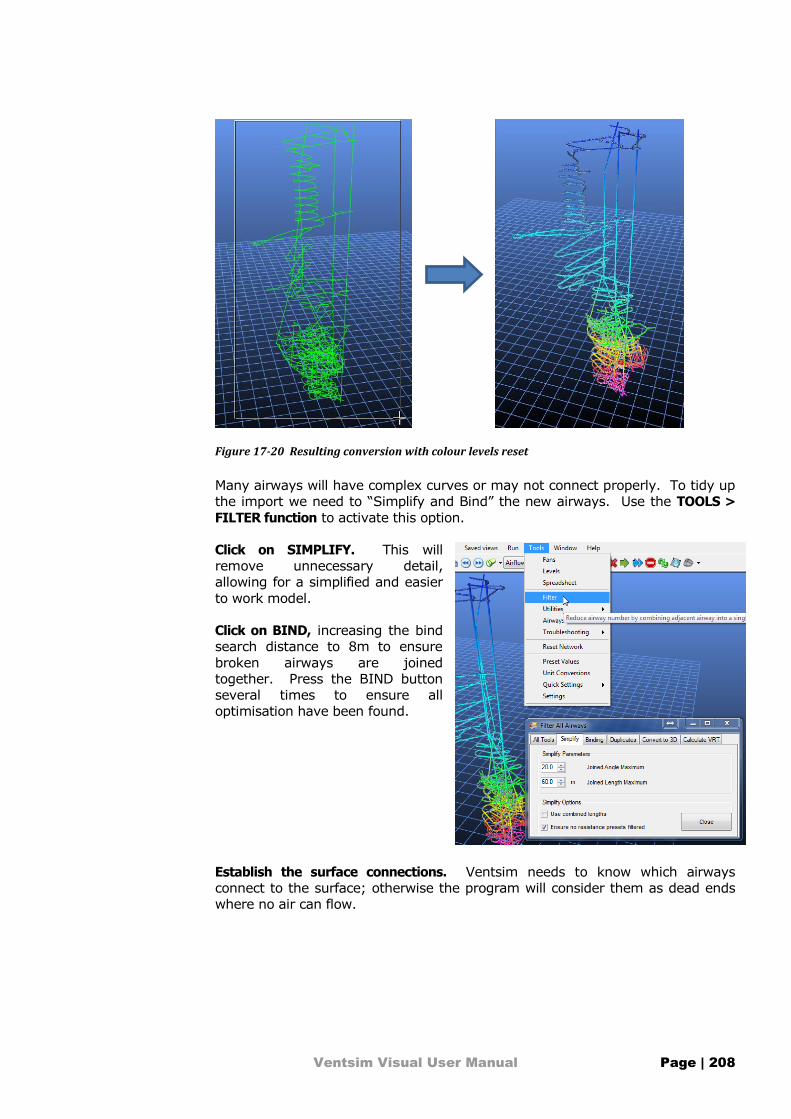
Ventsim Visual User Manual Page | 208
Figure 17-20 Resulting conversion with colour levels reset
Many airways will have complex curves or may not connect properly. To tidy up
the import we need to “Simplify and Bind” the new airways. Use the TOOLS >
FILTER function to activate this option.
Click on SIMPLIFY. This will
remove unnecessary detail,
allowing for a simplified and easier
to work model.
Click on BIND, increasing the bind
search distance to 8m to ensure
broken airways are joined
together. Press the BIND button
several times to ensure all
optimisation have been found.
Establish the surface connections. Ventsim needs to know which airways
connect to the surface; otherwise the program will consider them as dead ends
where no air can flow.

Ventsim Visual User Manual Page | 209
Establish airflow by placing a FIXED FLOW on one of the major surface
connections. At this stage we are not trying to simulate an actual fan
installation, but just trying to establish that air can travel through all airways in
the model.
Press SIMULATE. Many warnings will show
indicating airway dead ends which are not closed
off or connected to other airways. Ensure that
airflows are travelling through parts of the mine
where is should travel. Use the flow animation
and/or airflow colouring to indicate good and bad
flow areas. If areas are not flowing air and that
should be flowing air, check for any breaks in
airways through the region and SIMULATE again
after any changes.
Once airflow is correctly established (at
this stage we are not interested in
establishing accurate airflows, just making
sure air has an open connected pathway to
follow), then SELECT all of the airways
which are still showing NO EXIT / ENTRY
warnings, EDIT the airways and select
CLOSE ENDS in the Edit Box.
Figure 17-21 Airways coloured by airflow

Ventsim Visual User Manual Page | 210
SIMULATE again. No errors or warnings should show. If they do, repeat the
search for airway error and simulate again.
The model is now ready to be correctly sized, with all fans and ventilation
controls established. Select and change the airways and set them to the correct
size. Insert fans and control in proper positions. If desired, use LAYERS and
text names to help improve accessibility to your model.

Ventsim Visual User Manual Page | 211
18 APPENDIX A – Glossary of Terms
18.1 A glossary of commonly used terms
An section of underground tunnel defined by two end points.
An airway
TAB Separated Value - a text file format used by Ventsim when saving files. This
format can also be read into Spreadsheets, Word Processors and databases.
Drawing Exchange Format - An AutoCAD graphics file format that can be
imported and exported by most CAD and Mining Software packages. Ventsim
can also import or export data in this format.
The start or end of an airway, defined by an x, y and z coordinate, which gives
its position in space in three dimensions.
same as friction power, with the kilowatt value converted to a dollar cost per
annum, based on the default power cost.
Atkinson’s friction factor, describing the roughness or unevenness of a wall. It
directly affects the resistance of an airway. Friction factors are measured to a
specific air density, normally normalised to 1.2.kg/m3
A component of pressure drop along an airway caused by the airway resistance.
Derived from the friction loss, this estimates (in kilowatts), the amount of energy
lost due to the resistance of an airway on the airflow.
The simulation method used by Ventsim Visual™ to perform the calculation of
airflows in a network. It uses an iterative estimation method that adjusts the
airflows through a network until the estimation errors lie within acceptable limits.
Ventsim Visual™ Advanced uses a modified method which takes into account
density changes and mass flow balances.
A point defining where two or more airway ends share the same position.
Airflow at this point can split or join, depending on airflow direction.
Estimation of how much load or weight an airway pressure loss would develop
across a resistance. It is often used for determining load on a vent door or
bulkhead and is calculated by the pressure loss times by the drive or resistance
area..
A point defining the end or junction of an airway(s)
The action of sliding the network graphics to a new screen position by using the
right mouse button.
The loss of air pressure along a length of airway due to friction loss, fans, fixed
pressures or fixed quantities etc.
A value describing the difficulty air will have moving down an airway. It is
derived from a combination of airway size, friction factor, length, shock losses
and air density.
18.1.1 Airway
18.1.2 Branch
18.1.3 TXT
18.1.4 DXF
18.1.5 Endpoint / Start
point
18.1.6 Friction cost
18.1.7 Friction factor or
k factor
18.1.8 Friction loss
18.1.9 Friction power
18.1.10 Hardy- Cross
Method
18.1.11 Junction
18.1.12 Load (Pressure)
18.1.13 Node
18.1.14 Pan
18.1.15 Pressure loss
18.1.16 Resistance
Ventsim Visual User Manual Page | 212
A factor that estimates the effect a change in drive direction or size has on
airflow. Any such change will increase turbulence in an airflow, and hence
develop energy losses that can be equated to an increase in airway resistance.
Ventsim Visual™ uses shock loss as an extra length added on to the original
drive length (i.e. the higher the shock loss, the greater the equivalent length),
which in turn increases the overall airway resistance.
Thermal diffusivity is the ratio of thermal conductivity to volumetric heat
capacity. Substances with high thermal diffusivity rapidly adjust their
temperature to that of their surroundings, because they conduct heat quickly in
comparison to their volumetric heat capacity or 'thermal bulk'
Thermal conductivity, k, is the property of a material that indicates its ability to
conduct heat. It appears primarily in Fourier's Law for heat conduction.
The ratio of area of wet airway surface to dry airway surface. A fully wet surface
is defined as ‘1.0’ while a fully dry surface is defined as ‘0.0’
Relative humidity describes the amount of water vapour that exists in a gaseous
mixture of air and water. It is defined as the ratio of the partial pressure of
water vapour in the mixture to the saturated vapour pressure of water at a
prescribed temperature. Relative humidity is normally expressed as a percentage
The density of a material is defined as its mass per unit volume. The density of
air influence many psychrometric properties. Te density of rock influences heat
transfer and thermal capacity behaviour.
18.1.17 Shock loss
18.1.18 Thermal
Diffusivity
18.1.19 Thermal
Conductivity
18.1.20 Wetness
Fraction
18.1.21 Relative
Humidity
18.1.22 Density

Ventsim Visual User Manual Page | 213
19 Appendix B – Summary Data Types
19.1 Summary of the major data types
Available from the data selection menus in the menu bar. Note that additional data and data subsets are available in the spreadsheet view.
The type of category of air in the network. Originally designed for specifying
fresh, exhaust and undetermined air within a network, Ventsim Visual allows
custom catagories for air types, set from within the Edit menu. When specified
in the Colour Manager, airtype will show different colours for different air types.
The volume flow rate of air through an airway
The average speed of airflow through an airway across the cross sectional area
The average air density along an airway. For vertical shafts, this is the air
density mid way along the shaft.
The mass flow of air through an airway. This is a function of volume flow and air
density.
The increase in pressure provide to a network system by an external source,
such as a fan or fixed flow.
The fan static pressure equivalent of the pressure boost.
The pressure or force against an airway resistance converted to an equivalent
‘weight’
The total pressure loss along and airway between entry and exit. Pressure loss
may consist of airway friction pressure losses, due to wall friction factors and
additional resistances placed in the airway
The relative pressure differential between underground airway and the surface,
standardised to the surface elevation. A relative pressure differential of zero,
would result in no flow from a connecting airway to the surface. A negative
relative pressure would see air flow from the surface to the underground airway
if a path was present. A positve relative pressure would see air flow from
underground to the surface if a path was present.
The pressure reported in atmospheric units of an underground airway, corrected
to surface elevation. The correction removes the effect of elevation on pressure,
and permits a relative assessment between airways at different elevations.
19.1.1 Air types
Airtype
19.1.2 Airflow
Quantity
Velocity
Density
Mass Flow
19.1.3 Pressure
Pressure Boost
Pressure BoostStatic
Pressure Regulator Load
Pressure TotalLoss
Pressure Relative
Pressure Absolute

Ventsim Visual User Manual Page | 214
The true pressure reported in total atmospheric units including the elevation
effects on total pressure. Barometric pressure increases with depth, where no
other pressure influences are present.
The loss of pressure along an airway due to wall friction. This ignores any other
resistances in the airway such as doors or stoppings.
Compares density differences of a column of mine air with an equivalent column
of atmospheric air and applies a pressure differential. Every airway with a
different entry and exit elevation has potential to have some natural ventilation.
Ventsim Visual uses a +(ve) number convention to describe upwards (buoyant)
natural ventilation and –(ve) to show downward (sinking) natural ventilation.
Note that by default, atmospheric density is adjusted for temperature gradient (lapse) rate, in much the same way as auto compression can drive changes in underground temperature at different elevations. Inlet airways at different elevations will have different temperatures which are derived from the standard elevation and default surface temperature. This function can be turned off in the settings if desired.
Total airway resistance along an airway. The resistance is standardised to the
surface density, and includes any additional resistance added by the user such as
doors and stoppings.
Resistance due to airway wall friction along an airway. It does not include any
additional resistances added.
The shock value reported as either a shock factor (X) or an equivalent airway
length. Both factor types add additional resistance to an airway, and increase
pressure loss due to air turbulence caused by a bend, change of size or other
obstruction. The shock length type can be set in the setting menu.
Atkinsons friction factor describing the uneveness of an airway wall, resulting in
near surface turnulence and increase airway resistance. Friction factors are
standardised to the surface density.
The size of an airway width and height as the centre section.
The perimeter of an airway, calculated from the centre height and width, taking
into account the airway shape profile. The perimeter can also be set directly
from the edit menu.
The area of an airway, calculated from the centre height and width, taking into
account the airway shape profile. The area can also be set directly from the edit
menu.
The true length of an airway, used to calculate airway resistance and heat
transfer. It does not include additional shock lengths if specified.
Report the coordinates of an airway in eastings, northing and elevation.
Pressure Barometric
Pressure FrictionLoss
Natural Ventilation
19.1.4 Airway
Attributes
Resistance
Resistance Wall
Shock
Friction Factor kfactor
Dimensions
Perimeter
Area
Length
Coordinates

Ventsim Visual User Manual Page | 215
The friction loss along an airway converted to an equivalent theoretical work
load. This value does not include power efficiencies which would result if the
pressure loss was to be overcome electrically.
The friction loss along an airway converted to an equivalent theoritical work load
per unit length. Because the loss is standardised to a unit length, this value is
independent of the actual length of the airway.
The electrical input power into a network to generate pressure and airflow. The
power input includes efficiency losses due to fan blade efficiency but does not
include motor efficiency losses.
The theoretical cost of the power loss due to friction converted to an annual
electrical cost, based on the power cost set in the Settings.
The theoretical cost of the power loss per unit length due to friction converted to
an annual electrical cost, based on the power cost set in the Settings. Because
the loss is standardised to a unit length, this value is independent of the actual
length of the airway.
The electrical input power by a fan or theorectical fix flow into a network to
generate pressure and airflow. The electical input includes both fan or fix
efficiency factors and an electrical motor efficiency factors specified in the
Settings.
Psycrometric properties of air decribing the temperature a volume of air would
have if cooled adiabatically to saturation at constant pressure by evaporation of
water into it.
Psycrometric property of air describing the temperature of air measured by a
thermometer freely exposed to the air but shielded from radiation and moisture.
An older index of heat stress still commonly used. Ventsim Visual uses Basic
Effective Temperature. Wet or Dry bulb temperatures below 20 degrees celcius
or above 36 degrees celcius should be treated with caution as the Effective
Temperatures are not normally calculated beyond these limits, and Ventsim only
provides a correlated estimate. The Effective Temperature is defined as the
temperature of still saturated aur which would give the same thermal feel as the
actual environment being consdered. The Air Cooling Power methods described
below are generally considered to provide a better index of cooling.
The dew point is the temperature to which a given parcel of air must be cooled,
at constant barometric pressure, for water vapor to condense into water.
cooling power of mine air determines the capacity of the ambient atmosphere to
dissipate the metabolic heat generated by humans. The cooling power is
measured in W/m2 (amount of heat removes from the human body per second
per unit surface area) to keep skin temperature (ACPM method) or body core
19.1.5 Energy, Power
Cost
Power Loss
Power Loss/L
Power Input
Head Cost
Head Cost/L
Fan/Fix Cost
19.1.6 Thermo -
dynamics
Wet bulb
Dry bulb
Effective Temperature
Dew point
Cooling Power

Ventsim Visual User Manual Page | 216
temperature (TWL method) below safe limits. It is dependent mainly on the wet
bulb temperature and the air velocity.
TWL Method. Developed in Australia and based on body core temperature limits,
the Thermal Work Limit method has been developed from a physiological basis
and ratified by the Australian Institute of Occupational Hygienists (AIOH). It has
been adopted by most Australian mines, and uses standard clothing and sweat
factors. The method ideally requires globe temperatures for accurate resutls. As
these are not available from a simulation, the TWL may be underestimated for
workers around radient heat sources such as machinery or hot rock.
ACPM Method. Developed in the USA, the Ar Cooling Power (M scale) method is
based around limiting skin temperature factors as an indicator to body core
temperature. The method is in use in most North American mines. Results are
highly dependent on clothing and work output factors. Ventsim Visual initially
defaults to standard light clothing. Again the method ideally requires globe
temperatures for accurate resutls. As these are not available from a simulation,
the ACPM may be underestimated for workers around radient heat sources such
as machinery or hot rock.
Kata Method. Developed in South Africa, the Kata cooling method uses the wet
bulb and air velocity to develop a heat stress index representing cooling ability of
the air.
The sum of sensible heat and latent heat in a substance above a base
temperature, typically zero (0) degree Celcius or 32 degrees Fahrenheit. Sigma
Heat is independent of dry bulb temperature, relying only on wet bulb
temperature and pressure to derive it value.
Similar to Sigma heat, it is the sum of the total heat content of a unit weight of
air (including the water vapour) at typically zero (0) degree Celcius or 32
degrees Fahrenheit. Unlike Sigma Heat, it does not however take into account
the adiabatic saturation process, and is therefore not as useful pscrometrically.
The sum product of air ‘mass’ flow and Sigma Heat along an airway. The value
is useful to determine the amount of heat an airflow has gathered or lost along
an airway.
Relative humidity describes the amount of water vapour that exists in a gaseous
mixture of air and water. It is defined as the ratio of the partial pressure of
water vapour in the mixture to the saturated vapour pressure of water at a
prescribed temperature. Relative humidity is normally expressed as a percentage
The unit mass of moisture per unit mass of dry air
The volume flow rate of moisture condensed from an airflow (normally due to
refrigeration or pressure drop up a shaft)
Sensible plus Latent heat from all airway heat sources per unit length
Sensible heat from all airway heat sources per unit length
Latent heat from all airway heat sources per unit length
Sensible heat from all airway heat sources
Sigma Heat
Enthalpy
Energy Flow
Relative Humidity
Moisture Content
Condensate
Heat Added/L
Sensible Heat/L
Latent Heat/L
Sensible Heat

Ventsim Visual User Manual Page | 217
Latent heat from all airway heat sources
Heat added or removed by the user, excluding strata heat input.
The internal array number of an airway, reference by Ventsim Visual. Ventsim
Visual™ will report this number during error description. The airway number
may change as airways are added or removed from the network.
A unique number assigned to every airway, that does not change when airways
are added or removed. As a result, the numbers may not be sequential and may
have large gaps in the sequence.
The layer nane and number of an airway primary layer
The layer nane and number of an airway secondary layer
Contaminant simulated concentrations through a network. The value is unit
independent and is normally relative in concentration to the original set values.
The time in seconds that contaminant takes to appear in airways downstream
from the source. The time is calculate by an average cross-sectional speed
along all airways. It does not take into account the changing velocity profile, or
incomplete mixing at junctions. As a result, it is likely in most cases, that a
smaller portion of the contaminant will arrive at an airway location ahead of the
predicted time.
The portion of a contamination that has tranvelled along upstream airways to
the location of the set contaminant. The value is a ratio of the airflow that
contributes to the total volume of air flowing through the contaminant source
airway.
Weight per unit volume of diesel particulate matter in a volume of air.
Thermal conductivity of rock in the airway.
Density of rock in the airway.
The specific heat of rock in the airway
The fraction of wet to dry surface of the rock in the airway. A fraction of one (1)
represent fully wet, while zero is dry.
The age of the rock since exposed by mining in either decimal years (eg 2005.5
Latent Heat
External Heat
19.1.7 Identifiers
Airway Number
Unique ID Number
Primary Layer
Secondary Layer
19.1.8 Contaminants
Spread Mix
Spread Time
Source Mix
Diesel Particulate Matter
19.1.9 Rock Properties
Conductivity
Density
Specifc Heat
Wetness Fraction
Age

Ventsim Visual User Manual Page | 218
= end June 2005) or by a fixed relative age (eg 4.5 = 4.5 years or 4 years and 6
months)
The thermal diffusivity of rock within an airway.
Thermal Diffusivity
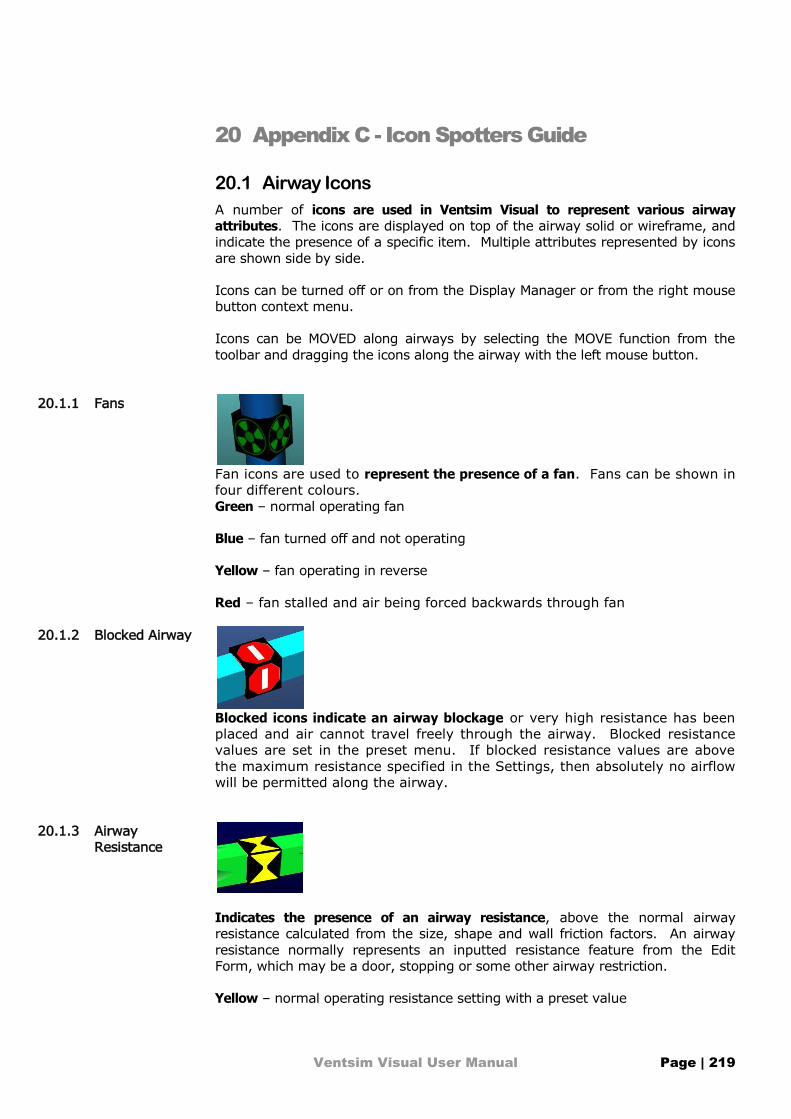
Ventsim Visual User Manual Page | 219
20 Appendix C - Icon Spotters Guide
20.1 Airway Icons
A number of icons are used in Ventsim Visual to represent various airway
attributes. The icons are displayed on top of the airway solid or wireframe, and
indicate the presence of a specific item. Multiple attributes represented by icons
are shown side by side.
Icons can be turned off or on from the Display Manager or from the right mouse
button context menu.
Icons can be MOVED along airways by selecting the MOVE function from the
toolbar and dragging the icons along the airway with the left mouse button.
Fan icons are used to represent the presence of a fan. Fans can be shown in
four different colours.
Green – normal operating fan
Blue – fan turned off and not operating
Yellow – fan operating in reverse
Red – fan stalled and air being forced backwards through fan
Blocked icons indicate an airway blockage or very high resistance has been
placed and air cannot travel freely through the airway. Blocked resistance
values are set in the preset menu. If blocked resistance values are above
the maximum resistance specified in the Settings, then absolutely no airflow
will be permitted along the airway.
Indicates the presence of an airway resistance, above the normal airway
resistance calculated from the size, shape and wall friction factors. An airway
resistance normally represents an inputted resistance feature from the Edit
Form, which may be a door, stopping or some other airway restriction.
Yellow – normal operating resistance setting with a preset value
20.1.1 Fans
20.1.2 Blocked Airway
20.1.3 Airway
Resistance

Ventsim Visual User Manual Page | 220
Green – a custom resistance value entered specifically for that airway
Red – a preset resistance operating on a reversal resistance value, which has
been activated by a reversing airflow and a ‘restrict reversal’ option specified for
the airway in the EDIT form.
Fixed airflow placed in airway.
Green – once simulated, green indicates the fixed airflow is acting as a
positive pressure, i.e. it is contributing towards overall pressure in the mine
network
Red – once simulated, red indicates the fixed airflow is retarding normal
airflow, and reducing pressure – i.e. it is acting as a resistance and
contributing to overall pressure loss in the network.
Fixed pressure source placed in the airway.
Green –green indicates the fixed pressure is acting as a positive pressure,
i.e. it is contributing towards overall pressure and flow in the mine network
Red – red indicates the fixed pressure is negative and retarding normal
airflow – i.e. it is acting as a resistance and contributing to overall pressure
loss in the network.
Indicates a contaminant report has been placed within the airway. A
Contaminant Find simulation will use this report to indicate pathways of
contaminants and potential sources of the contaminant.
Indicates a fresh air report has been placed within the airway. A Contaminant
Find simulation will use this report to indicate pathways of fresh air through the
mine.
20.1.4 Fixed Airway
20.1.5 Fixed Pressure
20.1.6 Contaminant
Report
20.1.7 Fresh Air Report
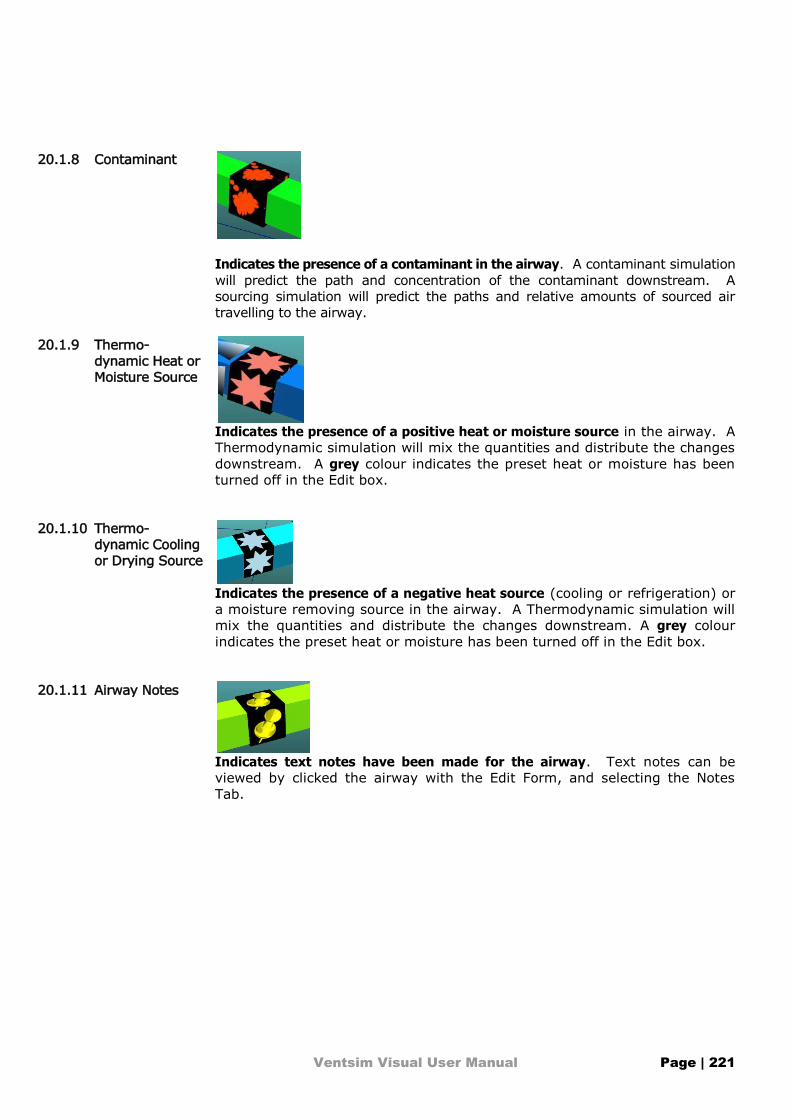
Ventsim Visual User Manual Page | 221
Indicates the presence of a contaminant in the airway. A contaminant simulation
will predict the path and concentration of the contaminant downstream. A
sourcing simulation will predict the paths and relative amounts of sourced air
travelling to the airway.
Indicates the presence of a positive heat or moisture source in the airway. A
Thermodynamic simulation will mix the quantities and distribute the changes
downstream. A grey colour indicates the preset heat or moisture has been
turned off in the Edit box.
Indicates the presence of a negative heat source (cooling or refrigeration) or
a moisture removing source in the airway. A Thermodynamic simulation will
mix the quantities and distribute the changes downstream. A grey colour
indicates the preset heat or moisture has been turned off in the Edit box.
Indicates text notes have been made for the airway. Text notes can be
viewed by clicked the airway with the Edit Form, and selecting the Notes
Tab.
20.1.8 Contaminant
20.1.9 Thermo-
dynamic Heat or
Moisture Source
20.1.10 Thermo-
dynamic Cooling
or Drying Source
20.1.11 Airway Notes

Ventsim Visual User Manual Page | 222
21 APPENDIX D – Display Problems
Occasionally the user may find that the graphics displayed on the computer
screen are not as intended. The following section will step through some
common problems and resolutions
21.1 Hardware Problems
A large variety of graphics cards exists on the market today. While each type of card should perform in the same way (although some faster than others), there are many different manufacturers and software drivers that may cause differences in expected performance.
Chasm Consulting tests a wide variety of different cards to ensure optimum performance where possible.
If an issue exists, often updating the software driver from the card manufacture can help resolve issues. Due to the low price of 3D graphics cards, if the computer or graphics card is very old (greater than 5 years), it may be better to upgrade the computer or replace the graphics cards with a newer type.
The screen remains blank, or shows corrupted data when resuming from screen
savers or hybernation. This is caused by the graphics card failing to send the
correct message to Ventsim to enabled Ventsim to reset the card and restore the
graphics.
In most cases the screen can be recovered by using the VIEW > REFRESH menu
items. In extreme cases the software may need to be shutdown and restarted.
Updating the graphics cards software drivers can often help in this case.
Alternatively, disable the screen saver / hybernation, and allow the computer to
simply turn off the monitor instead.
Only newer graphics cards fully support this image smoothing feature. Older
graphics cards, particular INTEL motherboard types, do not support it. Low
power graphics solutions from ATI or NVIDIA may support it, but graphics
performance will slow.
No solution. Install a newer vidia card which supports full screen anti-aliasing.
Only newer graphics cards fully support custom icons. Older graphics cards
(particularly INTEL) do not have sufficient memory pointers to support the
placement of potentially tens of thousands of icon images on the screen,
therefore support for these cards has been disabled.
No solution. Install a newer vidia card which supports full screen anti-aliasing.
21.1.1 Screen fails to
display after
coming out of
‘sleep /
hybernation’
Resolution
21.1.2 Anti-aliasing
does not work /
is very slow
Resolution
21.1.3 Custom Icons
cannot be used
Resolution

Ventsim Visual User Manual Page | 223
21.2 Software Problems
Occasionally, the screen will not display graphics as expected. This can stem from a wide range of settings in Ventsim which may not be set correctly to display the desired graphics.
The airways may be hidden or invisible, or located off the screen.
Use the VIEW > FIT ALL command to make sure the grpahics are relocated to
the screen. If no graphics show, use the VIEW > SHOW ALL, to turn on all
hidden layers and levels. If still no graphics show, ensure that airways are still
present in the model, by running the RUN > SUMMARY memory options and
counting airways.
Finally, make sure that options such as VIEW > HIDE ZERO FLOWS, and VIEW >
HIDE EXCLUDED AIRWAYS are no turned on.
Ventsim is optimised for high speed display of English only ASCII characters.
This high speed display option allows faster movement and rotation of items with
text.
If Ventsim is installed in another language (for example Spanish, Russion or
Chinese), an alternative text rendered is used which will display other UNICODE
international characters, but at reduced speed.
If an English installation of the software is required to display international text
characters on the screen, the TOOLS > SETTINGS > GRAPHICS > USE FAST
TEXT RENDERING should be turned OFF.
The screen may only display the raw airways, but no other information.
The option to display text or arrows may be turned off (press ‘T’ or ‘A’
respectively to turn back on). If this does not work, the LIMIT command may be
turned on. This command hides text / nodes / arrows if the airways is not
specifically set on the EDIT form to show DATA. Turn the LIMIT option off using
the ‘L’ button.
21.2.1 No Graphics
Shown on
Screen
Resolution
21.2.2 Some text is
shown as
‘????????” on
the screen.
Resolution
21.2.3 I can see
airways, but no
text / arrows /
nodes Resolution

Ventsim Visual User Manual Page | 224
22 APPENDIX E – Simulation Errors
The following messages may be
shown if errors are present during
network simulation. To select and
view an airway with an error, simply
click the error value in the Error List
Box at the lower right corner of the
screen. The select multiple airways
for editing in Ventsim, click on the
items (hold CTRL to select multiple
items) and click SELECT.
22.1 Warnings
Warnings can generally be ignored, as the simulation will complete despite the warnings. They may however be a sign of a more serious problem, and should still be investigated.
There is no airway entering the airway, therefore no airflow can be carried. The
airway is not connected to the surface, marked as a closed end, and Ventsim
Visual™ cannot find a solution to reverse it. The program can be set to ignore
these warnings in the Settings – Airflow Simulation menu.
Simply connect an airway to the entry, connect the airway to the surface, or
marked as a closed end in the Edit Box.
As with no entry warning.
As with no entry warning description.
An airway stopping has been placed in series with another airway stopping. Only
one stopping is required.
None required, although a stopping can be removed if desired.
A fan has been placed directly in series with another fan. The pressure
imbalance between the fan curves may cause difficulty in resolve the network,
partiulcarly if one fan is operating outside of its specified fan curve.
Recommmend removing a fan, or ensuring an alternative airway path is
available to help ‘bleed’ pressure between fans.
Thermodynamic simulation is having difficulty resolving temperature balance
between two airways. This may happen at extremes of temperature or
pressure.
Investigate what is causing high / low temperatures (eg high heat or
refirgeration loads, coupled with low airflows). Resolve problem if possible. The
22.1.1 no entry airway
or surface
connection
Resolution
22.1.2 no exit airway or
surface
connection
22.1.3 no entry or exit
22.1.4 airway stopping
redundant
Resolution
22.1.5 fan directly
interfering with
another fan
Resolution.
22.1.6 temperature
balancing issue
Resolution.

Ventsim Visual User Manual Page | 225
Settings menu can be set to ignore this program, but this is generally not
recommended.
The fan is operating at too higher pressure / low volume, beyond the limits of
the fan curve.
None required, however fans should not be made to run outside the curve.
Ventsim Visual™ must ‘guess’ a result, which could lead to errors.
The fan is operating at too low pressure / high volume, beyond the limits of the
fan curve.
None required, however fans should not be made to run outside the curve.
Ventsim Visual™ must ‘guess’ a result, which could lead to errors or air balancing
issues. To remove the warning, increase the resistance the fan operates at, or
extend the fan curve down to zero pressure.
The fan offering no additional pressure to the network, and may actually be
retarding airflow.
None required, however fans should not run as negated. Ventsim Visual™ must
‘guess’ a result, which could lead to errors or air balancing issues. In most
cases, fan negation occurs as a result of other fans drawing air through the fan
at a flow above the maximum fan curve quantity. To remove this warning,
consider removing or switching off the fan.
22.2 Errors
Errors will generally halt a simulation process, and must be corrected before a valid simulation can occur.
An airway set as ‘restricted reverse’ in the Edit box was attempted to be
reversed by the simulation. As a result, the simulation is halted.
This function is designed to warn the user about airways which should not have
reversed airflow. To remove this error, simply unclick the option in the Edit Box
for the airway.
An design in a netwok has resulting in a huge buildup of pressure, beyond
allowable levels. This causes the simuliation calculation to corrupt and
breakdown. Because Ventsim uses somes of the results of previous simulations
for current calculations (for example fan pressures are used to help calculate air
density), this may corrupt future simulations as well
Allow Ventsim Visual™ to automatically reset the network. The network can also
be manually reset from the Tools Menu. The cause of the pressure buildup
should be investigated. It usually stems from overuse or restriction of fixed
airflow, or too many high resistance (bulkheads) blocking off a working part of
the model and restricting flow balanacing. Occasionally it may be due to airways
not being connecting properly, restricting movement of air, which can be
resolved with the Tools > Filter > Bind command.
22.1.7 stalled fan
Resolution
22.1.8 low pressure fan
Resolution.
22.1.9 negated fan
Resolution.
22.2.1 airway
attempted to
reverse Resolution
22.2.2 Anomolous
pressures
Resolution

Ventsim Visual User Manual Page | 226
An airway with te same entry and exit location as another airway has been
created.
Allow Ventsim Visual™ to delete the duplicate airway.
An airway has a fixed flow placed in line with another fixed flow, resulting in a
conflict between the two flows, or a fix flow is placed in a locaton where it cannot
draw air.
Remove one of the fixed flows, or ensure a path between the flows exists to
balanced the flow difference. Ensure there are no breaks in any airways leading
to or from the fixed flow, through which airflow cannot travel.
An airway has a fixed flow placed where the air cannot travel through.
Check to ensure pathways before and after the fix are connected to the network
or surface, and can freely flow air, and no blocked resistances are present in the
pathways before or after the fix. Airways that are not exactly connected cannot
carry airflow. While a no entry/exit warning will normally highlight these
airways, if ‘allow closed end’ has been selected, then no warning will show, and
the problem may be difficult to find. Try the wireframe mode with nodes
displayed if this is a problem.
A fan has been placed in an airway through which no air can flow.
As with ‘fix stopped’, check to ensure restricting blocked resistances are not
present, and the airways before and after the fan can carry air.
The network cannot find a resolution in the network airflow balance.
Ensure fans are not running stalled or negated, and no unusual pressures or
flows exist within the network.
Temperature is increasing or being reduced beyond the allowable range.
Investigate what is causing high / low temperatures (eg high heat or
refirgeration loads, coupled with low airflows). Ensure airflow is adequate for
heat addition or removal amounts. Reduce heat input if possible, or increase
airflow.
A general error in estimating thermal properties occurred. This normally occurs
where air temperatures or pressures are welll outside of the expected range.
Investigate what is causing high / low temperatures (eg high heat or
refirgeration loads, coupled with low airflows). Ensure airflow is adequate for
heat addition or removal amounts. Reduce heat input if possible, or increase
airflow.
Duplicate airway
Resolution
22.2.3 Fixed flow
cannot be
achieved
Resolution
22.2.4 fix stopped
Resolution
22.2.5 operating fan
blocked Resolution
22.2.6 convergence
problem
Resolution
22.2.7 temperature
outside
allowable range
Resolution
22.2.8 heat estimation
error
encountered
Resolution

Ventsim Visual User Manual Page | 227
An error estimate transfer of heat flux from rock strata surface to airflow. This
may happen where an extremely low airflow exists, or temperature or moisture
values in the air are unusually high or low. Where airflow is less than the error
correction value in the air simulaton settings, Ventsim will not attempt to solve
heat balance, and will simply assume the air temperature becomes the same as
the virgin rock temperature.
Increase airflow through airway, or increase tolerance of massflow setting in the
Settings menu, to ignore airways with low flow.
Pressure building up unacceptably over a high resistance airway, or a fan or fixed
flow running into a high resistance airway. This error may occasionally show up
when simulating Ventsim Classic 3.9 networks with Ventsim Visual.
Investigate and remove the source of the high pressure (fan or fix) or remove
the high resistance causing the buildup in pressure. Unlike Ventsim Classic 3,
which ignore this error, this situation is unacceptable to Ventsim Visual, as it
adversely affects air densities and heat buildup, and in nearly all cases is a result
of user input error. Pressure above 15000 Pa are generaly used as a trigger for
this error.
A resistance has been placed in the same airway as a fan, and the fan is being
unreasonably restricted. This is a common practise in Ventsim Classic 3.9
networks to stop airflow through a fan. In Ventsim Visual, it can cause
overpressure and heat buildup, and is therefore no longer permitted.
Turn the fan OFF instead from the EDIT form, of remove the fan. If the fan is
turned OFF, click on SELF CLOSING if you want to ensure air does not leak back
through the fan.
Similar to overpressure across resistance, but the error code will target the
airway with the fan or fix, not the resistance.
Changing the fan or fix, or alternatively removing the high resistance will correct
the problem.
Ventsim Visual™ cannot resolve of pressure or airflow volume during simulation
Ensure no unusually airways, fan pressure or pathways exist within the network
model.
No fan static pressure curve is available for the fan, but a static curve has been
selected in the Edit Box or the Settings Menu.
Enter a fan static pressure curve for the fan, or ;
change the Edit Box setting to a Fan Total Curve (FTP), or ;
change the Global Fan Pressure method in the Settings menu to Total Pressure
Method.
22.2.9 temp estimation
near rock
surface
Resolution
22.2.10 overpressure
across
resistance
Resolution
22.2.11 operating fan
restricted by
resistance
Resolution
22.2.12 fix being over
restricted
Resolution.
22.2.13 unresolved
pressure or flow
Resolution
22.2.14 fan static P
curve invalid,
check fan
Resolution

Ventsim Visual User Manual Page | 228
No fan total pressure curve (FTP) is available for the fan, but a total curve has
been selected in the Edit Box or the Settings Menu.
Enter a fan total pressure curve for the fan or;
Change the Edit Box setting to a Fan Static Curve (FSP), or;
Change the Global Fan Pressure method in the Settings menu to Static Pressure
Method.
22.2.15 fan total P curve
invalid, check
fan
Resolution

Ventsim Visual User Manual Page | 229
23 APPENDIX F – Shortcut Keys
A number of keyboard strokes exist to assist in rapid selection of commonly used functions. Most menu items have the shortcut key next to the menu item. Below
is a general summary of common key strokes
CTRL N New File CTRL O Open File CTRL M Merge File CTRL I Inherit File Attributes CTRL S Save File CTRL F File Note CTRL C Clone Attributes
CTRL V Apply Attributes CTRL L Lock On Target (Toggle) CTRL T Lock On Transparency (Toggle) CTRL Q Quick View LEFT Arrow Move to previous Quick View RIGHT Arrow Move to next Quick View HOME Fit All INSERT Insert Node PAGE UP Select / Move Up one elevation level (if defined) PAGE DOWN Select / Move Down one elevation level (if defined) END Show ALL elevation levels DEL Enter delete mode (select / fence airways to delete) BACKSPACE UNDO CTRL Z UNDO TAB REDO F1 HELP F2 Plan / Section Views (Toggle to cycle through views) F3 FIND ( Toggle to repeat last find command) F4 FIND and HIGHLIGHT found airways F5 Simulation Airflow F6 Simulation Thermodynamic F7 Hide / Show Zero Flow airways F9 Transparencies on/off F12 Save As T Show / Hide text data L Show / Hide limited data Z Zoom Mode D Draw or Add airway mode E Edit Mode S Select Mode M Move Mode C Copy Mode B Block Mode (for blocking / unblocking airways) R Reverse Mode (for reversing airways) Z Zoom Out P Perspective / Orthogonal Mode Toggle W Toggle between Wireframe and Solids G Display / Hide Grid N Display / Hide Nodes A Display / Hide Arrows I Display Hide Icons

Ventsim Visual User Manual Page | 230
24 Appendix Table of Figures
Figure 3-1 Ventsim Visual™ Main Window ....................................................................................................................... 20 Figure 3-2 The Edit Plane, shown with the SHIFT key pressed ......................................................................................... 23 Figure 3-3 True Vertical Line showing top and bottom airways lining up ........................................................................ 24 Figure 3-4 True Vertical Guide Line helps guide a shaft vertically into the airway below ................................................. 24 Figure 3-5 Picture showing inclined airway being drawn down ....................................................................................... 25 Figure 3-6 Coordinate entry system .................................................................................................................................. 26 Figure 3-7 Example of copying a selected group of airways ............................................................................................ 27 Figure 4-1 Main view window .......................................................................................................................................... 30 Figure 4-2 Master File Options ......................................................................................................................................... 32 Figure 4-3 File Security Options ........................................................................................................................................ 36 Figure 4-4 An example of a Ventsim Visual™ Text File Loaded into Microsoft Excel ........................................................ 37 Figure 4-5 Import Option form showing DXF import options. ........................................................................................... 38 Figure 4-6 Export to DXF Options ..................................................................................................................................... 40 Figure 4-7 Reference Graphics Manager ........................................................................................................................... 40 Figure 4-8 Automatic License Activation and Release ...................................................................................................... 42 Figure 4-9 Find Airway Data ............................................................................................................................................. 46 Figure 4-10 Examples of using ‘Select All’ and ‘Select Level’ ........................................................................................... 48 Figure 4-11 Example of unlimited text display .................................................................................................................. 52 Figure 4-12 Example of Limited Text Display .................................................................................................................... 52 Figure 4-13 Example showing a ventilation fan recirculating air ..................................................................................... 55 Figure 4-14 : Financial Simulator Output showing life of mine airway costs .................................................................... 56 Figure 4-15 Example of a Financial Simulation Table ....................................................................................................... 57 Figure 4-16 Global Optimisation ...................................................................................................................................... 59 Figure 4-17 Example of Summary Output with Description ............................................................................................. 61 Figure 4-18 Mine Summary Graphs .................................................................................................................................. 61 Figure 4-19 Fan Curve Entered into Ventsim Visual ......................................................................................................... 62 Figure 4-20 Spreadsheet view of network with selected data ......................................................................................... 66 Figure 4-21 Filtering Tools Combined ................................................................................................................................ 67 Figure 4-22 The simplify dialog box .................................................................................................................................. 68 Figure 4-23 Binding Tools .................................................................................................................................................. 69 Figure 4-24 Duplicate Finding Tools .................................................................................................................................. 70 Figure 4-25 Filter Airways ................................................................................................................................................ 71 Figure 4-26 Conversion Table ........................................................................................................................................... 74 Figure 4-27 Preset Table Options ..................................................................................................................................... 75 Figure 5-1 Preset Settings................................................................................................................................................. 77 Figure 6-1 Airway Default Settings ................................................................................................................................... 81 Figure 6-2 Colour Setting Options .................................................................................................................................... 82 Figure 6-3 Graphics Setting Options ................................................................................................................................. 84 Figure 6-4 Graphics Setting Options ................................................................................................................................. 84 Figure 6-5 Orthogonal Display ......................................................................................................................................... 86 Figure 6-6 Perspective Display ......................................................................................................................................... 86 Figure 6-7: Costing Options ............................................................................................................................................... 87 Figure 6-8 Ventsim Visual™ Settings ................................................................................................................................ 89 Figure 6-9 Simulation Heat Settings ................................................................................................................................. 94 Figure 6-10 Simulation Environment Settings ................................................................................................................... 98 Figure 6-11 Simulation Contaminant Settings ................................................................................................................ 102 Figure 6-12 Ventsim Visual™ General Settings............................................................................................................... 103 Figure 7-1 Find specific airways ..................................................................................................................................... 106 Figure 7-2 Select a data category, followed by a data type ........................................................................................... 106 Figure 7-3 Manual airway drawing options ................................................................................................................... 108 7-4 The Vent Duct Builder Dialog Box ............................................................................................................................. 109 7-5 Example of duct built with automatic leakage paths................................................................................................ 110

Ventsim Visual User Manual Page | 231
Figure 7-6 Multi Selection Options .................................................................................................................................. 111 Figure 7-7 Deletion options ............................................................................................................................................ 112 Figure 7-8 An airway stopping ....................................................................................................................................... 112 Figure 7-9 Contaminant placing options ........................................................................................................................ 114 Figure 7-10 Display Manager Settings ........................................................................................................................... 115 Figure 7-11 Setting Active Layer (Crusher) Display with the Display Manager. ............................................................. 116 Figure 7-12 Copy and Paste attribute options selection................................................................................................. 117 Figure 7-13 The Colour Manager sub menu .................................................................................................................... 120 Figure 7-14 Animation Speed Control ............................................................................................................................ 121 Figure 7-15 Contaminant Options .................................................................................................................................. 121 Figure 8-1 Edit Box Tabs .................................................................................................................................................. 124 Figure 8-2 Airway Edit Box Form .................................................................................................................................... 127 Figure 8-3 Set airway names and coordinates ............................................................................................................... 127 Figure 8-4 Set airway physical characteristics................................................................................................................ 128 Figure 8-5 Further Airway Options ................................................................................................................................. 129 Figure 8-6 Example of use of fresh / exhaust airway colouring ..................................................................................... 131 Figure 8-7 Resistance, Friction and Shock Factors.......................................................................................................... 132 Figure 8-8 Edit Box Fan Information............................................................................................................................... 134 Figure 8-9 The Edit Box Heat Entry Tab (Advanced Version Only) ................................................................................. 138 Figure 8-10 Heat Cooling and Moisture Settings ........................................................................................................... 138 Figure 8-11 Rock Condition entry for airways ................................................................................................................ 141 Figure 8-12 Heat Simulation Information....................................................................................................................... 142 Figure 8-13 Edit Box Contaminant Input ........................................................................................................................ 143 Figure 8-14 Airway Information Tab ............................................................................................................................... 145 Figure 8-15 Heat Data .................................................................................................................................................... 147 Figure 8-16 Recording sheet for entering general airway information .......................................................................... 148 Figure 9-1 Airflow Calculator # 1 .................................................................................................................................... 149 Figure 9-2 Airflow Calculator # 2 .................................................................................................................................... 150 Figure 9-3 Diesel Heat Estimator .................................................................................................................................... 150 Figure 9-4 Diesel Fuel Consumption Assistant ................................................................................................................ 151 Figure 9-5 Electric motor heat estimation....................................................................................................................... 152 Figure 9-6 Heat Assistant Screen .................................................................................................................................... 152 Figure 10-1 Save Views................................................................................................................................................... 154 Figure 10-2 Network example before level selection ..................................................................................................... 155 Figure 10-3 Network example after level selection ........................................................................................................ 156 Figure 11-1 Example of a Closed Network ..................................................................................................................... 159 Figure 11-2 Example of an Open Network ..................................................................................................................... 159 Figure 11-3 Example show the effect of the Simplify Function to reduce airway data .................................................. 163 Figure 11-4 Example of import error after simulation resulting from misaligned ends or unjoined nodes ................... 164 Figure 11-5 Example showing ventilation duct into blind heading. ............................................................................... 165 Figure 11-6 Manufacturers Fan Curve entered into Ventsim Visual .............................................................................. 167 Figure 12-1 Example of contaminant sourcing narrowing down a smoke source. ........................................................ 176 Figure 13-1 Inline Concentration (represented by the green icon) ................................................................................. 178 Figure 13-2 Example of Injected Gas .............................................................................................................................. 179 Figure 13-3 Run the gas simulation option .................................................................................................................... 180 Figure 13-4 Change the text and colour to show gas concentrations ............................................................................ 180 Figure 14-1 Example of Heat in mine calculated by Ventsim after simulation ............................................................... 183 Figure 14-2 Example of an inline cooler chilling ALL airflow .......................................................................................... 187 Figure 14-3 Example showing same inline cooler chilling only 40% airflow................................................................... 188 Figure 15-1 Diesel Equipment with DPM emissions in Preset Values .............................................................................. 191 Figure 15-2 Diesel heat and DPM source placed in airway ............................................................................................. 192 Figure 15-3 Example showing DPM simulation colouring through mine ........................................................................ 192 Figure 16-1 High Cost Airways coloured to show clearly ............................................................................................... 194 Figure 17-1 Establish a level elevation database ........................................................................................................... 196 Figure 17-2 Set the starting edit location ....................................................................................................................... 197

Ventsim Visual User Manual Page | 232
Figure 17-3 Enter the starting elevation of the drawing (edit) plane ............................................................................. 197 Figure 17-4 Construct and initial ‘flat’ decline loop ....................................................................................................... 198 Figure 17-5 Example Move the decline loop nodes by offsetting the elevation ............................................................. 198 Figure 17-6 Copy the selected decline loop to lower levels and repeat .......................................................................... 199 Figure 17-7 Construct a shaft to the surface .................................................................................................................. 199 Figure 17-8 Draw multiple levels for the mine ............................................................................................................... 200 Figure 17-9 Edit the airway to set the airway size ......................................................................................................... 201 Figure 17-10 Add a fixed airflow to the airway .............................................................................................................. 201 Figure 17-11 Use the Edit – Info to view airway flow, pressure and power ................................................................... 201 Figure 17-12 Colouring showing contamination spread time in seconds ....................................................................... 202 Figure 17-13 Initial imported DXF strings in Ventsim Visual .......................................................................................... 203 Figure 17-14 The Level Elevation database .................................................................................................................... 204 Figure 17-15 Set airway layer names ............................................................................................................................. 204 Figure 17-16 Initial selection of all decline airways........................................................................................................ 205 Figure 17-17 Select and edit the decline airways ........................................................................................................... 205 Figure 17-18 Fresh and Exhaust Air Type colouring ....................................................................................................... 206 Figure 17-19 The final DXF import result showing the ................................................................................................... 207 Figure 17-20 Resulting conversion with colour levels reset ............................................................................................ 208 Figure 17-21 Airways coloured by airflow ...................................................................................................................... 209