version 4 for windows nex t. welcome to sphinxsurvey version 4,4, the integrated solution for all...
TRANSCRIPT
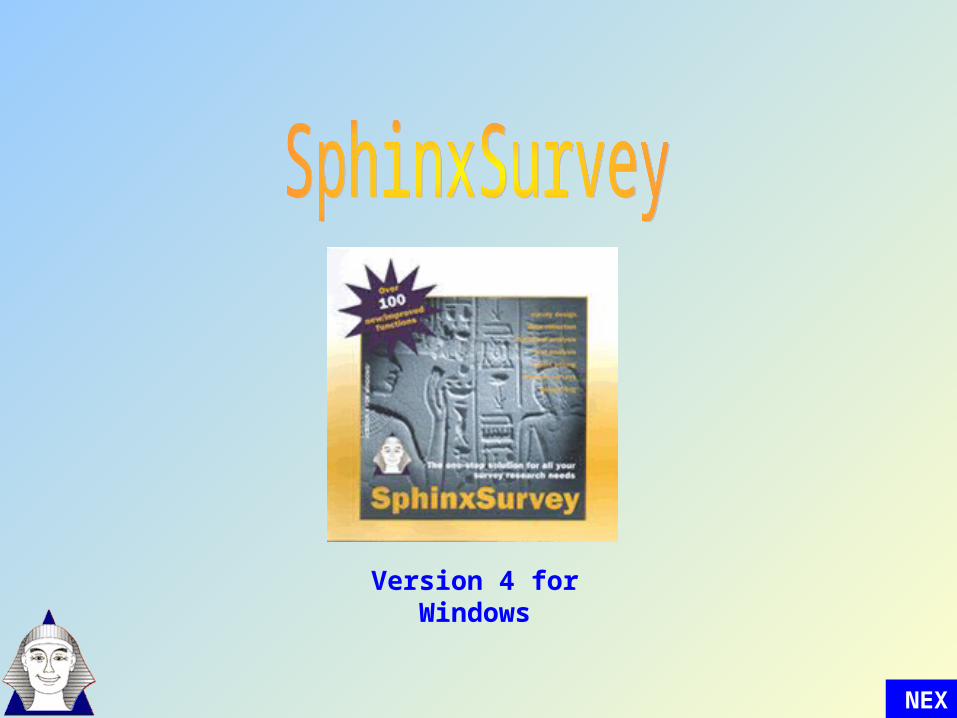
Version 4 for Windows
NEXT
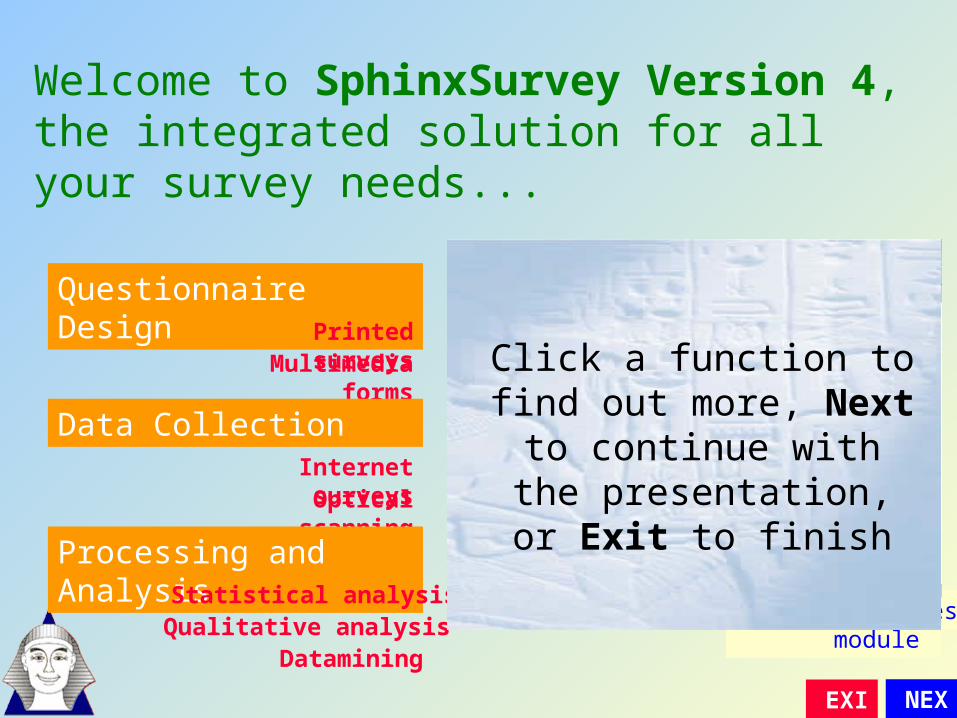
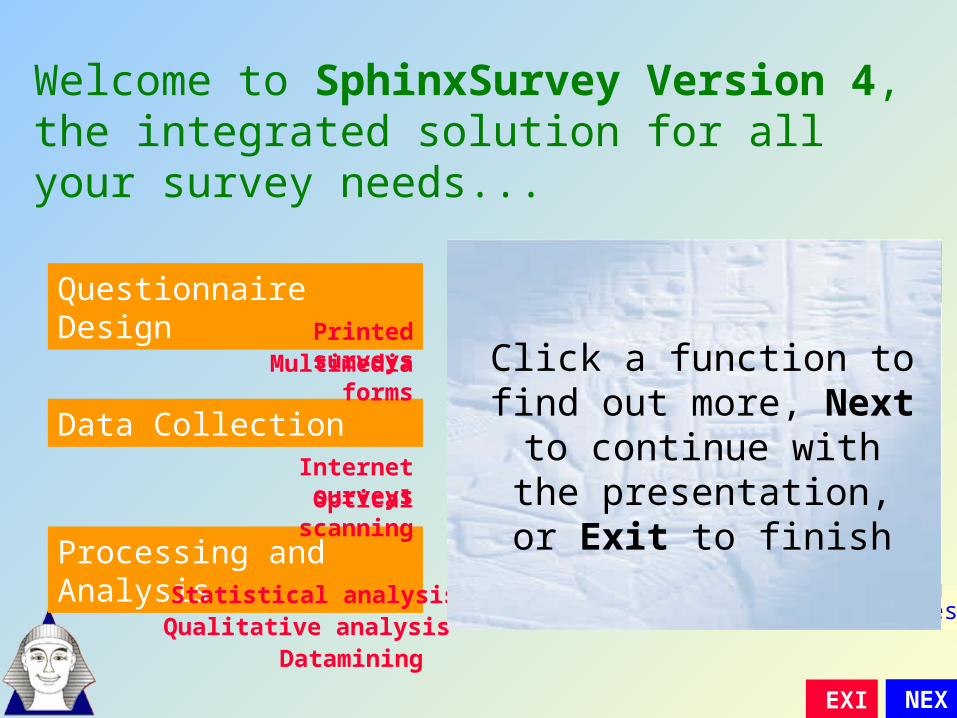
Welcome to SphinxSurvey Version 4,the integrated solution for all your survey needs...
Question list
Questionnaire DesignPrinted surveys
Page layout
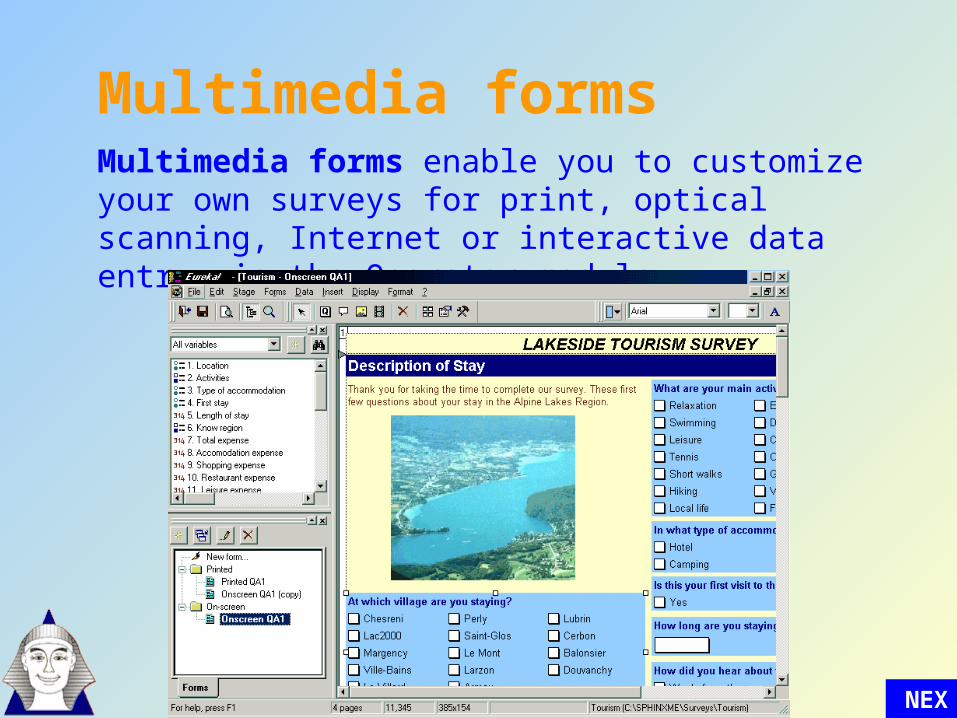
Multimedia forms
Multimedia form
NEXT
Data Collection
Rapid entry
Internet surveys
Operator module
Optical scanning
Scanner module
Processing and Analysis
Automatic examinationStatistical analysis
Principal components analysisQualitative analysis
Lexical analysis
Datamining
Graphic tables
Click a function to find out more, Next to continue with the
presentation, or Exit to finish
EXIT
Questionnaire Design
NEXT

Fast and effective...
Questionnaire Design
Integration of questionnaire design, data entry and analysis in the same package
All questions included can be analyzed in a meaningful way
Choice of question types, page layout, etc.Question library helps the rapid generation of
comprehensive and compatible surveysMultimedia form design for the construction of
Internet and other interactive surveys
NEXT

Creating a survey
NEXT
Create a new questionnaire, or
Adapt an existing questionnaire modelGive the survey a name and description
Begin by defining the main sections or writing the first question

NEXT
Question definitionUse the Question definition dialogue to write questions, including question wording, variable name, variable type, response modalities, question library, scoring and data entry controls...

NEXT
Question listUse the Question list to organize the survey with question groups, conditional jumps, restrictions, sections...

Page layout
NEXT
The Page layout dialogue lets you prepare printed surveys with minimum effort. Questionnaires can also be exported to MS Word or converted to multimedia forms...
Multimedia forms
NEXT
Multimedia forms enable you to customize your own surveys for print, optical scanning, Internet or interactive data entry via the Operator module...

Graphic tables
Welcome to SphinxSurvey Version 4,the integrated solution for all your survey needs...
Questionnaire Design
Data Collection
Processing and Analysis
Printed surveysMultimedia
forms
Internet surveysOptical
scanning
Statistical analysisQualitative analysis
Datamining
NEXT
Click a function to find out more, Next to continue with the
presentation, or Exit to finish
EXIT

Data Collection
NEXT
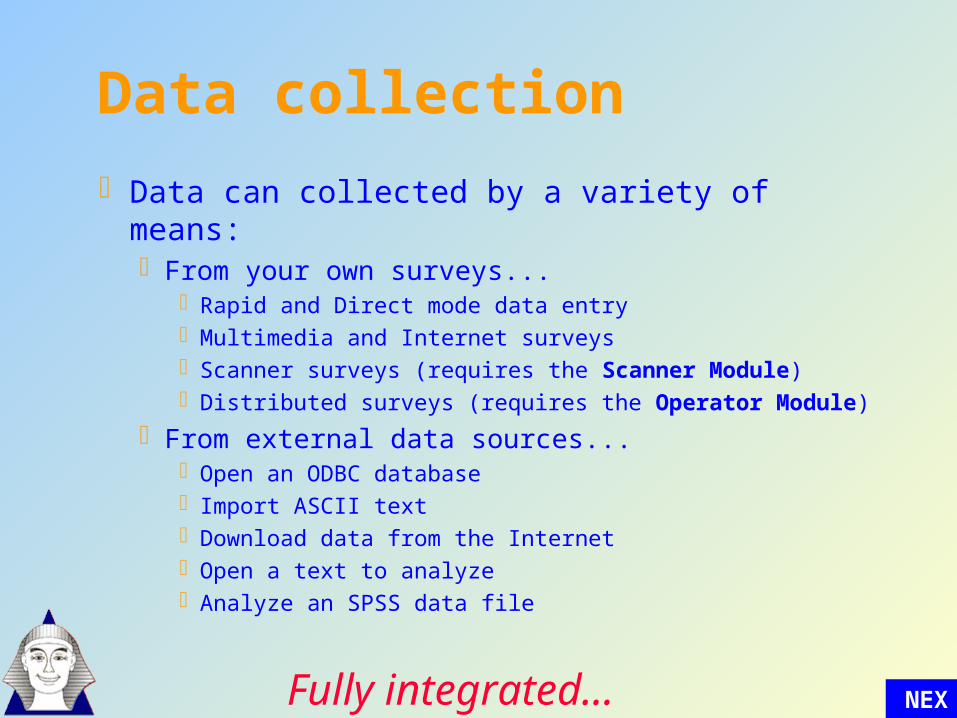
Data collection
Data can collected by a variety of means:From your own surveys...
Rapid and Direct mode data entryMultimedia and Internet surveysScanner surveys (requires the Scanner Module)Distributed surveys (requires the Operator Module)
From external data sources...Open an ODBC databaseImport ASCII textDownload data from the InternetOpen a text to analyzeAnalyze an SPSS data file
Fully integrated... NEXT

Manual data entryThe Rapid and Direct entry modes offer fast and efficient manual coding of responses...
Rapid entry - 1 observation per screenDirect entry - 1 question per screen
NEXT
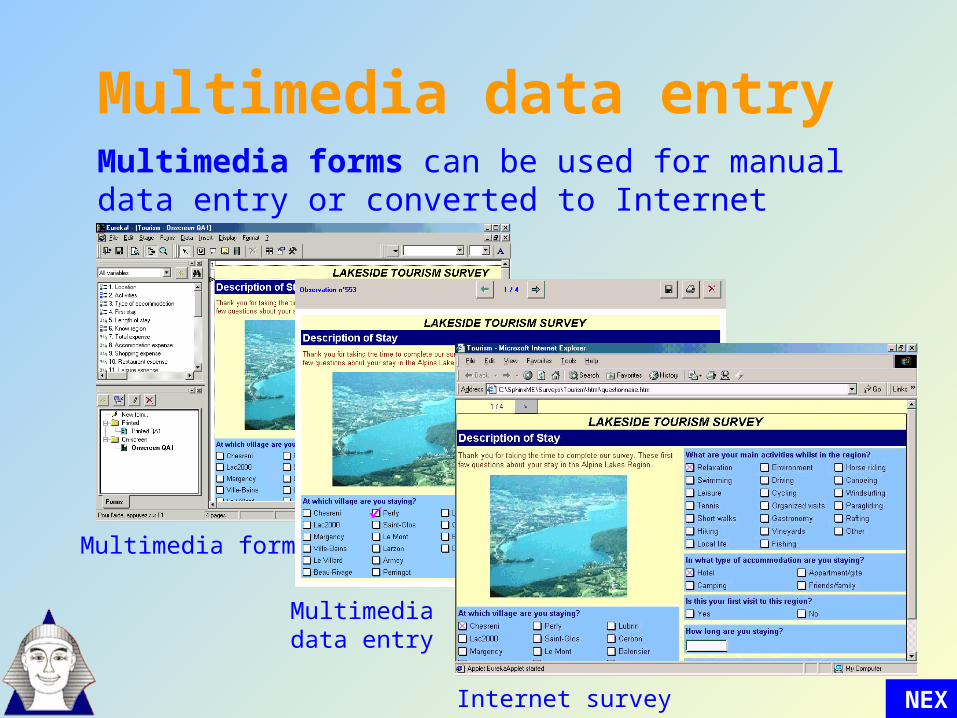
Multimedia data entry
NEXT
Multimedia forms can be used for manual data entry or converted to Internet questionnaires...
Multimedia form
Multimediadata entry
Internet survey

Surveys by scanner
NEXT
The Scanner Module can be used to convert Multimedia forms to Scanner questionnaires...
Create the multimedia form for scanning
Print the questionnaire
Scan and verify responses
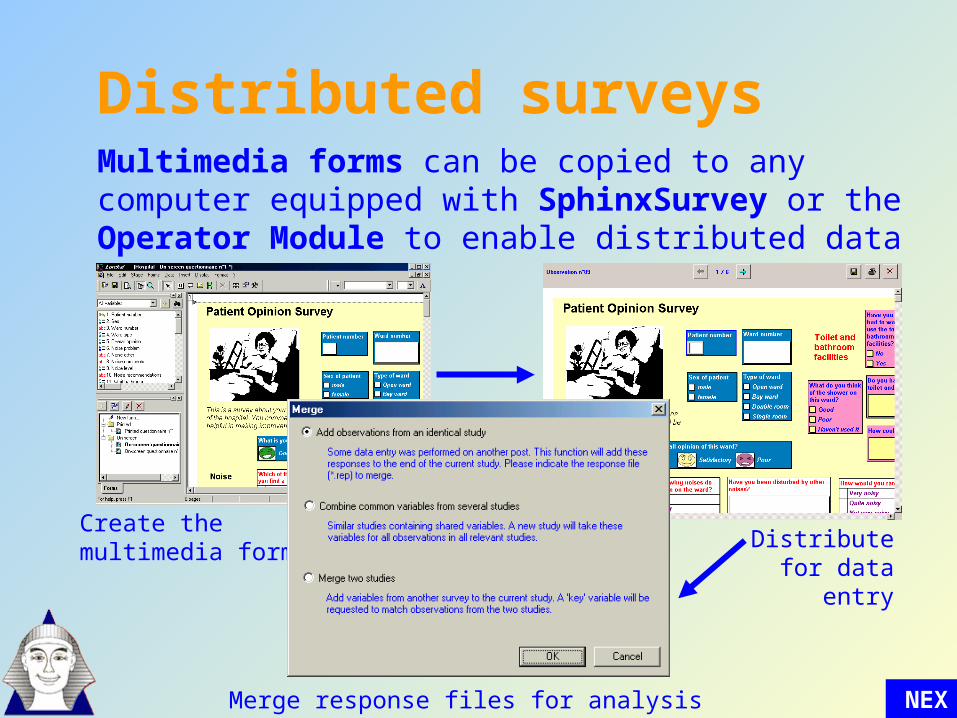
Distributed surveys
NEXT
Multimedia forms can be copied to any computer equipped with SphinxSurvey or the Operator Module to enable distributed data entry...
Create themultimedia form Distribute for
data entry
Merge response files for analysis
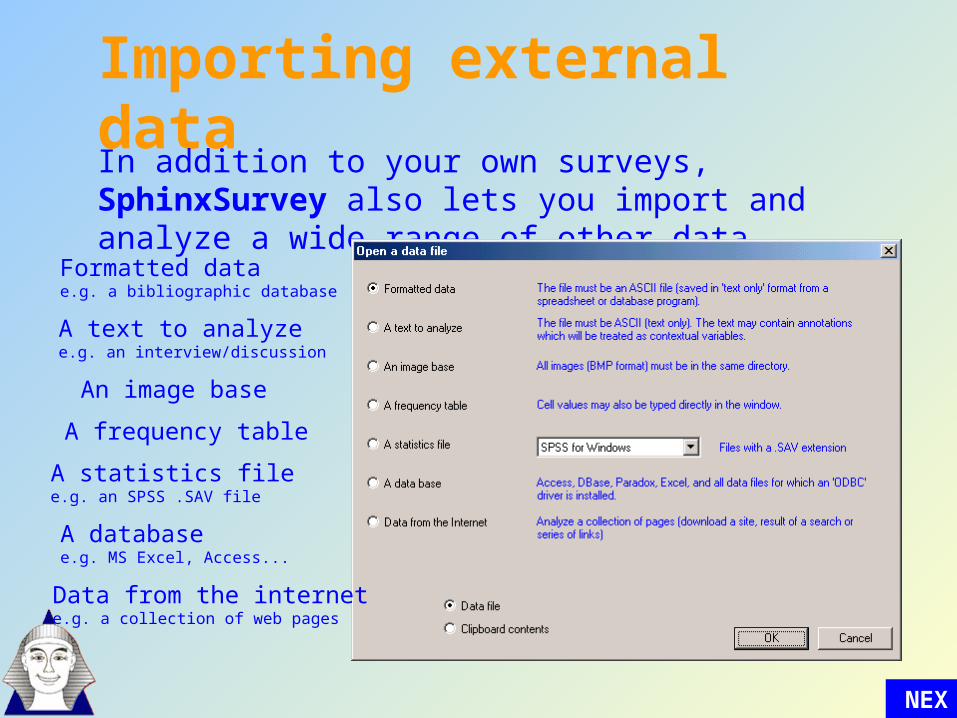
Importing external dataIn addition to your own surveys, SphinxSurvey also lets you import and analyze a wide range of other data...
Formatted datae.g. a bibliographic database
A text to analyzee.g. an interview/discussion
An image base
A frequency table
A statistics filee.g. an SPSS .SAV file
A databasee.g. MS Excel, Access...
Data from the internete.g. a collection of web pages
NEXT

Data managementTo facilitate your data management,
SphinxSurvey offers a range of functions:Manage a panel: merge user data from different
data setsRedress/define quotas: weight or extract
observations according to quotasChange statistical unit: split or group observations
by level of analysisQualify responses: replace non-responses with
more appropriate valuesAdditional tools: replace words/values, delete
duplicates, sort observations, compare response files, generate random responses
NEXT
A powerful data management and processing system...

Graphic tables
Welcome to SphinxSurvey Version 4,the integrated solution for all your survey needs...
Questionnaire Design
Data Collection
Processing and Analysis
Printed surveysMultimedia
forms
Internet surveysOptical
scanning
Statistical analysisQualitative analysis
Datamining
NEXT
Click a function to find out more, Next to continue with the
presentation, or Exit to finish
EXIT

Processing and analysis
NEXT

Processing and analysisSphinxSurvey offers powerful yet easy-to-use
quantitative analyses...Automatic examination - instant summary and descriptive
statistics at the click of a button
One-way and cross analyses -Chi2, T-test, Correlation...
Multivariate analysis - ANOVA, Factor analysis, Regression….
Datamining - Graphic tables, Decision trees, Relationship diagrams...
And numerous others - Characteristics table, Scoring…
As well as effective qualitative analysis…Verbatim analysis - sorting and presentation of response texts
Content analysis - manual recoding of texts
Lexical analysis - advanced text processing
The integrated data analysis solution...
NEXT

SphinxSurvey’s user-friendly analyses help you get straight to the key results without losing touch with the data...
Processing and analysis
Bank account
Yes
No
TOTAL OBS.
N°. ans. Percent.
197 98.5%
3 1.5%
200 100%
Summarize
Descriptive analyses at the click of a button
Analyze
Easy-to-interpret statistics
Characterize
Constant link to the data
Explore
TextScales
Numbers
Codes
Quantitative
Qualitative
Explore all types of data
Report
Write the report as you go... NEXT

Automatic examination
One-way tables
Bank
Non -response
BIGBUCKS
LOYALOAN
MONEYMAKER
NEIGHBOURHOOD
TRUSTEEBANK
Other
TOTAL OBS.
N°. ans. Percent.
2 1.0%
56 28.0%
33 16.5%
59 29.5%
54 27.0%
9 4.5%
8 4.0%
200
Non -response
2
BIGBUCKS
56
LOYALOAN
33
MONEYMAKER
59
NEIGHBOURHOOD
54
TRUSTEEBANK
9
Other
8
0
59
Pie-chart representation of 'Bank'
2
56
33
59
54
9 8
Non -response
BIGBUCKS
LOYALOAN
MONEYMAKER
NEIGHBOURHOOD
TRUSTEEBANK
OtherSummary
tables
1.Bank account
2.Bank
4.New account
5.Influences
7.Key services
8.Freshers Fair
15.Change
16.Motives to change
19.Image
20.Study year
22.Place of origin
Most quotedvalue label
2nd most quotedvalue label
Least quotedvalue label
Non-responses
Yes (197) No (3) (0)
MONEYMAKER (59) BIGBUCKS (56) Other (8) (2)
Yes (140) No (57) (3)
Existing account at ... (65) Parents bank (55) Radio Advertising (2) (9)
Overdraft facilities (121) Cashpoint location (105) Travel services (15) (13)
Yes (153) No (44) (3)
No (180) Yes (19) (1)
Cash and gift incent... (109) Lower service charge... (88) Other (11) (45)
Reliable bank (102) Practical bank (74) Bank for elderly peo... (6) (16)
1st year (141) 2nd year (46) Postgraduate (3) (1)
England (141) Wales (45) Ireland (1) (2)
3.Other bank
17.Other reason change
18.Improvements
21.Subject area
23.Other nationality
Non-response
Numberof words
Averagenumberof words
Number ofdifferentwords
Number of unique words
Maximumfrequency
The mostfrequent
word
191 18 2.00 5 1 9 Bank
190 39 3.90 25 21 2 Better
92 1226 11.35 321 211 40 more
1 260 1.31 34 10 51 EDUCATION
190 11 1.10 10 9 2 Africa
Group tables
9.FF Helpfulness
10.FF Organisation
11.FF Welcome
Non-response
very low low belowaverage
aboveaverage
high very high TOTAL
49 4 27 45 56 16 3 200
51 3 19 48 52 24 3 200
51 1 14 38 57 33 6 200
12.SBO Availability
13.SBO Understanding
14.SBO Welcome
Non-response
very low low belowaverage
aboveaverage
high very high TOTAL
72 9 10 26 35 35 13 200
72 9 7 34 34 30 14 200
72 8 6 31 36 35 12 200
Axis 1 (45.4%)
Axis 2 (32.1%)
BIGBUCKS
LOYALOAN
MONEYMAKERNEIGHBOURHOOD
TRUSTEEBANK
Other
Bank for young people
Bank for elderly people
Dynamic bank
International bank
Reliable bank
Open-minded bank
Practical bank
Cross tables
Image
Bank
BIGBUCKS
LOYALOAN
MONEYMAKER
NEIGHBOURHOOD
TRUSTEEBANK
Other
TOTAL
Bank foryoung
Bank forelderly
Dynamicbank
Internationa
Reliablebank
Open-minded
Practicalbank
TOTAL
8 1 7 10 27 10 15 78
1 3 1 3 21 5 11 45
9 2 2 4 28 9 28 82
2 0 4 6 25 4 23 64
0 1 0 1 6 1 4 13
0 2 2 1 4 1 1 11
20 9 16 25 111 30 82 293
BIG
BUC
8 1
7
10
27
10
15
LOY
ALO
1 3 1 3
21
5
11
MONE
YMAK
9 2 2 4
28
9
28
NEIGH
BOUR
2 4
6
25
4
23
TRUS
TEEB
1 1 6
1 4
Other2 2 1 4 1 1
Bank for young people Bank for elderly people
Dynamic bank International bank
Reliable bank Open-minded bank
Practical bank
0
82
At the click of a
button...
NEXT
Automatic examination gives an instant overview of your results...
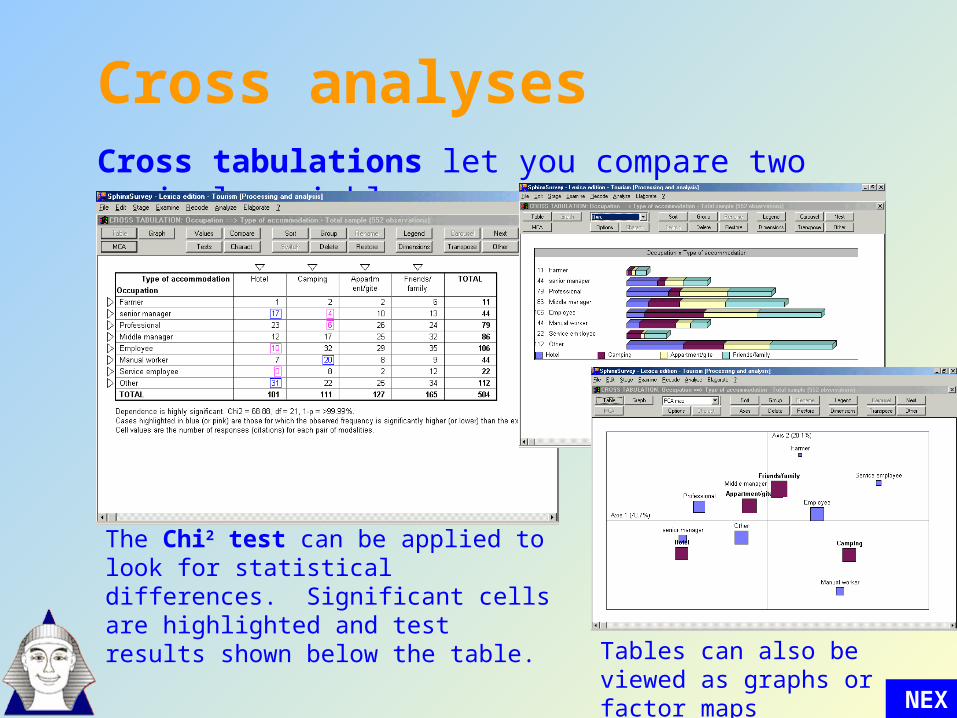
Cross analyses
NEXT
Cross tabulations let you compare two nominal variables...
The Chi2 test can be applied to look for statistical differences. Significant cells are highlighted and test results shown below the table.
Tables can also be viewed as graphs or factor maps
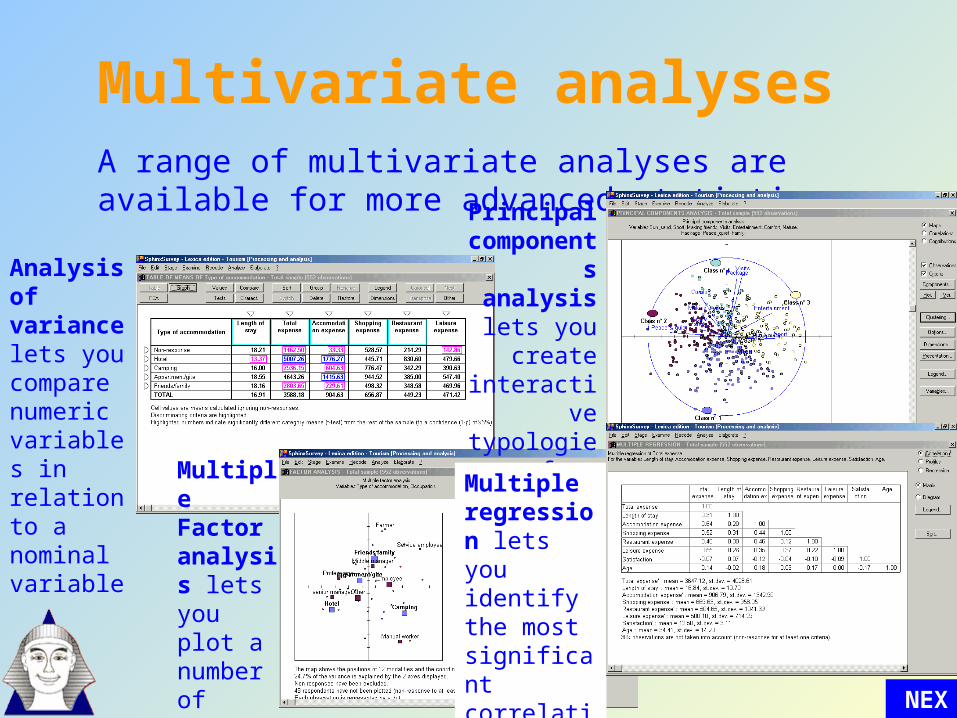
Multivariate analyses
NEXT
A range of multivariate analyses are available for more advanced statistics...
Analysis of variance lets you compare numeric variables in relation to a nominal variable
Multiple Factor analysis lets you plot a number of nominal variables on a map
Principal compone
nts analysis lets you
create interactive typologies
from numeric
variablesMultiple regression lets you identify the most significant correlations
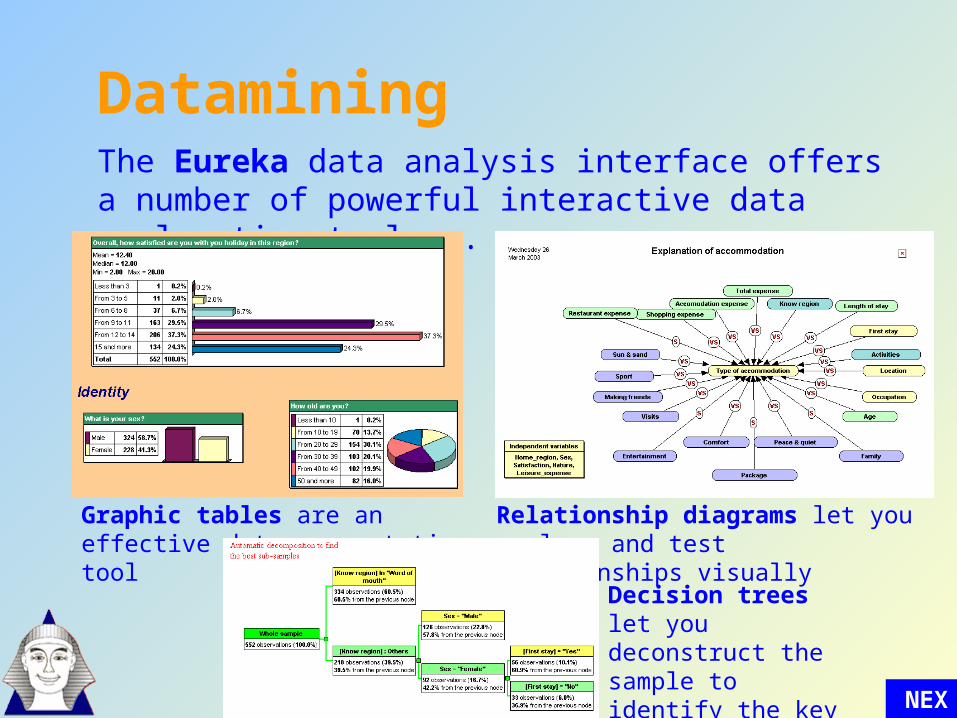
Datamining
NEXT
The Eureka data analysis interface offers a number of powerful interactive data exploration tools...
Graphic tables are an effective data presentation tool
Relationship diagrams let you explore and test relationships visually
Decision trees let you deconstruct the sample to identify the key elements
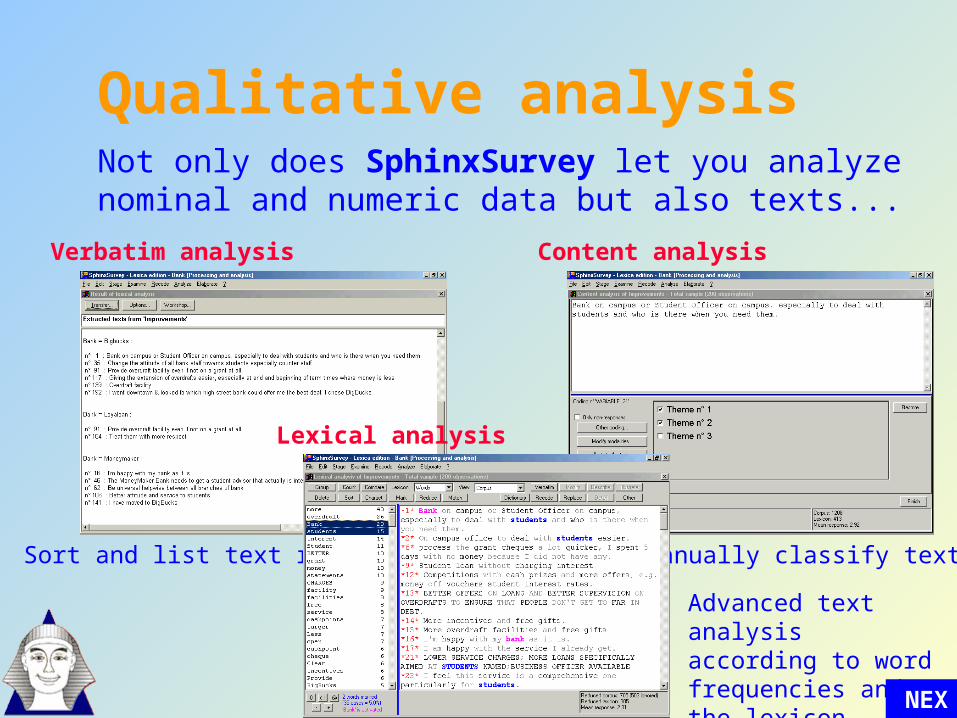
Qualitative analysisNot only does SphinxSurvey let you analyze nominal and numeric data but also texts...
Sort and list text responses
Verbatim analysis
Manually classify texts
Content analysis
Lexical analysis
Advanced text analysis according to word frequencies and the lexicon NE
XT
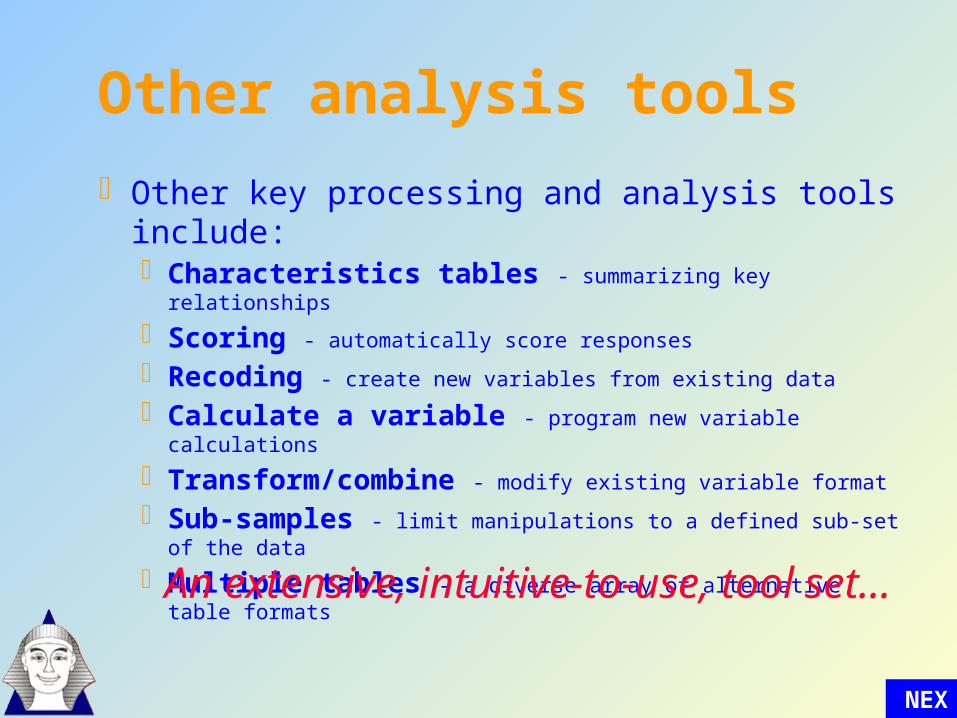
Other analysis tools
Other key processing and analysis tools include:Characteristics tables - summarizing key relationships
Scoring - automatically score responses
Recoding - create new variables from existing data
Calculate a variable - program new variable calculations
Transform/combine - modify existing variable format
Sub-samples - limit manipulations to a defined sub-set of the data
Multiple tables - a diverse array of alternative table formats
NEXT
An extensive, intuitive-to-use, tool set...
Graphic tables
Welcome to SphinxSurvey Version 4,the integrated solution for all your survey needs...
Questionnaire Design
Data Collection
Processing and Analysis
Printed surveysMultimedia
forms
Internet surveysOptical
scanning
Statistical analysisQualitative analysis
Datamining
NEXT
Click a function to find out more, Next to continue with the
presentation, or Exit to finish
EXIT
Le Sphinx Développement2003
RESTART
EXIT