vessel biofouling in hawaii: current patterns of a potent ... · smithsonian environmental research...
TRANSCRIPT

Vessel biofouling in Hawaii: current patterns of a potent marine bioinvasion vector and potential management solutions FINAL REPORT Ian Davidson & Greg Ruiz Smithsonian Environmental Research Center Sonia Gorgula Ballast Water & Hull Fouling Coordinator Division of Aquatic Resources Hawaii State Department of Land and Natural Resources December 2014

2
Vessel biofouling in Hawaii: current patterns of a potent marine bioinvasion vector and potential management solutions FINAL REPORT Report by: Ian Davidson & Greg Ruiz Smithsonian Environmental Research Center Sonia Gorgula Ballast Water & Hull Fouling Coordinator Division of Aquatic Resources Hawaii State Department of Land and Natural Resources A project of the Pacific Cooperative Studies Unit, University of Hawaii Manoa Funded by: Hau’oli Mau Loa Foundation As part of the: State Biofouling Risk Assessment Project Invasive Species Prevention in the State of Hawaii By the Hawaii Department of Land and Natural Resources (DLNR) and the ‘Coordinating Group on Alien Pest Species’ (CGAPS) of Hawaii A project of the Pacific Cooperative Studies Unit, University of Hawaii, Manoa Citation: Davidson I, Ruiz G, Gorgula S (2014) Vessel biofouling in Hawaii: current patterns of a potent marine bioinvasion vector and potential management solutions. Report to the Department of Land and Natural Resources (DLNR), Coordinating Group on Alien Pest Species (CGAPS), and the Hauoli Mau Loa Foundation. Honolulu, Hawaii. 40pp.

3
Vessel biofouling vectors and management in Hawaii
Executive Summary The State of Hawaii has a unique biological heritage that has inherent, cultural, ecological, and economic value. The islands’ geological history and biogeographic isolation provide a rich and distinct biodiversity that is threatened by introduced and invasive species. In marine habitats, ships and boats have been the dominant source of introductions of non-native species, some of which threaten native species, ecological processes, and economic interests. Biofouling – the animals and seaweeds that attach to the submerged portions of vessels – is a major source of marine invasion in Hawaii. This report examined the current patterns of vessel arrivals to Hawaii, vessel husbandry practices, and management options that may contribute to the state’s evaluation of prudent policy steps to reduce biosecurity vulnerability to this transfer mechanism. We examined the marine invasion history of the state, which highlighted the pivotal role vessel biofouling has played in introducing many of the states 346 introduced and cryptogenic species. We evaluated the shipping traffic to Hawaii, demonstrating some of the risk provided by arrivals from over 350 locations throughout the world. We assessed the current hull husbandry practices adopted by vessels that call to Hawaii (commercial and recreational), which showed how some existing patterns are likely to reduce biosecurity risks to the state (e.g. short inter dry-docking periods and growing awareness of biofouling management guidelines) while others contribute to a higher risk, including long lay-ups in overseas locations and extended periods with no maintenance action. Finally, we examined some research and monitoring priorities for marine biofouling invasions in Hawaii and compared the range of management options that the state could consider to tackle the risk of biofouling-mediated introductions. Research and monitoring are critical tools for managers tasked with invasion prevention, because the data generated promotes understanding of invasion patterns and decision support tools for allocating resources. Some of the highest priorities are to conduct standardized and repeated baseline surveys for biofouling invasions in the Hawaii, and the collection of vector data (sampling vessels) to evaluate current species transfers (now) and measure policy efficacy (later). The biofouling management policy options for Hawaii range from ‘take-no-action’ to strict enforcement of protective biofouling standards. The feasibility and cost of each option varies in a straightforward manner, as does the efficacy and risk-reduction potential of each approach. Fortunately, there are existing guidelines and standards that could be adopted that may be feasible to implement, provide consistency with other countries’ and international approaches, and help to reduce the marine invasion rate in Hawaii from this enduring and potent invasion vector.

4
Table of contents!
Executive Summary .................................................................................................................. 3!
Table of contents ...................................................................................................................... 4!
Hawaii’s Marine Invasion History ........................................................................................... 5!Introduction .................................................................................................................................................... 5!Methods .......................................................................................................................................................... 6!Results ............................................................................................................................................................. 7!Discussion ..................................................................................................................................................... 11!
Hawaii’s shipping and global connectivity ............................................................................. 13!Introduction .................................................................................................................................................. 13!Methods ........................................................................................................................................................ 13!Results ........................................................................................................................................................... 13!Discussion ..................................................................................................................................................... 17!
Biofouling maintenance and hull husbandry by Hawaii’s commercial fleet .......................... 19!Introduction .................................................................................................................................................. 19!Methods ........................................................................................................................................................ 19!Results ........................................................................................................................................................... 19!Discussion ..................................................................................................................................................... 22!
Recreational boats and biofouling risks in Hawaii ................................................................. 24!Introduction .................................................................................................................................................. 24!Methods ........................................................................................................................................................ 24!Results ........................................................................................................................................................... 24!Discussion ..................................................................................................................................................... 26!
Research & Monitoring Recommendations for Marine Invasions and Biofouling Vectors in Hawaii ...................................................................................................................................... 27!
Introduction .................................................................................................................................................. 27!Research & Monitoring Priorities ............................................................................................................. 27!
Evaluation of Biofouling Management Strategies for Vessel Arrivals from Out-of-State ...... 29!
Acknowledgements ................................................................................................................. 31!
References ................................................................................................................................ 32!
Appendix 1: Supporting information for Figure 3. .................................................................. 34!
Appendix 2: Commercial vessel Questionnaire ...................................................................... 35!
Appendix 3: Hawaii Boater Questionnaire ............................................................................. 39!
Appendix 4: Field note – commercial vessel biofouling sampling ......................................... 42!

5
Hawaii’s Marine Invasion History Introduction Hawaii is one of the most isolated archipelagos in the world and its history of anthropogenic introduction of animals and plants has fundamentally changed the islands’ ecology. In some cases, the transport of animals and plants was done intentionally, as a food source for example, and those are considered beneficial and culturally important introductions. In other cases, the species that have arrived have had significant negative impacts on native species and ecological processes. The magnitude of those effects, exacerbated by island biogeography, provides world-renowned examples of biotic turnover (invasion and extinction) and landscape alterations (Medeiros et al., 1997; Kaiser, 2006; Lockwood, 2006). Although terrestrial invasions and their effects often dominate the popular perception of bioinvasions on the islands, there is an important invasion history in marine systems as well. Over two waves of human colonization – Polynesian and European - unintentional and deliberate introductions of marine species have altered the islands’ biodiversity, contributing novel species to a native community with a variety of effects that are mostly understudied. The process of introduction continues to this day, with ships acting as the primary mechanism of marine species introduction (Eldredge & Carlton, 2002). In their comprehensive evaluation of introduced and cryptogenic marine and estuarine species in Hawaii, James Carlton and Lu Eldredge described 417 species established in marine waters of the state (Carlton & Eldredge, 2009). This is undoubtedly an underestimate because small, soft-bodied, and cryptic species will be added to the list over time, in addition to the new species that continue to arrive to Hawaii’s shores. Nonetheless, the level of marine bioinvasion in Hawaii ranks as highly as anywhere of comparable size in the world (Cohen & Carlton, 1998; Ruiz et al., 2000; Hewitt et al., 2004). In response to the flow of marine introductions over time, attention has been focused on the vectors responsible for initial incursions of nonindigenous species (NIS). At international, national, and state levels, ballast water management has been the major marine biosecurity policy initiative over the last two decades. State and federal programs establish rules for the treatment and reporting of ballast water delivery to the state, with the intended (and likely) effect of curtailing the numbers of organisms being introduced to the state via this mechanism. However, biofouling of vessels – including large commercial ships and smaller recreational craft - is as important as ballast water in its contribution to marine introductions globally (Hewitt & Campbell, 2010) and is the most important vector in Hawaii’s marine invasion history (Eldredge & Carlton, 2002). Therefore, critical attention on the biofouling vector is warranted and must be addressed in any effective biosecurity system. In this section, we examined the taxonomic, temporal, biogeographic, and vector patterns of Hawaii’s marine introduced and cryptogenic species. The goal was to describe the scale of the marine invasions in the state and, in particular, to evaluate the contribution of vessel biofouling to Hawaii’s invasion history.
6
Methods We used the monograph of ‘Marine Bioinvasions of Hawaii’, by Carlton and Eldredge (2009), as our data source to examine the taxonomic, temporal, and vector trends of Hawaii’s invasion history. The monograph is a comprehensive and detailed account of the nonindigenous and cryptogenic species known to occur (or have occurred) in the state. For each species, the authors provided an account of the year of first record, the history and distribution of recorded occurrences, taxonomic and biogeographic notes, the vectors likely to be responsible for their initial introduction, and other pertinent information on impacts and spread. We used this data source to evaluate (a) the taxonomic breakdown of Hawaii’s invasions, (b) the timing of initial introductions, (c) the native regions for Hawaii’s introduced marine biota, and (d) the vectors likely to be responsible for transferring the species to Hawaii. Among the 417 species described as established in Hawaii by Carlton and Eldredge (2009), 17 were fish, 42 were insects (mainly supralittoral flies, beetles, and bugs), and 12 were plants. The remaining 346 were marine invertebrates and algae and we focused our attention on these species. (a) Taxonomic pattern: we assessed the richness of species within each broader taxonomic
group from protists to tunicates. This provided a brief overview of the diversity of Hawaii’s introduced and cryptogenic biota and the evenness of species among taxa.
(b) Temporal pattern: we examined the timeline of initial introductions in 30-year time intervals, with each species’ introduction date listed as the year of first record in Hawaii (Carlton & Eldredge, 2009). Our goal was to examine how many new species were detected per time period.
(c) Native regions for Hawaii bioinvasions: we assessed the known native ranges for Hawaii’s introductions to determine the probable source regions for Hawaiian introductions and the numbers of species from each of those source regions.
(d) Vector patterns: Vector attributions for each species were taken directly from the accounts of each species in Carlton & Eldredge (2009). Vectors are assigned to introduced species to determine the most likely transfer mechanism responsible for a species’ initial introduction to a new location. These designations are based on timing, species ecology and life-history characteristics, and the nature of vector operations such as aquaculture shipments or vessel activity during a time period. Because many species have characteristics that make a single vector designation difficult, some species are considered to have more than one vector association. Thus, there are single-vector species and multi-vector species based on whether a sole vector is responsible for their initial introduction or whether two-or-more vectors could have been responsible. Since our primary interest was in vessel biofouling, we assessed the vector pattern in a categorical way: (i) species introduced by vessel biofouling as a sole vector; (ii) species introduced by vessel biofouling or ballast water; (iii) species introduced by vessel

7
biofouling or other vectors (e.g. aquaculture or live trade); and (iv) species introduced by other vectors (not vessel biofouling). We assessed the overall vector pattern (vector strength), vector breakdown across all taxonomic groups, and the temporal pattern of vectors.
Results Taxonomic composition of Hawaii’s nonindigenous and cryptogenic species
The introduced organisms of Hawaii are representatives of most of the major marine phyla, from protists to tunicates (and fish). There were five phyla that had 30 or more introduced or cryptogenic species. The crustaceans (arthropods) were the richest with 68 species (Fig. 1), dominated by amphipods, isopods and decapods. Annelids (49 species), molluscs (46), cnidarians (36) and tunicates (30) were ranked next highest, respectively. Bryozoans, algae and sponges were also well-represented with more than 20 species each. Among the species-poor groups, there are just two echinoderms and both are brittle stars; the introduced Ophiactis savignyi and the cryptogenic Ophiactis modesta.
Figure 1. The taxonomic breakdown of Hawaii’s nonindigenous and cryptogenic marine algae and invertebrates (n = 346 species). Temporal trend of invasion
There has been a remarkable increase in the numbers of introduced and cryptogenic species recorded in Hawaii over time (Fig. 2). The current trajectory is one of exponential growth in new species detections (y = 0.4205e0.8881x; r2 = 0.9395). The earliest recorded introduced and cryptogenic species are the green alga Ulva fasciata, the brittle star Ophiactis savignyi, and the molluscs Hipponix australis, Tarebia granifera, and Anomia nobilis, all recorded prior to 1860. U. fasciata was recorded in 1819, but it is considered cryptogenic and has Hawaiian names - limu palahalaha and lipahapaha – and history as a food source for Hawaiians. O. savignyi has a detection date of 1849 and persists in large numbers today in Kãne’ohe Bay and Pearl

8
Harbor, 165 years after its detection. The three earliest molluscan invaders we recorded prior to 1859, one of which, Anomia nobilis, may have been first described from its introduced range in Hawaii. In more recent history, 31 cryptogenic and 66 introduced invertebrates and algae have been newly reported in the state since 1990. Crustaceans, cnidarians, tunicates, and sponges comprise two-thirds of these recent detections.
Figure 2. The temporal pattern of introduced and cryptogenic species detection in Hawaii (n=331 species, 15 species have detection dates that require further analyses to resolve). Native Regions for Hawaii’s marine nonindigenous and cryptogenic species
The species that have been invading Hawaii’s shallow marine waters since initial colonization by Polynesians and the age of (European) exploration hail from all over the world (Fig. 3). The biogeography of many of the 346 species is sufficiently opaque at present that 177 species are considered of unknown or cryptogenic origin. Unsurprisingly, a majority of species with known origins have arrived from (a) other Pacific islands and locations on the Pacific Rim and (b) from the Indo-Pacific region in particular. Different regions of the Pacific are considered the native range for at least 102 Hawaiian introductions and the Indo-Pacific region alone is native to 62 of these. This is unsurprising because the prevailing vector traffic (ships and other vectors) is intra-Pacific and the environmental match to the globally-renowned biodiversity hotspot of the Indo-Pacific region is probably strong. There have also been inter-oceanic marine invasions in Hawaii; up to 14% of the 346 species a native range outside of the Pacific Ocean, mainly comprised of Atlantic species (at least 45 species).

9
Figure 3. Schematic diagram of source regions for Hawaii’s marine introduced species. The names of source regions and categories of arrow thickness are shown in Appendix 1. Species of unknown origin and from the Indo-Pacific region are the highest ranked categories of source location. Vectors of Hawaiian marine invasions
The introduction of non-native species to Hawaii is largely occurring because of unintentional transfers of species in and on ships and boats. Species have been transferred to the state in ballast tanks of ships, in water systems of boats (bilge tanks), in the dry ballast of historical vessels, and most prominently, attached to submerged surfaces of vessels as biofouling. Up to 78% of the introduced and cryptogenic marine species in the state have been brought to the islands by vessel biofouling (Fig. 4). While other vectors have contributed significantly to the islands’ invasion history – notably ballast water and the intentional importation of algae and other species for culture – no other vector ranks higher than vessel biofouling as a mechanism of marine introductions in Hawaii.

10
Figure 4. The contribution of vessel biofouling to Hawaii’s invasion history. Vessel biofouling is ranked highest among all vectors of initial introduction to Hawaii. It has contributed between 35% and 78% of Hawaii’s introduced and cryptogenic species (n=346). Vessel biofouling tends to transport a diverse range of taxa. While it is difficult to distinguish between certain vectors for many species, vessel biofouling is considered the sole vector of initial introduction for more than 60% of the algae, bryozoan, sponge and tunicate species that have been introduced. Vessel biofouling is a sole or possible vector for more than 60% of species across 10 of the 12 major taxonomic groups (Fig. 5). Only the Platyhelminthes and minor taxa (‘other’ in Fig. 5) did not have vessel biofouling as a major vector.
Figure 5. The contribution of vessel biofouling to initial introduction in Hawaii by taxonomic group.

11
The role of biofouling is not just a historical aspect of Hawaii’s ongoing invasion story. Vectors such as hull boring (in wooden hulls), solid ballast, and ballast water have each contributed important components of the introduced biota over time, but none of these has been operational throughout the islands’ history of human contact. Vessel biofouling is the only vector that has delivered species in each 30-year time period (Fig. 6) since Hawaii’s known marine invasion history began in the early part of the 19th century. Other mechanisms that have endured throughout the full timeline, such as the intentional release of organisms, do not approach vessel biofouling in terms of importance for initial introductions. As the number of introductions per 30-year time period have increased remarkably, vessel biofouling has been a driver of that increase.
Figure 6. Timeline of vector contributions to invasion in Hawaii. Vessel biofouling (VB) has been an enduring and growing contributor of introduced and cryptogenic species in Hawaii and the role of biofouling is not just historical. (n=346; BW = ballast water). Discussion Our analyses point to four major aspects of Hawaii’s invasion history lends support to an evaluation of vessel biofouling and its management. These are: – Shipping has been the major driver of biological invasion in Hawaii and vessel biofouling
is a particularly potent vector for the region. Up to 78% of the NIS and cryptogenic species in Hawaii have been brought to the islands via vessel biofouling (Figure 5; Eldredge & Carlton, 2002). It is clear that vessel biofouling underpins the temporal and taxonomic patterns observed. As the top ranking vector of NIS to the state, vessel biofouling should receive management attention to reduce or prevent future invasions.
– The number and diversity of NIS arriving to the state is quite high. There are 346 introduced and cryptogenic algae and invertebrates in Hawaii. As a brief comparison, the continental US has 450 (Ruiz et al., 2014), Europe has 536 (Gollasch, 2006), New Zealand has 206 (Hayden et al., 2009); South Africa has 124 (Mead et al., 2011); Port

12
Phillip Bay (Australia) has 160 (Hewitt et al., 2004), and San Francisco Bay has 216 (Fofonoff, 2003). Curtailing the supply of NIS from ships would probably have a large impact on the future rate of NIS that become established in Hawaii.
– Hawaii’s NIS have native ranges that are distributed all around the world. While certain areas, like the Indo-Pacific region, are major sources for Hawaiian NIS, there are many ‘donor’ regions that have contributed few species. A large minority of species have unknown native regions, so black-listing species or source locations would probably not provide a useful mechanism to prevent future invasions. A vector management approach would better serve Hawaii’s biosecurity than a species-by-species or voyage-route approach to invasion prevention.
– While Carlton and Eldredge’s monograph points to a long history of marine invasions in Hawaii, the temporal trend of NIS detections reveals a strong signal of increasing introductions over time. This suggests that the invasion issue remains a potent one and is not simply an artefact of historical vector activity during early human colonization or of vessel arrivals from a bygone era of slower wooden vessels.
In addition to these patterns, the establishment of introduced species in Hawaii compromises the integrity of the near-shore ecosystem. At a minimum, introduced species compete for resources and alter the dynamics of marine species communities when they persist in a new range. Some introduced species can cause more directly obvious impacts to a region’s ecology and economy. There are some well recorded impacts of marine invaders in Hawaii and around the world that are often the drivers of management action to prevent future similar outcomes. Although complete accounts of NIS impacts are often lacking in marine systems (Williams et al., 2013), there have been some in Hawaii that cause disruption, concern, and management responses. The introduced octocoral, Carijoa riisei, is a well-known example of a marine invader that was introduced in 1972 with ships. It smothers native Hawaiian black coral and persists in the waters of Kaua‘i, O‘ahu, Moloka‘i, Maui, and Hawaii (Kahng & Grigg, 2005; Carlton & Eldredge, 2009). Similarly, introduced seaweeds Kappaphycus spp. were intentionally brought to Kãne’ohe Bay in the 1970s for open-water culturing (Carlton & Eldredge, 2009). Since their initial introduction, they have grown to dominate distinct areas of the Bay and the state is attempting to rear and release urchins in a control effort (Conklin & Smith, 2005; Gutierrez, 2013). Another red seaweed, Gracilaria salicornia, grows to local dominance in Waikiki and removal efforts are conducted after large wave events when the seaweed washes up in large abundance on the beach (Carlton & Eldredge, 2009). The resources needed for response to invasions can be substantial and require long term commitment to mitigate persistent impacts or cause a lasting reduction of species abundance. While reactive measures are a necessary tool for incursion response, the unwanted outcomes of marine introductions are best tackled from a ‘prevention first’ perspective.

13
Hawaii’s shipping and global connectivity Introduction As a remote island state, the importance of maritime shipping to Hawaii’s economy cannot be overstated. The state’s economy is heavily reliant on its connections to Pacific and global regions via air and maritime travel. The Port of Hawaii consists of 10 commercial harbors distributed among the main islands and the largest in Honolulu ranks in the top 40 of North American ports by trade volume; the port handled nearly seven million metric tons of foreign trade in 2013 valued at over $5.3 billion (US Dept. of Commerce, 2013). As a result, the port in Honolulu acts as a major entry point for NIS to the state, which can be spread throughout the islands via inter-island traffic. The aim of this section of the report was to provide a brief account of Hawaii’s commercial vessel traffic in terms of the numbers of vessel arrivals by location and vessel type. This provides some understanding of the scale of commercial vessel activity in the state and the linkages to ports around the world, which are potential sources of new NIS in the future. Methods We used the US Coast Guard National Vessel Movement Center (NVMC) data to examine the pattern of arrivals to Hawaii and the connectivity of Hawaiian ports to the rest of the world. The NVMC data provides ship arrivals data by vessel identity, ship type, date of arrival, and last port and is the data source against which national ballast reporting compliance is measured. The other data source used in these analyses was the National Ballast Information Clearinghouse (NBIC). NBIC collects data for all US ports and places in regards to ballast water delivery and management. Although our main interest was to explore the vessel arrival patterns, because this is most relevant to the vessel biofouling vector, we included some comparisons with ballast water delivery to the state because this other shipping vector provides a useful template for vector management. To characterize shipping patterns in Hawaii: – We created a map of Hawaii’s commercial shipping linkages to global ports using point-
to-point locations across four years of shipping data (2010-2013, inclusive). – We plotted the mean number of arrivals per year over a four-year interval by source
region. Source regions were broadly grouped into areas of ocean basins (e.g. northeast Pacific, Northwest Atlantic etc.).
– We evaluated the numbers of arrivals by ship type using several different categories of ship (bulker, combination carrier, containership, general cargo, other, passenger, roll-on roll-off and tanker ).
Results

14
For the four years we evaluated, Hawaii received between 1302 and 1431 arrivals annually from 352 unique locations around the world. Hawaii’s out-of-state shipping is dominated by arrivals from the Pacific Rim (Fig. 7), particularly the north Pacific basin. While there are direct connections between Atlantic and Indian Ocean ports with Hawaii, the numbers pale in comparison with arrivals from Western North America and East Asia. The comparison between last-ports-of-call and ballast water sources showed a high degree of overlap, which was expected given the often tight coupling between last ports and ballast uptake. However, the maps (Fig. 7a & b) did show a strong degree of ballast inputs from the south Pacific which was not evident from the arrivals data; this was primarily a function of open-water sources of ballast water. The arrivals plot (7a) also showed a higher degree of connectivity to SE Asia than the ballast sources plot (7b), suggesting that ballast delivery from this region is relatively low.
Figure 7. Patterns of connectivity of vessel arrivals (a) and ballast water delivery (b) to Hawaii. Data are based on last-port-of-call for (a) and source of ballast water for (b). Approximately 30% of Hawaii’s arrivals resulted from inter-island (intra-Hawaii) voyages, which points to a high degree of connectivity among the main islands via shipping. For the out-of-state arrivals, over 85% arrive from the northeast and northwest Pacific (Fig. 8). The southwest Pacific, with major donor ports in Australia, New Zealand and Micronesia,

15
accounted for 6.75% of overseas arrivals. Vessels from all of the source ports outside of the Pacific accounted for a cumulative 6.4% of arrivals to Hawaii.
Figure 8. Arrivals of commercial ships to Hawaii from different ocean regions. Top panel; map of global coastal regions, including the top three vessel ‘donor’ regions in red. Lower panel; average arrivals from each region per year (for four years, with standard deviation). Commercial vessel traffic within Hawaii (intra-state traffic) is dominated by passenger vessel and barge (“other”) arrivals (Fig. 9a). These are often multiple arrivals per year by the same vessel, such as the ‘Pride of America’ cruise ship. Tankers and roll on-roll off vessels (RoRos) are the only two other vessel types that play a major role in inter-island traffic. For out-of-state arrivals, containerships dominate the flux of incoming traffic, followed by barges and tankers. Bulkers and general cargo ships also contribute to incoming traffic. The

16
role of containerships, passenger ships, and ‘other’ (mainly barges) accounts for 73% of Hawaii’s combined inter-island and out-of-state traffic.
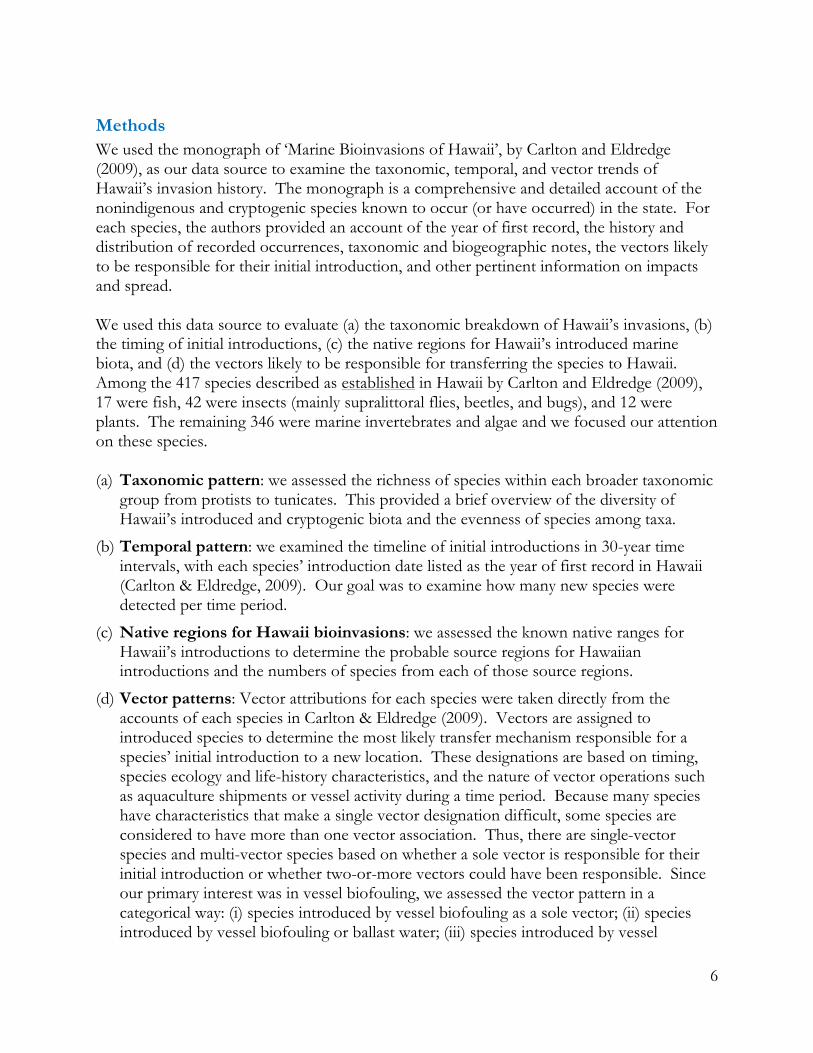
Figure 9. Traffic patterns by ship type. (a) Average number of arrivals from within Hawaii (inter-island traffic) and (b) average arrivals of different ship types from out-of-state. The interaction between ship types and source regions also highlighted the importance of container shipping to Hawaii’s maritime traffic patterns. Annual arrivals of containerships from the NE Pacific (US West Coast states) dwarfed all other types of vessel arrivals from other regions (Fig. 10). Vessels arriving from the NW Pacific and the south Pacific were more evenly distributed among different ship types. Arrivals from outside of the Pacific tended to be tankers and ‘other’ categories of vessel.
17
Figure 10. Average arrivals of major ship types by source region.
Discussion Our analyses of incoming traffic were restricted to last-port-of-call when evaluating a vessel’s voyage history prior to arrival in Hawaii. While this provides important information on the direct connections between the world’s ports and Hawaii, it does not fully capture the range of potential sources of biofouling-mediated NIS to Hawaii. Vessel biofouling acts as a ‘concatenation’ vector, whereby biofouling accumulates across many ports on a vessel’s itinerary. This is unlike ballast water, where information on the source of the water (not the last port) is sufficient to characterize the point-to-point nature of this vector. Therefore, while it is useful to know the direct linkages to ports around the world, we have presented a minimum estimate of biofouling connectivity to Hawaii. The global scale of the arriving species is likely to be larger than suggested by the linkages we reported (from more than 350 locations over four years). Despite the wide range of source ports for vessel arrivals to Hawaii, the north Pacific region dominates the arrivals pattern. The risk from these vessels may be reduced by environmental mismatch between Hawaii and the NE and NW Pacific, but this is not well understood at present. There has been little biofouling sampling of ships in Hawaii in the past decade, so there is not a robust baseline of data to shed light on the types of species arriving, the condition they are in upon arrival, and the likelihood that they could become established in Hawaii. When considering biosecurity options for managing vessel biofouling, it is important to consider and understand the population of vessels that would be impacted by any rule changes. Good policy making would require all vessels that visit Hawaii to be held to the same standard of biofouling management. Hawaii receives a relatively high number of unique vessels, and a few vessels that dominate the arrivals data by repeated calls. To the extent that Hawaii’s vessels already interact with New Zealand, Australia, and California, it is likely that these vessels are aware of biosecurity issues and possibly adopt those regions’

18
policies on biofouling maintenance and record-keeping. Maintaining some consistency with existing biofouling policies would benefit the shipping industry and create a broader mandate to encourage the adoption of policies that apply across jurisdictions.

19
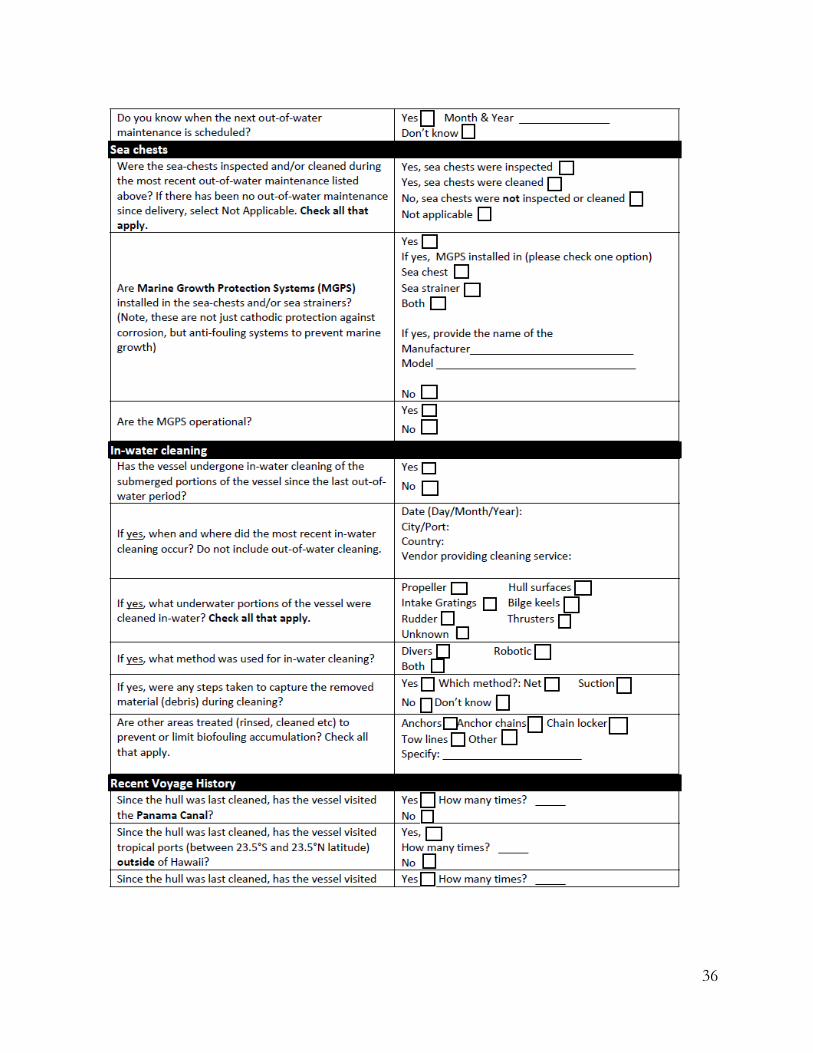
Biofouling maintenance and hull husbandry by Hawaii’s commercial fleet Introduction Commercial shippers spend millions of dollars annually on hull maintenance and biofouling prevention. The primary tool for biofouling prevention is the use of anti-fouling (A/F) or foul-release (F/R) paints that are applied to hull and niche surfaces of ships. These paints either prevent biofouling via biocidal release from the paint (A/F paints) or provide very smooth surfaces that reduce the adhesive strength of biofouling organisms (F/R paints). In addition to coatings, shippers also conduct in-water cleaning to maintain submerged surfaces and install equipment to prevent biofouling accumulation (e.g. in sea-chests). Despite these efforts, biofouling remains a problem for shippers and for biosecurity. The aim of this section of the report was to evaluate current husbandry practices adopted by shippers in Hawaii. This type of information helps to define the best practices used by some ships that may provide useful guidelines for policy, as well as insights into the drivers and barriers to behavior change. Methods During a previous project between SERC (Smithsonian) and DLNR (Hawaii Dept. Land & Natural Resources) in 2013, we developed a questionnaire to determine the hull husbandry practices adopted by shippers to manage biofouling accumulation on their vessels (Appendix 2). The questionnaire consisted of 8 sections: vessel information, previous dry docking, anti-fouling (A/F) paint usage, sea-chest management, in-water cleaning, recent voyage history, periods of inactivity, and record keeping. The details of timing, location, frequency, products, and methods were assessed to provide an overview of the status quo for biofouling management by Hawaii’s commercial fleet. Results We received 125 unique vessel responses to our questionnaire. There were additional data submitted using the California hull husbandry reporting form, but this information was only used in some cases because the responses on timing and voyage history were related to California rather than Hawaii vessel schedules (and therefore not directly comparable to the Hawaii DLNR form responses). Overall, the response rate was approximately one-third of the unique vessel arrivals to Hawaii annually. Using the year of maximum overlap between NVMC arrivals data and questionnaire responses (Oct 2013 – Sept 2014), 33% of Hawaii’s 377 visiting vessels provided questionnaire answers. The percentage of respondents for passenger ships was 76% (25 of 33), but lower numbers reported for bulkers (15%), containers (39%), tankers (29%) and roros (12%). The percentage of responses for all other vessels types (pooled) was 42%. The responding vessels included a cross section of the vessel types that call to Hawaii and a range of voyage histories (Fig. 11). We had responses from all of the major vessel types,
20
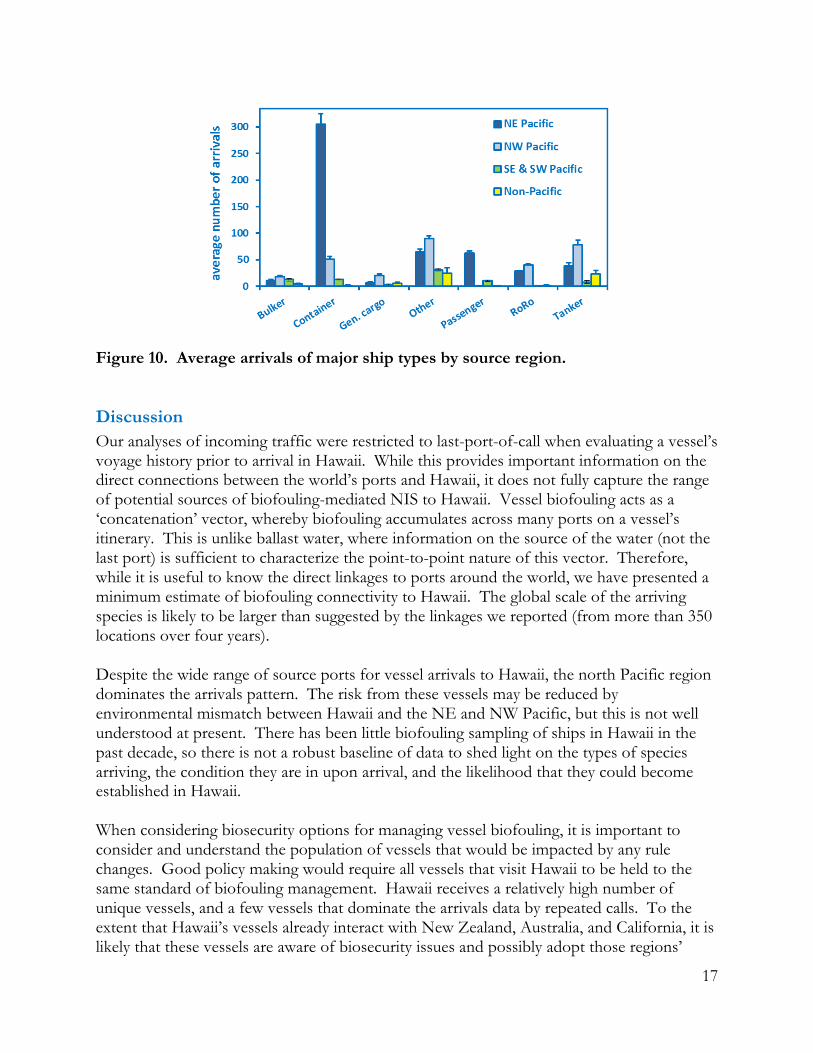
with tankers, passenger vessels, tug & barges, and containerships ranking highest. This largely reflected the pattern of arrivals to the islands, although containerships were probably under-represented. Our sample of questionnaire respondents also represented the range of voyage histories that emerged from our analyses of Hawaii’s traffic network. These included vessels that operated within Hawaii, within the Pacific (operating between Hawaii, The US and Asia, mainly), or had traveled extensively since their last dry-docking (Fig. 11b).
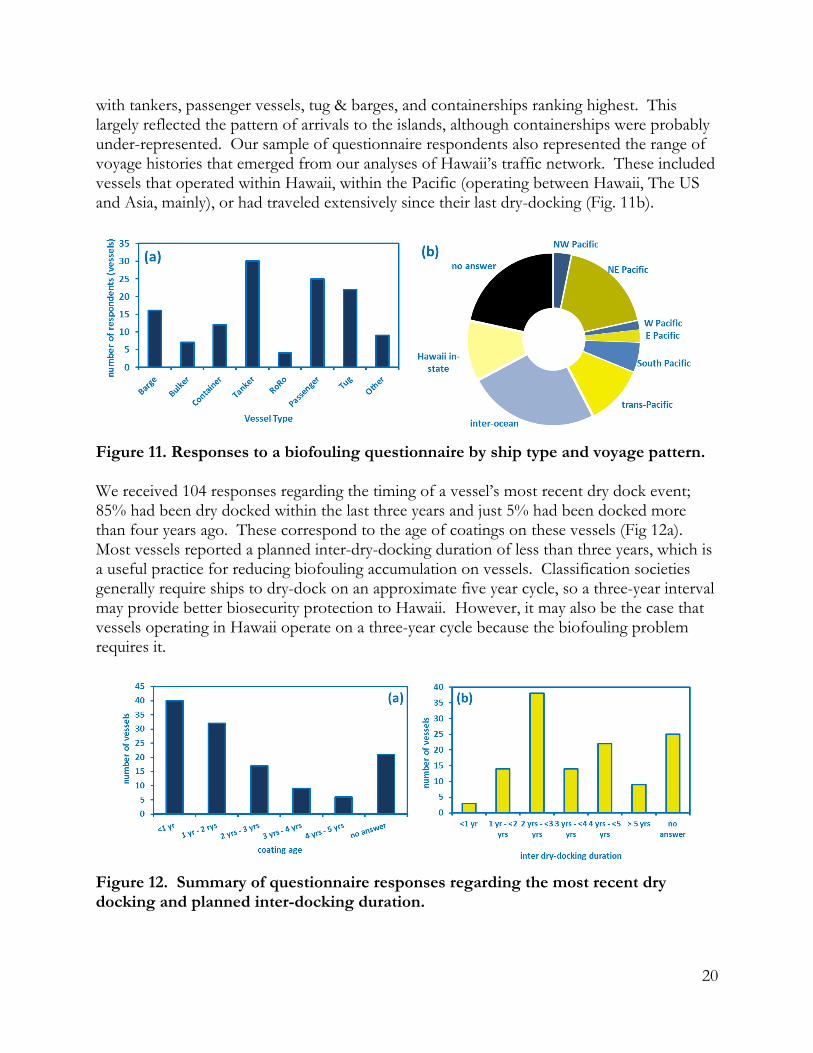
Figure 11. Responses to a biofouling questionnaire by ship type and voyage pattern. We received 104 responses regarding the timing of a vessel’s most recent dry dock event; 85% had been dry docked within the last three years and just 5% had been docked more than four years ago. These correspond to the age of coatings on these vessels (Fig 12a). Most vessels reported a planned inter-dry-docking duration of less than three years, which is a useful practice for reducing biofouling accumulation on vessels. Classification societies generally require ships to dry-dock on an approximate five year cycle, so a three-year interval may provide better biosecurity protection to Hawaii. However, it may also be the case that vessels operating in Hawaii operate on a three-year cycle because the biofouling problem requires it.
Figure 12. Summary of questionnaire responses regarding the most recent dry docking and planned inter-docking duration.

21
Approximately 30% of the responding vessels had their last dry docking in Hawaii. Approximately 11% of vessels were based in Hawaii only, so there are vessels that travel outside of the state that use dry docking facilities on the islands. A further 16 % of dry dock events were carried out in West Coast States and British Columbia; 28% occurred in East Asia; and 8.8% occurred in non-Pacific waters (Europe, middle East, Bahamas). A/F paints were used by 76% of the responding vessels and a majority of these ships used the same A/F paint on all submerged surfaces of their vessel (Table 1). A further 15% of vessels used F/R paints while 5% used a combination of A/F and F/R paints on different hull locations. A mixed-use strategy of paint application on vessels is sometimes employed to target different submerged areas; for our sample of vessels, 13 used a variety of A/F paints across the hull bottom, hull sides, and niches areas (Table 1). Just one vessel used A/F paints on hull surfaces and F/R paints on niche areas and two used F/R paints on hulls but A/F paint on niches.
Table 1. Types of coatings used on the hulls and niches areas of ships. The responses for 125 ships are shown regarding paint types used on hull bottoms, hull vertical sides, and niche areas. A/F = antifouling paint with biocides; F/R = foul release coatings (non-toxic). The variation in paint usage is reflected in the rows, with the frequency (number of ships) of each combination shown in the last column. For example, 48 vessels used the same brand of A/F across the three locations (bottom, sides, niches); six vessels used one type of A/F paint on the bottom and niches, and another type (A/F 2) on the sides; two vessels used three different brands of A/F paint for the three locations; and ten vessels used the same F/R coating on all three vessel locations.
Hull$bottom Hull$sides Niches Frequency
A/F A/F A/F 48A/F A/F&(2) A/F 6A/F A/F A/F&(2) 3A/F A/F&(2) A/F&(2) 2A/F A/F&(2) A/F&(3) 2A/F unknown A/F 34A/F unknown unknown 1A/F A/F F/R 1A/F F/R F/R 3F/R F/R A/F 1F/R A/F A/F 1F/R F/R F/R 10F/R unknown F/R 9
unknown unknown unknown 4

22
Other notable responses from the questionnaires included: – Just 28% of vessels reported conducting in-water cleaning. For the 23 vessels that
provided the date of in-water cleaning, five had cleaned within a year of dry docking. The longest duration between dry docking and in-water cleaning among these vessels was almost four years.
– The locations of in-water cleaning were provided by 35 vessels and 11 vessels reported it being carried out in Hawaii, a further 11 in other US locations, and 13 in international ports. The furthest location from Hawaii for reported in-water cleaning was the UAE (Middle East).
– Information on the areas of vessels cleaned and other details were not forthcoming, with the exception that diver-operated cleaning was carried out by all of the vessels that reported some in-water cleaning since dry-docking.
– Three-quarters of responding vessels noted that their sea-chests were inspected and cleaned during dry docking. Most vessels pay attention to sea-chest areas during dry docking because access to them is very limited between dockings. Just over 55% of vessels reported a marine growth protection system (MGPS) was installed; of the 71 vessels with MGPS, 42% were installed in sea chests, 3% in sea strainers, and 25% in both (the remainder did not specify).
– 21% of vessels reported stationary periods (lay-up times) of longer than 10 days. The details regarding lay-up periods and locations was patchily answered, but locations around the world (Pacific, Atlantic and Indian Oceans) were included for lay ups ranging from one day to 70 days. The longest reported lay-up was 70 days in Puget Sound, WA.
– 25% of vessels reported visiting a freshwater port since the vessels was last cleaned. These vessels reported visits to freshwater locations between one and 60 times.
– 18% of vessels reported visiting the Panama Canal since their last cleaning event. The majority of these vessels traversed the Canal once or twice, but one vessel report 15 transits.
– 42% of vessels reported calls to a tropical port outside of Hawaii since the vessel was last cleaned. Most vessels had been to tropical ports more than once or twice, and 15 vessels had visited tropical ports more than 20 times.
– 65% of respondents stated that they were familiar with the International Maritime Organization (IMO) biofouling guidelines and log book. In particular, the two main vessel types, tankers and passenger vessels, reported high levels of IMO guideline awareness (88% of 58 vessels). 37% of respondents reported that the IMO guidelines and record book template were on board their vessel, and 29% reported that they use a biofouling plan and record book.
Discussion There are encouraging aspects of the maintenance practices of Hawaii’s commercial vessel fleet from a biosecurity perspective. A majority of vessels tend to dry-dock on a three-year rather than a five-year cycle, which was also recently reported in California (Scianni et al.,

23
2013). This is supported by data on the timing of the most recent docking, most of which were shorter than three-year duration. This increases the likelihood that the coatings used to reduce biofouling accumulation on vessels are within their recommended time span for use. The efficacy of antifouling and foul-release paints tends to reduce over time, so frequent re-painting maximizes their properties of biofouling prevention. Since this is the primary means of reducing biofouling risk, it is encouraging that a large proportion of Hawaii’s visiting vessels adopt such a strategy. The use of paints (hull coatings) across different surfaces of the same vessel is also an interesting aspect of vessel behavior in Hawaii. We are not aware of any studies that evaluated the efficacy of differential paint use across different surfaces of ships, but given the issue of niche area biofouling accumulation, it appears reasonable that paints designed for hull surfaces may not act as effectively on niche areas. Thus, strategies that treat niche areas (or hull bottoms or sides) in a targeted manner (i.e. with different coatings) may emerge as best practice from an efficiency and biosecurity perspective. In Hawaii, the vast majority of vessels responding to our questionnaire use the same coating across all underwater surfaces. It is difficult to draw any conclusions on this matter until research is carried out on the differential use of paints across vessel surfaces. In addition, many vessel operators appear to be aware of international efforts to promote husbandry best-practice and biofouling prevention. This awareness and adoption of IMO and other guidelines may lead to an overall improvement among the fleet and the adoption of more detailed record-keeping than has been carried out in the past. Several jurisdictions, including the USA and New Zealand, are moving toward mandatory biofouling management planning and record-keeping. This is already in place on a proportion of vessels that visit Hawaii and is likely to be a part of any recommendations for DLNR’s policy. There are also some risky behaviors being adopted by some of Hawaii’s fleet, including long durations between maintenance, long lay-up times in foreign ports, and generally poor responses regarding in-water cleaning (indicating little intervention between dry docks or poor record-keeping). Ship biofouling sampling conducted in Hawaii to date (Godwin 2003; Godwin et al 2004) and the state’s marine invasion history suggest that biofouling remains a strong invasion risk for the state. Providing a regulatory incentive for all ships to perform to a high level of biofouling management, as already adopted by some vessels, will likely provide strong risk-reduction for future biofouling-mediated species introductions.

24
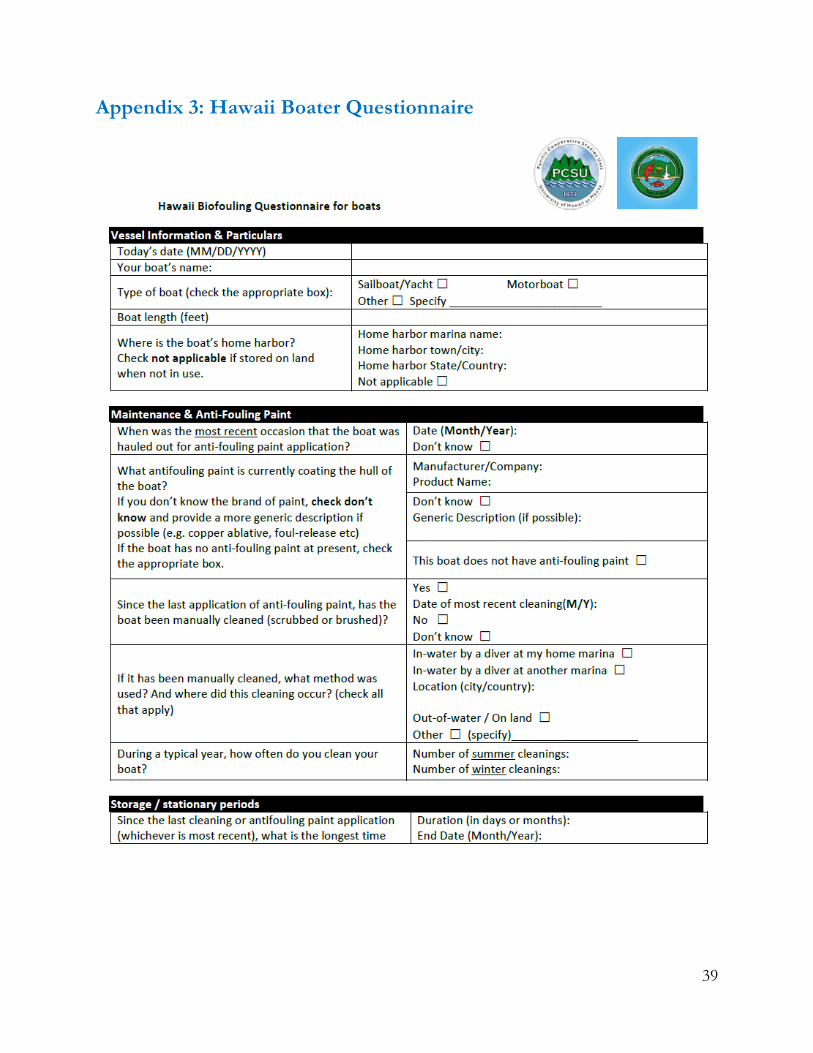
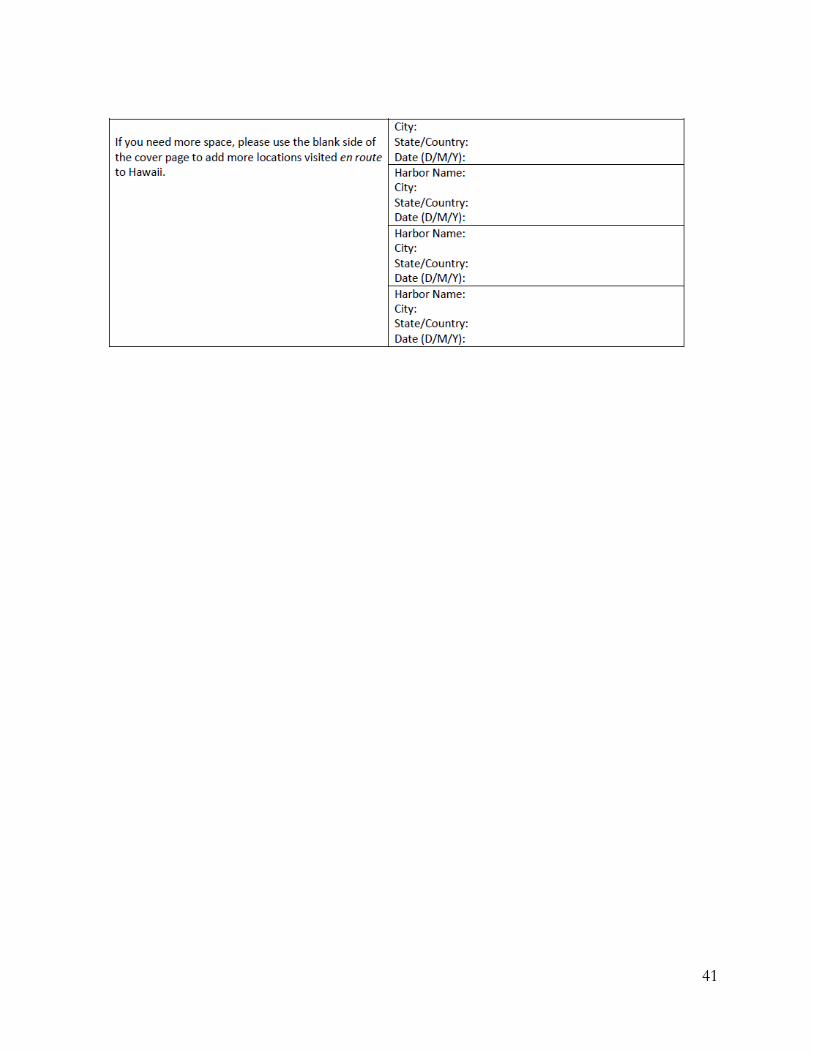
Recreational boats and biofouling risks in Hawaii Introduction All types of maritime vessels play a role in biofouling transfers around the world. While in-service commercial ships are a dominant group in terms of vessel numbers, voyage range, and arrival frequency, obsolete vessels, drilling rigs, construction barges, fishing boats, and recreational craft can all contribute to biofouling-mediated invasion risk (Davidson et al., 2008; Hopkins & Forrest, 2010; Piola & Conwell, 2010; Yeo et al, 2010). Hawaii acts as an attractive destination for pleasure boats and this section of the report explored the traffic and maintenance patterns of boaters (recreational and fishing vessels that inhabit marinas). As part of a previous in-depth evaluation of biofouling risks in Hawaii, Godwin et al (2004) analyzed trends of fishing and recreational boat arrival to Hawaii from overseas. They recorded 556 fishing vessel arrivals from overseas ports and 161 recreational boat arrivals over a two-year period. Fishing vessels arrived primarily from ports in Japan and Korea, as well as fishing grounds off of Chile and Argentina. Recreational boats arrived most commonly from French Polynesia, Mexico, Kiribati, and British Columbia. Data on arrivals from the US mainland were not available to Godwin et al (2004). More recently, Leonard (2009) examined biofouling and boater patterns using surveys and questionnaires at marinas in Hawaii. There were 64 respondents to the questionnaire, with approximately half resident (in-state) vessels and half out-of-state vessels. Just over 20% of in-state vessels reported inter-island travel, while the out-of-state vessels included a mixture of longer term visitors (and possibly now resident boats ‘imported’ in recent years) and shorter-stay inter-island tourists. The aim of this section of the report was to provide a brief account of Hawaii’s marina vessel traffic in terms of the numbers of vessel arrivals by location and vessel type. We were unable to obtain more recent data for overseas arrivals of recreational vessels from CBP. We did develop a questionnaire for recreational boats and received 60 responses. The results are summarized below. Methods During the process of engaging with commercial shippers and marina operators in 2013, SERC and DLNR developed a questionnaire aimed at boaters in Hawaii (Appendix 3). The questionnaire had four sections on vessel details, maintenance & coatings, storage and stationary periods, and voyage history. Our particular interest was in boaters that arrived from overseas, but we reached only low numbers of such vessels during the study period. We also obtained data on temporary mooring permits from Ala Wai marina, Oahu. Results Out of sixty questionnaire respondents, eleven had arrived from out-of-state. Those vessels came from Los Angeles, California (6); Seattle, Washington; Cook Islands, Alaska; Apra
25
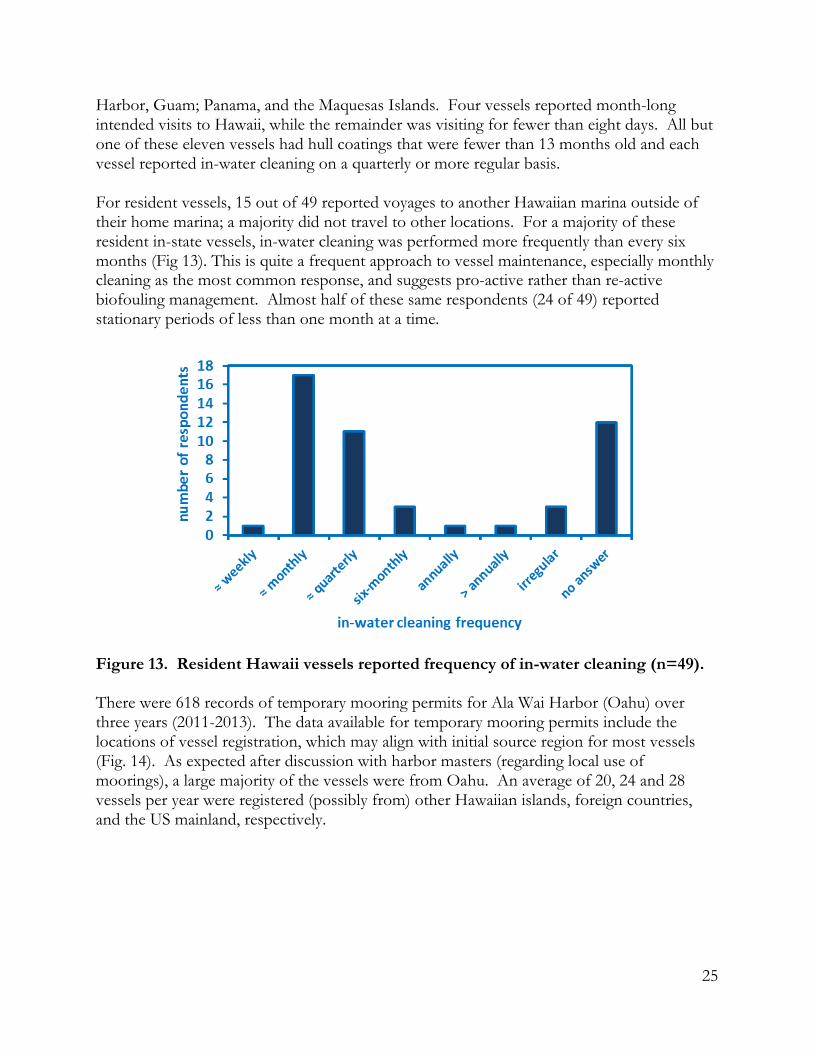
Harbor, Guam; Panama, and the Maquesas Islands. Four vessels reported month-long intended visits to Hawaii, while the remainder was visiting for fewer than eight days. All but one of these eleven vessels had hull coatings that were fewer than 13 months old and each vessel reported in-water cleaning on a quarterly or more regular basis. For resident vessels, 15 out of 49 reported voyages to another Hawaiian marina outside of their home marina; a majority did not travel to other locations. For a majority of these resident in-state vessels, in-water cleaning was performed more frequently than every six months (Fig 13). This is quite a frequent approach to vessel maintenance, especially monthly cleaning as the most common response, and suggests pro-active rather than re-active biofouling management. Almost half of these same respondents (24 of 49) reported stationary periods of less than one month at a time.
Figure 13. Resident Hawaii vessels reported frequency of in-water cleaning (n=49). There were 618 records of temporary mooring permits for Ala Wai Harbor (Oahu) over three years (2011-2013). The data available for temporary mooring permits include the locations of vessel registration, which may align with initial source region for most vessels (Fig. 14). As expected after discussion with harbor masters (regarding local use of moorings), a large majority of the vessels were from Oahu. An average of 20, 24 and 28 vessels per year were registered (possibly from) other Hawaiian islands, foreign countries, and the US mainland, respectively.

26
Figure 14. Registration locations for 618 vessels that received temporary mooring permits at Ala Wai Harbor, Oahu, over three years. Discussion Because our data collection on recreational boaters was fairly limited, it is not possible to generalize questionnaire responses. This small subset of data did include positive management implications, especially regarding the frequency of in-water cleaning by residents and overseas arrivals, however. Proactive hull cleaning occurring at regular intervals (e.g. quarterly) is preferable to reactive cleaning that intends to clean off biofouling that may have accumulated elsewhere, thus assisting the introduction process. A majority of the respondents indicated a proactive approach to in-water cleaning. The earlier data from Godwin et al (2004) regarding the arrivals of overseas vessels indicated that approximately 80 overseas arrivals were registered with the border agency annually. There were peaks of 16 vessels per month in those two years, and troughs of zero or one vessel. While the Godwin data set did not include arrivals from the US mainland, it did suggest that overseas arrivals amount to a manageable number of events to respond to. At least in terms of a pilot scale examination, it would be useful to have a monitoring team (as small as two people) interact with each overseas arrival for 2-3 years, to assess their vessel’s hull and generate some data on source locations and maintenance patterns. It is likely that boaters arriving from out-of-state tend to manage their vessels carefully. Boaters that travel through the open ocean tend not to treat their vessel’s maintenance casually and our discussions with some of them suggest they pay keen attention to the performance of the hull coatings. Nonetheless, the research (mainly from New Zealand) that has examined the extent and diversity of biofouling on overseas vessel arrivals to remote islands suggests that the risk of introduction is real and unevenly distributed among that vessel population (e.g. Floerl et al., 2005). It would be a relatively low-cost effort to generate similar data for Hawaii.

27
Research & Monitoring Recommendations for Marine Invasions and Biofouling Vectors in Hawaii Introduction Hawaii’s geographic remoteness means that many organisms arriving on the hulls of vessels from elsewhere are likely to be non-native and pose an invasion risk. However, as a remote island state, there is very little opportunity for natural spread of invaders from other countries or states, meaning vector management strategies could prove very effective at reducing the invasion rate. There are several approaches to marine invasion research and monitoring that could be considered for future projects in the state to promote prevention of new invasions in its coastal waters. Research & Monitoring Priorities Understanding the shifting invasion baseline and monitoring change
Monitoring for marine invasions at sentinel sites, using a standardized protocol and repeated measure over several years, is a priority for Hawaii and marine invasion management more generally. While the knowledge base for Hawaii invasions is quite robust, much of the work is based on compiled literature information (as in Carlton & Eldredge, 2009). As such, there is a lack of standardized measures through time that are needed to better understand the invasion rate and the vectors responsible for new invasions. Fortunately, there are established protocols for port surveys or settlement plates that could be adopted in key gateways to the state (e.g. Honolulu port, Pearl Harbor, major marinas). If such a detailed survey were carried out, it would greatly improve the baseline of knowledge of Hawaii marine invasions and would allow for the detection of changes in the invasion rate if repeated over time. Monitoring invasions in natural areas of high conservation value
The NW Hawaiian islands are a world-recognized example of an area of high conservation value for which strict management policies are in place to prevent marine invasions. While it is impractical to adopt such strategies across all of the islands, it would be beneficial to monitor for marine invasions in protected areas and high-value habitats in the main Hawaii Islands. An approach to such monitoring could include the use of existing programs by state managers or researchers conducting work at these sites, or the use of citizen science (e.g. recreational divers) to monitor and document particular locations or habitats. Utilizing citizen scientists in bioinvasion monitoring
Citizen science projects help to generate data when resources are challenged by the scale of a problem. Citizen scientists provide a potential cost-effective method to increase the scale of monitoring for marine NIS and such projects have been adopted elsewhere and in Hawaii (for example, the Reef Resilience Network). A citizen science strategy could be developed for Hawaii’s marine invasions that incorporates divers, boaters, and other interested stakeholders to report standardized information on the presence or absence of focal taxa

28
across sites. Citizen science projects tend to increase awareness of invasion issues (in addition to generating data), which can help in the broader adoption of habits and practices to prevent species invasions. A ‘bioblitz’ approach, whereby a coordinator organizes an ‘expedition’ of citizen scientists to survey an area, is a relatively cost-effective method of generating data and awareness. Coordination with existing programs is also recommended to maximize efforts and avoid duplication (e.g. the Reef Resilience Network cover invasions in coral reefs, but other habitat types could benefit from a related network). Vector sampling
Data on biofouling and other vectors arriving to Hawaii are sparse. With the exception of Godwin and colleagues efforts from over a decade ago, there has been little attempt to understand the vector biota arriving on the submerged surfaces of ships and boats. During 2013-2014 DLNR attempted to incorporate a thorough vessel sampling component to support this project. Due to a range of circumstances, available sampling events were sparse (n=6 vessels). For this reason the data that was collected is included in Appendix 4 as a field note and it is not possible to draw meaningful conclusions. It would be useful to conduct biofouling surveys of arriving vessels in Hawaii (commercial and recreational) as new policies are developed such that the efficacy of those policies could be evaluated over time. Recreational boat traffic
Data on the arrivals of recreational boats to Hawaii should be more readily available for evaluation. At present, Customs and Border Protection (CBP) and individual marinas gather data on the arrivals of vessels from outside of Hawaiian waters. A better effort to standardize and centralize these data would greatly help in the effort to monitor for marine invasions and manage any risky vessels that may be arriving. Establishing a reporting mechanism to alert marine invasive species staff at DLNR of risky vessels would also greatly increase DAR’s ability to adequately respond to marine invasion risks. This is a major gap in determining risk of biofouling introductions to Hawaii and a pilot study focused on evaluations of every arriving overseas boat would be very beneficial.
Monitoring inter-island spread of marine NIS and incursion response research
While it is a priority to prevent new marine invasions in Hawaii, there is also some importance attached to monitoring species establishment and spread throughout the islands. In general, the impact of an invading species increases as it spreads from place to place and within a locality. The nature of inter-island spread of marine invaders is not well-known in Hawaii and standardized monitoring of marine invasions (e.g. settlement plate surveys) across the main gateways of each island (main ports/marinas) would improve post-establishment management decision-making. In addition, there is a general lack of understanding of control or eradication feasibility for marine invasions. Some control efforts are underway in Hawaii to manage invasive algae and more desk-based and field research could be conducted to support decision-making and resource use for incursion response.

29
Evaluation of Biofouling Management Strategies for Vessel Arrivals from Out-of-State Shipping and boating are crucially important economic, logistical, cultural, and recreational activities that connect Hawaii to the wider world. Similarly, the naval base at Pearl Harbor is strategically important to the state and the nation. The flux of many types of vessels to Hawaii has underpinned the state’s historical and economic development and will remain an integral part of the islands’ future. However, prudent biosecurity measures could be employed to reduce the risk of further marine bioinvasions in Hawaii. It is very important to highlight the work of Scott Godwin and colleagues and refer to a 2004 report that examined the Hawaiian perspective of the vessel biofouling issue in a comprehensive manner (Godwin et al., 2004). As an invasion prevention issue, vessel biofouling has been recognized by state agencies, researchers, and other stakeholders as an important gap in the biosecurity of the state. Godwin et al (2004) provided decision frameworks for management intervention and that report and its recommendations remain as options for consideration as Hawaii develops vessel biofouling policies. In a previous assessment of management options of California fishing vessels by our research group (Davidson et al., 2012), we outlined a range of options that are relevant to broader considerations of biofouling vector management. Here, we use a similar template to assess the biofouling policy options for Hawaii in a general order from least challenging to most challenging (or least expensive to most expensive to implement). Retain the status quo
In this scenario, Hawaii would take no action on biofouling management at the present time. This would ensure there would be no conflict with the shipping and boating industry, although there may be some conflict with those concerned about marine invasions from this vector. There is a possibility that broader adoption of IMO guidelines or cross jurisdiction benefits (from New Zealand or California, for example) could reduce Hawaii’s biofouling biosecurity risk. However, these policy developments elsewhere could also cause vessels to adopt riskier behavior in Hawaii (e.g. more in-water cleaning in the state) because of rules elsewhere. The ‘take-no-action’ approach is likely to have no effect on reducing the invasion risk to Hawaii from overseas vessels and the impacts of marine invasions will increase over time. Conduct outreach to promote biofouling management
The adoption of best-practice guidelines (such as the IMO template) could be promoted via outreach campaigns. This may increase awareness and adoption of these practices, but further research would be required to determine the effect of the campaign on arriving vessels. It was notable that only one-third of Hawaii’s vessels responded to the DLNR questionnaire. It’s possible that voluntary practices will not alter the behavior or awareness

30
of “riskier”, more poorly managed ships (i.e. vessels that did not respond to the DLNR questionnaire). The effect of such a campaign on biofouling transfers to the state would be largely unknowable. ‘Wait-and-see’ & require biofouling management record-keeping
While best-practices have been developed in other jurisdictions, they do vary from location to location and methods for determining efficacy have yet to be developed. Hawaii could choose to adopt a ‘wait-and-see’ stance on biofouling policies to learn more about risk-reduction from other jurisdictions. While doing so, Hawaii could require vessels to submit annual reporting forms on their biofouling management and request that management plans and log books be made available for examination upon request in Hawaii. The major drawback of such an approach is that invasion risk from biofouling will be unaffected in the interim. Propose voluntary biofouling standards
Hawaii could develop its own biofouling policy that deals explicitly with biofouling standards (and/or ‘presumed compliance’ based on maintenance activities) but not make these mandatory. New Zealand has recently become the first country to create a biofouling regulation and standard, but it has a four-year voluntary lead-in period. Such an approach provides a specific set of practices and thresholds (e.g. clean hulls) that must be met, while providing the shipping industry with the time and flexibility to determine how best to meet the standards. Propose mandatory rules regarding biofouling (using IMO/New Zealand standards)
Hawaii could create a biofouling standard or an explicit list of ‘presumed compliance’ standards and enforce the standards. The benefits of such an approach include an immediate effect on the transfers of species into the state and a reduction in biosecurity risk. The drawbacks include the cost of implementing the policy, probable conflict with the shipping industry (though this is not insurmountable), and the development of methods to determine if a standard is being met. Expand the PMNM biofouling policy to the rest of Hawaii
Hawaii is one of the few jurisdictions in the world with a biofouling policy in place within some of its territory. The state’s pivotal role in managing the Papahãnaumokuãkea Marine National Monument (PMNM), including explicit provisions for preventing biofouling-mediated invasion, is also a globally significant vector management program. The existing policy could be adopted state-wide. While this is highly unlikely because of feasibility and cost, it is worth reiterating that the most protective approach to biofouling management already exists within the state.

31
Acknowledgements We are grateful to a large and diverse group of individuals who participated in the many facets of this project. A big mahalo to William J. Aila Jr, former Chairperson for the Department of Land and Natural Resources (DLNR), whose genuine interest and ongoing commitment to resource protection provided critical energy to progress this work. We acknowledge the funding sources, the Hawaii Invasive Species Council (HISC), U.S. Fish and Wildlife Service (USFWS) and the Hau`oli Mau Loa Foundation and their support staff Josh Atwood, Josh Fisher and Christy Martin whose continued support for marine bioinvasions research, risk assessment and policy development has allowed this important work to proceed. We thank Christy Martin of the Coordinating Group on Alien Pest Species for administrative and project management support, and her continued energy towards the project's success. We thank Chris Scianni of the California State Lands Commission for his insights, reviews, advice and assistance throughout the project. We thank Scott Godwin for promulgating biofouling management in Hawaii by leading the first Hawaii biofouling workshop in 2003, for his advice and assistance at key points in the project, for training DAR staff in marine invasives taxonomy and for his continued commitment to marine biosecurity. We thank all who attended the 2013 DLNR Alien Aquatic Organism Task Force Workshop on Biofouling in Hawaii Kai and all of the companies and individuals who assisted with shipper data gathering. We thank the DLNR Division of Boating and Ocean Recreation for assistance in accessing state marinas and arrival records. We thank Marisco dry dock Barbers Point and the Pearl Harbor Shipyard for providing access to vessels for biofouling sampling. We acknowledge Young Brother's support for in-water vessel surveys. We thank the taxonomic support provided by Bishop Museum staff Kenneth Longenecker, Holly Bollick, Regie Kawamoto and Scott Godwin. Thanks to Mark Minton at SERC for data assistance, mapping, and discussions. Thanks to Chris Starkey (Australian Government Department of Agriculture), Chris Scianni, Christy Martin and David Duffy for report review.

32
References Carlton JT, Eldredge LG (2009) Marine Bioinvasions of Hawaii. Bishop Museum Bulletins
in Cultural and Environmental Studies, Bishop Museum Press, Honolulu, 203pp.
Cohen AN, Carlton JT (1998) Accelerating invasion rate in a highly invaded estuary. Science 279: 555-558
Conklin EJ, Smith JE (2005) Abundance and spread of the invasive red algae, Kappaphycus spp., in Kane’ohe Bay, Hawaii and an experimental assessment of management options. Biological Invasions. 7: 1029-1039.
Eldredge LG, Carlton JT (2002) Hawaiian marine bioinvasions: a preliminary assessment. Pacific Science. 56: 211-212.
Davidson IC, McCann LD, Fofonoff PW, Sytsma MD, Ruiz GM (2008) The potential for hull-mediated species trasnfers by obsolete ships on their final voyages. Diversity & Distributions. 14: 518-529.
Davidson I, Ashton G, Zabin C, Ruiz G (2012) Aquatic invasive species vector risk assessments: the role of fishing vessels as vectors for marine and estuarine species in California. Report to the Ocean Science Trust, Oakland, California.
Fofonoff PW, Ruiz GM, Steves B, Carlton JT. 2003. National Exotic Marine and Estuarine Species Information System. http://invasions.si.edu/nemesis/. Access Date: July 2012
Godwin LS (2003) Hull fouling of maritime vessels as a pathway for marine species invasions to the Hawaiian Islands. Biofouling 19 (Supplement): 123-131.
Godwin LS, Eldredge L, Gaut K (2004) The assessment of hull fouling as a mechanism for the introduction and dispersal of marine alien species in the main Hawaiian islands. Bishop Museum Technical Report No. 28. Honolulu, Hawaii.
Gollasch S (2006) Overview on introduced aquatic species in European navigational and adjacent waters. Helgoland Marine Research. 60: 84-89.
Gutierrez B (2013) State growing urchins to fight invasive seaweed in Kaneohe Bay. Hawaii News Now: http://www.hawaiinewsnow.com/story/23142506/state-growing-urchins-to-fight-invasive-seaweed-in-kaneohe-bay
Hayden BJ, Iglis GJ, Schiel DR (2009) Marine invasions in New Zealand: A history of complex supply-side dynamics. In Rilov G, Crooks JA (eds.) Biological Invasions in marine ecosystems. Ecological Studies 204. Springer-Verlag Berlin Hedielberg. pp. 409-423.
Hewitt CL, Campbell M (2010) The relative contribution of vectors to the introduction and translocation of marine invasive species. Report to the Department of Agriculture, Fisheries and Forestry, Canberra, Australia. 56pp.

33
Hewitt CL, Campbell ML, Thresher RE, Martin RB, and 15 others (2004) Introduced and cryptogenic and species in Port Phillip Bay, Victoria, Australia. Marine Biology 144:183-202.
Hopkins GA, Forrest BM (2010) A preliminary assessment of biofouling and non-indigenous marine species associated with commercial slow-moving vessels arriving in New Zealand. Biofouling. 26: 613-621.
Kahng SE, Grigg RW (2005) Impact of an alien octocoral, Carijoa riisei, on black corals in Hawaii. Coral Reefs. 24: 556-562.
Kaiser BA (2006) Eocnomic impacts of non-indigenous species: Miconia and the Hawaiian economy. Euphytica. 148: 135-150.
Lockwood JL (2006) Life in a double-hotspot: the transformation of Hawaiian passerine bird diversity following invasion and extinction. Biological Invasions. 8: 449-457.
Mead A, Calrton JT, Griffiths CL, Rius M (2011) Revealing the scale of marine bioinvasions in developing regions: a South African re-assessment. Biological Invasions. 13: 1991-2008.
Medeiros AC, Loope LL, Conant P, McElvaney S (1997) Status, ecology, and management of the invasive plant, Miconia calvescens (Melastomataceae) in the Hawaiian Islands. Bishop Museum Occasional Papers. 48: 23-36.
Piola R, Conwell C (2010) Vessel biofouling as a vector for the introduction of non-indigenous marine species to New Zealand: Fishing vessels. Report to the Ministry of Agriculture and Forestry, Biosecurity New Zealand. Wellington, New Zealand. 61pp.
Ruiz GM, Fofonoff PW, Carlton JT, Wonham MJ, Hines AH (2000) Invasion of coastal marine communities in North America: apparent patterns, processes and biases. Annual Review of Ecology and Systematics. 31: 481-531
Ruiz GM, Fofonoff PW, Steves BP, Carlton JT (in press) Invasion history and vector dynamics in coastal marine ecosystems: a North American perspective. Aquatic Ecosystem Health and Management Society.
Scianni C, Brown C, Newsom A, Nedelcheva R, Falkner M, Dobroski N (2013) 2013 Biennial report on the California marine invasive species program. Report to the California State Legislature, Sacramento, California. 157pp.
US Department of Commerce (2013) FT920 U.S. Merchandise trade: selected highlights, December 2013. Washington DC. 52pp.
Williams SL, Davidson IC, Pasari JR, Ashton GV, Carlton JT, Crafton RE, Fontana RE, Grosholz ED, Miller AW, Ruiz GM, Zabin CJ (2013) Managing multiple vectors for marine invasions in an increasingly connected world. Bioscience. 63: 952-966.
Yeo DCJ, Ahyong ST, Lodge DM, Ng PKL, Naruse T, Lane DJW (2010) Semisubmersible oil platforms: understudied and potentially major vectors of biofouling-mediated invasions. Biofouling. 26: 179-186.

34
Appendix 1: Supporting information for Figure 3.
source'region number'of'NIS arrow'fontAsia%Africa 1 0.75
Atlantic%/%N%Atl 14 4
Australia 2 1.5
Caribbean%&%Gulf 7 3
E%Pacific 8 3
Indian%ocean 1 0.75
IndoBPacific 62 10
Japan 11 3
Micronesia 4 1.5
NE%Atlantic 7 3
NE%Pacific 7 3
North%America 3 1.5
NW%Atlantic 9 3
NW%Pacific 3 1.5
PontoBcaspian 1 0.75
red%sea 2 1.5
Samoa 1 0.75
southern%hemisphere 15 4
Tahiti/fr%poly 1 0.75
unknown/crypto 177 25
W%Atlantic 7 3
W%Pacific 3 1.5

35
Appendix 2: Commercial vessel Questionnaire
36

37

38
39
Appendix 3: Hawaii Boater Questionnaire

40
41

App
endi
x 4:
Fie
ld n
ote
– co
mm
erci
al v
esse
l bio
foul
ing
sam
plin
g T
able
4.1
: Bio
foul
ing
on tw
o H
awai
ian-
base
d ve
ssel
s [K
ey: A
=al
ien;
Co=
cosm
opol
itan
; Cr=
cryp
toge
nic;
n=
nati
ve]
Taxo
n
Status
Haw
aiia
n Ve
ssel
A
n=10
sam
ples
H
awai
ian
Vess
el B
n=
15 s
ampl
es
1 2
3 4
5 6
7 8
9 10
11
12
13
14
15
1
2 3
4 5
6 7
8 9
10
13
14
16
17
19
ALG
AE
- un
iden
tifie
d
X
X
PO
RIF
ER
A -
unid
entif
ied
X
X
X
X
X
X
X
X
X
X
X
X
P
LATY
HE
LMIN
THE
S -
unid
entif
ied
X
X
X
X
X
X
N
EM
ATO
DA
- un
iden
tifie
d
X
A
NN
ELI
DA
Bra
nchi
omm
a ni
grom
acul
atum
(Bai
rd, 1
865)
X
X
X
X
X
X
X
X
X
X
X
X
Leod
ice
ante
nnat
a (S
avig
ny in
Lam
arck
, 181
8)
X
X
X
X
X
X
X
X
X
X
Eun
ice
filam
ento
sa G
rube
& Ö
rste
d in
Gru
be, 1
856
X
Eun
ice
vitta
ta (D
elle
Chi
aje,
182
8)
X
X
X
X
X
X
Gly
cera
tess
elat
a G
rube
, 184
0
X
X
Hyd
roid
es d
iram
phus
Mör
ch, 1
863
A
X
X
X
X
Hyd
roid
es c
ruci
gera
(Mör
ch, 1
863)
A
X
X
X
Hyd
roid
es e
lega
ns (H
asw
ell,
1883
) A
X
X
X
X
X
X
X
X
Le
pido
notu
s ha
vaic
us K
inbe
rg, 1
856
X
X
X
X
X
Lysi
dice
nin
etta
Aud
ouin
& M
ilne-
Edw
ards
, 183
3
X
X
X
X
Lysi
dice
uni
corn
is (G
rube
, 184
0)
X
Neo
dexi
ospi
ra fo
ram
inos
a (B
ush
in M
oore
& B
ush,
19
04)
Cr
X
Neo
dexi
ospi
ra s
p.
X
X
P
alea
notu
s sp
.
X
P
ileol
aria
mili
taris
Cla
parè
de, 1
870
A
X
X
Pot
amill
a (?
) sp.
X
X
X
X
Sab
ellid
ae s
p. 1
X
S
erpu
la v
erm
icul
aris
Lin
naeu
s, 1
767
Cr
X
X
X
X
X
X
X
X

43
Spi
robr
anch
us g
igan
teus
(Pal
las,
176
6)
X
Spi
rorb
is m
ario
ni C
aulle
ry &
Mes
nil,
1897
X
X
Syl
lidae
- un
iden
tifie
d
X
X
X
X
X
X
X
X
X
X
X
X
X
X
X
X
X
X
X
X
X
X
X
Eun
icid
ae -
unid
entif
ied
X
X
X
X
P
olyn
oida
e - u
nide
ntifi
ed
X
X
X
X
S
abel
lidae
- un
iden
tifie
d
X
X
X
X
X
X
Ser
pulid
ae -
unid
entif
ied
X
X
X
X
S
piro
rbid
ae -
unid
entif
ied
X
X
X
X
X
X
X
X
X
X
X
Phy
llodo
cida
e - u
nide
ntifi
ed
X
X
X
X
C
haet
opte
ridae
- un
iden
tifie
d
X
X
X
S
pion
idae
- un
iden
tifie
d
X
X
X
Te
rebe
llida
e - u
nide
ntifi
ed
X
Lum
brin
erid
ae -
unid
entif
ied
X
X
S
IPU
NC
ULA
- un
iden
tifie
d
X
X
X
M
OLL
US
CA
Biv
alvi
a - u
nide
ntifi
ed ju
veni
les
X
Bra
chid
onte
s cr
ebris
triat
us (C
onra
d, 1
837)
X
C
rass
ostre
a (?
) sp.
X
C
repi
dula
acu
leat
a (G
mel
in, 1
791)
A
X
X
X
X
X
X
X
X
X
X
D
endo
stre
a sa
ndvi
chen
sis
(Sow
erby
, 187
1)
X
X
X
X
X
Dio
dora
oct
agon
a (R
eeve
, 185
0)
X
X
H
yotis
sa n
umis
ma
(Lam
arck
, 181
9)
X
X
X
X
X
X
X
X
X
X
X
X
X
X
X
X
X
X
X
X
X
X
X
X
Isog
nom
on le
gum
en (G
mel
in, 1
791)
X
Li
thop
haga
sp.
X
Mal
leus
regu
la (F
orsk
ål, 1
775)
X
X
X
X
X
X
X
X
Mus
culu
s av
iariu
s D
all,
Bar
tsch
& R
ehde
r, 19
38
X
Neo
pycn
odon
te c
ochl
ear (
?) (P
oli,
1795
)
X
X
X
Ost
reid
ae s
p.
X
Pin
ctad
a cf
. mar
garit
ifera
(Lin
naeu
s, 1
758)
X
S
acco
stre
a (?
) sp.
X
S
eptif
er c
umin
gii (
Réc
luz,
184
9)
X
X
X
X
X
X
X
X
AR
THR
OPO
DA

44
Pycn
ogon
ida
A
nopl
odac
tyly
s ca
lifor
nicu
s H
all 1
912
1 C
o X
X
C
irrip
edia
- un
iden
tifie
d
Eur
aphi
a he
mbe
li P
ilsbr
y, 1
928
N
X
X
X
Te
sser
opor
a pa
cific
a (P
ilsbr
y 19
28)
N
X
X
X
X
X
X
X
X
X
B
alan
us tr
igon
us D
arw
in, 1
854
A
X
X
X
X
X
X
X
X
X
X
X
X
X
X
Am
phib
alan
us re
ticul
atus
(Utin
omi,
1967
) A
X
X
X
X
X
X
X
X
X
X
X
X
X
X
A
mph
ibal
anus
am
phitr
ite (D
arw
in, 1
854)
A
X
X
X
X
X
X
X
Am
phib
alan
us e
bern
eus
A
X
X
X
X
Cop
epod
a - u
nide
ntifi
ed
X
Ost
raco
da -
unid
entif
ied
X
Stom
atop
oda
un
iden
tifie
d la
rva
X
X
A
mph
ipod
a
Am
pith
oe ra
mon
di A
udou
in, 1
826
Co
X
C
olom
astix
luna
lilo
Bar
nard
, 197
0 N
X
Col
omas
tix p
usill
a G
rube
, 186
1 C
o
X
X
La
ticor
ophi
um b
acon
i (S
hoem
aker
, 193
4) 2
A
X
X
X
X
X
X
X
X
X
X
X
X
X
X
X
Ela
smop
us ra
pax
Cos
ta, 1
853
A
X
X
X
x X
X
X
X
X
X
X
X
X
X
X
X
X
X
Eric
htho
nias
pun
ctat
us (B
ate,
185
7) 3
A
X
X
X
X
X
X
X
X
X
X
X
X
Le
doye
rella
hal
eiw
a (B
arna
rd, 1
970)
N
La
tigam
mar
opsi
s ka
umak
a (B
arna
rd, 1
970)
N
X
X
X
X
Ja
ssa
falc
ata
(Mon
tagu
, 180
8)
A
X
X
X
X
X
X
Leuc
otho
e hy
helia
Bar
nard
, 196
5 N
X
X
X
X
X
Aru
gella
ew
a (B
arna
rd, 1
970)
N
X
X
X
X
D
ulic
hiel
la a
ppen
dicu
lata
(Say
, 181
8) 4
C
o
X
Par
aleu
coth
oe fl
inde
rsi (
Ste
bbin
g, 1
888)
A
X
Pho
tis h
awai
ensi
s (B
arna
rd, 1
955)
C
r X
X
X
X
X
X
X
X
X
X
X
X
X
X
X
Ste
noth
oe g
alle
nsis
Wal
ker,
1904
A
X
X
X
X
X
X
C
apre
lla s
caur
a Te
mpl
eton
, 183
6 A
X
X
Is
opod
a
Ant
huro
idea
- un
iden
tifie
d 5
X
X
S
phae
rom
atid
ae -
unid
entif
ied
X
X
X
Tana
idac
ea

45
Zeux
o se
urat
i (N
obili
, 190
6) 6
X
X
X
X
X
X
X
D
ecap
oda
S
ynal
pheu
s pa
rane
omer
is C
outiè
re, 1
905
N
X
X
Den
drob
rach
iata
- un
iden
tifie
d
X
X
X
B
rach
yura
Thal
amita
aua
uens
is R
athb
un, 1
906
N
X
X
Pac
hygr
apsu
s m
inut
us A
. Miln
e-E
dwar
ds, 1
873
N
X
P
ilum
nus
oahu
ensi
s E
dmon
dson
, 193
1 N
X
X
X
X
X
X
X
unid
entif
ied
X
X
X
E
CTO
PR
OC
TA -
unid
entif
ied
X
X
X
X
X
X
X
X
X
X
X
X
X
X
X
X
X
X
X
X
X
X
X
X
X
X
X
X
EC
HIN
OD
ER
MA
TA
O
phia
ctis
sav
igny
i (M
ülle
r & T
rosc
hel,
1842
) C
r
X
X
X
UR
OC
HO
RD
ATA
Pha
llusi
a ph
ilipp
inen
sis
Mill
ar, 1
975
A
X
X
Asc
idia
"A" A
bott
et a
l., 1
997
A
X
X
X
X
Asc
idia
arc
haia
Slu
iter,
1890
A
X
X
X
X
X
X
X
X
A
scid
ia "B
" Abo
tt et
al.
1997
A
X
Cne
mid
ocar
pa ir
ene
(Har
tmey
er, 1
906)
A
X
Her
dman
ia p
allid
a (H
elle
r, 18
78)
A
X
X
X
X
X
X
X
X
Mic
roco
smus
exa
sper
atus
Hel
ler,
1878
A
X
X
X
X
X
X
P
olya
ndro
carp
a sa
gam
iens
is T
okio
ka, 1
953
A
X
X
X
P
olyc
arpa
aur
ita (S
luite
r, 18
90)
A
X
X
X
X
X
X
X
X
Pol
yclin
um c
onst
ella
tum
Sav
igny
, 181
6 A
X
X
X
X
X
Sty
ela
cano
pus
(Sav
igny
, 181
6)
A
X
X
Sym
pleg
ma
sp.
Cr
X
X
X
X
X
un
iden
tifie
d
X
X
X
* W
orld
Reg
iste
r of M
arin
e S
peci
es li
sts
S. b
ryan
ae (P
ilsbr
y, 1
921)
as
a sy
nony
m w
here
as In
tegr
ated
Tax
onom
ic In
form
atio
n S
yste
m a
ccep
ts S
. bry
anae
as
valid
.
1 A
nopl
odac
tylu
s pr
ojec
tus
of H
ilton
, 194
2
2 C
orop
hium
bac
oni i
n B
arna
rd, 1
970
3 E
richt
honi
us b
rasi
liens
is o
f Bar
nard
, 197
0
4 M
elita
app
endi
cula
ta o
f Bar
nard
, 197
0
5 D
oes
not m
atch
any
spe
cies
cur
rent
ly k
now
n fro
m H
awai
i
6 A
nata
nais
insu
laris
of M
iller
, 194
0

46
Exp
lana
tory
not
es a
nd c
avea
ts fo
r hu
ll-fo
ulin
g su
rvey
of H
awai
ian-
base
d ve
ssel
s
1) P
olyc
haet
es w
ere
iden
tifie
d by
Hol
ly B
olic
k; m
ollu
scs
wer
e id
entif
ied
by R
egie
Kaw
amot
o; p
erac
arid
cru
stac
eans
, alp
heid
sh
rimp,
and
ech
inod
erm
s w
ere
iden
tifie
d by
Ken
Lon
gene
cker
, sol
itary
tuni
cate
s w
ere
iden
tifie
d by
Sco
tt G
odw
in.
2) Q
uest
ion
mar
ks in
dica
te u
ncer
tain
ty a
bout
iden
tific
atio
ns.
3) A
ll na
mes
cor
resp
ond
to th
ose
used
in W
orld
Reg
iste
r of M
arin
e Sp
ecie
s (W
OR
MS)
. Fo
otno
tes
indi
cate
dis
crep
anci
es
betw
een
WO
RM
S an
d In
tegr
ated
Tax
onom
ic I
nfor
mat
ion
Syst
em (I
T I
S), o
r (pa
rtic
ular
ly fo
r per
acar
ids)
whe
n na
mes
in
WO
RM
S di
ffer
from
thos
e us
ed in
exi
stin
g lit
erat
ure
on m
arin
e in
trod
uctio
ns in
Haw
aii.
4) S
cott
God
win
ass
igne
d st
atus
to a
ll so
litar
y tu
nica
tes
(e.g
., al
ien,
cry
ptog
enic
). 5)
All
othe
r sta
tus
assi
gnm
ents
wer
e ob
tain
ed fr
om a
revi
ew o
f exi
stin
g lit
erat
ure
(per
form
ed b
y K
en L
onge
neck
er).
Man
y sp
ecie
s w
ere
not a
ddre
ssed
in th
e lit
erat
ure
(and
thei
r cor
resp
ondi
ng “
stat
us”
colu
mn
was
left
bla
nk).
Of t
hese
: a.
al
l pol
ycha
etes
to w
hich
spe
cies
nam
es w
ere
assi
gned
hav
e di
strib
utio
ns th
at m
ay ju
stify
con
side
ring
them
to b
e cr
ypto
geni
c/al
ien
b. t
he b
ival
ves
Mal
leus r
egul
a, N
eopy
cnod
onte
coch
lear,
Pinc
tada
mar
garit
ifer,
and
Sept
ifer c
umin
gii h
ave
dist
ribut
ions
that
may
ju
stify
con
side
ring
them
to b
e cr
ypto
geni
c/al
ien
c.
the
cosm
opol
itan
(in w
arm
sea
s) s
tatu
s of
a p
ycno
goni
d an
d tw
o pe
raca
rid c
rust
acea
ns m
ay w
arra
nt c
onsi
derin
g th
em to
by
cryp
toge
nic.
6)
Sam
ple
8 fr
om H
awai
ian
Ves
sel A
did
not
fix/
pres
erve
wel
l. S
ome
taxa
may
be
abse
nt d
ue to
dec
ompo
sitio
n.

47
Tab
le 4
.2 -
Bio
foul
ing
on c
omm
erci
al v
esse
ls th
at tr
ansi
ted
Haw
aii a
nd w
ere
sam
pled
in G
uam
G
enus
spe
cies
A
utho
r D
etec
tion
freq
uenc
y
U
nkno
wn
1
Bar
nacl
e'
1
Bar
nacl
e' +
Pte
riida
e
1 B
ival
via
1
Bra
chid
onte
s sp
.
13
Bra
chid
onte
s sp
. + M
odio
lus
sp.
1
Hia
tella
arc
tica
(Lin
naeu
s, 17
67)
4 K
ellid
ae: N
esob
orni
a sp
.
2 M
odio
lus
sp.
4
Mus
culu
s (M
odio
larc
a) s
p.
1
Myt
ilida
e
1 M
ytili
dae:
Mod
iolu
s sp
.
2 M
ytili
dae:
Myt
ilus
sp.
1
Om
obra
nchu
s ob
liquu
s (G
arm
an, 1
903)
1
Ost
reid
ae: C
rass
ostr
ea ?
1 O
stre
oide
a: O
stre
idae
or G
ryph
aeid
ae
4
Pinn
a sp
.
1 Pt
erio
idea
: Pte
riida
e
1 Pt
erio
idea
: Pte
riida
e? o
r Mal
leid
ae?
2
Sept
ifer s
p.
1