vibration-based tool wear monitoring using articial neural
TRANSCRIPT

Vibration-based tool wear monitoring using Arti�cialNeural Networks fed by Spectral centroid indicator &RMS of CEEMDAN modesMourad NOUIOUA ( [email protected] )
Universite 8 Mai 1945 Guelma https://orcid.org/0000-0003-0439-2112Mohamed Lamine BOUHALAIS
Universite 8 Mai 1945 Guelma
Research Article
Keywords: CEEMDAN, RMS, Tool wear, ANN, Vibration
Posted Date: April 2nd, 2021
DOI: https://doi.org/10.21203/rs.3.rs-357733/v1
License: This work is licensed under a Creative Commons Attribution 4.0 International License. Read Full License

Vibration-based tool wear monitoring using Artificial Neural Networks fed
by Spectral centroid indicator & RMS of CEEMDAN modes
*Mourad NOUIOUA1, Mohamed Lamine BOUHALAIS1
1 Mechanics Research Centre. Po, Box 73B, 25000 CONSTANTINE, ALGERIA.
*Corresponding Author: [email protected]
Abstract
In machining processes various phenomena occur during cutting operation. These
phenomena can disturb the production through the reduction of part quality and accuracy.
Therefore, a mastery of this cutting phenomena is needed to define the machining parameters
and take full advantage of manufacturing process. An easy way to classify these phenomena is
by monitoring incontrollable parameters, such as generated temperature and vibration. The
acquired vibration signals can provide information regarding tool life, cutting performances and
workpiece defects. This paper evaluates the possibility of monitoring the tool life during the
turning process of AISI 1045 steel using Laser Doppler Vibrometer (LDV), the surface
roughness has been measured along with the tool-wear until reaching its limit value of 300µm.
Furthermore, this paper also outlines the application of CEEMDAN technique to process the
acquired signals for the monitoring processes. RMS and SCI indicators have been used to
describe the wear progress, then, the artificial neural network has been adopted to achieve a real
time wear monitoring. The obtained results qualified the SCI indicator and ANN for online
monitoring.
Keywords: CEEMDAN, RMS, Tool wear, ANN, Vibration.

Introduction
Tool wear through machining processes is recognized by changing the geometry of the
cutting tool, thus increasing cutting force, affecting surface finish and may disturb dimensional
accuracy of the workpiece. The monitoring of machining processes can represent economy and
practicality due to it use for identifying tool wear sate, surface roughness, and anomalies during
the cutting operation that can cause waste, damage, and other impairing factors in this process
[1]. The tool wear monitoring is complex and should deliver a notification of when the cutting
insert should be replaced to avoid any change in the workpiece surface finish, the machine
integrity, and the manufactured parts tolerances [2]. However, to acquire these advantages it is
necessary to guarantee that the cutting set up is in perfect order.
Vibration is a common phenomenon in the finishing machining especially during
turning of a flexible workpiece because of its low rigidity [3]. The interest of industrials is to
avoid the vibrations that results bad surface quality and may defects the machining mechanisms
[4]. In this context Shahabi & M. Ratnam [5] tried to monitor the wear using High-resolution
CCD camera, they found that the developed control system is influenced by several
incontrollable factors such as the work environment, misalignment of cutting tool, presence of
micro-dust particles, vibration and intensity variation of ambient light. Other authors used the
intelligent image processing for tool wear monitoring [6], whereas, Wan-Hao Hsieh et al. [7]
used the vibration of the spindle for the monitoring system.
Babouri et al. [8] proposed the Wavelet Multi-Resolution Analysis to improve the
sensitivity of the vibration scalar indicators for the identification of the wear state during the
machining of X200Cr12 steel, they have proven that there is a possibility to associate the tool
wear with the vibration generated when machining. In another study [9], they used a spectral
indicator named spectral center of gravity (SCG) to highlight the three phases of tool wear, they
applied the spectral center of gravity to quantify the changes of the tool natural frequencies
amplitudes that result from the evolution of tool wear. Their obtained results are very promising
for industrial application. Rao et al. [10] used the vibration analysis in the turning of AISI1040
tube, outer diameter of 100 mm and inner diameter of 56 mm using a tool with nose radius of
0.8 and 0.4 mm under dry conditions. Among the several observations, vibration amplitudes
were found to increase with the progression of tool wear.
In wear detection using vibration analysis, Issam Abu-Mahfouz [11] adopted the
artificial neural network for tool condition monitoring. The results indicated that the averaged

harmonic wavelet coefficients and the maximum entropy spectrum peaks, are more efficient in
training the neural network than the time domain statistical moments. For the online monitoring,
Maohua Du et al. [12] investigated an intelligent, real-time and visible tool state monitoring
based on LabVIEW and MATLAB hybrid programming, their results showed that the correct
recognition rate of the network model after samples training is 92.59%, which can more
accurately and intelligently monitor the tool wear state. Other researchers strained the In-
process tool wear monitoring using deep learning [13] their results showed that the proposed
model was more robust and accurate for tool wear prediction.
Artificial Neural networks and its variants are among the most commonly used
approaches in tool wear assessment [14–15]. In several papers, extensions of ANNs have been
used and adapted to achieve higher performance in diverse cutting conditions for wear
monitoring [16]. Some researchers tried to take the advantage of various sensors to improve the
accuracy of the wear estimation algorithms [17]; however, it did not guarantee the enhancement
of the estimations.
In order to enhance the monitoring technics for wear classification in machining process,
the current study investigates the monitoring possibility of the cutting tool life when turning of
AISI 1045 steel with TNMG carbide insert. the cutting speed (Vc), feed rate (f) and the depth
of cut (ap) are fixed to be 300 m/min, 0.034mm/rev and 0.15mm respectively during all the
investigation to explore the vibration significance. The measuring system used for the
experiment is an LDV scanner (Laser Doppler Vibrometer) for non-contact acquisition where
the laser beam has been focused at the tool holder, and configured to follow the feed motion of
the tool during the cutting operation which provide a real time vibration signal, the acquired
signal has been analyzed using the Complete Ensemble Empirical Mode Decomposition with
Adaptive Noise (CEEMDAN) approach to be able to study just the frequencies domain that
contains more information regarding the development of the wear. After that, RMS and SCI
indicators have been calculated for the selected Intrinsic mode function (IMF) from the
CEEMDAN decomposition of the twenty-one runs and explore the information that could help
us to monitor the tool life regarding the measured wear values. In addition, the surface
roughness has been measured and evaluated with respect to the intensity of the vibrations and
the state of wear. Finally, the integration of the Artificial Neural Networks has been done for
forecasting the tool life. The monitoring process has been achieved as indicated in figure 1.
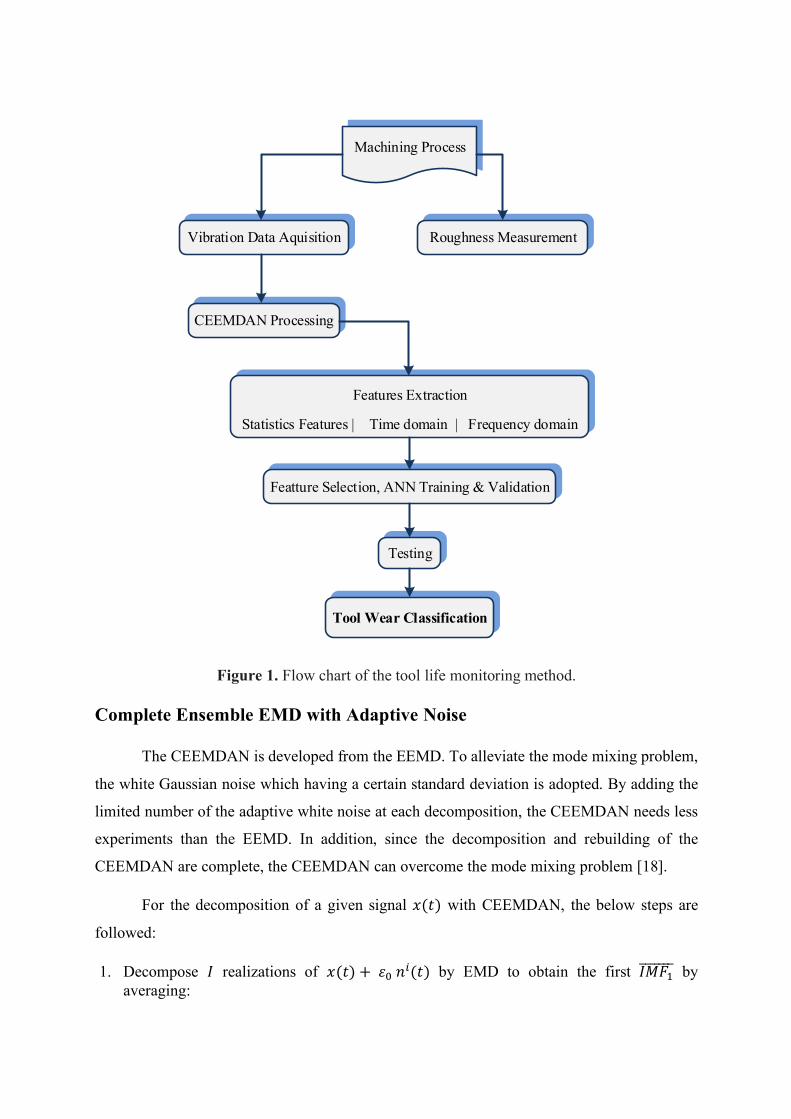
Figure 1. Flow chart of the tool life monitoring method.
Complete Ensemble EMD with Adaptive Noise
The CEEMDAN is developed from the EEMD. To alleviate the mode mixing problem,
the white Gaussian noise which having a certain standard deviation is adopted. By adding the
limited number of the adaptive white noise at each decomposition, the CEEMDAN needs less
experiments than the EEMD. In addition, since the decomposition and rebuilding of the
CEEMDAN are complete, the CEEMDAN can overcome the mode mixing problem [18].
For the decomposition of a given signal 𝑥(𝑡) with CEEMDAN, the below steps are
followed:
1. Decompose 𝐼 realizations of 𝑥(𝑡) +𝜀)𝑛+(𝑡) by EMD to obtain the first 𝐼𝑀𝐹./////// by
averaging:
Machining Process
Vibration Data Aquisition Roughness Measurement
CEEMDAN Processing
Features Extraction
Statistics Features | Time domain | Frequency domain
Featture Selection, ANN Training & Validation
Testing
Tool Wear Classification

𝐼𝑀𝐹.(𝑡)////////// = 1𝐼 2𝐼𝑀𝐹.+(𝑡)3+4.
2. Calculate the first residue as:
𝑟.(𝑡) = 𝑥(𝑡) −𝐼𝑀𝐹.(𝑡)////////// 3. Decompose 𝐼 realizations of 𝑟.(𝑡) +𝜀.𝐸.(𝑛+(𝑡)) until their first EMD mode and
calculate the second mode:
𝐼𝑀𝐹8(𝑡)/////////// = 1𝐼 2𝐸.(𝑟.(𝑡) +𝜀.𝐸.(𝑛+(𝑡)))3+4.
Where 𝐸9 is an operator that produces the 𝑗th mode obtained by EMD.
4. For 𝑘 = 2… .𝐾, calculate the 𝑘-th residue:
𝑟@(𝑡) = 𝑟@A.(𝑡) − 𝐼𝑀𝐹@(𝑡)/////////// 5. For 𝑘 = 2… .𝐾, define the (𝑘 + 1)-th mode as:
𝐼𝑀𝐹@B.(𝑡)///////////// = 1𝐼 2𝐸.(𝑟@(𝑡) +𝜀@ 𝐸@(𝑛+(𝑡)))3+4.
6. Go for step 4 for next 𝑘
Steps from 4 to 6 are repeated until the obtained residue in no longer feasible to be decomposed
and satisfies:
𝑅(𝑡) = 𝑥(𝑡) −2 𝐼𝑀𝐹@///////(𝑡)D@4.
With 𝐾 the total number of modes. The original signal 𝑥(𝑡) can be expressed in the end as:
𝑥(𝑡) = 2 𝐼𝑀𝐹@///////(𝑡)D@4.
+ 𝑅(𝑡) Experimental setup
The experimental conditions and cutting parameters are set according to different
aspects such as (the material to be machined, the machine tool and cutting tool) [19]. In this
experimental work, the tests have been carried out using a conventional lathe "KNUTH
TURNADO". The workpiece material is the AISI 1045 steel. The properties of the latter are
defined in the table 1,

Table 1 Chemical composition of AISI 1045 Steel.
Element Content
Carbon, C 0.420 - 0.50 %
Iron, Fe 98.51 - 98.98 %
Manganese, Mn 0.60 - 0.90 %
Phosphorous, P ≤ 0.040 %
Sulfur, S ≤ 0.050 %
The challenge for real-time monitoring is the positioning of the sensors because
depending on the application the sensors cannot be used, especially when using cutting fluid.
The vibration measurement in this study was performed using a non-contact Laser
Doppler Vibrometer (LDV). The laser beam from the LDV is directed to the surface of interest
on the holder. The vibratory amplitudes and frequencies were extracted from the Doppler shift
of the reflected laser beam due to the movement of the tool holder surface. The scanner has
been configured to follow the toolholder motion at the same speed (feed rate). As for the cutting
tool, the TNMG carbide insert was used for the machining tests. The schematic diagram of the
experimental set up is shown figure 2.
Figure 2. Experimental set up for monitoring system and data analysis.
Workpiece
Lathe
Tool Holder
Laser Beam
LDV Data Acquisition

Regarding the surface roughness, the measurements were taken directly after each test
using a roughness meter (PCE-RT 1200) which consists of a diamond tip (probe). While the
wear values have been measured after each run using Optika B-500 Microscope. The wear tests
were carried out at a cutting speed (Vc) of 300 m/min, cutting depth (ap) of 0.15mm and a feed
rate (f) of 0.034 mm/rev while the length of each machining run is 150 mm.
Results and Analysis
Wear and surface roughness analysis
In General, the flank wear (VB) is the most used factor to assess cutting tool life. Its
progress regarding the machining time passes through three phases: initial wear phase, wear
stabilization and accelerated wear as illustrated in figure 3.
Figure 3. Theoretical tool wear.
The life time of a cutting tool is influenced by a range of incontrollable factors. At high
speeds, the contact surface of the tool-workpiece generate latter a quantity of heat which alters
the cutting edges by complex physicochemical phenomena [20]. The tool-life is characterized
by the time taken to reach the limit value of the wear criterion considered in specific cutting
Initial wear Uniform wear Accelerated wear
Fla
nk
Wea
r V
B (µ
m)
Machining time
Steady-state wear regionFailure
region
Break-in period

conditions. The limit wear value taken in this study is 300 µm. The experimental results are
given in table 2.
Table 2. The experimental results
Run Order Response Factors
Ra (µm) VB (µm)
1 0.815 52.078
2 0.713 100.005
3 0.790 127.234
4 1.340 135.4
5 1.302 148.911
6 1.362 161.992
7 0.933 171.818
8 0.760 180.751
9 0.757 184.9
10 1.318 193.082
11 1.218 202.9
12 1.014 206.179
13 1.650 220.905
14 1.677 230.006
15 2.277 232.353
16 2.273 233.989
17 2.413 237.284
18 1.787 247.085
19 2.103 250.357
20 2.377 294.536
21 1.647 320.594
The present study aims to determine the relationship between vibration and wear of the
cutting tool, also to assess the possibility of monitoring the life of the cutting insert using non-
contact vibration measurements.

Figure 4. Wear Morphology from test of the cutting insert.

The figure 4 illustrates the wear morphology, and figure 5 illustrates its evolution as
function of machining time, the analysis of this figure shows that the rate of wear obeys the
universal law of wear of any cutting tool. Regarding the surface roughness, the surface
generated by the motion of the cutting edge of the tool has helical grooves resulting from the
pointed shape of the tool.
Figure 5. Wear Evolution Vs machining time
Indeed, the state of the tool-nose and the surface defects resulting the cutting
imperfections and crater wear and gives a different surface roughness of the theoretical
roughness. This difference is more or less sensitive depending on the operating conditions such
as workpiece material, cutting speed and feed, type of tool and its wear, time and machining
length. Also, any increases in flank wear VB result a corresponding deterioration in the
machined surface. At this point, it is required to specify that, as long as wear is regular and does
not exceed the tolerable limit, roughness (and in specific Ra) may increase gradually and the
surface quality remains acceptable. [21].
The surface roughness is considered as one of the most critical constraints for the
selection of cutting parameters in the planning of the machining process [22]. The figure 6
shows the obtained surface roughness for the twenty-on runs. At the beginning, the first three
runs reveal that the surface state is smooth due to low wear rate of the cutting edge. After, the

surface roughness fluctuates randomly according to the obtained tool geometry after each wear
state. Taking for example: the Ra value of the test 8 in which the surface quality has undergone
an improvement, the cutting edge become large resulting a crushing of asperities generating
better surface quality.
Figure 6. Surface roughness Vs. experimental run order
When the flank wear arrives to its accelerated phase, the surface quality becomes worst
because the cutting insert loses its original cutting geometry, providing new contact surface
which influences the general behavior of the machining process.
Vibration Analysis
The vibration signals acquired during machining are used to evaluate the possibility of
monitoring the evolution of cutting tool-wear, from the evolution of various relevant
parameters. For every machining run, the LDV is configured to scan 60 signals, every signal
was recorded for 1.28s which is equivalent to 27 min of the total machining time to achieve the
limit wear value.
The Figure 7 shows the autospectrum of a free machining run having the same cutting
speed and feed rate excluding the depth of cut. The purpose of this free test is to eliminate the
vibration frequencies associated to the machine without the cutting operation.

Figure 7. Free run spectrum.
The figure 8 shows the obtained autospectrum of the twenty-one runs, as illustrated the
frequency behavior from 0 to 5000Hz is same as in the free test, which indicates that these
frequencies have no relation with the machining operation. Otherwise, the band of [5000 20000]
can be considered for the wear analysis inasmuch as the magnitude variation noted in the
twenty-one runs.
But, by comparing the different spectrums, there are some visual features typical for each
machining run, A visualization of the autospectrum signals in figure 8 indicates that the
amplitude of the Autospectrum increases with the wear till the 15th run and subsides after the
16th run.

Figure 8. Autospectrum of the twenty-one runs.

It is noticed that there is a random change in the amplitude that resembles the behavior
of surface roughness, due to the new geometry of the cutting tool after reaching such wear state.
In this case, it is hard to specify a rule that characterizes the vibration behavior in turning
operation as regards wear and surface roughness.
CEEMDAN has been introduced to decompose the original vibration signals into a
collection of IMFs with corresponding frequencies in order to locate the study in the band of
[5000 20000]. Figure 9 shows an example of CEEMDAN decomposition results of the first
vibratory signal, which is decomposed into seventeen IMFs, then the first IMF has been selected
because it covers the considered band for the study. This work proposes this extraction method
and use of following statistical features from IMFs to evaluate the tool-wear.
Figure 9. CEEMDAN decomposition.
Root mean square (RMS)
RMS values of vibration signals can be used to monitor the overall vibration level of a
system. This is because the overall vibration level typically increases as the system deteriorates.
-10-50
Sig
nal 10
-6
-202
10-6
-202
10-6
-202
10-6
-202
10-6
-202
10-6
-202
10-6
-202
10-6
-202
10-6
-101
10-6
-505
10-7
-202
10-7
-101
10-7
-505
10-8
-4-202
10-8
-202
10-8
0
510
-8
1 2 3 4 5 6
104
-3.45-3.4
-3.3510
-6
0.005
16
0.01
0.015
0.02
0.025
IMF
FF
T M
ag
nit
ud
e
0.03
0.035
0.04
Run Order
1715000
Frequency (Hz)
100005000
18 0
0.01
1
0.02
0.03
0.04
IMF
FF
T M
ag
nit
ud
e
0.05
0.06
0.07
Run Order
215000
Frequency (Hz)
100005000
3 0
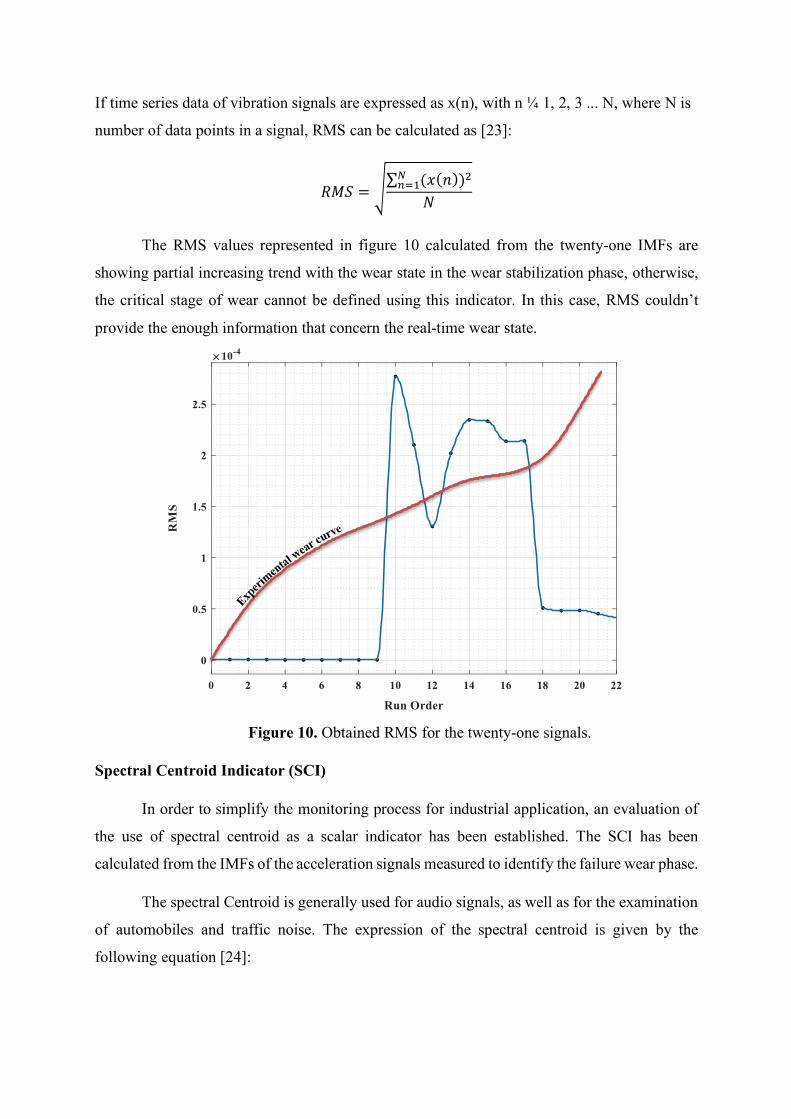
If time series data of vibration signals are expressed as x(n), with n ¼ 1, 2, 3 ... N, where N is
number of data points in a signal, RMS can be calculated as [23]:
𝑅𝑀𝑆 = F∑ (𝑥(𝑛))8HI4.𝑁
The RMS values represented in figure 10 calculated from the twenty-one IMFs are
showing partial increasing trend with the wear state in the wear stabilization phase, otherwise,
the critical stage of wear cannot be defined using this indicator. In this case, RMS couldn’t
provide the enough information that concern the real-time wear state.
Figure 10. Obtained RMS for the twenty-one signals.
Spectral Centroid Indicator (SCI)
In order to simplify the monitoring process for industrial application, an evaluation of
the use of spectral centroid as a scalar indicator has been established. The SCI has been
calculated from the IMFs of the acceleration signals measured to identify the failure wear phase.
The spectral Centroid is generally used for audio signals, as well as for the examination
of automobiles and traffic noise. The expression of the spectral centroid is given by the
following equation [24]:

𝐶𝑒𝑛𝑡𝑟𝑜𝑖𝑑 = ∑ 𝑓@𝑠@H@4I∑ 𝑠@H@4I
Where:
• fk is the frequency in Hz.
• sk is the spectral value.
Figure 11. SCI signature during machining time
As shown in Figure 11, the increases in SCI values at the first “11min” are function of
the vibration generated by the wear evolution. During the wear stabilization phase, the SCI
decreases significantly until the 15th min, this decrease causes a disturbance of the spectral
stability due to the state of wear, which is the case for the 9th test with a wear value of
171.818µm. (see figure 4), conducting that the wear morphology has an important influence on
the vibration behavior.
Arriving at the most severe stage of wear, the SCI indicator has taken the same trend as
the experimental wear curve due to the occurrence of serious vibrations that leads to the increase
in vibratory energy. which will provide us with more information about this critical phase.
ANN based modeling
To achieve the current results, several networks have been designed and tested to
explore the best architecture, the most suitable activation function, and the best training
algorithm. The back-propagation algorithm was used as learning algorithm, and the hyperbolic
tangent sigmoid transfer function (TANSIG) has been used as activation function. Several
network structures were tested, and the ideal networks were found to be a feed forward neural
network by 5 hidden layers, where the RMS and the spectral centroid indicator (SCI) have been
chosen as input parameters whereas, the target is Flank wear (VB). The performance capability
of each network was examined based on the correlation coefficient using the training,
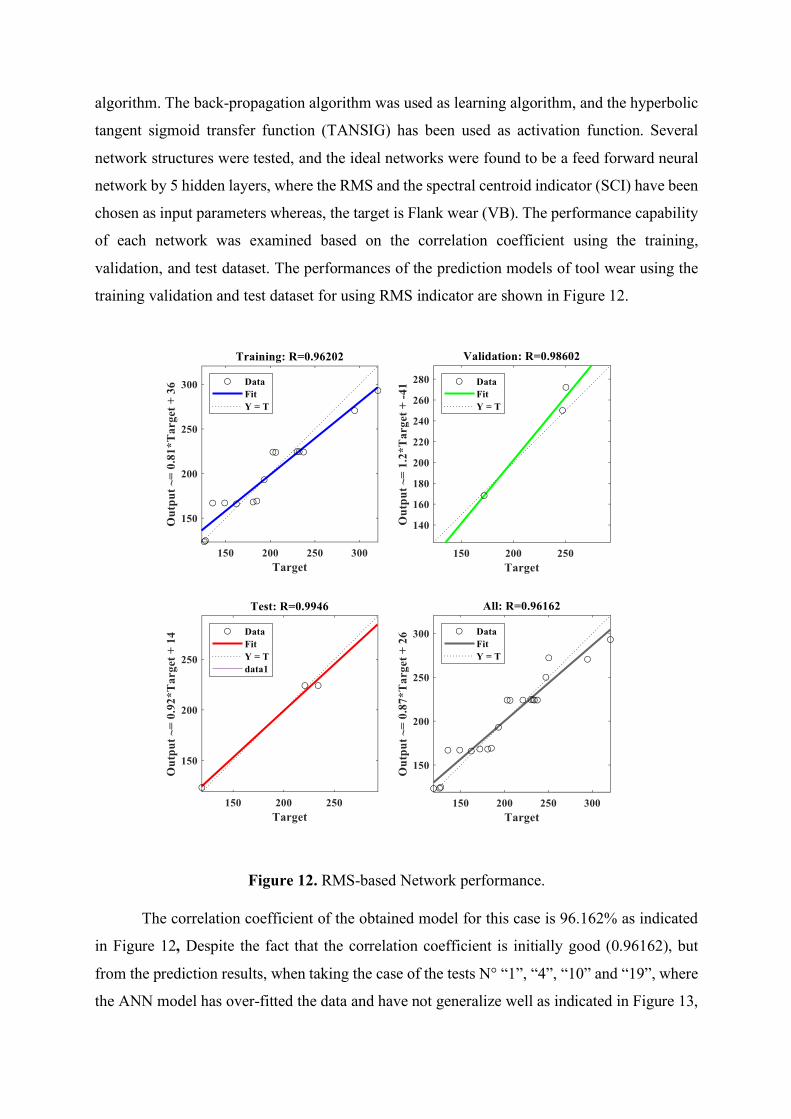
validation, and test dataset. The performances of the prediction models of tool wear using the
training validation and test dataset for using RMS indicator are shown in Figure 12.
Figure 12. RMS-based Network performance.
The correlation coefficient of the obtained model for this case is 96.162% as indicated
in Figure 12, Despite the fact that the correlation coefficient is initially good (0.96162), but
from the prediction results, when taking the case of the tests N° “1”, “4”, “10” and “19”, where
the ANN model has over-fitted the data and have not generalize well as indicated in Figure 13,

this is justified by the number of data used for training, validation and for the test of the current
network. And also, the quality of information given by the RMS indicator as regards the wear
evolution.
Figure 13. Prediction Error (%) of RMS-ANN network.
The SCI-based Network performance plots are shown in figure 14. The results are
encouraging, and the prediction data presents a good agreement with the experimental values
of the flank wear as shown in figures 15 and 16, usually there is substantial variation of the
observed points around the fitted regression line, with low prediction error as compared to the
case of the RMS-ANN network.

Figure 11. Prediction Error (%) of the network using RMS Indicator.
Figure 14. SCI -based Network performance.

Figure 15. Experimental VB vs Predicted VB
Conclusion
This paper checked the possibility of tool wear and surface roughness monitoring based
on vibration analysis. CEEMDAN has been adopted as a decomposition tool that isolate the
ideal band which contains the turning process signature. First, Root Mean Square has been
calculated for the twenty-one selected IMFs and found to be sensitive during the wear
stabilization phase although the researches are interested in the failure phase characterized by
wear acceleration. On the other hand, Spectral Centroid Indicator has been in correlation with
the wear behavior, SCI values have increased as regard as the wear intensification until the end
of initial wear stage. During the wear stabilization phase, the SCI has decreased significantly
and caused a disturbance in the spectral stability. Arriving at the most severe stage of wear, the
SCI indicator has taken the same trend as the experimental wear curve due to the occurrence of
serious vibrations that have led to an increase in vibratory energy. Therefore, SCI can be used
for tool wear stages classification.
The current results have been injected into an artificial neural network in order to
predict wear comportment for future online monitoring applications. The prediction accuracy
qualifies this tool for insert wear condition identification during turning process.
Laser Doppler Vibrometer (LDV) is an interesting tool that helps for vibration
measurement during the machining process even if lubricants are used.

Acknowledgment
The machines, devices and tools used in this work, are the property of the Mechanics
Research Center of Constantine, the latter is financed by the Algerian Ministry of Higher
education and Scientific Research.

Reference
[1] Lauro, C. H., Brandão, L. C., Baldo, D., Reis, R. A., & Davim, J. P. (2014). Monitoring
and processing signal applied in machining processes–A review. Measurement, 58,
73-86.
[2] Dimla, D. E. (2002). The correlation of vibration signal features to cutting tool wear
in a metal turning operation. The International Journal of Advanced Manufacturing
Technology, 19(10), 705-713.
[3] Zeng, S., Wan, X., Li, W., Yin, Z., & Xiong, Y. (2012). A novel approach to fixture
design on suppressing machining vibration of flexible workpiece. International journal
of machine tools and manufacture, 58, 29-43.
[4] Devillez, A., & Dudzinski, D. (2007). Tool vibration detection with eddy current
sensors in machining process and computation of stability lobes using fuzzy
classifiers. Mechanical systems and signal processing, 21(1), 441-456.
[5] Shahabi, H. H., and M. M. Ratnam. "On-line monitoring of tool wear in turning
operation in the presence of tool misalignment." The International Journal of
Advanced Manufacturing Technology 38.7-8 (2008): 718-727.
[6] Oo, H., Wang, W., & Liu, Z. (2020). Tool wear monitoring system in belt grinding
based on image-processing techniques. The International Journal of Advanced
Manufacturing Technology, 111(7), 2215-2229.
[7] Hsieh, Wan-Hao, Ming-Chyuan Lu, and Shean-Juinn Chiou. "Application of
backpropagation neural network for spindle vibration-based tool wear monitoring in
micro-milling." The International Journal of Advanced Manufacturing
Technology 61.1-4 (2012): 53-61.
[8] Babouri, M. K., Ouelaa, N., Djebala, A., Djamaa, M. C., & Boucherit, S. (2017).
Prediction of cutting tool’s optimal lifespan based on the scalar indicators and the
wavelet multi-resolution analysis. In Applied Mechanics, Behavior of Materials, and
Engineering Systems (pp. 299-310). Springer, Cham.
[9] Babouri, M. K., Ouelaa, N., Djamaa, M. C., Djebala, A., & Hamzaoui, N. (2017).
Prediction of tool wear in the turning process using the spectral center of
gravity. Journal of Failure Analysis and Prevention, 17(5), 905-913.
[10] Rao, K. V., Murthy, B. S. N., & Rao, N. M. (2013). Cutting tool condition monitoring
by analyzing surface roughness, work piece vibration and volume of metal removed
for AISI 1040 steel in boring. Measurement, 46(10), 4075-4084.

[11] Abu-Mahfouz, I. (2003). Drilling wear detection and classification using vibration
signals and artificial neural network. International Journal of Machine Tools and
Manufacture, 43(7), 707-720.
[12] Du, M., Wang, P., Wang, J., Cheng, Z., & Wang, S. (2019). Intelligent Turning Tool
Monitoring with Neural Network Adaptive Learning. Complexity, 2019.
[13] Xu, X., Wang, J., Ming, W., Chen, M., & An, Q. (2021). In-process tap tool wear
monitoring and prediction using a novel model based on deep learning. The
International Journal of Advanced Manufacturing Technology, 112(1), 453-466.
[14] Wang, Xiaoyu, et al. "Design of neural network-based estimator for tool wear
modeling in hard turning." Journal of intelligent manufacturing 19.4 (2008): 383-396.
[15] Purushothaman, Srinivasan. "Tool wear monitoring using artificial neural network
based on extended Kalman filter weight updation with transformed input
patterns." Journal of Intelligent Manufacturing 21.6 (2010): 717-730.
[16] Sharma, Vishal S., S. K. Sharma, and Ajay K. Sharma. "Cutting tool wear estimation
for turning." Journal of Intelligent Manufacturing 19.1 (2008): 99-108.
[17] Aghdam, B. H., M. Vahdati, and M. H. Sadeghi. "Vibration-based estimation of tool
Major Flank wear in a turning process using ARMA models." The International
Journal of Advanced Manufacturing Technology 76.9-12 (2015): 1631-1642.
[18] Liu, H., Mi, X., & Li, Y. (2018). Comparison of two new intelligent wind speed
forecasting approaches based on wavelet packet decomposition, complete ensemble
empirical mode decomposition with adaptive noise and artificial neural
networks. Energy Conversion and Management, 155, 188-200.
[19] Nouioua, M., Yallese, M. A., Khettabi, R., Chabbi, A., Mabrouki, T., & Girardin, F.
(2017, March). Optimization of Machining Process During Turning of X210Cr12 Steel
Under MQL Cooling as a Key Factor in Clean Production. In International Conference
Design and Modeling of Mechanical Systems (pp. 855-863). Springer, Cham.
[20] Elbah, M., Laouici, H., Benlahmidi, S., Nouioua, M., & Yallese, M. A. (2019).
Comparative assessment of machining environments (dry, wet and MQL) in hard
turning of AISI 4140 steel with CC6050 tools. The International Journal of Advanced
Manufacturing Technology, 105(5), 2581-2597.

[21] Nouioua, M., Yallese, M. A., Khettabi, R., Belhadi, S., & Mabrouki, T. (2017).
Comparative assessment of cooling conditions, including MQL technology on
machining factors in an environmentally friendly approach. The International Journal
of Advanced Manufacturing Technology, 91(9), 3079-3094.
[22] Nouioua, M., Yallese, M. A., Khettabi, R., Belhadi, S., Bouhalais, M. L., & Girardin,
F. (2017). Investigation of the performance of the MQL, dry, and wet turning by
response surface methodology (RSM) and artificial neural network (ANN). The
International Journal of Advanced Manufacturing Technology, 93(5), 2485-2504.
[24] Igba, J., Alemzadeh, K., Durugbo, C., & Eiriksson, E. T. (2016). Analysing RMS and
peak values of vibration signals for condition monitoring of wind turbine
gearboxes. Renewable Energy, 91, 90-106.
[24] Krimphoff, J., McAdams, S., & Winsberg, S. (1994). Caractérisation du timbre des
sons complexes. II. Analyses acoustiques et quantification psychophysique. Le Journal
de Physique IV, 4(C5), C5-625.

Déclarations
Funding: The work is financed by the Algerian Ministry of Higher education and Scientific
Research.
Conflicts of interest/Competing interests: I, Doctor Mourad NOUIOUA, corresponding
author of the paper, certify that we have no potential conflict of interest for the presented article
Availability of data and material: Not applicable
Code availability: Not applicable
Authors' contributions: (optional)
Additional declarations for articles in life science journals that report the results of studies
involving humans and/or animals: Not applicable
Ethics approval: I certify that the paper follows the ethical rules of good scientific practice
mentioned in the “Ethical Responsibilities of Authors” of the journal.
Consent to participate (include appropriate statements): Not applicable
Consent for publication (include appropriate statements)
Mourad NOUIOUA hereby declare that I participated in the study and in the development of
the manuscript titled (Vibration-based tool wear monitoring using Artificial Neural Networks
fed by Spectral centroid indicator & RMS of CEEMDAN modes) and authorize the full the
publishing of manuscript data.

Figures
Figure 1
Flow chart of the tool life monitoring method.

Figure 2
Experimental set up for monitoring system and data analysis.

Figure 3
Theoretical tool wear.

Figure 4
Wear Morphology from test of the cutting insert.

Figure 5
Wear Evolution Vs machining time

Figure 6
Surface roughness Vs. experimental run order

Figure 7
Free run spectrum.

Figure 8
Autospectrum of the twenty-one runs.

Figure 9
CEEMDAN decomposition.

Figure 10
Obtained RMS for the twenty-one signals.
Figure 11
SCI signature during machining time

Figure 12
RMS-based Network performance.
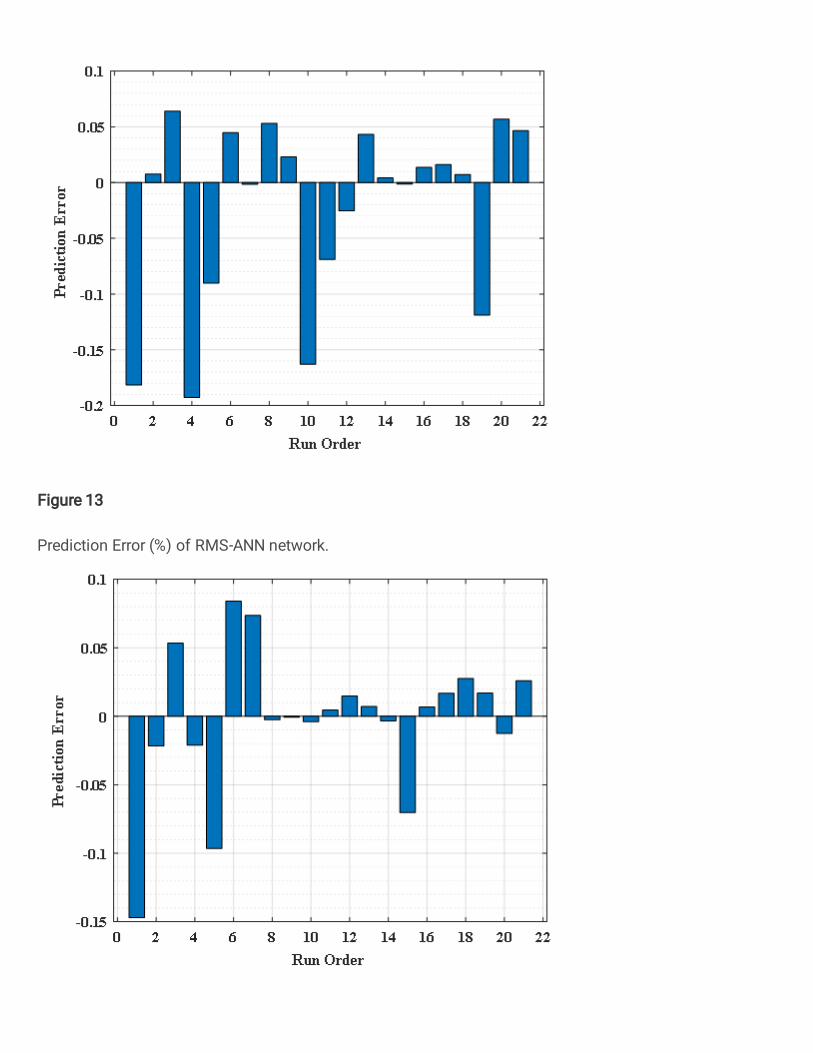
Figure 13
Prediction Error (%) of RMS-ANN network.

Figure 14
Prediction Error (%) of the network using RMS Indicator.
Figure 15
SCI -based Network performance.

Figure 16
Experimental VB vs Predicted VB