view the 2015 metrobank card annual report
TRANSCRIPT


TABLE OF CONTENTS
2 Financial Highlights
TABLE OF CONTENTS
2 Financial Highlights
4 Chairman’s Message
6 President’s Report
8 Products and Services
14 Corporate Governance
20 Risk Management
26 Corporate Social Responsibility
30 Leadership
32 Board of Directors
36 Management Committee
38 Senior Vice-Presidents
39 First Vice-Presidents
40 Vice-Presidents
42 Senior Assistant Vice-Presidents
43 Assistant Vice-Presidents
46 Financial Statements

FINANCIAL HIGHLIGHTS
2 Metrobank Card Corporation

FINANCIAL HIGHLIGHTS
Annual Report 2015 3

4 Metrobank Card Corporation

As we celebrate another year of positive change, we also commemorate thirty years of triumphant existence. As a company that has always put the needs of its customers forward, we have also always put the progress of the nation as a yardstick for our service. As leaders of an industry tasked with helping the Filipino achieve financial freedom and peace of mind, we are also continuously aware of the responsibility we carry—today, and into the future.
An enormous part of this responsibility toward our customers lies in our people. It is our management and workforce that have allowed us to maintain our market leadership and constantly create, innovate and forge the way ahead, with new products, new strategies and new business models. And it is the uncompromising values that we always seek and nurture in our people that allow us to be leaders in our category.
Thus, we also believe that each year of change, with each turn of the wheel, must be heralded and guided by constant and unchanging components: our culture, our guiding principles, and our unwavering commitment to the Filipino. These are what have always made Metrobank Card Corporation great, over the past thirty years. They will most certainly keep us great over the many years ahead.
So here’s to making history, and making things better, and to keeping them the same. Mabuhay!
FABIAN S. DEEChairman
CHAIRMAN’S MESSAGE
Annual Report 2015 5

Once again, we are pleased to report another groundbreaking year for Metrobank Card Corporation.
2015 was a landmark year in terms of financial performance. We posted a solid P2.7 billion net profit after tax. NPAT grew 5% from prior year. We also grew our customer base to 1,543,944 cards-in-force which yielded a 6% growth in billings and 9% growth in receivables.
2015 saw us maintain our number one position in terms of total number of Cards in Force (CIF), proof that our commitment to excellence and service has remained unwavering.
In terms of Merchant Acquiring Billings and Receivables, we have sustained our strong performance and kept a leadership position in the industry.
Our consistent achievements did not go unnoticed: we were recently awarded the Best Credit Card Product in the Philippines by The Asian Banker at the 2015 Philippine Country Awards, a distinction given more prestige by the fact that it is the first award of its kind for the country.
2015 was also a landmark year for exciting new products and business models.
The new PSBank Credit MasterCard, under a cross-selling arrangement between Metrobank Card and Philippine Savings Bank, was launched early last year. With no annual fee for life, the added security of chip card technology, and a host of value-added services, the PSBank Credit MasterCard attracts an additional customer base and offer financial flexibility to more Filipinos.
The new Yazz Card is a reloadable prepaid Visa card that brings the power of cash-less transactions and ATM functionality to a new breed of Filipino user. By making cashless purchases and online transactions accessible and affordable to a wider market base, we have taken a giant step in serving Filipinos with convenience, security and purchasing power.
Our existing product lines saw strengthened acquisition efforts and merchant partnerships across multiple market segments. With more specific promotions and offerings and more attractive offers, the segments we serve across different lifestyles and economic profiles continue to bear more affinity with our individual products. All of these multiple value propositions and positions have further solidified the presence of Metrobank Card as a brand that delivers endless possibilities to its users.
For a company that is now 30 years in existence, Metrobank Card Corporation has remained on top of its game and the top choice of customers. And while we are very much aware of the heritage and the history we carry, we also know that we are still young, and must remain spirited and innovative as we look brightly at the years ahead.
Here’s to the future!
RIKO A.S. ABDURRAHMANPresident
PRESIDENT’S REPORT
Metrobank Card Corporation6

PRESIDENT’S REPORT
Annual Report 2015 7

8 Metrobank Card Corporation

Annual Report 2015 9

10 Metrobank Card Corporation

Annual Report 2015 11
Credit Card Issuing
Metrobank Card Corporation offers a range of credit card products suitable to meet the needs of the Philippine Market. Cardholders enjoy increased spending power and international purchasing convenience with acceptance in over 40 million establishments worldwide. Our credit card products offer flexible payment schemes, installment programs, perks and privileges that allow cardholders to get maximum value for their money.
Metrobank Classic MasterCard and Gold MasterCard
Metrobank Classic Visa and Gold Visa
Metrobank Card Corporation’s core credit cards provide increased spending power and worldwide purchasing convenience.
Metrobank Femme Visa
The Metrobank Femme Visa offers the perks and privileges that a woman deserves, including exclusive offers at shopping, beauty, and wellness establishments.
Metrobank Femme Signature Visa
The Metrobank Femme Signature Visa is the first local Signature Visa and the first premium credit card targeted exclusively for women. It offers a most exclusive and rewarding experience for its premium cardholders.
Metrobank ON Internet MasterCard
The Metrobank ON Internet MasterCard enables cardholders to shop more securely online. It is designed for non-face-to-face transactions, and offers greater security and peace of mind.
Metrobank Platinum MasterCard
The Metrobank Platinum MasterCard offers access to a wide-range of world-class privileges. It offers an exclusive 24/7 VIP Customer Service hotline, Concierge Service, as well as other rewards and perks.
Metrobank Platinum Dollar MasterCard
The Metrobank Platinum Dollar MasterCard allows cardholders to be charged in US dollars regardless of the currency transacted.
Metrobank World MasterCard
The Metrobank World MasterCard is the most premium credit card in the market, offering a credit limit that nearly sets no borders, 24/7 exclusive Concierge Service, and the unique reward feature of being able to redeem anything with Rewards Points.
M Free MasterCard
An annual fee-free credit card. It offers worldwide acceptance and convenience with perks and privileges.
M Lite MasterCard
A low interest rate credit card loaded with built-in card features and privileges.
Robinsons-Cebu Pacific MasterCard (Classic and Gold)
The Robinsons-Cebu Pacific MasterCard was launched in coordination with the Robinsons Retail Group and Cebu Pacific, both under the JG Summit Group of Companies. Aside from special privileges from these two establishments, cardholders also receive Fly/Buy points for all their spending so that they can both Fly and Buy for FREE!
Toyota MasterCard
Metrobank Card and Toyota Motor Philippines have partnered to launch the Toyota MasterCard. Offering discounts at Toyota dealers, fuel rebates from Petron, and Rewards Points for all card spending, the Toyota MasterCard is indeed the country’s first complete motorist card.

PSBank Credit MasterCard
Launched through a partnership between Metrobank Card and Philippine Savings Bank, The PSBank Credit MasterCard is a card with no annual fee for life. It offers ffers ff flexible payment schemes, installment programs, and exclusive perks and privileges, providing Filipinos an affordable ffordable ff financial tool that helps take care of simple needs and manage expenses.
YAZZ Reloadable Prepaid Visa Card
The YAZZ Card is a reloadable, general purpose prepaid card that offers cashless convenience that is accepted in all accredited Visa ffers cashless convenience that is accepted in all accredited Visa ffmerchants and online stores worldwide. It can also be used in all Visa-accredited ATMs.
M Here
Offering perks, privileges, discounts and freebies to all Metrobank ffering perks, privileges, discounts and freebies to all Metrobank ffCardholders, M Here highlights the presence of Metrobank Card Corporation in leading establishments and caters to the urban and trendy lifestyle of its cardholders.
0% Installment
Financial flexibility with no added cost. It offers cardholders ffers cardholders ffthe opportunity to purchase products on installment up to 24 months with no additional interest.
Cash2Go
Fast cash for any need or occasion. Allows cardholders to get cash and pay in installments at low interest rates per month in 3- to 36-month terms.
Balance Transfer
With Balance Transfer, cardholders may transfer their outstanding balance from their non-Metrobank Card to their Metrobank Card and pay at a lower interest rate in 6- to 24-month terms.
Bills2Pay
MCC cardholders may enjoy hassle free utility payments by enrolling their Meralco, PLDT, Globe Telecom, SMART, SUN, Sky Cable Network, and Philippine AXA Insurance in Bills2Pay. By enrolling, their monthly bills will be automatically charged to their credit cards and cardholders will only need to monitor their monthly credit card statements.
Metrobank Card Mobile App
A mobile app available on both iOS and Android platforms, the Metrobank Card mobile app allows Metrobank cardholders to know more about MCC’s ongoing promos and apply for a new Metrobank Card.
Merchant Acquiring
Metrobank Card offers its partner merchants a portfolio of ffers its partner merchants a portfolio of ffpayment solutions.
ContactlessInstead of swiping a card, customers simply tap or wave their card in the proximity of the contactless reader.
Loyalty Card/Gift CardMetrobank cardholders can earn points for every purchase made at participating merchants.
M SwipeM Swipe allows merchants to accept card transactions with their smartphones or tablets. This gives them the convenience and mobility to accept card payments anytime, anywhere.
Mail Order Telephone OrderA payment facility that allows credit card acceptance for purchases made by phone or mail.
Metrobank Internet Payment SolutionA credit card payment solution for Internet transactions through MasterCard Gateway Service. It enables online merchants to accept secure card payments that are authenticated by MasterCard Secure Code and Verified by Visa.
Point-of-Sale (POS) TerminalsPartner merchants can process MasterCard, Visa and Diners card transactions in a matter of seconds with MCC’s cutting-edge terminal fleet.
Recurring/Auto DebitMerchants can set up automatic payments for their customers via their credit cards. This facility allows collection of monthly recurring fees and charges such as memberships, subscriptions, insurance premiums, and utility bills via auto-debit arrangements.
12 Metrobank Card Corporation

Annual Report 2015 13

14 Metrobank Card Corporation

Annual Report 2015 15

16 Metrobank Card Corporation
The Board of Directors and Senior Management of MCC are firmly committed to good corporate governance and are cognizant of the fact that it is the foundation of safe and sound operations. The view that creation and maintenance of shareholder value can only be achieved if sound corporate governance is in place is strongly espoused by the Company. MCC believes that it is essential for an effective compliance program in the company for the total commitment of the stockholders, Board of Directors, and Senior Management. It is equally believed that through good corporate governance, protection of the rights of all stakeholders can be ensured. MCC Board and Management adhere to the basic principles of accountability, fairness, integrity and transparency for the
safe and sound operations of the company. MCC Board and Management believe that accountability should permeate the entire organization starting with its directors and officers all the way to its staff. There should also be integrity in every action and more importantly, transparency in all dealings.
The Articles of Incorporation and By-Laws and Corporate Governance Manual contain MCC’s corporate governance principles and practices. Taken altogether, the basics of good and transparent governance are encapsulated.
Our corporate governance program is implemented through the structure shown below:
BOARD OFDIRECTORS
ManagementCommittee
PRESIDENT
CorporateGovernance RPTRisk
OversightNCR
EXECUTIVECOMMITTEE
BOARDCOMMITTEES
ChiefCompliance/AML O�cer
Audit ITSteering
ChiefRisk O�cer
Internal AuditHead

Annual Report 2015 17
Through its corporate governance framework, MCC is committed to developing and strengthening the Board of Directors and management team’s transparency and integrity. At all times, the Board and management team works for the interests of our various stakeholders within the group, as well as the market or industry as a whole.
BOARD OF DIRECTORS
The overall vision, strategic objectives, key policies, and the monitoring and evaluation of the management performance are set by the Board of Directors. It is part of the Board’s mandate to ensure the adequacy of internal controls and risk management practices, accuracy, and reliability of financial reporting, and compliance with applicable laws and regulations.
The Board consists of ten (10) members, two of whom are independent directors, who serve for a minimum of one year or until their successors are duly qualified and elected in accordance with the By-Laws. The Board is collectively responsible for the long-term shareholder value of MCC as a financial institution and has the primary responsibility to approve, oversee and review the implementation of strategic objectives; financial plans and annual budgets; key operational initiatives; enterprise risk strategy, financial performance review and the basic principles of Corporate Governance. The Board holds regular quarterly meetings in addition to special meetings as needed.
All Board members have undergone training in corporate governance and have been duly certified therefor. The Board is composed of professionals from various fields of expertise such as banking, law, general business and finance. MCC is assured that each director is capable of adding value and formulating sound corporate policies.
The roles of the Chairman and the CEO or President are separate to ensure Board independence from management as well as accountability. Of the ten members of the Board, only the President or CEO is an executive director. The rest are non-executive directors who are neither officers nor consultants of MCC.
Board PerformanceRegular meetings of the full Board are held at least once every quarter. In 2015, the Board had four regular meetings, one organizational meeting, and a few special meetings. Individually, the directors complied with the SEC’s minimum attendance requirement of 50%. The Board ensures that discussions during Board meetings are open, and independent views are encouraged and given due consideration.
It is a major objective of the Company to be able to monitor the performance of the Board through an annual self-assessment. A comprehensive self-assessment process was put in place by the Board since 2010 and has since been consistently implemented. This process will be administered in the form of a formal questionnaire that is answered by each member of the Board individually and where members of the Board are able to rate their individual performance and that of the Board as a whole. The results are collated and compiled by the Compliance
Officer, and are submitted to the Board for discussion and when needed, appropriate action.
BOARD COMMITTEES
The Board of Directors is supported by seven (7) Board Committees with their respective mandates as follows:
1. Executive Committee - Chairperson: Anjanette Ty Dy Buncio; Members: Richard Benedict S. So, Riko A. S. Abdurrahman, Panadda Manoleehakul and Jose Vicente L. Alde
The Executive Committee acts on behalf of the Board and has the general power and competence to perform any act or make any decision (or authorize the performance of any act or the making of any decision) with the general competence and authority of the Board subject to the limitations stated in the By-Laws of the Company.
2. Audit Committee - Chairperson: John Mark Winders (Independent Director); Members: Francisco S. Magsajo, Jr. (Independent Director) and Jose Vicente L. Alde
The Audit Committee provides oversight of the internal and external audit functions and ensures both the independence from management of internal audit activities as well as the compliance with the regulations governing accounting standards on financial reporting. It approves the annual audit plan, the annual audited financial statements, and the analysis of results of operations as submitted by the Internal and External Auditor. It also evaluates strategic issues relating to plans and policies, financial and system controls, and methods of operation for adequacy and improvements.
3. Nomination Compensation & Remuneration Committee - Chairperson: Anjanette Ty Dy Buncio; Members: John Mark Winders (Independent Director) and Francisco S. Magsajo, Jr. (Independent Director)
The NCR Committee leads the process for identifying and recommending candidates for appointment to the key positions in the institution taking into full consideration the succession planning and the leadership and skills needed in MCC. It provides oversight on the compensation and remuneration of matters of the entire organization.
4. Corporate Governance Committee - Chairperson: John Mark Winders (Independent Director); Members: Regis V. Puno and Francisco S. Magsajo, Jr. (Independent Director)
The Corporate Governance Committee is tasked primarily to assist the Board in formulating the policies and overseeing the implementation of MCC’s corporate governance practices.It conducts annually the performance self-evaluation of the Board of Directors and its committees. It also oversees the implementation of the orientation of newly-elected Directors. In 2015, an annual performance review of the Board as a whole, the Committees, individual directors and the President was conducted using assessment questionnaires that measure their effectiveness.

18 Metrobank Card Corporation
5. Risk Management Committee - Chairperson: Richard Benedict S. So; Members: John Mark Winders (Independent Director) and Francisco S. Magsajo, Jr (Independent Director)
The Risk Management Committee is responsible for the development of MCC’s risk policies and defining the appropriate strategies for identifying, quantifying, managing and controlling risk exposures including preventing and/or minimizing the impact of losses to the organization. It oversees the implementation and review of the enterprise wide risk management plan and system of limits of management’s discretionary authority delegated by the Board. It is also responsible for reassessing the continued relevance, comprehensiveness, and effectiveness of the risk management plan, and introduces revisions thereto as needed.
6. Related-Party Transactions Committee - Chairperson: John Mark Winders (Independent Director); Members: Regis V. Puno, Francisco S. Magsajo, Jr. (Independent Director) and Riko A. S. Abdurrahman
The Related-Party Transactions Committee ensures that transactions with related parties (including internal Group transactions) of MCC are reviewed to assess the risks, are subject to appropriate restrictions to ensure that such are conducted at arm’s-length terms and that corporate or business resources are not misappropriated or misapplied.
7. IT Steering Committee - Chairperson: Sanjoy Sen; Co-Chairperson: Deputy Cards Head; Members: Head of Information Technology, President, Head of Operations and Technology, Head of Credit Operations, Chief Financial Officer, Head of Merchant Acquiring and MBTC IT Resource; Advisers: Chief Risk Officer and Internal Audit Head
The IT Steering Committee is tasked to regularly review, endorse/approve, monitor and report to the Board MCC’s Annual review of the IT Strategic Plan, IT Projects and initiatives, and related risks, IT Operations and Performance, Information Security Program and Policies (IT-specific), IT Outsourcing activities and IT Policies, Procedures and Standards. The Committee also reviews, approves and endorses for Board’s approval outsourcing to cloud environment and the provision of electronic services to customers.
COMPLIANCE
MCC has built a robust compliance program focused on enforcement of the Corporate Governance Manual, Money Laundering & Terrorist Financing Prevention Program (MLPP), Code of Business Conduct & Ethics, and other regulatory requirements.
MCC Compliance reports directly to the Board Corporate Governance Committee and the Chairman of the Board. The Compliance Office ensures timely submission of reports, issues advisories on new regulations or amendments, initiates policy pronouncements and implementation, engages regulators on their onsite and offsite reviews, provides training to employees and reports on significant compliance issues to the management and the Board.
Anti-Money Laundering
The Compliance Department also performs all functions and tasks pertaining to enforcement of the MLPP. It handles the administration of MCC’s compliance with the Anti-Money Laundering Act (AMLA) and its implementing rules and regulations, monitoring of transactions and conduct of AML training including the customized e-learning AML training courses.
CONSUMER PROTECTION
MCC adheres to consumer protection standards relating to disclosure and transparency, protection of client information, fair treatment, effective recourse, and financial education and awareness in its dealings with financial consumers. These are embedded into the corporate culture of MCC, enhancing further its defined governance framework while addressing conflicts that are inimical to the interests of its customers. MCC adopts a Consumer Assistance Management System (CAMS) that serves as an avenue for consumers to air out their grievances in the products and services of MCC.
For the year 2015, the number of valid complaints received by MCC accounted for only about 1.51% of its total cardholder base of 1.543 million as of the same period.
CORPORATE GOVERNANCE

CORPORATE GOVERNANCEAnnual Report 2015 19

20 Metrobank Card Corporation

Annual Report 2015 21

22 Metrobank Card Corporation
The MCC risk governance structure consists of the Board and its Risk Oversight Committee. Their primary responsibility is to set the overall corporate governance strategy and MCC’s overall risk appetite.
The Risk Oversight Committee is responsible for appropriate oversight of risk management strategies, policies, and processes that have a potential to impact the business. The responsibilities extend to credit and market risk.
Together with the Audit Committee, the Risk Oversight Committee are responsible for monitoring the company’s compliance with regulatory requirements, risk management policies and procedures, and for reviewing the adequacy of these policies and procedures in regard to the risks faced by the Company. Both Committees are supported in these functions by the Risk Management Division (RMD), Finance, Compliance, and Internal Audit, through the Executive and Management Committees.
In addition to the Risk Oversight Committee, the MCC Senior Management Team (SMT) consisting of key executive members and/or heads of business play an integral role in the oversight of the effectiveness of risk management policies and processes in the business. The SMT includes the Head of Risk Management.
Their primary responsibility is to assist in fulfilling governance responsibilities by establishing and maintaining a robust risk management program that allows for timely identification, analysis, and rectification of risk issues in addition to day-to-day risk management within the business.
The Company ensures that all risks are identified, monitored, controlled, and reported to appropriate senior management.
Credit Risk
In a business where exposure to credit risk is inherent, it is very crucial for the Company to manage the risk effectively. In order to achieve this, the Company ensures that sound credit risk management practices are implemented. This is achieved by having adequate controls and operating within sensible and well-defined credit-granting criteria.
The Company has continuously focused on process improvement, investments in new technology and enhancement in management information systems (MIS). The Company has also developed and continuously enhances an internal credit scoring system to have a more robust credit risk assessment. Through these efforts, the Company believes that the portfolio can be well-managed, quality of customer base will be improved, and sustainability of the business is ensured.
The Company manages credit risk guided by the following principles:
assessment and process, compliance and regulatory requirements, and account management.
goal of controlling exposure to bad accounts while maximizing revenue through effective line management and usage campaigns.
Company’s competitiveness.
processes, and MIS.
The Company classifies the credit quality of its receivables from cardholders that are neither past due nor impaired based on their delinquency history as follows: a. Balances of those accounts that are current and have never been past due b. Balances of those accounts that are current but with historical past due incidence in the 1-29 days aging bucket c. Balances of those accounts that are current but with historical past due incidence of the 30-59 days aging bucket d. Balances of those accounts that are current but with historical past due incidence in the 60-89 days aging bucket e. Balances of those accounts that are current but with historical past due incidence of the 90 days and up aging buckets

Annual Report 2015 23
The following table shows the credit quality of neither past due nor impaired receivables from cardholders of the Company(amounts in thousands):
Aging analysis of past due but not impaired accounts receivables from cardholders of the Company is shown below(amounts in thousands):
Of the total aggregate amount of gross past due but not impaired loans, the fair value of collateral held as of December 31, 2015 and 2014, amounted to P7.0 million and P7.7 million, respectively. These collaterals obtained from credit cardholders are hold-out cash deposits with affiliated local banks. The fair value of these cash deposits approximate their carrying value due to their short-term maturities.
Market Risk
Market risk is the risk to earnings or capital arising from adverse movements in factors that affect the market value of financial instruments. The Company focuses on two market risk areas such as interest rate risk and foreign currency risk.
Interest Rate Risk
The Treasury unit is primarily responsible in managing the liquidity, as well as, the interest rate risk of the Company. They ensure borrowings from various sources of funds are availed at the cheapest possible cost at acceptable terms. In measuring interest rate risk, the Company employs gap analysis wherein, an interest rate gap report is prepared by breaking down the balance sheet accounts according to contractual maturities/repricing dates, whichever is applicable. The difference in the amount of assets and liabilities maturing or being repriced in any pre-specified time band would be treated as an indicator of the Company’s exposure to the risk of potential changes in net interest income.
To manage interest rate risk, the RMD uses a quantitative risk model on interest rate risk called the Earnings-at-Risk (EaR). EaR is used to measure any mismatch between assets and liabilities in terms of interest rate repricing and an EaR limit is set over a 1-year period. The limit is established to reduce the potential exposure of earnings and/or capital from changes in interest rates. Such method of measuring and controlling interest rate risk is applied during the year. The approved EaR limit by the BOD is a maximum of positive (negative) amount of 1-month average (equivalent to approximately 8.33%) of the Planned Full Year Net Profit After Tax.
2015 2014 Amount Percentage Amount Percentage
Current and never past due 38,123,766 92.8 34,714,159 93.4
Balances of accounts with 1 to 29 days 2,287,021 5.6 1,930,168 5.2past due history
Balances of accounts with 30 to 59 days 422,885 1.0 300,936 0.8past due history
Balances of accounts with 60 to 89 days 154,154 0.4 133,008 0.4past due history
Balances of accounts with 90 days 90,085 0.2 83,112 0.2and up past due history
41,077,911 100% 37,161,383 100%
2015 2014 Amount Percentage Amount Percentage
1-29 days 1,122,709 51.9 1,369,906 57.3
30-59 days 565,674 26.2 565,478 23.6
60-89 days 472,812 21.9 456,112 19.1
2,161,195 100.00 2,391,496 100.00

24 Metrobank Card Corporation
Foreign Currency Risk
Foreign exchange risk (also known as FX risk or currency risk) is defined as the risk to earnings or capital that may arise from movements in foreign exchange rates. It refers to the risk that exchange rate fluctuations may have direct or indirect impact to the firm’s cash flow or to the value of its assets and liabilities and in turn, its profit and capital position.
Information on the Company’s United States dollar (US$) denominated monetary assets and liabilities as of December 31, 2015 and 2014 and their Philippine peso equivalents are as follows (amounts in thousands):
Liquidity Risk and Funding Management
The Company is continuously working on developing diversified funding sources to support its asset growth, as well as to minimize liquidity and interest rate risks. The Treasury unit, on a daily basis, monitors the cash position of the Company. They ensure that the Company has ample liquidity to settle financial obligations that are due as of a given period. The Treasury unit employs various liquidity/funding tools to determine the expected funding requirements for a particular period.
RMD prepares the monthly Maximum Cumulative Outflow (MCO) report to measure the liquidity mismatch risk. The MCO report provides quantitative information on the potential liquidity risk exposure based on pre-specified time bands. The Company has established MCO limit to control liquidity risk. The MCO limit of P 6.64 Billion for end-2015 corresponds to 80% of the total wholesale borrowing limit less utilized borrowing limit. Aside from the MCO report, the Risk Management also prepares Liquidity Stress testing to measure potential liquidity risk exposures under different stress scenarios.
The table shows the MCO report of the Company as of December 31, 2015 and 2014 (in millions):
2015 Up to 1 1 to 2 2 to 3 3 to 6 6 to 12 Beyond TOTAL month months months months months 1 yearAssets 14,697 4,262 3,498 7,451 6,718 13,751 50,377Liabilities 12,420 4,895 2,338 7,474 4,930 12,420 44,477Off-BalanceSheet Position –
Periodic Gap 2,277 (632) 1,159 (23) 1,789 1,331 5,900Cumulative Gap 2,277 1,645 2,804 2,781 4,570 5,900
2014 Up to 1 1 to 2 2 to 3 3 to 6 6 to 12 Beyond TOTAL month months months months months 1 yearAssets 15,285 3,091 3,205 6,751 6,114 12,605 47,051Liabilities 15,992 3,111 2,096 5,834 4,734 10,582 42,349Off-BalanceSheet Position − − (6) (6) (12) − (24)
Periodic Gap (707) (20) 1,103 911 1,368 2,023 4,678Cumulative Gap (707) (727) 376 1,287 2,655 4,678
2015 2014 US Dollar Peso Equivalent US Dollar Peso Equivalent
Financial Assets:Cash in banks 3,554 167,252 4,134 184,857Cross-currency swap – – 10,000 447,200Accounts receivable 5,958 280,395 6,181 276,392 9,512 447,647 20,315 908,449Financial Liabilities:Notes payable 8,180 384,951 18,300 818,376Accrued interest payable 7 331 7 294 8,187 385,282 18,307 818,670Net Foreign Currency-Denominated Assets $1,325 62,365 $2,008 89,779

Annual Report 2015 25
Capital Management
The primary objectives of the Company’s capital management are to ensure that it complies with externally imposed capital requirements and to maintain strong credit ratings and healthy capital ratios in order to support its business and to maximize stockholders’ value.
Regulatory Qualifying Capital
Under existing BSP regulations, the determination of the Company’s compliance with regulatory requirements and ratios is based on the amount of the Company’s ‘unimpaired capital’ (regulatory net worth) as reported to the BSP, which is determined on the basis of regulatory accounting policies which differ from PFRS in some respects.
In addition, the risk-based capital adequacy ratio (CAR) of the Company with quasi-banking operations, expressed as a percentage of qualifying capital to risk-weighted assets, should not be less than 10.0%. Qualifying capital and risk-weighted assets are computed based on BSP regulations.
Risk-weighted assets consist of total assets less cash on hand, amounts due from BSP, loans covered by hold-out or assignment of deposits, loans or acceptances under letters of credit to the extent covered by margin deposits and other non-risk items determined by the Monetary Board (MB) of the BSP.
In compliance with Circular 639 covering the Internal Capital Adequacy Assessment Process (ICAAP), the Metrobank Group has adopted and developed its ICAAP framework to ensure that appropriate level and quality of capital are maintained by the Group. MCC follows the Group’s ICAAP framework and submits the result of its assessment to the Parent Bank, Metrobank in full accordance with Basel 3 guidelines.
As of December 31, 2015 MCC’s CAR stood at 12.31%, well within the regulatory requirement of 10.0%. Total qualifying capital for the years ended 2015 and 2014 were P7.6 Billion and P7.3 Billion, respectively. Operational Risk
The Operational Risk Management facilitates and monitors the implementation of effective risk management practices by operational management and assists risk owners in defining the target risk exposure and reporting adequate risk-related information throughout the organization.
The operational risk management process adopted by MCC consists of a staged approach involving: establishing the context, identification, analysis, treatment, monitoring, review, and reporting of risks.
Risk and Control Self-Assessment
Risk and Control Self-Assessment (RCSA) forms an integral element of the overall operational risk framework of MCC, as it provides an excellent opportunity for a firm to integrate and coordinate its risk identification and risk management efforts and generally to improve the understanding, control, and oversight of its operational risks.
Incident Reporting
Incident Reporting is another process of MCC’s risk management process. The business ensures that incidents, which may have either financial impact and/or reputational damage is escalated promptly. The collection and analysis of incident data provides management information which can be fed back into the operational risk management and mitigation process. Ultimately the database of incidents built up over time will also provide the basis for quantitative modeling and the calculation of capital or reserves allocation, where required.
Key Risk Indicators
Key Risk Indicators (KRIs) act as early warning signals by providing the capability to indicate changes in an organization’s risk profile. KRIs are a fundamental component of a full-featured risk and control framework and sound risk management practice. Their usefulness stems from potentially helping the business to reduce losses and prevent exposure by proactively dealing with a risk situation before an event actually occurs.
Information Security Risk
The Business Information Security Office is responsible for overseeing conduct of independent risk assessment and governance of MCC’s information security program, including oversight of information technology risk. This includes establishing, implementing, monitoring and improving controls to ensure protection of MCC information assets, as well as maintaining and improving the overall information security awareness of the organization.
The unit also oversees the overall implementation and compliance of MCC to the Payment Card Industry Data Security Standards (PCI DSS), as mandated by the payment brands. The PCI DSS compliance program aims to pursue certification in the near future and maintain full compliance thereafter. In coordination with Internal Audit, annual compliance reviews are performed and results are submitted to Visa and MasterCard.

26 Metrobank Card Corporation

Annual Report 2015 27

28 Metrobank Card Corporation

From continuously championing causes on women and children, to recognizing the dedication to make a difference, MCC’s corporate social responsibility initiatives in 2015 have evolved into something much greater and meaningful for everyone as the organization celebrated its 30th year.
Supporting ventures with a social missionIn 2015, MCC continued its partnership with Rags2Riches Foundation (R2R), a social enterprise that empowers women from impoverished communities by giving them opportunities to create unique fashion and home accessories. R2R only uses upcycled scrap cloth, indigenous fabrics, and organic materials in all its products. MCC strengthened its support for R2R’s artisans and designers through its cards made exclusively for women, the Metrobank Femme Visa and the Metrobank Femme Signature Visa.
Believing in the power of a wishMCC has been helping Make-A-Wish Philippines bring hope to children with life-threatening illnesses since 2009. In 2015, hundreds of children beamed with joy as they received their wish from MCC while they interacted with a great number of MCC employee volunteers, especially during the wish grant held on World Wish Day. With a promise of helping Make-A-Wish achieve its goal of granting 2,000 wishes, MCC not only had wish grant events in 2015, but also took part in the organization’s fundraising activity, Walk for Wishes, wherein volunteers walked with the wish kids to uphold the organization’s advocacy and share the power of a wish.
Advocating for breast cancer awarenessTo share the advocacy of breast cancer awareness, MCC partnered once again with ICanServe, a foundation with a
nationwide network of cancer survivors who provide hope and help to women with breast cancer. In celebration of Breast Cancer Awareness Month every October, MCC donated a portion of the Metrobank Femme ICanServe Visa’s sales from partner merchants to the foundation in order to help fund programs on breast cancer information and cancer screenings.
Honoring the country’s dedicated professionals Together with Metrobank Foundation, Inc., MCC awarded outstanding citizens of the country through Metrobank Foundation’s Outstanding Filipinos, which is comprised of the Search for Outstanding Teachers, Soldiers, Police Officers, and Journalists (SOT, TOPS, COPS, and JOY) awardees. MCC presented them a special edition Metrobank credit card for making a significant impact on the lives of their fellow citizens through their professions. The 2015 Outstanding Filipinos now join an elite group of over 100 Outstanding Filipinos and fellow Metrobank cardholders.
Making a difference through employee engagementsIn an effort to respond to those in need, MCC employees took the initiative to give back through department-wide outreach programs and fundraising activities. In 2015, MCC employees organized community visits to partner foundations such as Virlanie Foundation, Sarnelli Center for Street Children Foundation, CRIBS Foundation, and Missionaries of Charity. They also took part in donation drives for the people of Dulumbayan, Teresa, Rizal and for families living near the outskirts of Malate Church and Roxas Boulevard. With a dedication to make a difference, MCC volunteers gave hours of their free time by listening to the stories of these people and giving what they can to support the advocacies shared by the communities.
Annual Report 2015 29

30 Metrobank Card Corporation

Annual Report 2015 31

1. Fabian S. Dee Chairman
2. Anjanette Ty Dy Buncio Vice-Chairperson
2
1
BOARD OF DIRECTORS
32 Metrobank Card Corporation

BOARD OF DIRECTORS
3. Atty. Regis V. Puno Vice-Chairperson
4. Richard Benedict Sha So Director
5. Panadda Manoleehakul Director
4
5
Annual Report 2015 33
3

8 9
7
6. Jose Vicente L. Alde Director
7. Sanjoy Sen Director
8. John Mark Winders Independent Director
9. Francisco S. Magsajo, Jr. Independent Director
6
34 Metrobank Card Corporation

10. Riko A.S. Abdurrahman President/Director
11. Anna Therese Rita D. Cuenco Treasurer
12. Ma. Lourdes C. Plata-Abellar Corporate Secretary
13. Maria Sofia A. Lopez Assistant Corporate Secretary
10
11
1312
Annual Report 2015 35

Riko A.S. AbdurrahmanPresident
Pamela I. JimenezFVP - Compliance & AML Officerand Head of Internal Audit
Celeste Marie V. LimFVP - Head of Merchant Acquiring Business
Cesar P. Nicolasora, Jr.FVP - Chief Finance Officer
Anna Therese Rita D. CuencoSVP - Deputy Cards Head
Harrison C. GueSVP - Head of Operations and Technology
Marie Anthonette L. SantiagoFVP - Head of Human Resources
Hiroko M. CastroFVP - Head of Credit Operations
Rowel S. AndayaVP - Head of Risk Management
Aloysius C. Alday, Jr.SVP - Head of Sales, Alliancesand Other Channels
36 Metrobank Card Corporation

MANAGEMENT COMMITTEE
Aileen Marie A. VallesterosVP - Head of Marketing, ProductManagement and Acquisition;Head of Corporate Communications
Mary Grace L. NavarroVP - Head of Business Intelligence
Atty. Rommel T. OquedoSAVP - Head of Legal
Francis Andre Z. Delos SantosVP - Head of Business Technology
Annual Report 2015 37

SENIOR VICE-PRESIDENTS
38 Metrobank Card Corporation
Harrison C. Gue
Anna Therese Rita D. Cuenco
Aloysius C. Alday, Jr.

SENIOR VICE-PRESIDENTS
FIRST VICE-PRESIDENTS
Annual Report 2015 39
Marie Anthonette L. Santiago
Pamela I. Jimenez Celeste Marie V. Lim
Cesar P. Nicolasora, Jr.
Hiroko M. Castro

Rowel S. Andaya
Ion Edmond A. De Guzman
Francis Andre Z. De Los Santos
Thomas Wilfrido R. Bilbao
VICE - PRESIDENTS
40 Metrobank Card Corporation

VICE - PRESIDENTS
Renato P. Lozon Elmer K. Mercado
Mary Grace L. Navarro
Jay S. Tatel
Sheila P. UmaliAlbert Arnold A. Tom
Maria Cristine D. Reyes
Francis Ramon L. Tioseco
Aileen Marie A. Vallesteros
Michael Angelo R. Miranda
Annual Report 2015 41

SENIOR ASSISTANT VICE-PRESIDENTS
Anna Lissa C. Año
Abelardo R. Magalong Albert Roy D. Navarrete
Al-Jalil B. Bandali Wellington M. Javellana, Jr.
Anne Kristen Y. Macallan
Rommel T. Oquendo
42 Metrobank Card Corporation

SENIOR ASSISTANT VICE-PRESIDENTS
ASSISTANT VICE-PRESIDENTS
Janice T. Angeles Miguel Paolo L. Beltran Reuben Rinaldi Y. Cobankiat
Emma R. De Pano Nolan Carlo U. Empalmado Ivan Drieter D. Eusebio
Michael R. GabrielAnnalyn T. Famy
Annual Report 2015 43

ASSISTANT VICE-PRESIDENTS
Alex B. Gomez
John Oliver T. KoApolonio C. Juan II Andro Jose M. Lagman
Shahlena G. JavierRafael B. Gamad, Jr.
Maria Kareniña R. Lopez Aileen B. Malco
44 Metrobank Card Corporation

ASSISTANT VICE-PRESIDENTS
Nadja Cecilia R. Marquez Joseph Vincent L. Pangilinan
Gail Joseph S. SantosJamie Rose D. Romualdez
Tricia H. Valerio
Winnie Vic G. Ventura Elvira S. Zablan
Janylou M. Romaraog
Kharen S. Serote Carlsten A. Terrobias
Helen A. Panlilio
Annual Report 2015 45

46 Metrobank Card Corporation

Annual Report 2015 47

Metrobank Card Corporation(A Finance Company)
Financial StatementsDecember 31, 2015 and 2014
and
Independent Auditors’ Report
48 Metrobank Card Corporation

INDEPENDENT AUDITORS’ REPORT
The Stockholders and the Board of DirectorsMetrobank Card Corporation
Report on the Financial Statements
We have audited the accompanying financial statements of Metrobank Card Corporation (A FinanceCompany), which comprise the statements of financial position as at December 31, 2015 and 2014,and the statements of income, statements of comprehensive income, statements of changes in equityand statements of cash flows for the years then ended, and a summary of significant accountingpolicies and other explanatory information.
Management’s Responsibility for the Financial Statements
Management is responsible for the preparation and fair presentation of these financial statements inaccordance with Philippine Financial Reporting Standards, and for such internal control asmanagement determines is necessary to enable the preparation of financial statements that are freefrom material misstatement, whether due to fraud or error.
Auditors’ Responsibility
Our responsibility is to express an opinion on these financial statements based on our audits. Weconducted our audits in accordance with Philippine Standards on Auditing. Those standards requirethat we comply with ethical requirements and plan and perform the audit to obtain reasonableassurance about whether the financial statements are free from material misstatement.
An audit involves performing procedures to obtain audit evidence about the amounts and disclosuresin the financial statements. The procedures selected depend on the auditor’s judgment, including theassessment of the risks of material misstatement of the financial statements, whether due to fraud orerror. In making those risk assessments, the auditor considers internal control relevant to the entity’spreparation and fair presentation of the financial statements in order to design audit procedures that areappropriate in the circumstances, but not for the purpose of expressing an opinion on the effectivenessof the entity’s internal control. An audit also includes evaluating the appropriateness of accountingpolicies used and the reasonableness of accounting estimates made by management, as well asevaluating the overall presentation of the financial statements.
We believe that the audit evidence we have obtained is sufficient and appropriate to provide a basis forour audit opinion.
SyCip Gorres Velayo & Co.6760 Ayala Avenue1226 Makati CityPhilippines
Tel: (632) 891 0307Fax: (632) 819 0872ey.com/ph
BOA/PRC Reg. No. 0001, December 14, 2015, valid until December 31, 2018SEC Accreditation No. 0012-FR-4 (Group A), November 10, 2015, valid until November 9, 2018
A member firm of Ernst & Young Global Limited
- 2 -
Opinion
In our opinion, the financial statements present fairly, in all material respects, the financial position ofMetrobank Card Corporation (A Finance Company) as at December 31, 2015 and 2014, and itsfinancial performance and its cash flows for the years then ended in accordance with PhilippineFinancial Reporting Standards.
Report on the Supplementary Information Required Under Revenue Regulations 15-2010
Our audits were conducted for the purpose of forming an opinion on the basic financial statementstaken as a whole. The supplementary information required under Revenue Regulations 15-2010 inNote 30 to the financial statements is presented for purposes of filing with the Bureau of InternalRevenue and is not a required part of the basic financial statements. Such information is theresponsibility of the management of Metrobank Card Corporation (A Finance Company). Theinformation has been subjected to the auditing procedures applied in our audit of the basic financialstatements. In our opinion, the information is fairly stated, in all material respects, in relation to thebasic financial statements taken as a whole.
SYCIP GORRES VELAYO & CO.
Ray Francis C. BalagtasPartnerCPA Certificate No. 108795SEC Accreditation No. 1510-A (Group A), October 1, 2015, valid until September 30, 2018Tax Identification No. 216-950-288BIR Accreditation No. 08-001998-107-2015, March 4, 2015, valid until March 3, 2018PTR No. 5321607, January 4, 2016, Makati City
February 24, 2016
A member firm of Ernst & Young Global Limited

METROBANK CARD CORPORATION (A Finance Company) STATEMENTS OF FINANCIAL POSITION December 31 2015 2014 ASSETS Current Assets
Cash and cash equivalents (Notes 6 and 24) P=1,040,500,296 P=1,832,732,475 Due from Bangko Sentral ng Pilipinas (Notes 6 and 14) 7,636,375,790 7,085,597,520 Interbank loans receivable and securities purchased under resale
agreement (Notes 6 and 24) – 939,000,000 Derivative asset (Notes 7 and 24) – 10,598,305 Accounts receivable (Notes 9 and 24) 36,086,922,602 32,531,944,458 Prepaid expenses and other current assets (Note 24) 59,323,239 67,590,723 Total Current Assets 44,823,121,927 42,467,463,481 Non-current Assets
Available-for-sale investments (Note 8) 5,678,480 5,678,480 Accounts receivable (Notes 9 and 24) 5,334,354,658 5,218,449,534 Property and equipment (Note 10) 674,176,148 673,295,066 Deferred tax assets (Note 23) 888,204,546 788,791,677 Intangibles and other assets (Note 11) 443,923,392 300,866,060 Total Non-current Assets 7,346,337,224 6,987,080,817
P=52,169,459,151 P=49,454,544,298
LIABILITIES AND EQUITY Liabilities Current Liabilities
Accounts payable (Notes 13 and 24): Merchants P=1,342,621,741 P=1,336,959,821
Others 513,989,664 450,652,403
1,856,611,405 1,787,612,224
Bills payable (Notes 14 and 24) 18,537,412,463 17,660,238,515 Notes payable (Notes 17 and 24) 10,134,411,493 10,948,108,772 Deferred revenue (Note 15) 896,284,990 816,276,194 Income tax payable 246,060,095 265,814,540 Accrued interest, taxes and other expenses (Note 18) 682,642,055 624,634,986 Total Current Liabilities 32,353,422,501 32,102,685,231 Non-current Liabilities Bills payable (Notes 14 and 24) 5,314,673,064 3,170,367,204 Notes payable (Notes 17 and 24) 5,877,394,143 6,214,415,662 Subordinated debt (Note 16) 1,161,328,192 1,160,245,839 Retirement liability (Note 22) 388,459,127 225,568,445 Total Non-current Liabilities 12,741,854,526 10,770,597,150
45,095,277,027 42,873,282,381 Equity Capital stock (Note 19) 1,000,000,000 1,000,000,000 Additional paid-in capital 76,071,752 76,071,752 Retained earnings (Notes 19 and 28): Unappropriated 3,353,411,959 3,510,923,802 Appropriated 2,877,000,000 2,149,000,000 Net unrealized loss on cash flow hedge (Note 7) – (2,731,186) Remeasurement losses on retirement plan (Note 22) (232,301,587) (152,002,451)
7,074,182,124 6,581,261,917 P=52,169,459,151 P=49,454,544,298
See accompanying Notes to Financial Statements.
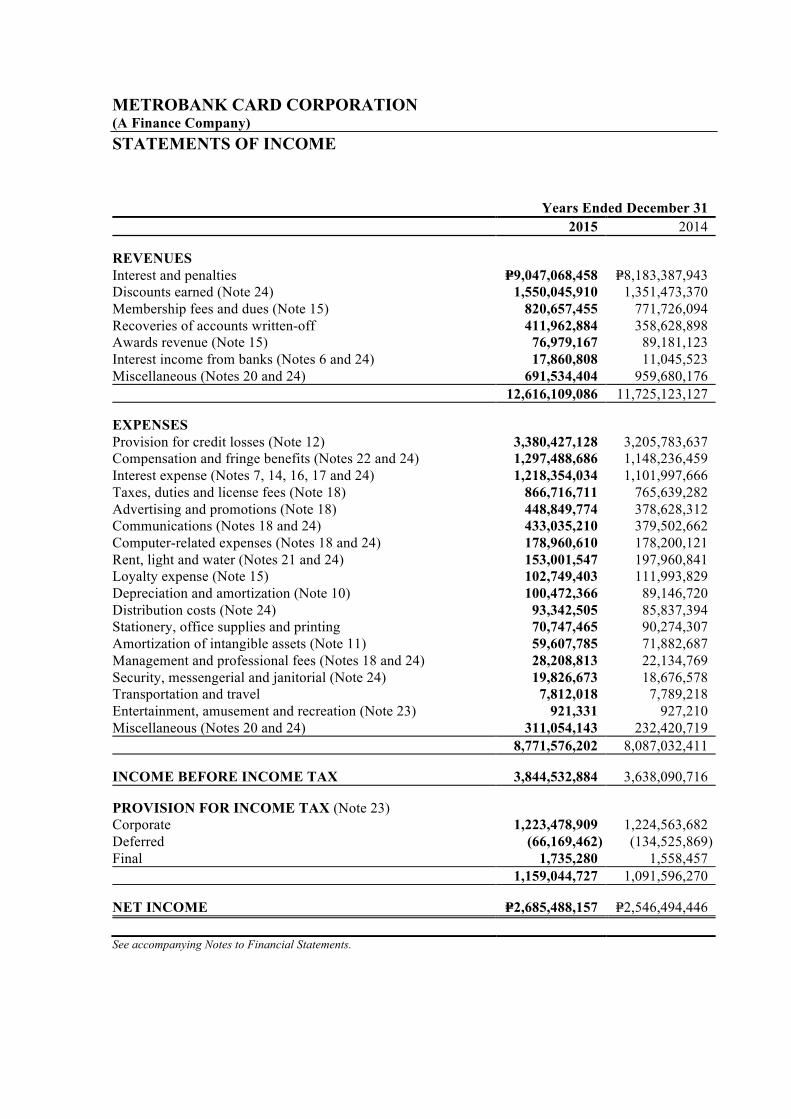
METROBANK CARD CORPORATION (A Finance Company) STATEMENTS OF INCOME Years Ended December 31
2015 2014
REVENUES Interest and penalties P=9,047,068,458 P=8,183,387,943
Discounts earned (Note 24) 1,550,045,910 1,351,473,370 Membership fees and dues (Note 15) 820,657,455 771,726,094 Recoveries of accounts written-off 411,962,884 358,628,898 Awards revenue (Note 15) 76,979,167 89,181,123 Interest income from banks (Notes 6 and 24) 17,860,808 11,045,523 Miscellaneous (Notes 20 and 24) 691,534,404 959,680,176
12,616,109,086 11,725,123,127
EXPENSES Provision for credit losses (Note 12) 3,380,427,128 3,205,783,637
Compensation and fringe benefits (Notes 22 and 24) 1,297,488,686 1,148,236,459 Interest expense (Notes 7, 14, 16, 17 and 24) 1,218,354,034 1,101,997,666 Taxes, duties and license fees (Note 18) 866,716,711 765,639,282 Advertising and promotions (Note 18) 448,849,774 378,628,312 Communications (Notes 18 and 24) 433,035,210 379,502,662 Computer-related expenses (Notes 18 and 24) 178,960,610 178,200,121 Rent, light and water (Notes 21 and 24) 153,001,547 197,960,841 Loyalty expense (Note 15) 102,749,403 111,993,829 Depreciation and amortization (Note 10) 100,472,366 89,146,720 Distribution costs (Note 24) 93,342,505 85,837,394 Stationery, office supplies and printing 70,747,465 90,274,307 Amortization of intangible assets (Note 11) 59,607,785 71,882,687 Management and professional fees (Notes 18 and 24) 28,208,813 22,134,769 Security, messengerial and janitorial (Note 24) 19,826,673 18,676,578 Transportation and travel 7,812,018 7,789,218 Entertainment, amusement and recreation (Note 23) 921,331 927,210 Miscellaneous (Notes 20 and 24) 311,054,143 232,420,719
8,771,576,202 8,087,032,411
INCOME BEFORE INCOME TAX 3,844,532,884 3,638,090,716
PROVISION FOR INCOME TAX (Note 23) Corporate 1,223,478,909 1,224,563,682
Deferred (66,169,462) (134,525,869) Final 1,735,280 1,558,457
1,159,044,727 1,091,596,270
NET INCOME P=2,685,488,157 P=2,546,494,446
See accompanying Notes to Financial Statements.

METROBANK CARD CORPORATION (A Finance Company) STATEMENTS OF COMPREHENSIVE INCOME Years Ended December 31
2015 2014
NET INCOME P=2,685,488,157 P=2,546,494,446
OTHER COMPREHENSIVE LOSS Items that recycle to profit or loss in subsequent periods: Realized gain on available-for-sale (AFS) investments taken
to profit or loss – (328,182,999) Net changes in fair value of AFS investments – (589,204) Income tax effect – 98,631,661
– (230,140,542)
Net changes in unrealized loss on cash flow hedge (Note 7) 3,901,693 21,434,046 Income tax effect (Notes 7 and 23) (1,170,508) (6,430,212)
2,731,185 15,003,834
Items that do not recycle to profit or loss in subsequent periods: Remeasurement losses on retirement plan (Note 22) (114,713,052) (95,596,516)
Income tax effect (Note 23) 34,413,916 28,678,955
(80,299,136) (66,917,561)
OTHER COMPREHENSIVE LOSS, NET OF TAX (77,567,951) (282,054,269)
TOTAL COMPREHENSIVE INCOME, NET OF TAX P=2,607,920,206 P=2,264,440,177
See accompanying Notes to Financial Statements.

ME
TR
OB
AN
K C
AR
D C
OR
POR
AT
ION
(A
Finance Com
pany) ST
AT
EM
EN
TS O
F CH
AN
GE
S IN E
QU
ITY
Capital Stock
(Note 19)
Additional
Paid-in Capital
N
et Unrealized
Gain on
Available-for-
Sale Investments
(Note 8)
Net U
nrealized L
oss on Cash
Flow H
edge (N
ote 7)
Rem
easurement
Losses on
Retirem
ent Plan (N
ote 22) T
otal
Retained E
arnings U
nappropriated (N
otes 19 and 28) A
ppropriated (N
ote 19) B
alance at January 1, 2015 P=1,000,000,000
P=76,071,752 P=3,510,923,802
P=2,149,000,000 P=−
(P=2,731,186) (P=152,002,451)
P=6,581,261,917 Total com
prehensive income for the year
− −
2,685,488,157 −
− 2,731,186
(80,299,136) 2,607,920,207
Net appropriations
− −
(2,728,000,000) 2,728,000,000
− −
− −
Dividends paid
− −
(115,000,000) (2,000,000,000)
− −
− (2,115,000,000)
Balance at D
ecember 31, 2015
P=1,000,000,000 P=76,071,752
P=3,353,411,959 P=2,877,000,000
P=− P=−
(P=232,301,587) P=7,074,182,124
B
alance at January 1, 2014 P=1,000,000,000
P=76,071,752 P=2,913,429,356
P=2,000,000,000 P=230,140,542
(P=17,735,018) (P=85,084,890)
P=6,116,821,742 Total com
prehensive income for the year
− −
2,546,494,446 −
(230,140,542) 15,003,832
(66,917,561) 2,264,440,175
Net appropriations
− −
(1,949,000,000) 1,949,000,000
− −
− −
Dividends paid
− −
− (1,800,000,000)
− −
− (1,800,000,000)
Balance at D
ecember 31, 2014
P=1,000,000,000 P=76,071,752
P=3,510,923,802 P=2,149,000,000
P=− (P=2,731,186)
(P=152,002,451) P=6,581,261,917
See accom
panying Notes to Financial Statem
ents.

METROBANK CARD CORPORATION (A Finance Company) STATEMENTS OF CASH FLOWS Years Ended December 31
2015 2014
CASH FLOWS FROM OPERATING ACTIVITIES Income before income tax P=3,844,532,884 P=3,638,090,716
Adjustments for: Provision for credit losses (Note 12) 3,380,427,128 3,205,783,637
Retirement expense (Note 22) 135,832,288 66,940,698 Depreciation and amortization (Note 10) 100,472,366 89,146,720 Amortization of:
Intangible assets (Note 11) 59,607,785 71,882,687 Debt issuance cost (Notes 14, 16 and 17) 37,541,330 41,145,967 Unrealized foreign exchange gain (Note 20) (17,276,831) (4,323,122) Realized loss on settled derivatives (Note 7) 14,499,998 26,765,955 Gain on sale of:
Property and equipment (Note 20) (268,698) (701,759) Available-for-sale investments (Notes 8 and 20) – (328,182,999) Changes in operating assets and liabilities:
Decrease (increase) in the amounts of: Accounts receivable (7,051,310,396) (9,227,801,820)
Prepaid expenses and other assets 7,168,847 8,856,102 Increase (decrease) in the amounts of:
Bills payable 2,989,727,238 1,952,009,267 Retirement liability (87,654,658) (76,737,875) Deferred revenue 80,008,796 98,652,373 Accounts payable 68,999,181 625,606,846 Accrued interest, taxes and other liabilities 58,007,069 (19,403,632) Net cash generated from operations 3,620,314,327 167,729,761 Income taxes paid (1,244,968,634) (1,187,753,780) Net cash provided by (used in) operating activities 2,375,345,693 (1,020,024,019) CASH FLOWS FROM INVESTING ACTIVITIES
Proceeds from sale of: Property and equipment (Notes 10 and 21) 18,233,817 8,394,552
Available-for-sale investments (Note 8) – 446,509,542 Acquisitions of:
Intangible assets (Note 11) (201,566,480) (157,205,814) Property and equipment (Note 10) (119,318,567) (91,166,724) Net cash provided by (used in) investing activities (302,651,230) 206,531,556 CASH FLOWS FROM FINANCING ACTIVITIES
Proceeds from availments of notes payable 8,049,838,965 12,229,432,900 Payments of:
Notes payable (9,188,127,367) (4,970,347,878) Dividends (Note 19) (2,115,000,000) (1,800,000,000) Net cash provided by (used in) financing activities (3,253,288,402) 5,459,085,022
EFFECT OF CHANGE IN FOREIGN EXCHANGE RATES ON CASH AND CASH EQUIVALENTS 140,030 1,417
NET INCREASE (DECREASE) IN CASH AND CASH EQUIVALENTS (1,180,453,909) 4,645,593,976
(Forward)

- 2 -
Years Ended December 31
2015 2014
CASH AND CASH EQUIVALENTS AT BEGINNING OF YEAR Cash P=1,832,732,475 P=804,059,524
Due from Bangko Sentral ng Pilipinas 7,085,597,520 4,407,676,495 Interbank loans receivable and securities purchased
under resale agreement 939,000,000 –
9,857,329,995 5,211,736,019
CASH AND CASH EQUIVALENTS AT END OF YEAR (Note 6) Cash 1,040,500,296 1,832,732,475
Due from Bangko Sentral ng Pilipinas 7,636,375,790 7,085,597,520 Interbank loans receivable and securities purchased
under resale agreement – 939,000,000
P=8,676,876,086 P=9,857,329,995
OPERATING CASH FLOWS FROM INTERESTS AND DIVIDENDS
Interest received P=8,379,703,203 P=7,875,253,195 Interest paid (1,169,714,280) (1,114,198,815) Dividends received – 1,947,160
P=7,209,988,923 P=6,763,001,540
See accompanying Notes to Financial Statements.

METROBANK CARD CORPORATION (A Finance Company) NOTES TO FINANCIAL STATEMENTS 1. Corporate Information
Metrobank Card Corporation (A Finance Company) (the Company) was initially incorporated in the Philippines as a credit card company on August 6, 1985, as Unibancard Corporation. On June 4, 2002, the Company changed its name to Metrobank Card Corporation after its merger with AB Card and Solid Card. On March 27, 2008, the Company received its license from the Securities and Exchange Commission (SEC) to operate as a finance company. Also, on June 5, 2008, the Bangko Sentral ng Pilipinas (BSP) issued a quasi-banking license to the Company, which allows borrowings from more than 19 lenders for the purpose of funding working capital.
The Company is a domestic corporation registered with the SEC. The Company offers and issues credit cards branded as Metrobank Visa, Metrobank MasterCard, Philippine Savings Bank (PSBank) MasterCard, Robinsons-Cebu Pacific MasterCard, Toyota MasterCard, and YAZZ prepaid cards. Its principal place of business is located at MCC Center, 6778 Ayala Avenue, Makati City.
The Company is 60.0%-owned by Metropolitan Bank and Trust Company (Metrobank or Parent Company) and 40.0%-owned by Australia and New Zealand Funds Pty. Ltd. (ANZ).
2. Summary of Significant Accounting Policies
Basis of Preparation The accompanying financial statements of the Company have been prepared on a historical cost basis, except for derivative financial instruments and available-for-sale (AFS) investments that have been measured at fair value. The Company’s financial statements are presented in Philippine peso, the Company’s functional currency, and all values are rounded to the nearest peso, except when otherwise indicated. Statement of compliance The accompanying financial statements of the Company have been prepared in accordance with Philippine Financial Reporting Standards (PFRS).
Presentation of financial statements Financial assets and financial liabilities are offset and the net amount reported in the statement of financial position only when there is a legally enforceable right to offset the recognized amounts and there is an intention to settle on a net basis, or to realize the assets and settle the liability simultaneously. Income and expense are not offset in the statement of income unless required or permitted by any accounting standard or interpretation, and as specifically disclosed in the accounting policies of the Company.
Changes in Accounting Policies and Disclosures The accounting policies adopted are consistent with those of the previous financial year except for the following amendments and improvements to PFRSs, Philippine Accounting Standards (PAS) and Philippine Interpretation on International Financial Reporting Interpretations Committee

- 2 -
(IFRIC), which were adopted beginning January 1, 2015. The amendments and improvements did not have any significant impact on the accounting policies, financial position or performance of the Company.
• Amendments to PAS 19, Defined Benefit Plans: Employee Contributions Annual Improvements to PFRSs (2010 – 2012 cycle) • PFRS 2, Share-based Payment – Definition of Vesting Condition • PFRS 3, Business Combinations – Accounting for Contingent Consideration in a Business
Combination • PFRS 8, Operating Segments – Aggregation of Operating Segments and Reconciliation of the
Total of the Reportable Segments’ Assets to the Entity’s Assets • PAS 16, Property, Plant and Equipment, and PAS 38, Intangible Assets – Revaluation
Method – Proportionate Restatement of Accumulated Depreciation and Amortization • PAS 24, Related Party Disclosures – Key Management Personnel Services Annual Improvements to PFRSs (2011 – 2013 cycle) • PFRS 3, Business Combinations – Scope Exceptions for Joint Arrangements • PFRS 13, Fair Value Measurement – Portfolio Exception • PAS 40, Investment Property
Significant accounting policies
Current and Non-current Classification The Company presents assets and liabilities in statements of financial position based on current and non-current classification. An asset or liability is current when it is: • expected to be realized or intended to be sold or consumed or settled in normal operating
cycle; • held primarily for the purpose of trading; or • expected to be realized or due to be settled within twelve months after the reporting period.
An asset is also current when it is cash or cash equivalent unless restricted from being exchanged or used to settle a liability for at least twelve months after the reporting period. A liability is also current when there is no unconditional right to defer the settlement of the liability for at least twelve months after the reporting period. All other assets or liabilities are classified as non-current. Deferred tax assets and liabilities are classified as non-current assets and liabilities. Foreign currency translations – transactions and balances Transactions in foreign currencies are initially recorded at the functional currency rate of exchange ruling at the date of the transaction.
Foreign currency-denominated monetary assets and liabilities are translated using the Philippine Dealing System (PDS) closing rate prevailing at the statement of financial position date; income and expenses are translated at PDS weighted average rates prevailing at transaction dates.

- 3 -
Exchange differences arising from reporting foreign currency monetary items at rates different from those at which they were previously recorded, as well as foreign exchange gains or losses arising from foreign currency transactions are credited to or charged against current operations in the year on which the rates changed.
Non-monetary items that are measured in terms of historical cost in a foreign currency are translated using the exchange rates as at the dates of the initial transactions. Non-monetary items measured at fair value in a foreign currency are translated using the exchange rates at the date when the fair value was determined.
Fair value measurement Fair value is the estimated price that would be received to sell an asset or paid to transfer a liability in an orderly transaction between market participants at the measurement date. The fair value measurement is based on the presumption that the transaction to sell the asset or transfer the liability takes place either: • in the principal market for the asset or liability, or • in the absence of a principal market, in the most advantageous market for the asset or liability. The principal or the most advantageous market must be accessible to the Company.
The fair value of an asset or a liability is measured using assumptions that market participants would use when pricing the asset or liability, assuming that market participants act in their economic best interest. A fair value measurement of a non-financial asset takes into account a market participant's ability to generate economic benefits by using the asset in its highest and best use or by selling it to another market participant that would use the asset in its highest and best use. The Company uses valuation techniques that are appropriate in the circumstances and for which sufficient data are available to measure fair value, maximizing the use of relevant observable inputs and minimizing the use of unobservable inputs.
All assets and liabilities for which fair value is measured or disclosed in the financial statements are categorized within the fair value hierarchy, described as follows, based on the lowest level input that is significant to the fair value measurement as a whole: • Level 1 ‒ Quoted (unadjusted) market prices in active markets for identical assets or
liabilities; • Level 2 ‒ Valuation techniques for which the lowest level input that is significant to the fair
value measurement is directly or indirectly observable; and • Level 3 ‒ Valuation techniques for which the lowest level input that is significant to the fair
value measurement is unobservable.
If an asset or a liability measured at fair value has a bid price and an ask price, the price within the bid - ask spread that is most representative of fair value in the circumstances shall be used to measure fair value regardless of where the input is categorized within the fair value hierarchy.
For assets and liabilities that are recognized in the financial statements on a recurring basis, the Company determines whether transfers have occurred between Levels in the hierarchy by re-assessing categorization (based on the lowest level input that is significant to the fair value measurement as a whole) at the end of each reporting period.

- 4 -
For the purpose of fair value disclosures, the Company has determined classes of assets and liabilities on the basis of the nature, characteristics and risks of the asset or liability and the level of the fair value hierarchy (Note 5).
Cash and cash equivalents For purposes of reporting cash flows, cash and cash equivalents include cash on hand and in banks, amounts due from BSP and interbank loans receivable and securities purchased under resale agreements (SPURA) with original maturities of three months or less from dates of placements and that are subject to insignificant risk of changes in value. Due from BSP includes statutory reserves required by the BSP for debt obligations considered as deposit substitutes.
Repurchase and reverse repurchase agreements Securities sold under agreements to repurchase at a specified future date (‘repos’) are not derecognized from the statement of financial position. The corresponding cash received, including accrued interest, is recognized in the statement of financial position as a loan to the Company, reflecting the economic substance of such transaction. Conversely, securities purchased under agreement to resell at a specified future date (‘reverse repos’) are not recognized in the statement of financial position. The corresponding cash paid, including accrued interest, is recognized in the statement of financial position as SPURA, and is considered as a loan to the counterparty. The Company is not permitted to sell or re-pledge the collateral in the absence of default by the owner of the collateral. The difference between the purchase price and resale price is treated as interest income in the statement of income and is accrued over the life of the agreement using the effective interest rate (EIR) method.
Financial instruments - initial recognition and subsequent measurement Date of recognition Purchases or sales of financial assets that require delivery of assets within the time frame established by regulation or convention in the marketplace are recognized in the settlement date - the date that an asset is delivered to or by the Company. Amounts due to banks and customers and loans are recognized when cash is received by the Company or advanced to the borrowers. Initial measurement of financial instruments The classification of financial instruments at initial recognition depends on the purpose and the management’s intention for which the financial instruments were acquired and their characteristics. All financial assets, including trading and investment securities and loans and receivables, are initially measured at fair value. Except for financial assets and liabilities valued at fair value through profit or loss (FVPL), the initial measurement of financial instruments includes transaction costs. The Company classifies its financial assets in the following categories: financial assets at FVPL, held-to-maturity investments (HTM), AFS investments and loans and receivables. The classification depends on the purpose for which the investments were acquired. Financial liabilities are classified into financial liabilities at FVPL and financial liabilities at amortized cost. The Company has no HTM investments as of December 31, 2015 and 2014.
‘Day 1’ profit or loss Where the transaction price in a non-active market is different from the fair value of other observable current market transactions in the same instrument or based on a valuation technique whose variables include only data from an observable market, the Company recognizes the difference between the transaction price and fair value (a ‘Day 1’ profit or loss) in the statement of income under ‘Miscellaneous income or expense’ unless it qualifies for recognition as some other type of asset.

- 5 -
In cases where use is made of data which is not observable, the difference between the transaction price and model value is only recognized in the statement of income when the inputs become observable or when the instrument is derecognized. For each transaction, the Company determines the appropriate method of recognizing the ‘Day 1’ profit or loss amount.
Derivatives recorded at FVPL Derivative financial instruments are initially recorded at fair value on the date at which the derivative contract is entered into and are subsequently remeasured at fair value. Any gains or losses arising from changes in fair values of derivatives are taken directly to the statement of income. Derivatives are carried as assets when the fair value is positive and as liabilities when the fair value is negative.
Embedded derivatives are bifurcated from the host contracts and are accounted for as derivative assets or liabilities. An embedded derivative is separated from the host contract and accounted for as a derivative if all of the following conditions are met: a) the economic characteristics and risks of the embedded derivative are not closely related to the economic characteristic of the host contract; b) a separate instrument with the same terms as the embedded derivative would meet the definition of a derivative; and c) the hybrid or combined instrument is not recognized at FVPL.
For the purpose of hedge accounting, hedges are classified primarily as either: a) a hedge of the fair value of an asset, liability or a firm commitment (fair value hedge); b) a hedge of the exposure to variability in cash flows attributable to an asset or liability or a forecast transaction (cash flow hedge); or c) a hedge of a net investment in a foreign operation (net investment hedge). Hedge accounting is applied to derivatives designated as hedging instruments in a fair value, cash flow or net investment hedge provided certain criteria are met.
Hedge accounting At the inception of a hedge relationship, the Company formally designates and documents the hedge relationship to which the Company wishes to apply hedge accounting and the risk management objective and strategy for undertaking the hedge. The documentation includes identification of the hedging instrument, the hedged item or transaction, the nature of the risk being hedged and how the entity will assess the effectiveness of changes in the hedging instrument’s fair value in offsetting the exposure to changes in the hedged item’s fair value or cash flows attributable to the hedged risk. Such hedges are expected to be highly effective in achieving offsetting changes in fair value or cash flows and are assessed on an ongoing basis to determine that they actually have been highly effective throughout the financial reporting periods for which they were designated. Cash flow hedge The effective portion of the gain or loss on the hedging instrument is recognized directly as ‘Net unrealized gain or loss on cash flow hedge’ in the statement of comprehensive income. Any gain or loss in fair value relating to an ineffective portion is recognized immediately in the statement of income.
Amounts recognized as other comprehensive income are reclassified from equity to profit or loss as a reclassification adjustment in the same period or periods during which the hedged forecast cash flows affect profit or loss (such as in the periods that interest income or interest expense is recognized.

- 6 -
Hedge effectiveness testing To qualify for hedge accounting, the Company requires that at the inception of the hedge and throughout its life, each hedge must be expected to be highly effective (prospective effectiveness), and demonstrate actual effectiveness (retrospective effectiveness) on an ongoing basis.
The documentation of each hedging relationship sets out how the effectiveness of the hedge is assessed. The method that the Company adopts for assessing hedge effectiveness will depend on its risk management strategy.
For prospective effectiveness, the hedging instrument must be expected to be highly effective in offsetting changes in fair value or cash flows attributable to the hedged risk during the period for which the hedge is designated. The Company applies the dollar-offset method using hypothetical derivatives in performing hedge effectiveness testing. For actual effectiveness to be achieved, the changes in fair value or cash flows must offset each other in the range of 80.0% to 125.0%. Any hedge ineffectiveness is recognized in the statement of income.
AFS investments Financial assets classified as available-for-sale are those non-derivative investments which are designated as such and do not qualify to be classified or designated as held-for-trading, fair value through profit or loss or loans and receivables. After initial measurement, AFS investments are subsequently measured at fair value. AFS investments are purchased and held indefinitely, and may be sold in response to liquidity requirements or changes in market conditions. The unrealized gains and losses from measuring AFS instruments at fair value are recognized directly in equity (other comprehensive income or loss) under ‘Net unrealized gain (loss) on AFS investments’ account in the statement of financial position. When the investment is disposed of, the cumulative gain or loss previously recognized in the statement of comprehensive income is recognized in the statement of income. Where the Company holds more than one investment in the same security they are deemed to be disposed of on a first-in first-out basis. Interest earned while holding AFS debt investments is reported as interest income using the effective interest method. Dividends earned while holding AFS equity investments are recognized in the statement of income when the right of payment has been established. The losses arising from impairment of such investments are recognized in the statement of income and removed from the ‘Net unrealized gain (loss) on AFS investments’ account.
Loans and receivables This accounting policy relates to the Company’s ‘Cash and cash equivalents’ (excluding cash on hand), ‘Due from BSP’, ‘Interbank loans receivable and SPURA’, ‘Accounts receivable’ and refundable deposits under ‘Other assets’. These are non-derivative financial assets with fixed or determinable payments and fixed maturities that are not quoted in an active market. They are not entered into with the intention of immediate or short-term resale and are not classified as ‘other financial assets held for trading’, designated as ‘AFS investments’ or ‘Financial assets designated at FVPL’.
Purchases by the Company’s cardholders which are collected on installments are recorded at the cost of the items purchased plus interest covering the installment period which is initially credited to unearned interest income, shown as a deduction from accounts receivable.
Deferred acquisition cost, which is part of ‘Accounts receivable’, represents capitalized expenses related to incremental direct cost associated with the successful origination of credit card facilities which are amortized over two years, the average relationship life with customers.

- 7 -
After initial measurement, loans and receivables are subsequently measured at amortized cost using the effective interest method, less allowance for credit losses. Amortized cost is calculated by taking into account any discount or premium on acquisition and fees and costs that are an integral part of the EIR. The amortization is included in ‘Interest and penalties’ in the statement of income. The losses arising from impairment are recognized in ‘Provision for credit losses’ in the statement of income.
Interest-bearing loans and borrowings All loans and borrowings are initially recognized at fair value less directly attributable transaction costs and have not have been designated as at FVPL. After initial recognition, interest-bearing loans and borrowings are subsequently measured at amortized cost using the effective interest method. Amortized cost is calculated taking into account any underwriting and debt issue costs that are integral part of EIR.
Issued financial instruments or their components are classified as liabilities under ‘Bills payable’, ‘Notes payable’, ‘Subordinated debt’, ‘Accrued interest payable’ and other appropriate financial liability accounts (e.g., ‘Accounts payable’) where the substance of the contractual arrangement results in the Company having an obligation either to deliver cash or another financial asset to the holder, or to satisfy the obligation other than by the exchange of fixed amount of cash or another financial asset. Gains and losses are recognized in the statement of income when the liabilities are derecognized as well as through the amortization process. Impairment of financial assets The Company assesses at each statement of financial position date whether there is objective evidence that a financial asset or a group of financial assets is impaired. A financial asset or a group of financial assets is deemed to be impaired if, and only if, there is objective evidence of impairment as a result of one or more events that has occurred after the initial recognition of the asset (an incurred loss event) and that loss event (or events) has an impact on the estimated future cash flows of the financial asset or group of financial assets that can be reliably estimated. Evidence of impairment may include indications that the borrower or the group of borrowers is experiencing significant financial difficulty, default or delinquency in interest or principal payments, the probability that they will enter bankruptcy or other financial reorganization and where observable data indicate that there is measureable decrease in the estimated future cash flows, such as changes in arrears or economic conditions that correlate with defaults.
Financial assets carried at amortized cost For financial assets classified and measured at amortized cost such as loans and receivables and due from other banks, the Company first assesses whether objective evidence of impairment exists individually for financial assets that are individually significant, or collectively for financial assets that are not individually significant.
For individually assessed financial assets, the amount of the loss is measured as the difference between the asset’s carrying amount and the present value of the estimated future cash flows (excluding future credit losses that have not been incurred).
For the purpose of a collective evaluation of impairment, financial assets are grouped on the basis of such credit risk characteristics as to industry, collateral type, past-due status and term. Future cash flows in a group of financial assets that are collectively evaluated for impairment are estimated on the basis of historical loss experience for assets with credit risk characteristics similar to those in the group. Historical loss experience is adjusted on the basis of current observable data

- 8 -
to reflect the effects of current conditions that did not affect the period on which the historical loss experience is based and to remove the effects of conditions in the historical period that do not exist currently. The carrying amount of the asset is reduced through the use of an allowance account and the amount of loss is charged to the statement of income. Interest income continues to be recognized based on the original effective interest rate of the asset. If, in a subsequent year, the amount of the estimated impairment loss increases or decreases because of an event occurring after the reporting date, the impairment loss is increased or reduced by adjusting the allowance account. Any subsequent reversal of an impairment loss is recognized in the statement of income, to the extent that the carrying value of the asset does not exceed its amortized cost at the reversal date. The assets, together with the associated allowance accounts, are written-off when there is no realistic prospect of future recovery and all collateral, if any, have been realized or if the accounts are 180 days past due. If a future write-off is later recovered, any amounts formerly charged are credited to the statement of income. Past due accounts include accounts with no payments or with payments but less than the minimum amount due on or before the due dates.
The Company’s accounts receivable, which significantly represent receivables from credit cardholders, are assessed for impairment collectively because these receivables are not individually significant.
Collective impairment is determined based on the results of the net flow to write-off methodology. Net flow tables are derived from account-level monitoring of monthly peso movements between different stage buckets, from 1 day past due to 180 days past due. The net flow to write-off methodology relies on the last 12 months of net flow tables to establish a percentage (‘net flow rate’) of accounts receivable that are current or in any state of delinquency (e.g., 30, 60, 90, 120, 150 and 180 days past due) as of reporting date that will eventually result in write-off. The gross provision is then computed based on the outstanding balances of the receivables as of statement of financial position date and the net flow rates determined for the current and each delinquency bucket. This gross provision is reduced by the estimated recoveries, which are also based on historical data, to arrive at the required allowance for credit losses. AFS investments The Company assesses at each statement of financial position date whether there is objective evidence that its AFS investments are impaired. In the case of equity investments classified as AFS investments, this would include a significant or prolonged decline in the fair value of the investments below its cost. Where there is evidence of impairment, the cumulative loss - measured as the difference between the acquisition cost and the current fair value, less any impairment loss on that financial asset previously recognized in the statement of income is removed from the ‘Net unrealized gain (loss) on AFS investments’ in other comprehensive income and recognized in ‘Provision for credit losses’ in the statement of income.
Impairment losses on equity investments are not reversed through the statement of income. Increases in fair value after impairment are recognized directly in the statement of comprehensive income.
Renegotiated loans Where possible, the Company seeks to restructure loans rather than to take possession of any sort of collateral. This may involve extending the payment arrangements and the agreement of new loan conditions. Once the terms have been renegotiated any impairment is measured using the original EIR as calculated before the modification of terms and the loan is no longer considered

- 9 -
past due. Management continuously reviews renegotiated loans to ensure that all criteria are met and that future payments are likely to occur. The loans continue to be subject to an individual or collective impairment assessment, calculated using the loan’s original EIR.
Derecognition of financial assets and liabilities Financial asset A financial asset (or, where applicable a part of a financial asset or part of a group of financial assets) is derecognized when:
• the rights to receive cash flows from the asset have expired; or • the Company retains the right to receive cash flows from the asset, but has assumed an
obligation to pay them in full without material delay to a third party under a ‘pass-through’ arrangement; and either a. has transferred substantially all the risks and rewards of the asset, or b. has neither transferred nor retained substantially all the risks and rewards of the asset, but
has transferred control over the asset. When the Company has transferred its rights to receive cash flows from an asset and has neither transferred nor retained substantially all the risks and rewards of the asset nor transferred control over the asset, the asset is recognized to the extent of the Company’s continuing involvement in the asset. In that case, the Company also recognizes an associated liability. The transferred asset and the associated liability are measured on a basis that reflects the rights and obligations that the Company has retained. Continuing involvement that takes the form of a guarantee over the transferred asset is measured at the lower of the original carrying amount of the asset and the maximum amount of consideration that the Company could be required to repay.
Financial liability A financial liability is derecognized when the obligation under the liability is discharged or cancelled or has expired. When an existing financial liability is replaced by another from the same lender on substantially different terms, or the terms of an existing liability are substantially modified, such an exchange or modification is treated as a derecognition of the original liability and the recognition of a new liability, and the difference in the respective carrying amounts is recognized in the statement of income.
Lease The determination of whether an arrangement is, or contains a lease is based on the substance of the arrangement and requires an assessment of whether the fulfillment of the arrangement is dependent on the use of a specific asset or assets and the arrangement conveys a right to use the asset. A reassessment is made after inception of the lease only if one of the following applies:
a. there is a change in contractual terms, other than a renewal or extension of the arrangement; b. a renewal option is exercised or extension granted, unless that term of the renewal or
extension was initially included in the lease term; c. there is a change in the determination of whether fulfillment is dependent on a specified asset;
or d. there is a substantial change to the asset.

- 10 -
Where a reassessment is made, lease accounting shall commence or cease from the date when the change in circumstances gives rise to the reassessment for scenarios (a), (c) or (d) above, and at the date of renewal or extension period for scenario (b).
Company as lessee Leases which do not transfer to the Company substantially all the risks and benefits incidental to ownership of the leased items are operating leases. Operating lease payments are recognized as an expense in the statement of income on a straight-line basis over the lease term. Contingent rental payable are recognized as an expense in the period in which they are incurred.
Company as lessor Leases where the Company does not transfer substantially all the risks and benefits of ownership of the asset are classified as operating leases. Initial direct costs incurred in negotiating operating leases are added to the carrying amount of the leased asset and recognized over the lease term on the same basis as rental income. Contingent rents are recognized as revenue in the period in which they are earned.
Revenue recognition Revenue is recognized to the extent that it is probable that economic benefits will flow to the Company and the revenue can be reliably measured, regardless of when the payment is being made. Revenue is measured at the fair value of the consideration received or receivable, taking into account contractually defined terms of payment and excluding taxes or duty. The Company assesses its revenue arrangements against specific criteria in order to determine if it is acting as a principal or agent. The Company has concluded that it is the principal in all of its revenue arrangements since it is the primary obligor in all the revenue arrangements, has pricing latitude and is also exposed to credit risks.
The following specific recognition criteria must also be met before revenue is recognized: Interest and penalties Generally, interest and penalties are recognized based on the accrual method of accounting, except for interest and penalties on accounts that are past due for 90 days and over which are recognized only as income upon collection from cardholders.
Interest on interest-bearing placements with banks and securities are recognized as the interest accrues, taking into account the effective yield of the asset.
Unearned interest income on installment purchases by cardholders is recognized as income over the installment terms using the effective interest method.
Discounts earned Discounts are taken up as income upon receipt from member establishments of charges arising from credit availments by the Company’s cardholders and other credit companies’ cardholders when the Company is acting as an acquirer. These discounts are computed based on certain agreed rates and are deducted from amounts remitted to the member establishments. This account also includes interchange income from transactions processed by other acquirers through VISA Inc. (Visa) and MasterCard Incorporated (MasterCard) and service fee from cash advance transactions of cardholders.

- 11 -
Awards revenue The Company operates a loyalty points program which allows customers to accumulate points when they purchase from member establishments using the issued card of the Company. The points can then be redeemed for free products subject to a minimum number of points being obtained.
A proportion of revenue from discounts earned and interchange fees from credit cards is allocated to the reward points. The allocated revenue that corresponds to the total fair value of the reward points is determined by applying statistical analysis. The fair value of the points issued is deferred and recorded under ‘Deferred revenue’ and recognized as revenue when the points are redeemed. Membership fees and dues Membership fees that are periodically charged to cardholders are deferred and recorded under ‘Deferred revenue’ and recognized on a straight-line basis over the period the fee entitles the cardholders to use the card.
Dividend income Dividend income is recognized when the Company’s right to receive payment is established.
Miscellaneous income ‘Over credit limit fee’, ‘Gross international fee’, ‘Service fee’, ‘Business process outsourcing fee’ and ‘Transaction processing fee’ are recognized as income when the related services are rendered. ‘Gain on sale of properties’ is recognized when the significant risks and rewards of ownership of the asset have passed to the buyer, usually on the date of delivery, and the collectability of the sales price is reasonably assured.
Expense recognition Expenses are recognized when it is probable that a decrease in future economic benefit related to a decrease in an asset or an increase in liability has occurred and the decrease in economic benefits can be measured reliably. Revenues and expenses that relate to the same transaction or other event are recognized simultaneously. Operating expenses Operating expenses constitute costs which arise in the normal course of business and are recognized when incurred. Loyalty expense Costs of rewards are recognized as expense and recorded under ‘Loyalty expense’ when the related loyalty points are redeemed by the cardholder.
Taxes, duties and license fees This includes all other taxes, local and national, including gross receipt taxes, documentary stamp taxes, fringe benefit taxes, license and permit fees that are recognized when incurred.
Debt Issue Costs Issuance and other related expenses incurred in connection with the issuance of debt instruments (other than debt instruments designated at FVPL) are deferred and amortized over the terms of the instruments using the effective interest method. Unamortized debt issuance costs are included in the measurement of the related carrying value of the debt instruments in the statement of financial position.

- 12 -
Borrowing Costs Borrowing costs consist of interest expense which the Company incurs in connection with borrowing of funds. Borrowing costs are calculated using the effective interest method in accordance with PAS 39 and are recognized as expense in the year in which these costs are incurred. Property and equipment Depreciable properties such as building, office condominium units, furniture, fixtures and equipment, transportation equipment, building and leasehold improvements are carried at cost less accumulated depreciation and amortization and accumulated impairment in value, if any. Land is carried at cost less any impairment loss.
The initial cost of property and equipment consists of its purchase price, including import duties, taxes and any directly attributable costs of bringing the asset to its working condition and location for its intended use. Expenditures incurred after the property and equipment have been put into operation, such as repairs and maintenance are normally charged against operations in the year in which the costs are incurred. In situations where it can be clearly demonstrated that the expenditures have resulted in an increase in the future economic benefits expected to be obtained from the use of an item of property and equipment beyond its originally assessed standard of performance, the expenditures are capitalized as an additional cost of property and equipment.
When property and equipment are retired or otherwise disposed of, the cost and the related accumulated depreciation and amortization and accumulated impairment in value, if any, are removed from the accounts and any resulting gain or loss is credited to or charged against current operations.
Depreciation is computed using the straight-line method over the estimated useful lives of the assets. The annual depreciation and amortization rates follow:
Building 3.3% Office condominium units 5.0% Furniture, fixtures and equipment 20.0% to 33.0% Transportation equipment 20.0% Building improvements 20.0% or the life of the building, whichever is shorter Leasehold improvements 20.0% or the term of the lease, whichever is shorter
An item of property and equipment and any significant part initially recognized is derecognized upon disposal or when no future economic benefits are expected from its use or disposal. Any gain or loss arising on derecognition of the asset (calculated as the difference between the net disposal proceeds and the carrying amount of the asset) is included in the statement of income when the asset is derecognized. The estimated useful lives and the depreciation and amortization method are reviewed periodically to ensure that the period and the method of depreciation and amortization are consistent with the expected pattern of economic benefits from items of property and equipment. The carrying value of property and equipment are reviewed for impairment when events or changes in circumstances indicate that the carrying value may not be recoverable (see accounting policy on Impairment of non-financial assets).
- 13 -
Intangible assets Intangible assets acquired separately are measured on initial recognition at cost. Following initial recognition, intangible assets are carried at cost less any accumulated amortization and any accumulated impairment losses. Internally generated intangible assets, excluding capitalized development costs, are not capitalized and the expenditure is reflected in the statement of income in the year in which the expenditure is incurred.
The useful lives of intangible assets are assessed to be either finite or indefinite. As of December 31, 2015 and 2014, the Company does not have intangible assets with indefinite useful lives.
Intangible assets with finite lives are amortized over the useful economic life and assessed for impairment whenever there is an indication that the intangible assets may be impaired. The amortization period and amortization method for an intangible asset with a finite useful life are reviewed at least at each financial year-end. Changes in the expected useful life or the expected pattern of consumption of future economic benefits embodied in the asset is accounted for by changing the amortization period or method, as appropriate, and treated as changes in accounting estimates. The amortization expense on intangible assets with finite lives is recognized in the statement of income. Gains or losses arising from the derecognition of an intangible asset are measured as the difference between the net disposal proceeds and the carrying amount of the asset and are recognized in the statement of income when the asset is derecognized.
The useful lives of the Company’s intangible assets are summarized as follows: License fees Capitalized software Useful lives 3 to 5 years 1 to 5 years
Amortization method
Amortized on a straight-line basis over the related terms of the contracts
Amortized on a straight-line basis over its useful economic life
License fees License fees represent the amount paid for the privilege to use software modules and manuals. Following initial recognition, license fees are carried at cost less accumulated amortization and any accumulated impairment losses. Capitalized software Capitalized software acquired separately is measured at cost on initial recognition. Following initial recognition, capitalized software is carried at cost less any accumulated amortization and any accumulated impairment losses.
The useful life of the capitalized software is assessed and reviewed periodically. Changes in the expected useful life are accounted for by changing the amortization period and method, as appropriate, and treated as changes in accounting estimates. The amortization expense of the capitalized software is recorded in the statement of income.

- 14 -
Project in progress Research costs are expensed as incurred. Development expenditures on an individual project are recognized when the Company can demonstrate: a. the technical feasibility of completing the intangible asset so that the asset will be available for
use or sale; b. its intention to complete and its ability and intention to use or sell the asset; c. how the asset will generate future economic benefits; d. the availability of resources to complete the asset; and e. the ability to measure reliably the expenditure during development.
Upon completion of development, the project cost is reclassified to ‘Capitalized software’. Amortization of the asset begins when development is complete and the asset is available for use. It is amortized over the period of expected future benefit. Impairment of non-financial assets Property and equipment and intangible assets At reporting date, or more frequently if events or changes in circumstances indicate that the carrying values may not be recoverable, the carrying values of property and equipment and intangible assets are reviewed for impairment. If any such indication exists and where the carrying values exceed the estimated recoverable amounts, the assets or cash-generating units are written down to their recoverable amounts. The recoverable amount of the asset is the greater of fair value less costs of disposal and value in use. In assessing value in use, the estimated future cash flows are discounted to their present value using a pre-tax discount rate that reflects current market assessments of the time value of money and the risks specific to the asset. For an asset that does not generate largely independent cash inflows, the recoverable amount is determined for the cash-generating unit to which the asset belongs. Impairment losses are recognized in the statement of income. A previously recognized impairment loss is reversed by a credit to current operations to the extent that it does not restate the asset to a carrying amount in excess of what would have been determined (net of any accumulated depreciation and amortization) had no impairment loss been recognized for the asset in prior years.
Equity Capital stock is measured at par value for all shares issued and outstanding. When the shares are sold at a premium, the difference between the proceeds and the par value is credited to a paid-in capital account. Retained earnings represent all current and prior period results of operations as reported in the statements of income, reduced by the amounts of dividends declared. Dividends on common shares Dividends on common shares are recognized as liability and deducted from equity when they are approved by the Company’s Board of Directors (BOD). Interim dividends are deducted from equity when they are declared and no longer at the discretion of the Company.
Dividends for the year that are approved by the Company’s BOD after the statement of financial position date are disclosed as events after the statement of financial position date.
Retirement benefits The Company operates a defined benefit plan, which requires contributions to be made to a separately administered fund.
- 15 -
Defined benefit plan The net defined benefit liability or asset is the aggregate of the present value of the defined benefit obligation at the end of the reporting period reduced by the fair value of plan assets (if any), adjusted for any effect of limiting a net defined benefit asset to the asset ceiling. The asset ceiling is the present value of any economic benefits available in the form of refunds from the plan or reductions in future contributions to the plan.
The cost of providing benefits under the defined benefit plans is actuarially determined using the projected unit credit method.
Defined benefit costs comprise the following: a. service cost; b. net interest on the net defined benefit liability or asset; and c. remeasurements of net defined benefit liability or asset.
Service costs which include current service costs, past service costs and gains or losses on non-routine settlements are recognized as expense in profit or loss. Past service costs are recognized when plan amendment or curtailment occurs. These amounts are calculated periodically by independent qualified actuaries. Net interest on the net defined benefit liability or asset is the change during the period in the net defined benefit liability or asset that arises from the passage of time which is determined by applying the discount rate based on government bonds to the net defined benefit liability or asset. Net interest on the net defined benefit liability or asset is recognized as expense or income in profit or loss. Remeasurements comprising actuarial gains and losses, return on plan assets and any change in the effect of the asset ceiling (excluding net interest on defined benefit liability) are recognized immediately in other comprehensive income in the period in which they arise. Remeasurements are not reclassified to profit or loss in subsequent periods.
Plan assets are assets that are held by a long-term employee benefit fund or qualifying insurance policies. Plan assets are not available to the creditors of the Company, nor can they be paid directly to the Company. Fair value of plan assets is based on market price information. When no market price is available, the fair value of plan assets is estimated by discounting expected future cash flows using a discount rate that reflects both the risk associated with the plan assets and the maturity or expected disposal date of those assets (or, if they have no maturity, the expected period until the settlement of the related obligations). If the fair value of the plan assets is higher than the present value of the defined benefit obligation, the measurement of the resulting defined benefit asset is limited to the present value of economic benefits available in the form of refunds from the plan or reductions in future contributions to the plan. The Company’s right to be reimbursed of some or all of the expenditure required to settle a defined benefit obligation is recognized as a separate asset at fair value when and only when reimbursement is virtually certain.
Employee leave entitlement Employee entitlements to annual leave are recognized as a liability when they are accrued to the employees. The undiscounted liability for leave expected to be settled wholly before twelve months after the end of the annual reporting period is recognized for services rendered by employees up to the end of the reporting period.

- 16 -
Provisions and contingencies Provisions are recognized when the Company has a present obligation (legal or constructive) where, as a result of a past event, it is probable that an outflow of resources embodying economic benefits will be required to settle the obligation and a reliable estimate can be made of the amount of the obligation. If the effect of the time value of money is material, provisions are determined by discounting the expected future cash flows at a pre-tax rate that reflects current market assessments of the time value of money and, where appropriate, the risks specific to the liability. Where discounting is used, the increase in the provision due to the passage of time is recognized as an interest expense. Contingent liabilities are not recognized but are disclosed in the financial statements unless the possibility of an outflow of resources embodying economic benefits is remote. Contingent assets are not recognized but are disclosed in the financial statements when an inflow of economic benefits is probable.
Income Taxes Income tax on profit and loss for the year comprises current and deferred tax. Income tax is determined in accordance with tax laws and is recognized in the statement of income, except to the extent that it relates to items directly recognized in OCI. Current tax Current tax assets and liabilities for the current period are measured at the amount expected to be recovered from or paid to the taxation authorities. The tax rates and tax laws used to compute the amount are those that have been enacted or substantially enacted at the statement of financial position date. Deferred tax Deferred tax is provided, using the balance sheet liability method, on all temporary differences at the statement of financial position date between the tax bases of assets and liabilities and their carrying amounts for financial reporting purposes. Deferred tax liabilities are recognized for all taxable temporary differences. Deferred tax assets are recognized for all deductible temporary differences, carry forward of unused tax credits from excess minimum corporate income tax (MCIT) and unused net operating loss carryover (NOLCO), to the extent that it is probable that taxable profit will be available against which the deductible temporary differences and carry forward of unused MCIT and unused NOLCO can be utilized. Deferred tax, however, is not recognized when it arises from the initial recognition of an asset or liability in a transaction that is not a business combination and, at the time of the transaction, affects neither the accounting profit nor taxable profit or loss.
The carrying amount of deferred tax assets is reviewed at each statement of financial position date and reduced to the extent that it is no longer probable that sufficient taxable profit will be available to allow all or part of the deferred income tax asset to be utilized. Unrecognized deferred tax assets are reassessed at each statement of financial position date and are recognized to the extent that it has become probable that future taxable profit will allow the deferred tax asset to be recovered. Deferred tax assets and liabilities are measured at the tax rates that are applicable to the year when the asset is realized or the liability is settled, based on tax rates (and tax laws) that have been enacted or substantively enacted at the statement of financial position date.

- 17 -
Current tax and deferred tax relating to items recognized directly in OCI are also recognized in OCI and not in the statement of income.
Deferred tax assets and deferred tax liabilities are offset if a legally enforceable right exists to set off current tax assets against current tax liabilities and deferred taxes related to the same taxable entity and the same taxation authority.
Events after the statement of financial position date Post-year-end events that provide additional information about the Company’s position at the statement of financial position date (adjusting events) are reflected in the financial statements. Post-year-end events that are not adjusting events are disclosed in the notes to the financial statements when material.
3. Significant Accounting Judgments, Estimates and Assumptions
In the process of applying the Company's accounting policies, management has exercised judgment and made estimates in determining the amounts recognized in the financial statements. Future events may occur which will cause the judgments and assumptions used in arriving at the estimates to change. The effects of any change in judgments and estimates are reflected in the financial statements as these become reasonably determinable. Judgments and estimates are continually evaluated and are based on historical experience and other factors, including expectations of future events that are believed to be reasonable under the circumstances.
Judgments a. Lease classification
The Company has entered into a lease agreement as a lessee. The Company has determined, based on an evaluation of the terms and conditions of the arrangements (e.g., the lease does not transfer ownership of the asset at a price that is expected to be sufficiently lower than the fair value at the date the option is exercisable and the lessor bears the cost of repairs and replacements), that all the significant risks and rewards of ownership of these properties it leases are not transferable to the Company. The Company accounts for the contracts as operating leases.
The Company also entered into lease agreements as a lessor. The Company has determined, based on an evaluation of the terms and conditions of the arrangements, such as the lease term not constituting a substantial portion of the economic life of the property, that it retains all the significant risks and rewards of ownership of these properties and accounts for the contracts as operating leases.
b. Contingencies
The Company is currently involved in various legal proceedings. The estimate of the probable cost for the resolution of claims has been developed in consultation with the outside legal counsel handling the Company’s legal proceedings and is based upon an analysis of potential results. Management does not believe that the outcome of these matters will significantly affect the results of operations (Note 26).

- 18 -
Estimates and Assumptions a. Estimation of allowance for credit losses on receivables
The Company reviews impairment of accounts receivables on a monthly basis. Impairment loss on accounts receivable is determined on a collective basis using the net flow to write-off methodology, reduced by estimated recoveries.
Accounts receivable that are 180 days past due are written-off. The net flow to write-off methodology and the recovery rates are based on historical data for the recent 12 months.
The amount and timing of recorded expenses for any period would differ if the Company made different judgments or utilized a different estimate or methodology. Additional credit losses are recorded as provision for credit losses and presented as a separate line item in the statement of income.
The provision for credit losses on accounts receivable is disclosed in more detail in Note 12.
b. Fair values of financial instruments When the fair values of financial assets and financial liabilities recorded in the statement of financial position cannot be measured based on quoted prices in active markets, their fair value is measured using valuation techniques including the discounted cash flow model. The inputs to these models are taken from observable markets where possible, but where this is not feasible, a degree of judgment is required in establishing fair values. Judgments include considerations of inputs such as liquidity risk, credit risk and volatility for longer-dated derivatives and discount rates, prepayments and default rates assumptions. Changes in assumptions about these factors could affect the reported fair value of financial instruments. The fair values of the Company’s financial instruments are disclosed in Note 5.
c. Assessing impairment and estimating useful lives of property and equipment and intangible
assets The Company assesses impairment on property and equipment and intangible assets, pertaining to capitalized software and license fees, whenever events or changes in circumstances indicate that the carrying amount of property and equipment or intangible asset, may not be recoverable. The factors that the Company considers important which could trigger an impairment review include the following:
• significant underperformance relative to expected historical or projected future operating
results; • significant changes in the manner of use of the acquired assets or the strategy for overall
business; and • significant negative industry or economic trends. The Company recognizes an impairment loss whenever the carrying amount of property and equipment or intangible assets exceeds their recoverable amount. The recoverable amount is computed using the greater of fair value less cost of disposal and value in use. The fair value less cost of disposal is based on available data from binding sales transactions, conducted at arm’s length, for similar assets or observable market prices less incremental costs for disposing the asset. Recoverable amounts are estimated for individual assets or, if it is not possible, for the cash-generating unit to which the asset belongs.

- 19 -
Also, the Company reviews annually the estimated useful lives of property and equipment and intangible assets based on expected asset utilization. It is possible that future results of operations could be materially affected by changes in these estimates. A reduction in the estimated useful lives of non-financial assets would increase recorded depreciation and amortization expense and decrease the related asset accounts. The carrying values of property and equipment and intangible assets are disclosed in Notes 10 and 11, respectively.
d. Revenue recognition for customer loyalty program The Company estimates the fair value of the points awarded under the customer loyalty program by applying statistical techniques. Inputs to the models include making assumptions about expected redemption rates, the mix of the products that will be available for redemption in the future, and customer preferences.
As points issued under the program do not expire, such estimates are subject to significant uncertainty. The estimated liability for unredeemed points is disclosed in Note 15.
e. Estimation of retirement liability The cost of the Company’s defined benefit retirement plan is determined using actuarial valuations, which involve various assumptions. These assumptions include the determination of discount rates, future salary increase rates, mortality rates of employees and future pension increases. The defined benefit obligation is highly sensitive to changes in underlying assumptions due to the complexity of the valuation and its long-term nature. In determining the appropriate discount rate, management considers the market yields on Philippine government bonds with terms consistent with the expected employee benefit payouts as of the statement of financial position date.
Mortality rate is based on publicly available mortality tables. Those mortality tables tend to change only at intervals in response to demographic changes. Future salary increases are based on expected future inflation rates in the Philippines.
All assumptions are reviewed at each reporting date. The details of assumptions used in the actuarial valuation and amounts of retirement liability as of December 31, 2015 and 2014 are disclosed in Note 22.
f. Recognition of deferred tax assets Deferred tax assets are recognized for all deductible temporary differences to the extent that it is probable that taxable profit will be available against which the losses can be utilized. Significant management judgment is required to determine the amount of deferred tax assets that can be recognized, based upon the likely timing and level of future taxable profits together with future tax planning strategies.
There were no unrecognized deferred tax assets as of December 31, 2015 and 2014. The carrying value of recognized deferred tax assets is disclosed in Note 23.

- 20 -
4. Financial Risk and Capital Management
Risk is inherent in the Company’s operations but is managed through a process of ongoing identification, measurement and monitoring of various risk management parameters, limits and other controls. This process of risk management is critical to the Company’s going concern and the Company’s management is aware and responsible for the risk exposures relating to the Company’s business activities that include, but are not limited to, the following areas: • Credit risk • Market risk • Liquidity risk • Operational risk The independent risk control process does not include business risks such as changes in the environment, technology and industry. They are monitored through the Company’s strategic planning process.
Risk management framework The Company’s BOD has overall responsibility for the oversight of the Company’s risk management process. Supporting the BOD in this function are BOD-level committees such as the Audit Committee, Risk Oversight Committee, Executive Committee as well as the Management Committee. The Audit Committee and the Risk Oversight Committee are responsible for monitoring the Company’s compliance with regulatory requirements, risk management policies and procedures, and for reviewing the adequacy of these policies and procedures in regard to the risks faced by the Company. Both Committees are supported in these functions by the Risk Management, Finance, Compliance and Internal Audit, through the Executive and Management Committees. The Audit Committee and the Risk Oversight Committee are each composed of at least three members of the BOD, at least two of whom are independent directors, including the Chairman, with accounting, auditing or related financial management expertise or experience. The principal responsibilities of the Audit Committee include annual review and reporting to the BOD on its own performance and to provide oversight of internal, compliance and external audit functions. The Risk Oversight Committee is required to identify major credit, operating, liquidity, market risks and other risk issues and shall assess the probability of each risk becoming a reality, estimate its possible effect and cost, and prioritize areas of concern where those risks will most likely occur. Moreover, the Committee ensures that all risk management strategies and policies for all types of risk are developed, properly documented, implemented and effectively communicated to the Company. The Risk Oversight Committee oversees the Risk Management Division (RMD) in strengthening the Company’s policies and procedures.
The RMD of the Company is composed of the Head of Acquisition Risk and Strategy Management, Head of Portfolio Risk, Head of Risk Management Analytics (RMA), Head of Operating Risk, Head of Liquidity Risk, and the Business Information Security Officer (BISO), all of whom report to the Head of Risk Management, who then reports directly to the Risk Oversight Committee.

- 21 -
The risk management process involves the following: Chief Financial Officer (CFO) The CFO oversees all financial aspects of the business operation which includes directing and overseeing all financial activities of the Company, including preparation of current financial reports as well as summaries and forecasts for future business growth and general economic outlook. The CFO provides leadership and coordination in the accounting, business planning, management information and budgeting efforts of the Company. Risk Management Head The Risk Management Head is accountable for ensuring the efficient and effective governance of significant risks and related opportunities of the business. The Risk Management Head manages and develops a comprehensive process for assessing, identifying, monitoring and reducing pertinent business risks such as credit, market, liquidity and operations that could interfere with the Company's objectives and goals. It is usually the Risk Management Head’s responsibility to ensure that the Company is in substantial compliance with its internal operating policies and procedures and any external legal, regulatory or contractual requirements.
Credit Risk Credit risk is the risk that one party to a financial instrument will fail to discharge an obligation and cause the other party to incur a financial loss. The Company manages credit risk by setting limits for individual borrowers, and groups of borrowers and industry segments. The Company also monitors credit exposures, and continually assesses the creditworthiness of counterparties. The Company leverages on its relationship with ANZ in strengthening its credit policies and procedures. The Company has established the Credit Risk Unit (CRU), composed of Acquisition Risk and Portfolio Risk, as part of Risk Management Division, which continues to modernize and streamline the Company’s Credit Risk Management practices and processes. ANZ has direct oversight of the Company’s credit function through its Asian Head of Retail Credit Risk.
It is the Company’s policy, which is set and approved by the Risk Management Committee, that all individuals who apply for a credit card are subjected to minimum risk acceptance criteria and credit verification procedures. Assignment of credit limit is controlled by using the individual cardholders’ risk profile. Where appropriate, a hold-out deposit with affiliated local banks is obtained from customers who fail on certain credit policy requirements. Receivable balances are being monitored monthly to minimize exposure to delinquent cardholders while maximizing revenue of the portfolio. The Company has continuously focused on process improvement, investments in new technology and enhancement in management information systems (MIS). The Company has also developed and continuously enhances an internal credit scoring system to have a more robust credit risk assessment. Through these efforts, the Company believes that the portfolio can be well-managed, quality of customer base will be improved and sustainability of the business is ensured. The Company manages credit risk guided by the following principles: • Strict compliance to credit policies. • Credit policies should be in consultation with business units and, where appropriate, supported
by MIS reports. This covers credit assessment and process, compliance and regulatory requirements and account management.
• Minimize losses by establishing robust credit policies and processes.

- 22 -
• Approval of credit facilities should be based on authorization limits approved by the BOD. • Expansion to new markets is controlled through credit testing and full use of available credit
scoring facilities and credit bureau information. • Management of portfolio through regular monitoring and analysis of acquisition, line
management and usage programs with the goal of controlling exposure to bad accounts while maximizing revenue through effective line management and usage campaigns.
• Delinquent accounts are managed by implementing robust collection strategies and efficient management of collection resources.
• A conscious effort to continuously challenge existing strategies and processes to adapt to changes in the market and maintain the Company’s competitiveness.
To track the performance of the portfolio, CRU develops, implements and reviews the credit strategies, policies, models, processes and MIS.
a. Credit risk exposure
Maximum exposure to credit risk after collateral held or other credit enhancements. The table below provides the analysis of the maximum exposure to credit risk of the Company’s financial instruments, excluding those where the carrying values as reflected in the statements of financial position and related notes already represent the financial instrument’s maximum exposure to credit risk, before and after taking into account collateral held or other credit:
2015
Gross Maximum Exposure
Fair Value of Collateral
or Credit Enhancement Net Exposure
Financial Effect
of Collateral or Credit
Enhancement Credit risk exposure relating to on balance sheet assets are as follow:
Accounts receivable: Cardholders: Fully secured P=254,953,690 P=254,953,690 P=− P=254,953,690
P=254,953,690 P=254,953,690 P=− P=254,953,690
2014
Gross Maximum Exposure
Fair Value of Collateral
or Credit Enhancement Net Exposure
Financial Effect
of Collateral or Credit
Enhancement Credit risk exposure relating to on balance
sheet assets are as follow: SPURA: Fully secured P=300,000,000 P=300,000,000 P=− P=300,000,000 Accounts receivable: Cardholders:
Fully secured 284,250,676 284,250,676 − 284,250,676 P=584,250,676 P=584,250,676 P=− P=584,250,676
Collateral and other credit enhancements The Company has an outstanding SPURA as of December 31, 2014, which is collateralized by government securities with fair value of P=300.0 million. There were no outstanding SPURA as of December 31, 2015. The fair value of hold-out cash deposits, that serve as collateral for certain customers, approximate their carrying value due to their short-term maturities.

- 23 -
Offsetting of financial instruments The previous table also provides information on the amounts of financial instruments presented in the Company’s statement of financial position that are subject of offsetting arrangement and the related net exposure after considering the effect of remaining right of set-off that do not meet PAS 32 offsetting criteria, which are in the form of financial collaterals. The rights to set off amounts are only enforceable and exercisable in the event of default, insolvency or bankruptcy. The Company has derivative financial instruments that can be offset under enforceable master netting agreement. As December 31, 2014, all the individual CCS outstanding were assessed to be derivative assets. These CCS have all matured as of December 31, 2015. Other than the abovementioned, the Company does not have financial instruments that can be offset under enforceable master netting agreements or similar agreements.
b. Concentration risk Concentrations arise when a number of counterparties belong to a group controlled by a family or a conglomerate or are engaged in similar business activities or activities in the same geographical region, or have some similar economic, political, or other conditions. Concentrations indicate the relative sensitivity of the Company’s performance to developments affecting a particular industry or geographical location. While concentration of credit risks are inherent in the Company’s business and cannot be totally eliminated, they are limited and reduced through the Company’s risk control and diversification strategies. Safeguarding against credit risk concentrations is an important component of the Company’s risk management system. The BOD is responsible for establishing and monitoring compliance with policies governing large exposures and credit risk concentrations of the Company. The BOD reviews these policies regularly (at least annually) to ensure that they remain adequate and appropriate for the Company. Subsequent changes to the established policies are approved by the BOD.
Concentration of risks of financial assets with credit risk exposure An analysis of concentration of risk at the statement of financial position date based on the carrying amount of financial instruments is shown below:
2015
Loans and Receivables
Loans and Advances to
Banks* AFS
Investments Others** Total Concentration by industry:
Personal activities P=44,974,383,238 P=− P=− P=97,964,161,289 P=142,938,544,527 Philippine government − 7,636,375,790 − − 7,636,375,790 Financial intermediaries 101,762,935 1,040,427,796 4,980,480 12,022,966 1,159,194,177 Transport, storage and communications − − 698,000 − 698,000
45,076,146,173 8,676,803,586 5,678,480 97,976,184,255 151,734,812,494
Unearned interest and other deferred income (1,958,420,546) − − − (1,958,420,546) Allowance for credit losses (1,696,448,367) − − − (1,696,448,367)
P=41,421,277,260 P=8,676,803,586 P=5,678,480 P=97,976,184,255 P=148,079,943,581
(Forward)

- 24 -
2015
Loans and Receivables
Loans and Advances to
Banks* AFS
Investments Others** Total Concentration by location: Metro Manila P=21,950,016,279 P=8,676,803,586 P=5,678,480 P=47,716,077,496 P=78,348,575,841 Luzon (except Metro Manila) 14,446,478,069 – – 31,396,586,172 45,843,064,241 Visayas 4,320,403,525 – – 9,389,549,544 13,709,953,069 Mindanao 4,359,248,300 – – 9,473,971,043 13,833,219,343
45,076,146,173 8,676,803,586 5,678,480 97,976,184,255 151,734,812,494
Unearned interest and other deferred income (1,958,420,546) − − − (1,958,420,546) Allowance for credit losses (1,696,448,367) − − − (1,696,448,367)
P=41,421,277,260 P=8,676,803,586 P=5,678,480 P=97,976,184,255 P=148,079,943,581
* Comprised of Cash and cash equivalents, excluding cash on hand amounting to P=72,500 ** Comprised of Commitments and contingencies and refundable deposits
2014
Loans and Receivables
Loans and Advances to
Banks*
Trading and Investment
Securities** Others*** Total Concentration by industry:
Personal activities P=41,044,308,941 P=– P=– P=85,552,455,940 P=126,596,764,881 Philippine government – 7,385,597,520 – – 7,385,597,520 Financial intermediaries 45,686,218 2,471,659,975 15,578,785 11,984,091 2,544,909,069 Transport, storage and
communications – – 698,000 – 698,000 41,089,995,159 9,857,257,495 16,276,785 85,564,440,031 136,527,969,470 Unearned interest and other
deferred income (1,687,470,070) – – – (1,687,470,070) Allowance for credit losses (1,652,131,097) – – – (1,652,131,097) P=37,750,393,992 P=9,857,257,495 P=16,276,785 P=85,564,440,031 P=133,188,368,303 Concentration by location:
Metro Manila P=20,317,161,897 P=9,857,257,495 P=16,276,785 P=42,313,841,059 P=72,504,537,236 Luzon (except Metro Manila) 12,860,122,946 – – 26,775,741,819 39,635,864,765 Visayas 4,106,713,362 – – 8,550,485,650 12,657,199,012 Mindanao 3,805,996,954 – – 7,924,371,503 11,730,368,457
41,089,995,159 9,857,257,495 16,276,785 85,564,440,031 136,527,969,470
Unearned interest and other deferred income (1,687,470,070) – – – (1,687,470,070)
Allowance for credit losses (1,652,131,097) – – – (1,652,131,097) P=37,750,393,992 P=9,857,257,495 P=16,276,785 P=85,564,440,031 P=133,188,368,303
* Comprised of Cash and cash equivalents, excluding cash on hand amounting to P=72,500 ** Comprised of Derivative asset and AFS investments *** Comprised of Commitments and contingencies and refundable deposits
c. Credit quality of financial assets Loans and receivables The Company classifies and measures the quality of its receivables from cardholders by number of days past due as follows: i. Neither past due nor impaired
Receivables from cardholders where principal payments or contractual interests are current as of reporting date, but with historical past due incidence of up to 179 days.
ii. Past due but not impaired Receivables from cardholders where principal payments or contractual interests are 1 to 89 days past due as of reporting date, but the Company believes that impairment is not appropriate based on the cash flows of the available collateral or status of collection of the amounts due to the Company.
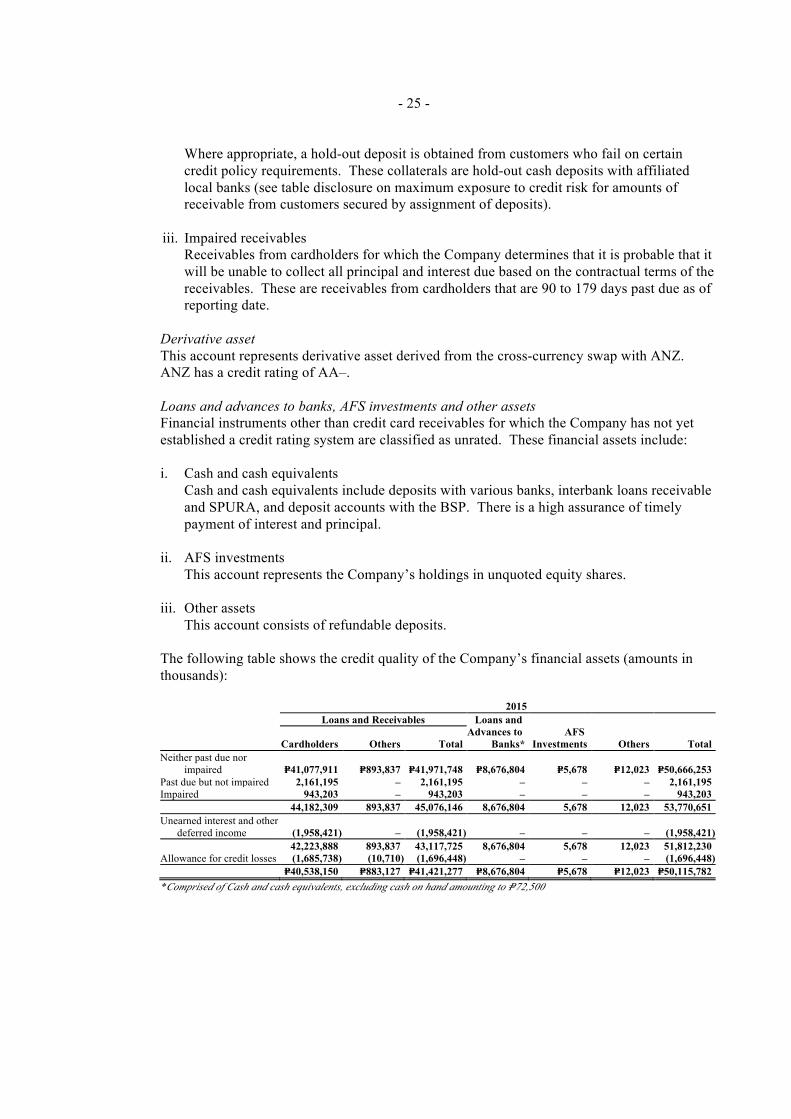
- 25 -
Where appropriate, a hold-out deposit is obtained from customers who fail on certain credit policy requirements. These collaterals are hold-out cash deposits with affiliated local banks (see table disclosure on maximum exposure to credit risk for amounts of receivable from customers secured by assignment of deposits).
iii. Impaired receivables Receivables from cardholders for which the Company determines that it is probable that it will be unable to collect all principal and interest due based on the contractual terms of the receivables. These are receivables from cardholders that are 90 to 179 days past due as of reporting date.
Derivative asset This account represents derivative asset derived from the cross-currency swap with ANZ. ANZ has a credit rating of AA–.
Loans and advances to banks, AFS investments and other assets Financial instruments other than credit card receivables for which the Company has not yet established a credit rating system are classified as unrated. These financial assets include:
i. Cash and cash equivalents
Cash and cash equivalents include deposits with various banks, interbank loans receivable and SPURA, and deposit accounts with the BSP. There is a high assurance of timely payment of interest and principal.
ii. AFS investments
This account represents the Company’s holdings in unquoted equity shares. iii. Other assets
This account consists of refundable deposits.
The following table shows the credit quality of the Company’s financial assets (amounts in thousands):
2015
Loans and Receivables Loans and
Advances to Banks*
AFS Investments Others Total
Cardholders Others Total
Neither past due nor impaired P=41,077,911 P=893,837 P=41,971,748 P=8,676,804 P=5,678 P=12,023 P=50,666,253 Past due but not impaired 2,161,195 – 2,161,195 – – – 2,161,195 Impaired 943,203 – 943,203 – – – 943,203
44,182,309 893,837 45,076,146 8,676,804 5,678 12,023 53,770,651
Unearned interest and other deferred income (1,958,421) – (1,958,421) – – – (1,958,421)
42,223,888 893,837 43,117,725 8,676,804 5,678 12,023 51,812,230
Allowance for credit losses (1,685,738) (10,710) (1,696,448) – – – (1,696,448)
P=40,538,150 P=883,127 P=41,421,277 P=8,676,804 P=5,678 P=12,023 P=50,115,782
* Comprised of Cash and cash equivalents, excluding cash on hand amounting to P=72,500

- 26 -
2014
Loans and Receivables Loans and
Advances to Banks*
AFS Investments Others* Total Cardholders Others Total
Neither past due nor impaired P=37,161,383 P=699,440 P=37,860,823 P=9,857,257 P=5,678 P=11,984 P=47,735,742 Past due but not impaired 2,391,496 – 2,391,496 – – – 2,391,496 Impaired 837,676 – 837,676 – – – 837,676 40,390,555 699,440 41,089,995 9,857,257 5,678 11,984 50,964,914 Unearned interest and other deferred income (1,687,470) – (1,687,470) – – – (1,687,470)
38,703,085 699,440 39,402,525 9,857,257 5,678 11,984 49,277,444
Allowance for credit losses (1,645,401) (6,730) (1,652,131) – – – (1,652,131) P=37,057,684 P=692,710 P=37,750,394 P=9,857,257 P=5,678 P=11,984 P=47,625,313 * Comprised of Cash and cash equivalents, excluding cash on hand amounting to P=72,500 The table below shows the credit quality of neither past due nor impaired accounts receivable from cardholders based on historical past due incidence.
2015 2014
Amount Percentage Amount Percentage
Current and never past due P=38,123,766 92.8% P=34,714,159 93.4% Balances of accounts with 1 to 29 days
past due history 2,287,021 5.6 1,930,168 5.2 Balances of accounts with 30 to 59 days
past due history 422,885 1.0 300,936 0.8 Balances of accounts with 60 to 89 days
past due history 154,154 0.4 133,008 0.4 Balances of accounts with 90 days and up
past due history 90,085 0.2 83,112 0.2
P=41,077,911 100.0% P=37,161,383 100.0%
The aging analysis of past due but not impaired accounts receivable from cardholders is shown below.
2015 2014
Amount Percentage Amount Percentage
1 to 29 days P=1,122,709 51.9% P=1,369,906 57.3% 30 to 59 days 565,674 26.2 565,478 23.6 60 to 89 days 472,812 21.9 456,112 19.1
P=2,161,195 100.0% P=2,391,496 100.0%
Fair value of collateral Of the total aggregate amount of gross past due but not impaired loans, the fair value of collateral held as of December 31, 2015 and 2014, amounted to P=7.0 million and P=7.7 million, respectively. These collaterals obtained from credit cardholders are hold-out cash deposits with affiliated local banks. The fair value of these cash deposits approximate their carrying value due to their short-term maturities.
Market Risk Market risk is the risk to earnings or capital arising from adverse movements in factors that affect the market value of financial instruments. The Company focuses on two market risk areas, which are interest rate risk and foreign currency risk.
a. Interest rate risk
Interest rate risk is the risk that changes in market interest rates will reduce current or future earnings and/or the economic value. The Company’s borrowings consist of a mix of fixed rate

- 27 -
notes and monthly repriceable loans, in order to ensure that any adverse effects of interest rate fluctuations are minimized.
The Treasury unit is primarily responsible in managing the liquidity, as well as, the interest rate risk of the Company. They ensure borrowings from various sources of funds are availed at the cheapest possible cost at acceptable terms. In measuring interest rate risk, the Company employs gap analysis wherein an interest rate gap report is prepared by breaking down the statements of financial position accounts according to their contractual maturities or repricing dates, whichever is applicable. The difference in the amount of assets and liabilities maturing or being repriced in any pre-specified time band would be treated as an indicator of the Company’s exposure to the risk of potential changes in net interest income.
Another interest rate risk area where the Company has exposures is on the effect of future changes in the prevailing level of interest rates on its fixed and floating interest rate-financial instruments. The following table sets out the carrying amount by maturity of the Company’s financial instruments that are exposed to interest rate risk:
2014
Not more than 1 year
Beyond 1 year Total
Cross-currency swap: Floating receive leg P=447,200,000 P=– P=447,200,000
Fixed payment leg (432,700,000) – (432,700,000)
As of December 31, 2015, the Cross-Currency Swap (CCS) instrument matured and was paid out by the Company. A funding policy guides the Company’s management in determining appropriate levels of term funding that addresses, among other things, interest rate risk, maturity concentration and funding diversification. The following tables demonstrate the sensitivity to a reasonably possible change in interest rates, with all other variables held constant, of the Company’s income before income tax (amounts in millions):
2015 Changes in interest rates (in basis points) (100) (50) 100 50
Change in income before income tax P=238.5 P=119.3 (P=238.5) (P=119.3) As percentage of the Company’s
income before income tax 6.2% 3.1% (6.2%) (3.1%)
2014
Changes in interest rates (in basis points) (100) (50) 100 50
Change in income before income tax P=208.3 P=104.2 (P=208.3) (P=104.2) As percentage of the Company’s
income before income tax 5.7% 2.9% (5.7%) (2.9%)
This sensitivity analysis is performed for risk management purposes and assumes no other changes in the repricing structure and loan volumes. Actual changes in net income will vary from the model.
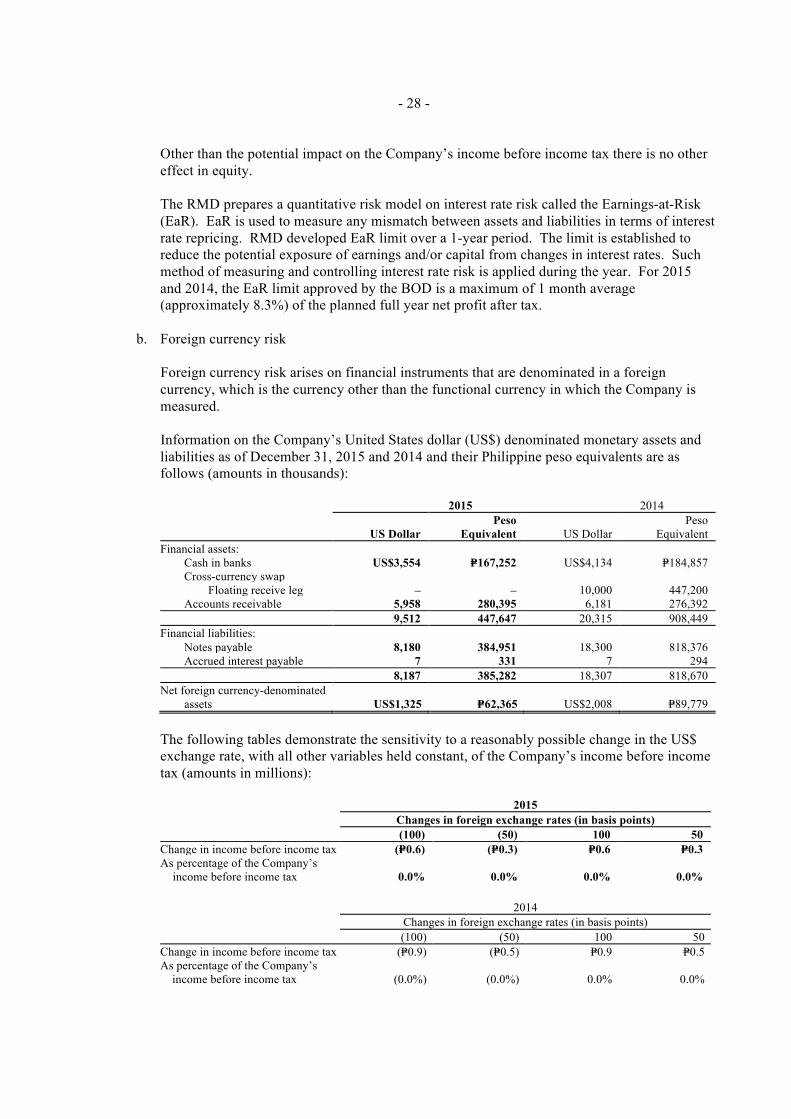
- 28 -
Other than the potential impact on the Company’s income before income tax there is no other effect in equity. The RMD prepares a quantitative risk model on interest rate risk called the Earnings-at-Risk (EaR). EaR is used to measure any mismatch between assets and liabilities in terms of interest rate repricing. RMD developed EaR limit over a 1-year period. The limit is established to reduce the potential exposure of earnings and/or capital from changes in interest rates. Such method of measuring and controlling interest rate risk is applied during the year. For 2015 and 2014, the EaR limit approved by the BOD is a maximum of 1 month average (approximately 8.3%) of the planned full year net profit after tax.
b. Foreign currency risk
Foreign currency risk arises on financial instruments that are denominated in a foreign currency, which is the currency other than the functional currency in which the Company is measured.
Information on the Company’s United States dollar (US$) denominated monetary assets and liabilities as of December 31, 2015 and 2014 and their Philippine peso equivalents are as follows (amounts in thousands):
2015 2014
US Dollar
Peso Equivalent US Dollar
Peso Equivalent
Financial assets: Cash in banks US$3,554 P=167,252 US$4,134 P=184,857
Cross-currency swap Floating receive leg – – 10,000 447,200
Accounts receivable 5,958 280,395 6,181 276,392
9,512 447,647 20,315 908,449
Financial liabilities: Notes payable 8,180 384,951 18,300 818,376
Accrued interest payable 7 331 7 294
8,187 385,282 18,307 818,670
Net foreign currency-denominated assets US$1,325 P=62,365 US$2,008 P=89,779
The following tables demonstrate the sensitivity to a reasonably possible change in the US$ exchange rate, with all other variables held constant, of the Company’s income before income tax (amounts in millions):
2015 Changes in foreign exchange rates (in basis points) (100) (50) 100 50
Change in income before income tax (P=0.6) (P=0.3) P=0.6 P=0.3 As percentage of the Company’s
income before income tax 0.0% 0.0% 0.0% 0.0%
2014 Changes in foreign exchange rates (in basis points) (100) (50) 100 50 Change in income before income tax (P=0.9) (P=0.5) P=0.9 P=0.5 As percentage of the Company’s
income before income tax (0.0%) (0.0%) 0.0% 0.0%

- 29 -
Liquidity Risk and Funding Management Liquidity and funding management is the ability of the Company to meet financial obligations as they fall due. Liquidity risk is the current and prospective risk to earnings or capital arising from the Company’s inability to meet its financial obligations as they fall due.
Liquidity and funding management involves setting a strategy, ensuring effective board and senior management oversight, as well as operating under a sound process for measuring, monitoring and controlling liquidity risk. It requires the Company not only to measure its liquidity position on an ongoing basis but also to examine how funding requirements are likely to evolve under various scenarios, including adverse conditions.
A strong liquidity management system in particular is characterized by an effective analysis of net funding requirements under alternative scenarios and diversification of funding sources. The Company is continuously working on developing diversified funding sources to support its asset growth, as well as to minimize liquidity and interest rate risks.
The Treasury unit, on a daily basis, monitors the cash position of the Company. They ensure that the Company has ample liquidity to settle financial obligations that are due as of a given period. The Treasury unit employs various liquidity or funding tools to determine the expected funding requirements for a particular period. The RMD prepares the monthly Maximum Cumulative Outflow (MCO) report to measure the liquidity mismatch risk as of a given period. The MCO report provides quantitative information on the potential liquidity risk exposure based on pre-specified time bands. The Company has established MCO limit to aid in controlling liquidity risk. The positive and negative MCO limit of P=6.64 billion corresponds to 80.0% of the total wholesale borrowing limit less utilized borrowing limit. Aside from the MCO report, the RMD also prepares monthly Liquidity Stress testing to augment in measuring potential liquidity risk exposures under different stress scenarios.
The table below shows the MCO report of the Company as of December 31, 2015 and 2014 (amounts in millions):
2015
Up to 1 month
1 to 2 months
2 to 3 months
3 to 6 months
6 to 12 months
Beyond 1 year Total
Assets P=14,697 P=4,262 P=3,498 P=7,451 P=6,718 P=13,751 P=50,377 Liabilities 12,420 4,895 2,338 7,474 4,930 12,420 44,477 Off-Balance Sheet Position − − − − − − − Periodic Gap P=2,277 (P=633) P=1,160 (P=23) P=1,788 P=1,331 P=5,900 Cumulative Gap P=2,277 P=1,644 P=2,804 P=2,781 P=4,569 P=5,900
2014
Up to 1 month
1 to 2 months
2 to 3 months
3 to 6 months
6 to 12 months
Beyond 1 year Total
Assets P=15,285 P=3,091 P=3,205 P=6,751 P=6,114 P=12,605 P=47,051 Liabilities 15,992 3,111 2,096 5,834 4,734 10,582 42,349 Off-Balance Sheet Position − − (6) (6) (12) − (24) Periodic Gap (P=707) (P=20) P=1,103 P=911 P=1,368 P=2,023 P=4,678 Cumulative Gap (P=707) (P=727) P=376 P=1,287 P=2,655 P=4,678

- 30 -
The tables below summarize the maturity profile of the undiscounted remaining contractual maturities of the Company’s financial assets and liabilities as of December 31, 2015 and 2014 (amounts in thousands). As of December 31, 2014, derivative assets are shown by maturity, based on their contractual undiscounted repayment obligations.
2015
Up to 1 to 3 3 to 6 6 to 12 Beyond Total 1 Month Months Months Months 1 Year
Financial Assets Cash and cash equivalents P=1,040,666 P=– P=– P=– P=– P=1,040,666
Due from BSP 7,636,376 – – – – 7,636,376 Accounts receivable:
Cardholders 10,142,508 17,329,280 2,276,761 6,043,598 8,692,941 44,485,088 Others 893,837 – – – – 893,837
19,713,387 17,329,280 2,276,761 6,043,598 8,692,941 54,055,967
Financial Liabilities Accounts payable: Merchants 1,342,622 – – – – 1,342,622
Others 324,445 – – – – 324,445
1,667,067 – – – – 1,667,067
Bills payable 1,321,724 4,765,208 10,168,584 2,392,235 5,753,741 24,401,492 Notes payable 2,452,559 1,904,481 3,378,813 2,652,229 5,906,317 16,294,399 Subordinated debt – 18,164 36,329 72,657 1,621,691 1,748,841 Accrued interest and other expenses: Accrued interest payable 28,763 37,030 35,458 22,960 66,994 191,205 Accrued advertising 70,285 – – – – 70,285 Accrued rewards 27,142 – – – – 27,142 Accrued other expenses 370,627 – – – – 370,627
5,938,167 6,724,883 13,619,184 5,140,081 13,348,743 44,771,058
Net undiscounted financial assets (liabilities) P=13,775,220 P=10,604,397 (P=11,342,423) P=903,517 (P=4,655,802) P=9,284,909
2014
Up to 1 Month
1 to 3 Months
3 to 6 Months
6 to 12 Months
Beyond 1 Year Total
Financial Assets Cash and cash equivalents P=1,834,327 P=– P=– P=– P=– P=1,834,327
Due from BSP 7,085,598 – – – – 7,085,598 Interbank loans receivable and SPURA 939,917 – – – – 939,917 Derivative asset – (2,970) (3,386) 8,406 – 2,050 Accounts receivable:
Cardholders 7,429,692 18,177,778 2,286,049 5,361,230 7,296,305 40,551,054 Others 699,440 – – – – 699,440
17,988,974 18,174,808 2,282,663 5,369,636 7,296,305 51,112,386
Financial Liabilities Accounts payable:
Merchants 1,336,960 – – – – 1,336,960 Others 276,791 – – – – 276,791
1,613,751 – – – – 1,613,751
Bills payable 7,810 11,658,432 3,914,201 2,272,272 3,311,893 21,164,608 Notes payable 6,013,119 703,983 2,473,420 2,552,086 7,354,724 19,097,332 Subordinated debt – 18,164 36,329 72,657 1,694,972 1,822,122 Accrued interest and other expenses: Accrued interest payable 64,510 45,685 34,262 23,346 12,303 180,106 Accrued advertising 61,207 – – – – 61,207 Accrued rewards 23,252 – – – – 23,252 Accrued other expenses 346,122 – – – – 346,122 8,129,771 12,426,264 6,458,212 4,920,361 12,373,892 44,308,500 Net undiscounted financial assets (liabilities) P=9,859,203 P=5,748,544 (P=4,175,549) P=449,275 (P=5,077,587) P=6,803,886 Gross-settled Derivatives
Cross-currency swap: Floating receive leg P=– P=2,205 P=2,641 P=20,394 P=– P=25,240
Fixed payment leg – (5,175) (6,027) (11,988) – (23,190) P=– (P=2,970) (P=3,386) P=8,406 P=– P=2,050

- 31 -
a. Liquidity risk management and control As part of a sound liquidity risk management process and at the same time, to adhere to its policy that is, to maintain adequate liquidity at all times, the Company has established liquidity risk limits. These limits are used to control the risk emanating from the funding activities of the Company. These limits are recommended by the RMD, in coordination with Treasury unit, reviewed and approved by ALCO and BOD through RMC. These limits are reviewed periodically, at least annually, to assess its suitability and reasonableness given the current market and economic conditions.
Below are the current Liquidity Risk Limits utilized by the Company.
MCO limit 80.0% of aggregate Wholesale Borrowing Limit (WBL) net of unutilized WBL
Current Ratio 1:1
Debt to Equity Ratio 7.5:1
Commitment Guidelines Less than or equal to 10.0% of the aggregate available credit limits granted to its cardholder
Reserve Requirements mandated by the BSP
20.0% of total deposit substitutes (liabilities)
Actual figures are compared with the above liquidity risk limits and any breaches are immediately escalated or reported to the head of Treasury and CFO, as well as, to the ALCO. The Treasury Unit will explain or justify any breaches and likewise recommend corrective measures within a specified period. Aside from the established limits mentioned above, the Company has also adopted a Contingency Funding Plan (CFP) for handling liquidity crisis. The CFP outlines the policies and procedures that shall be followed at the onset, during and after the liquidity crisis. It also provides information on the types of events that may trigger to activate the plan, the roles and responsibilities of members of the crisis management team and critical business units, sources of contingency funds, and communication plan. The CFP helps the Company to ensure sufficient liquidity is maintained even in times of liquidity crisis. The CFP is reviewed and, if necessary, updated annually.
The Company has various credit line and IBCL facilities that it can access to meet liquidity needs. Access to sources of funding is sufficiently available and debt maturing within 12 months may be rolled over with existing lenders. As of December 31, 2015 and 2014, the Company has available credit and IBCL lines amounting to P=11.9 billion and P=14.0 billion, respectively.

- 32 -
Liquidity Stress Testing The Company also employs different stress scenarios in evaluating the liquidity position as of a given cut-off date. Stress scenarios applied involves the following stress assumptions and parameters:
a. level of pre-termination of retail promissory notes; b. significant decrease in the payment levels of cardholders due to increase in delinquencies;
and c. decrease in the level of funding access from wholesale market. Analysis of the resulting gaps serves as an additional tool in managing exposure in case a liquidity stress scenario should happen. Stress testing report is also prepared monthly by RMD in addition to the MCO reports and liquidity ratios.
Below are the Stress Scenarios currently being employed by Risk Management.
a. 25.0% of Retail PN holders (MD> 30 days) pre-terminates; 25.0% of WBL from
other banks not accessible. PDR increases to 12.0% at end of 1 year, resulting to decrease in monthly collections
b. 50.0% of Retail PN holders (MD> 30 days) pre-terminates; 50.0% of WBL from other banks not accessible. PDR increases to 16.0% at end of 1 year, resulting to decrease in monthly collections
c. 75.0% of Retail PN holders (MD> 30 days) pre-terminates; 75.0% of WBL from other banks not accessible. PDR increases to > 16.0% at end of 1 year, resulting to decrease in monthly collections
b. Risk management for derivatives transaction
The Company entered into CCS wherein the objectives of the Company are to secure cheaper debts and (as a hedging technique) to minimize risk exposures to foreign exchange and interest rate fluctuations arising from foreign currency denominated borrowings. As a result, derivative asset or liability are being recognized and recorded by the Company in its books. Every month, fair market values of outstanding CCS transactions are being calculated and any changes arising from such valuation are recognized by effecting appropriate adjustments. Consequently, derivative asset or liability account (whichever is applicable) are adjusted to reflect the current fair market value as of a given period. Regular retrospective and prospective testing is being conducted by RMD to assess and measure the hedge effectiveness of such derivatives undertakings. Accordingly, the hedge is considered highly effective if the range of cumulative change of the actual derivative against the hypothetical derivative is within 80%-125%.
- 33 -
Capital Management Capital management pertains to utilizing efficient processes and or measures to ensure adequate capital is maintained at all times.
The Company’s capital management objectives are: • to maintain sufficient capital, at all times, to meet the minimum regulatory capital
requirements set by the BSP; • to maintain adequate capital that will support the Company’s business growth; • to maintain an adequate capital buffer, at all times, to cover for risk from potential stress
events and to attain the desired internal capital adequacy ratio; and • to ensure that the Company meets the debt to equity ratio as required in the Omnibus Notes
Facility Agreement. As a financial institution, the Company is required to meet the minimum capital adequacy ratio and maintain adequate capital commensurate to the risk of its business and operations. Accordingly, the Company should likewise be adequately capitalized to enable it to effectively discharge its functions and withstand any foreseeable problems. In addition, as one of the principal objectives of supervision is the protection of cardholders and creditors, banking regulators monitor the adequacy of capital of the Company to ensure that capital recognized in capital adequacy measures is readily available for those creditors. The BOD ensures that the above objectives are met by the Company in any given time while the management ensures BOD-approved capital management policies are adhered to. Regulatory qualifying capital Under existing BSP regulations, the determination of the Company’s compliance with regulatory requirements and ratios is based on the amount of the Company’s ‘unimpaired capital’ (regulatory net worth) as reported to the BSP, which is determined on the basis of regulatory accounting policies which differ from PFRS in some respects.
In addition, the risk-based capital adequacy ratio (CAR) of the Company with quasi-banking operations, expressed as a percentage of qualifying capital to risk-weighted assets, should not be less than 10.0%. Qualifying capital and risk-weighted assets are computed based on BSP regulations. Risk-weighted assets consist of total assets less cash on hand, amounts due from BSP, loans covered by hold-out or assignment of deposits, loans or acceptances under letters of credit to the extent covered by margin deposits and other non-risk items determined by the Monetary Board (MB) of the BSP. Under BSP Circular No. 360, effective July 1, 2003, the CAR is to be inclusive of a market risk charge. On January 15, 2013, the BSP issued Circular No. 781, Basel 3 Implementing Guidelines on Minimum Capital Requirements. The guidelines revised the risk-based capital adequacy framework and introduced other minimum capital ratios such as Common Equity Tier 1 (CET1) ratio and Tier 1 Capital ratio of 6.0% and 7.5%, respectively. A capital conservation buffer of 2.5% comprised of CET1 shall also be imposed. BSP Circular No. 781 is effective January 1, 2014.

- 34 -
The CAR of the Company as reported to BSP is shown in the table below (amounts in millions except for ratio):
2015 2014
Tier 1 capital P=6,007 P=5,776 Tier 2 capital 1,609 1,498 Gross qualifying capital P=7,616 P=7,274 Credit risk-weighted assets P=44,760 P=41,662 Operational risk-weighted assets 17,099 14,609 Total risk weighted assets P=61,859 P=56,271 Risk-based CAR 12.3% 12.9%
The regulatory qualifying capital of the Company consists of Tier 1 (core) and Tier 2 (supplementary) capital. Tier 1 capital comprise paid-up common stock, unappropriated retained earnings including current year profit, appropriated retained earnings less required deductions such as unsecured credit accommodations to directors, officers, stockholders and related interests (DOSRI). Tier 2 is composed of Fixed-Rate Unsecured Subordinated Notes (Note 17). As of December 31, 2015 and 2014, the Company met and complied with the CAR requirement set by the BSP. The issuance of BSP Circular No. 639 covering the Internal Capital Adequacy Assessment Process (ICAAP) in 2009 supplements the BSP’s risk-based capital adequacy framework under Circular No. 538. In compliance with this new circular, the Metrobank Group (the Group) has adopted and developed its ICAAP framework to ensure that appropriate level and quality of capital are maintained by the Group. Under this framework, the assessment of risks extends beyond the Pillar 1 set of credit, market and operational risks and onto other risks deemed material by the Group. The level and structure of capital are assessed and determined in light of the Group’s business environment, plans, performance, risks and budget; as well as regulatory pronouncements. The Company follows the Group’s ICAAP framework and submits the result of its assessment to the Parent Company. The BSP requires submission of an ICAAP document on a group-wide basis every January 31.
The Company maintains strong credit standings and capital ratios in order to support its business and maximize stockholder value. The Company is required to maintain a maximum debt-to-equity ratio (total liabilities over equity) of 7.5 times based on the audited financial statements as required in the Company’s Omnibus Notes Facility Agreement with various banks. Debt-to-equity ratio of the Company as of December 31, 2015 and 2014 is computed as follows (in millions, except for ratios):
2015 2014
Total Liabilities (TL) P=45,095 P=42,873 Total Equity (TE) P=7,074 P=6,581 Debt-to-Equity Ratio (TL/TE) 6.4 6.5
The Company, as a finance company, is also subject to the capital requirement under Sections 2(b) and 6(c) of Republic Act (RA) No. 8556 (The Financing Company Act of 1998). RA No. 8556 prescribes finance companies that at least forty percent (40.0%) of the voting stock of the corporation shall be owned by citizens of the Philippines and should maintain a minimum paid up capital of P=10.0 million for financing companies located in Metro Manila.

- 35 -
In case the finance company has a branch, agency extension office or unit, additional paid up capital will be required as follows:
Location of a branch, agency extension office or unit Additional capital
requirement Metro Manila and other 1st class cities P=1,000,000 Other classes of cities 500,000 Municipalities 250,000
As of December 31, 2015 and 2014, the Company is sixty percent (60.0%) owned by Metrobank, a wholly owned Filipino company. For both years, the Company has a paid up capital of P=1.0 billion which already covers the additional capital requirement for its extension office in Cebu City, Davao City and Pasay City. As of December 31, 2015 and 2014, the Company is in full compliance with the capital requirements of RA No. 8556.
Operational risk Operational risk is the risk arising from day to day operational activities which may result from inadequate or failed internal processes, people and systems or from external events, including legal and reputational risks but excludes strategic risks.
The Operating Risk Head is responsible for a) the overall management of operational risk that may pose threat to the Company’s business, profitability, reputation, customers, and staff; b) the effective operational risk management of all business initiatives, inter and intra department processes; c) the development of an appropriate risk management environment and structure for the Company; and d) the effectiveness of the areas of business continuity management and information security. The operational risk management process consists of a staged approach involving establishing the context, risk identification, risk analysis, risk management and mitigation strategies and risk monitoring and review. Establishing the context provides the Company strategic organizational context of the local business environment. This will assist in determining the appropriate resources for risk management activities, ensuring compliance with the law and enable alignment of the Company’s strategies, so the risks that present the greatest risk or impact to the Company are identified and managed effectively. Risk identification allows the Company to identify the end-to-end risks facing the business. It is important to understand operational risks relative to the area, process, business initiative, product, service or project being examined. Risks identified need to be analyzed in terms of likelihood and consequence of their occurrence. Where risks are acceptable, the Company records risk acceptance and indicates requirements for testing and monitoring of controls. Where the outcome of the risk analysis step reveals an unacceptable risk, the Company implements risk mitigation and control strategies to eliminate or minimize the risk within acceptable limits. Risk monitoring and review is the final stage of the risk assessment process where ongoing monitoring, review and reporting are done to ensure changing circumstances are managed in line with risk priorities. This includes the ongoing review of the risk management program to ensure its continued suitability, adequacy, and effectiveness.

- 36 -
5. Fair Value Measurement
The methods of assumptions used by the Company in estimating the fair value of its financial instruments are as follow:
Cash and cash equivalents (includes Cash, Due from BSP and Interbank loans receivable and SPURA) Carrying amounts approximate fair values in view of the relatively short-term maturities of these instruments. AFS investments - unquoted equity securities These are carried at cost less allowance for impairment losses due to the unpredictable nature of future cash flows and lack of suitable methods of arriving at a reliable fair value. As at December 31, 2015 and 2014, there were no impairment losses on unquoted equity securities.
Derivative instruments Fair values are estimated based on discounted cash flow technique. The Company used various observable market inputs including the credit quality of the counterparty, foreign exchange spot and forward rates, interest rate curves and forward rate curves. The Company has no derivative instruments as at December 31, 2015. As of December 31, 2014, the fair value of derivative asset positions is net of a credit valuation adjustment attributable to derivative counterparty default risk.
Accounts receivable - cardholders The fair values of accounts receivable from straight payment transactions and short-term installment approximate carrying amounts, net of allowance, while the fair values of long-term installment receivables are estimated using the discounted cash flow methodology, using current incremental lending rates for similar types of receivables.
Accounts receivable - others, other assets, accounts payable and accrued interest payable The carrying amounts, net of allowance, approximate their fair values due to either the demand feature or the relatively short-term maturities of these receivables and payables. Refundable deposits are carried at cost and are not significant to the Company’s portfolio of assets.
Bills payable, notes payable and subordinated debt The carrying value approximates fair value for borrowings with relatively short maturities. For certain borrowings which are long-term in nature, fair values are estimated using the discounted cash flow methodology, using current incremental lending rates for similar types of borrowings.
The following tables summarize the carrying amount and fair values of the financial assets and liabilities, analyzed based on the following hierarchy for determining and disclosing the fair value of financial instruments by valuation technique (amounts in thousands): • Quoted market prices in active markets for identical assets or liabilities (Level 1); • Those involving inputs other than quoted prices included in Level 1 that are observable for the
asset or liability, either directly (as prices) or indirectly (derived from prices) (Level 2); and • Those with inputs for the asset or liability that are not based on observable market data
(unobservable inputs) (Level 3).

- 37 -
2015
Carrying Value Level 1 Level 2 Level 3
Total Fair Value
Assets for which fair values are disclosed: Financial assets
Accounts receivable: Cardholders P=40,354,060 P=– P=– P=43,713,144 P=43,713,144
P=40,354,060 P=– P=– P=43,713,144 P=43,713,144
Liabilities for which fair values are disclosed: Financial liabilities
Bills payable P=23,852,085 P=– P=– P=24,369,033 P=24,369,033 Notes payable 16,011,806 – – 16,261,079 16,261,079 Subordinated debt 1,161,328 – – 1,739,693 1,739,693
P=41,025,219 P=– P=– P=42,369,805 P=42,369,805
2014
Carrying Value Level 1 Level 2 Level 3
Total Fair Value
Assets measured at fair value: Financial assets Derivative assets P=10,598 P=– P=10,598 P=– P=10,598
P=10,598 P=– P=10,598 P=– P=10,598 Assets for which fair values are disclosed:
Financial assets Accounts receivable:
Cardholders P=36,848,971 P=– P=– P=39,629,934 P=39,629,934 P=36,848,971 P=– P=– P=39,629,934 P=39,629,934 Liabilities for which fair values are disclosed: Financial liabilities
Bills payable P=20,830,606 P=– P=– P=21,165,483 P=21,165,483 Notes payable 17,162,524 – – 19,092,275 19,092,275 Subordinated debt 1,160,246 – – 1,822,570 1,822,570 P=39,153,376 P=– P=– P=42,080,328 P=42,080,328
During the years ended December 31, 2015 and 2014, there were no transfers of financial instruments between Level 1 and Level 2, and no transfer in and out of Level 3.
6. Cash and Cash Equivalents
This account consists of:
2015 2014
Cash on hand P=72,500 P=72,500 Cash in banks 1,040,427,796 832,659,975
1,040,500,296 832,732,475
Short-term deposit – 1,000,000,000
1,040,500,296 1,832,732,475
Due from BSP (Note 14) 7,636,375,790 7,085,597,520 Interbank loans receivable and SPURA – 939,000,000
P=8,676,876,086 P=9,857,329,995
Cash in banks include current and savings deposit accounts and foreign currency deposits with related parties (Note 24). In 2015 and 2014, savings account and foreign currency deposits bear annual interest rates of 0.5% and 0.1%, respectively.
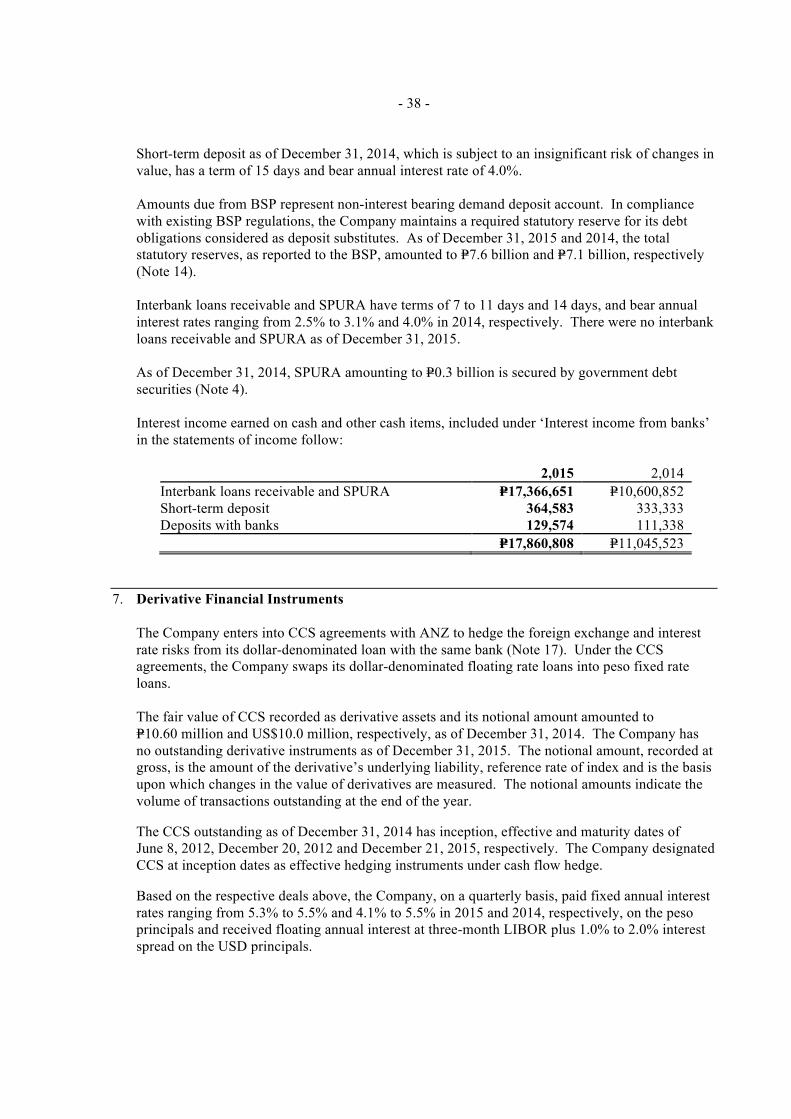
- 38 -
Short-term deposit as of December 31, 2014, which is subject to an insignificant risk of changes in value, has a term of 15 days and bear annual interest rate of 4.0%. Amounts due from BSP represent non-interest bearing demand deposit account. In compliance with existing BSP regulations, the Company maintains a required statutory reserve for its debt obligations considered as deposit substitutes. As of December 31, 2015 and 2014, the total statutory reserves, as reported to the BSP, amounted to P=7.6 billion and P=7.1 billion, respectively (Note 14). Interbank loans receivable and SPURA have terms of 7 to 11 days and 14 days, and bear annual interest rates ranging from 2.5% to 3.1% and 4.0% in 2014, respectively. There were no interbank loans receivable and SPURA as of December 31, 2015. As of December 31, 2014, SPURA amounting to P=0.3 billion is secured by government debt securities (Note 4).
Interest income earned on cash and other cash items, included under ‘Interest income from banks’ in the statements of income follow:
2,015 2,014
Interbank loans receivable and SPURA P=17,366,651 P=10,600,852 Short-term deposit 364,583 333,333 Deposits with banks 129,574 111,338
P=17,860,808 P=11,045,523
7. Derivative Financial Instruments
The Company enters into CCS agreements with ANZ to hedge the foreign exchange and interest rate risks from its dollar-denominated loan with the same bank (Note 17). Under the CCS agreements, the Company swaps its dollar-denominated floating rate loans into peso fixed rate loans.
The fair value of CCS recorded as derivative assets and its notional amount amounted to P=10.60 million and US$10.0 million, respectively, as of December 31, 2014. The Company has no outstanding derivative instruments as of December 31, 2015. The notional amount, recorded at gross, is the amount of the derivative’s underlying liability, reference rate of index and is the basis upon which changes in the value of derivatives are measured. The notional amounts indicate the volume of transactions outstanding at the end of the year. The CCS outstanding as of December 31, 2014 has inception, effective and maturity dates of June 8, 2012, December 20, 2012 and December 21, 2015, respectively. The Company designated CCS at inception dates as effective hedging instruments under cash flow hedge. Based on the respective deals above, the Company, on a quarterly basis, paid fixed annual interest rates ranging from 5.3% to 5.5% and 4.1% to 5.5% in 2015 and 2014, respectively, on the peso principals and received floating annual interest at three-month LIBOR plus 1.0% to 2.0% interest spread on the USD principals.

- 39 -
Cash Flow Hedges Below is the schedule as at December 31, 2014, of the periods when the hedged cash flows are expected to occur and when they are expected to affect profit or loss:
2014
Within 1 year 1 to 2 years
Cash inflow (asset) P=455,980,746 P=− Cash outflows (liability) (445,382,441) − Net cash flow P=10,598,305 P=−
The Company has no outstanding cash flow hedge as of December 31, 2015 as the CCS transaction matured and was paid on December 21, 2015. Hedge Effectiveness Results As of December 31, 2014, the Company had assessed the hedge relationship of the swaps and the hedged loans as highly effective. The effective fair value changes on the swaps that were deferred in equity under ‘Net unrealized loss on cash flow hedge’ as of December 31, 2014 amounted to P=2.7 million. No hedge ineffectiveness was recognized in profit or loss in 2014. The distinction of the results of hedge accounting into “Effective” or “Ineffective” represents designations based on PAS 39 and is not necessarily reflective of the economic effectiveness of the instruments. Net Unrealized Loss on Cash Flow Hedge As of December 31, 2015 and 2014, the movements in net unrealized loss on cash flow hedge consist of:
2015 2014 Balance at beginning of year (P=2,731,185) (P=17,735,018) Changes in fair value of derivatives taken
to profit or loss 3,901,693 24,100,000 Changes in deferred tax due to fair value change of derivatives (Note 23) (1,170,508) (6,430,212) Amount deferred to OCI − (2,665,955) Balance at end of year P=− (P=2,731,185)
Rollforward of Derivatives The table below summarizes the net movement in fair values of the Company’s derivatives as of December 31, 2015 and 2014:
2015 2014
Balance at beginning of year P=10,598,305 P=13,264,260 Changes in fair value of derivatives designated
3,901,693 24,100,000 as accounting hedges Settled transactions * (14,499,998) (26,765,955)
(10,598,305) (2,665,955)
Balance at end of year P=− P=10,598,305 *Includes foreign exchange gain and cross-currency swap cost presented under ‘Interest expense’ in the statements of income

- 40 -
8. AFS Investments
As of December 31, 2015 and 2014, AFS investments comprised of unquoted equity securities representing holdings in credit union and preferred shares amounting to P=5.7 million. On February 6, 2014, the Company sold its investment in quoted equity securities amounting to P=447.1 million representing Visa shares. The sale resulted in a gain of P=328.2 million (Note 20).
9. Accounts Receivable
This account consists of receivables from:
2015 2014
Cardholders P=44,008,929,191 P=40,188,572,095 Others (Note 24) 893,836,794 699,440,120
44,902,765,985 40,888,012,215
Deferred acquisition cost 173,380,188 201,982,944 Unearned interest and other deferred income (1,958,420,546) (1,687,470,070)
43,117,725,627 39,402,525,089
Allowance for credit losses (Note 12) (1,696,448,367) (1,652,131,097)
P=41,421,277,260 P=37,750,393,992
Total accounts receivable as shown in the statements of financial position follow:
2015 2014
Current portion P=36,086,922,602 P=32,531,944,458 Non-current portion 5,334,354,658 5,218,449,534
P=41,421,277,260 P=37,750,393,992
As of December 31, 2015 and 2014, the Company has outstanding installment credit card receivables and unearned interest income amounting to P=17.9 billion and P=15.7 billion and P=2.0 billion and P=1.7 billion, respectively.
The Company recognized interest income from regular and installment credit card receivables amounting to P=5.8 billion and P=2.7 billion in 2015, respectively, and P=5.3 billion and P=2.3 billion in 2014, respectively. Credit card receivables include past due accounts amounting to P=3.1 billion and P=3.2 billion as of December 31, 2015 and 2014, respectively. There were no unearned interest income from accounts that are past due for over 90 days. Deferred acquisition cost represents capitalized commissions paid to third-party brokers for successfully originated credit card accounts. Others include accrued interest receivables, advances to officers and employees and receivables from Metrobank (Note 24).
BSP Reporting The BSP considers that loan concentration of credit risk exists when the total loan exposure to a particular industry or economic sector exceeds 30.0% of total loan portfolio. As of December 31, 2015 and 2014, 99.9% of the Company’s accounts receivable are classified under personal activities.

- 41 -
As of December 31, 2015 and 2014, nonperforming loans (NPLs) not fully covered by allowance for credit losses follow:
2015 2014
Total NPLs P=943,203,463 P=837,675,769 Less NPLs fully covered by allowance
for credit losses 878,267 879,267
P=942,325,196 P=836,796,502
NPLs are classified as impaired and refer to loans or receivables whose principal and/or interest is unpaid for 90 days or more after due date.

42 10. Property and E
quipment
The components of and m
ovements in this account are as follow
s:
2015
L
and B
uilding B
uilding Im
provements
Furniture, Fixtures and E
quipment
Transportation
Equipm
ent L
easehold Im
provements
Total
Cost
B
alances at beginning of year P=283,410,974
P=222,745,925 P=110,135,145
P=287,595,320 P=213,410,634
P=71,781,992 P=1,189,079,990
Acquisitions
− −
7,673,767 66,761,498
43,240,123 1,643,179
119,318,567 D
isposals −
− −
(25,105,900) (47,698,442)
− (72,804,342)
Balances at end of year
283,410,974 222,745,925
117,808,912 329,250,918
208,952,315 73,425,171
1,235,594,215 A
ccumulated D
epreciation and Am
ortization
Balances at beginning of year
− 51,305,123
91,837,615 234,706,637
97,788,776 40,146,773
515,784,924 R
eclassifications −
− 477,532
(563,446) 64,633
21,281 −
Depreciation and am
ortization −
7,424,863 7,248,322
32,713,608 38,246,765
14,838,808 100,472,366
Disposals
− −
− (21,290,826)
(33,548,397) −
(54,839,223) B
alances at end of year −
58,729,986 99,563,469
245,565,973 102,551,777
55,006,862 561,418,067
Net B
ook Value at E
nd of Year
P=283,410,974 P=164,015,939
P=18,245,443 P=83,684,945
P=106,400,538 P=18,418,309
P=674,176,148
2014
Land
Building
Building
Improvem
ents Furniture, Fixtures
and Equipment
Transportation Equipm
ent Leasehold
Improvem
ents Total
Cost
B
alances at beginning of year P=283,410,974
P=222,745,925 P=98,368,108
P=298,133,826 P=174,319,467
P=70,074,487 P=1,147,052,787
Acquisitions
− −
11,767,037 15,672,336
62,019,846 1,707,505
91,166,724 D
isposals −
− −
(26,210,842) (22,928,679)
− (49,139,521)
Balances at end of year
283,410,974 222,745,925
110,135,145 287,595,320
213,410,634 71,781,992
1,189,079,990 A
ccumulated D
epreciation and Am
ortization
Balances at beginning of year
− 43,880,259
81,810,891 239,342,378
77,781,224 25,270,180
468,084,932 D
epreciation and amortization
− 7,424,864
10,026,724 21,061,826
35,756,713 14,876,593
89,146,720 D
isposals −
− −
(25,697,567) (15,749,161)
− (41,446,728)
Balances at end of year
− 51,305,123
91,837,615 234,706,637
97,788,776 40,146,773
515,784,924 N
et Book V
alue at End of Y
ear P=283,410,974
P=171,440,802 P=18,297,530
P=52,888,683 P=115,621,858
P=31,635,219 P=673,295,066
A
s of Decem
ber 31, 2015 and 2014, the Com
pany has fully depreciated property and equipment that are still in use w
ith original cost amounting to P=190.9 m
illion and P=182.4 m
illion, respectively. Gain on sale of properties am
ounted to P=0.3 million and P=0.7 m
illion in 2015 and 2014, respectively (Note 20).

43
11. Intangibles and Other Assets
This account consists of:
2015 2014 Intangible assets P=418,346,801 P=276,388,106 Refundable deposits 12,022,966 11,984,091 Miscellaneous 13,553,625 12,493,863
P=443,923,392 P=300,866,060 The composition of and movements of intangible assets are as follows:
2015
Capitalized Software and
License Fees Project in
Progress Total Cost
Balances at beginning of year P=305,615,513 P=162,852,685 P=468,468,198 Acquisitions 27,564,698 174,001,782 201,566,480 Reclassifications 32,803,280 (32,803,280) – Write-offs (201,263) – (201,263) Balance at end of year 365,782,228 304,051,187 669,833,415 Accumulated Amortization
Balances at beginning of year 192,080,092 – 192,080,092 Amortization 59,607,785 – 59,607,785 Write-offs (201,263) – (201,263) Balances at end of year 251,486,614 – 251,486,614 Net Book Value at End of Year P=114,295,614 P=304,051,187 P=418,346,801
2014
Capitalized Software and License Fees
Project in Progress Total
Cost Balances at beginning of year P=527,876,540 P=54,006,283 P=581,882,823
Acquisitions 17,438,458 139,767,356 157,205,814 Reclassifications 30,920,954 (30,920,954) – Write-offs (270,620,439) – (270,620,439) Balance at end of year 305,615,513 162,852,685 468,468,198 Accumulated Amortization
Balances at beginning of year 390,817,844 – 390,817,844 Amortization 71,882,687 – 71,882,687 Write-offs (270,620,439) – (270,620,439) Balances at end of year 192,080,092 – 192,080,092 Net Book Value at End of Year P=113,535,421 P=162,852,685 P=276,388,106
Capitalized software and license fees Capitalized software includes costs related to software purchased by the Company for use in operations. License fees represent the amount paid for the privilege to use software modules and manuals. As of December 31, 2014, the Company derecognized software license related to its former credit card system with original cost of P=270.6 million. Management assessed that there are no future economic benefits expected from the use or disposal of its former credit card system, which have been fully amortized as of December 31, 2011.
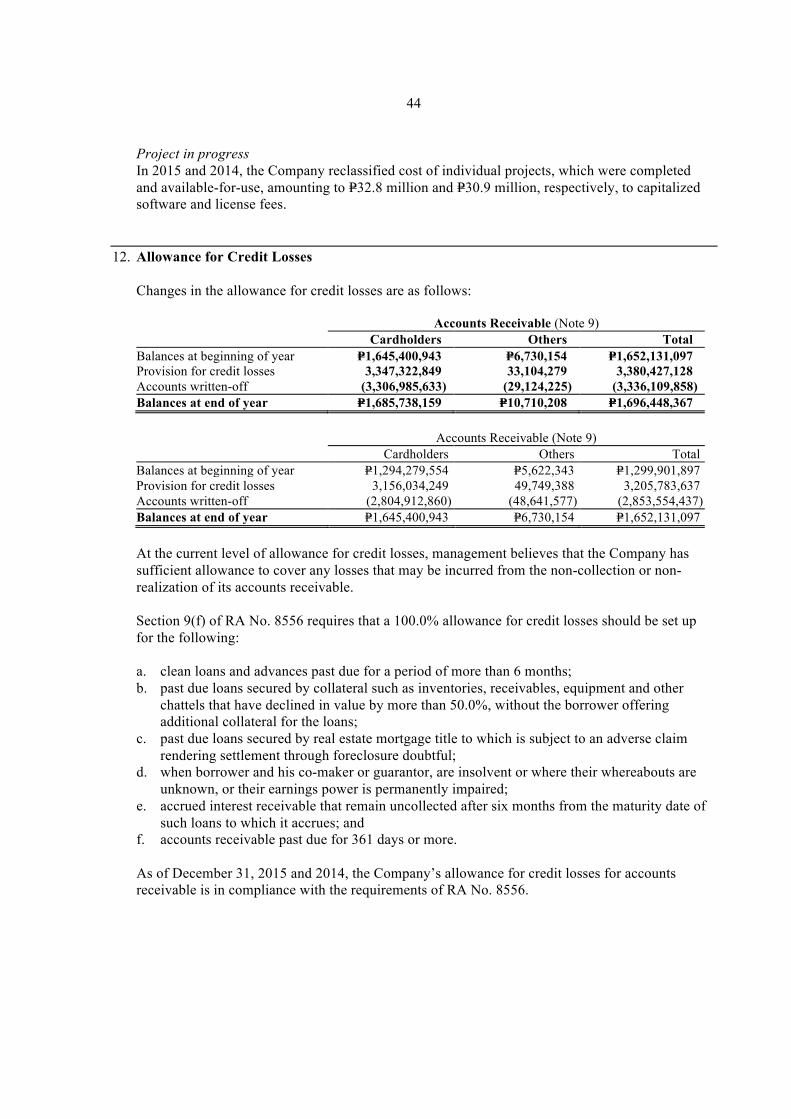
44
Project in progress In 2015 and 2014, the Company reclassified cost of individual projects, which were completed and available-for-use, amounting to P=32.8 million and P=30.9 million, respectively, to capitalized software and license fees.
12. Allowance for Credit Losses
Changes in the allowance for credit losses are as follows:
Accounts Receivable (Note 9)
Cardholders Others Total
Balances at beginning of year P=1,645,400,943 P=6,730,154 P=1,652,131,097 Provision for credit losses 3,347,322,849 33,104,279 3,380,427,128 Accounts written-off (3,306,985,633) (29,124,225) (3,336,109,858) Balances at end of year P=1,685,738,159 P=10,710,208 P=1,696,448,367 Accounts Receivable (Note 9) Cardholders Others Total
Balances at beginning of year P=1,294,279,554 P=5,622,343 P=1,299,901,897 Provision for credit losses 3,156,034,249 49,749,388 3,205,783,637 Accounts written-off (2,804,912,860) (48,641,577) (2,853,554,437) Balances at end of year P=1,645,400,943 P=6,730,154 P=1,652,131,097
At the current level of allowance for credit losses, management believes that the Company has sufficient allowance to cover any losses that may be incurred from the non-collection or non-realization of its accounts receivable. Section 9(f) of RA No. 8556 requires that a 100.0% allowance for credit losses should be set up for the following:
a. clean loans and advances past due for a period of more than 6 months; b. past due loans secured by collateral such as inventories, receivables, equipment and other
chattels that have declined in value by more than 50.0%, without the borrower offering additional collateral for the loans;
c. past due loans secured by real estate mortgage title to which is subject to an adverse claim rendering settlement through foreclosure doubtful;
d. when borrower and his co-maker or guarantor, are insolvent or where their whereabouts are unknown, or their earnings power is permanently impaired;
e. accrued interest receivable that remain uncollected after six months from the maturity date of such loans to which it accrues; and
f. accounts receivable past due for 361 days or more. As of December 31, 2015 and 2014, the Company’s allowance for credit losses for accounts receivable is in compliance with the requirements of RA No. 8556.

45
13. Accounts Payable
This account consists of:
2015 2014
Payable to merchants P=1,342,621,741 P=1,336,959,821 Others:
Financial: Advance payments from cardholders 126,845,538 106,673,839 Payable to suppliers and service providers 95,327,084 92,870,500 Payable to Visa/MasterCard 88,605,638 62,658,471 Collection fees 9,785,790 7,084,911 Miscellaneous 3,880,891 7,503,557
324,444,941 276,791,278
Non-financial: Withholding taxes payable 123,852,457 106,694,492
Gross receipts tax (GRT) payable 58,524,909 58,481,046 Documentary stamp tax payable 5,154,191 6,757,454 Payable to SSS/Pag-ibig 2,013,166 1,928,133
189,544,723 173,861,125
513,989,664 450,652,403
P=1,856,611,405 P=1,787,612,224
Payable to merchants represent the amount due to various member establishments for the Company’s acquiring transactions. Settlement occurs 1 day after the transaction date.
Miscellaneous account consists of insurance premium payables and stale checks.
14. Bills Payable
This account consists of:
2015 2014 Deposit substitutes P=23,102,085,527 P=20,830,605,719 Interbank loans payable 750,000,000 − P=23,852,085,527 P=20,830,605,719
The total bills payable as shown in the statements of financial position follow:
2015 2014 Current portion of promissory notes issued to: Consumers P=11,942,393,591 P=11,164,105,107 Corporates 5,845,018,872 6,496,133,408 17,787,412,463 17,660,238,515 Interbank loans payable 750,000,000 − 18,537,412,463 17,660,238,515 Non-current portion of promissory notes issued to: Consumers 4,739,687,180 2,808,588,130 Corporates 574,985,884 361,779,074 5,314,673,064 3,170,367,204 P=23,852,085,527 P=20,830,605,719
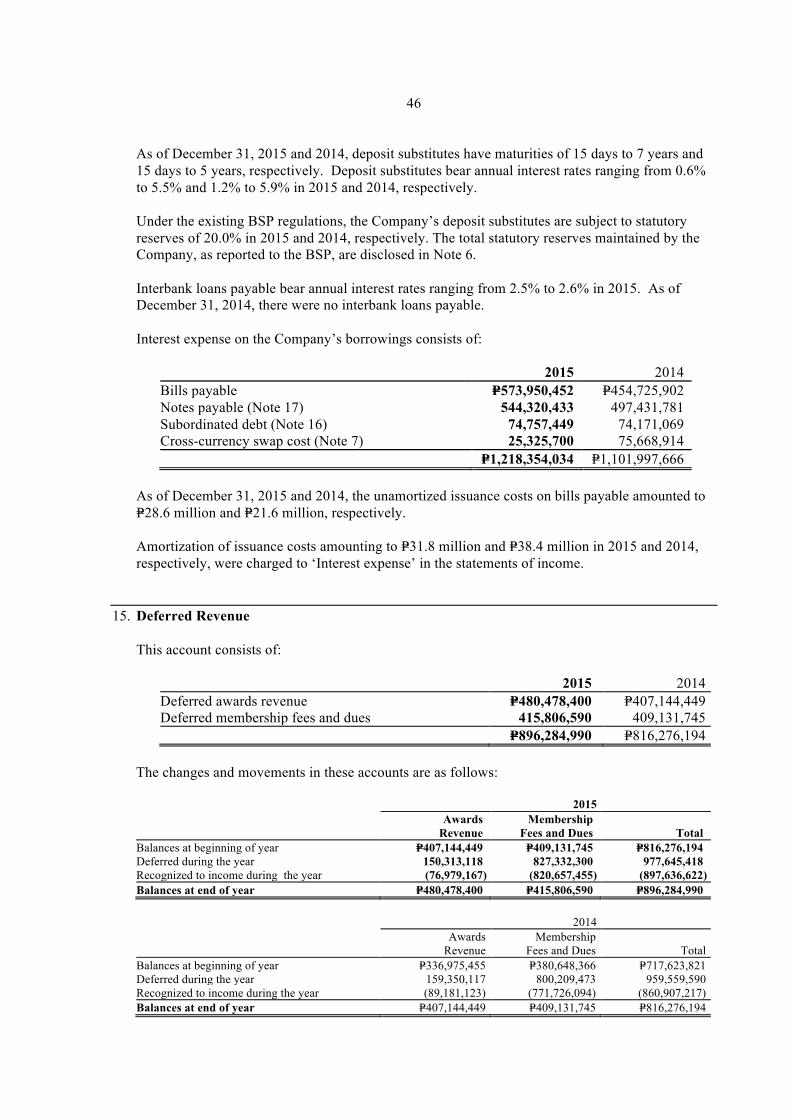
46
As of December 31, 2015 and 2014, deposit substitutes have maturities of 15 days to 7 years and 15 days to 5 years, respectively. Deposit substitutes bear annual interest rates ranging from 0.6% to 5.5% and 1.2% to 5.9% in 2015 and 2014, respectively. Under the existing BSP regulations, the Company’s deposit substitutes are subject to statutory reserves of 20.0% in 2015 and 2014, respectively. The total statutory reserves maintained by the Company, as reported to the BSP, are disclosed in Note 6. Interbank loans payable bear annual interest rates ranging from 2.5% to 2.6% in 2015. As of December 31, 2014, there were no interbank loans payable. Interest expense on the Company’s borrowings consists of:
2015 2014
Bills payable P=573,950,452 P=454,725,902 Notes payable (Note 17) 544,320,433 497,431,781 Subordinated debt (Note 16) 74,757,449 74,171,069 Cross-currency swap cost (Note 7) 25,325,700 75,668,914
P=1,218,354,034 P=1,101,997,666
As of December 31, 2015 and 2014, the unamortized issuance costs on bills payable amounted to P=28.6 million and P=21.6 million, respectively. Amortization of issuance costs amounting to P=31.8 million and P=38.4 million in 2015 and 2014, respectively, were charged to ‘Interest expense’ in the statements of income.
15. Deferred Revenue
This account consists of:
2015 2014 Deferred awards revenue P=480,478,400 P=407,144,449 Deferred membership fees and dues 415,806,590 409,131,745
P=896,284,990 P=816,276,194 The changes and movements in these accounts are as follows: 2015
Awards
Revenue Membership
Fees and Dues Total Balances at beginning of year P=407,144,449 P=409,131,745 P=816,276,194 Deferred during the year 150,313,118 827,332,300 977,645,418 Recognized to income during the year (76,979,167) (820,657,455) (897,636,622) Balances at end of year P=480,478,400 P=415,806,590 P=896,284,990
2014
Awards
Revenue Membership
Fees and Dues Total Balances at beginning of year P=336,975,455 P=380,648,366 P=717,623,821 Deferred during the year 159,350,117 800,209,473 959,559,590 Recognized to income during the year (89,181,123) (771,726,094) (860,907,217) Balances at end of year P=407,144,449 P=409,131,745 P=816,276,194
47
In 2015 and 2014, the cost of redemption of loyalty points, recognized under ‘Loyalty expense’, amounted to P=102.7 million and P=112.0 million, respectively.
16. Subordinated Debt
On February 28, 2013, the Company’s BOD approved the issuance of P=1.17 billion worth of Fixed-Rate Unsecured Subordinated Notes Eligible as Tier 2 Capital due 2023, callable in 2018 (the Notes) pursuant to the BSP Circular No. 280 and No. 781, Series of 2001 and 2013, as amended. Among the significant terms and conditions of the issuance of the Notes pursuant to the authority granted by the BSP to the Company on October 22, 2013 follow: a. Issue price at 100.0% of face value.
b. The Notes bear interest at 6.21% per annum from and including December 20, 2013 and
thereafter. Interest will be payable quarterly in arrears at the end of each interest period on March 20, June 20, September 20 and December 20 in each year, except for the last interest period which will end on the maturity date. Unless previously redeemed, the Notes will be redeemed at their principal amount on the maturity date of December 20, 2023.
c. The Notes will constitute direct, unsecured and subordinated obligations of the Company, and will, at all times, rank pari passu and without any preference among themselves and at least equally with all other present and future unsecured and subordinated obligations of the Company, except obligations mandatorily preferred by law.
d. Noteholders are prohibited by the BSP from having the Notes redeemed at their option prior to its maturity. Noteholders, may sell their Notes in the secondary market, however, this is subject to the limitation that the Notes shall be sold only to qualified buyers. Any sale or transfer of the Notes in the secondary market is then subject to market prices and the limitation on the number of allowable holders.
e. The Notes contain provisions relating to loss absorption upon the occurrence of a non-viability trigger event of the Company or Metrobank as determined by the BSP, pursuant to which the Company may be required immediately and irrevocably (without the need for the consent of the holders of the Notes) to effect a write-off in whole or in part of the outstanding principal and accrued and unpaid interest in respect of the Notes or, in the case of non-viability of Metrobank, the Notes may be converted to such number of common shares of the Company.
f. If a non-viability trigger event occurs, a Noteholder will have no claim against the Company at all in respect of any Notes or any portion of the Notes that have been written down and/or terminated.
The Notes shall not be used as collateral for any loan made by the Company or any of its affiliates. As of December 31, 2015 and 2014, the unamortized issuance costs on the subordinated debt amounted to P=8.7 million and P=9.8 million, respectively.
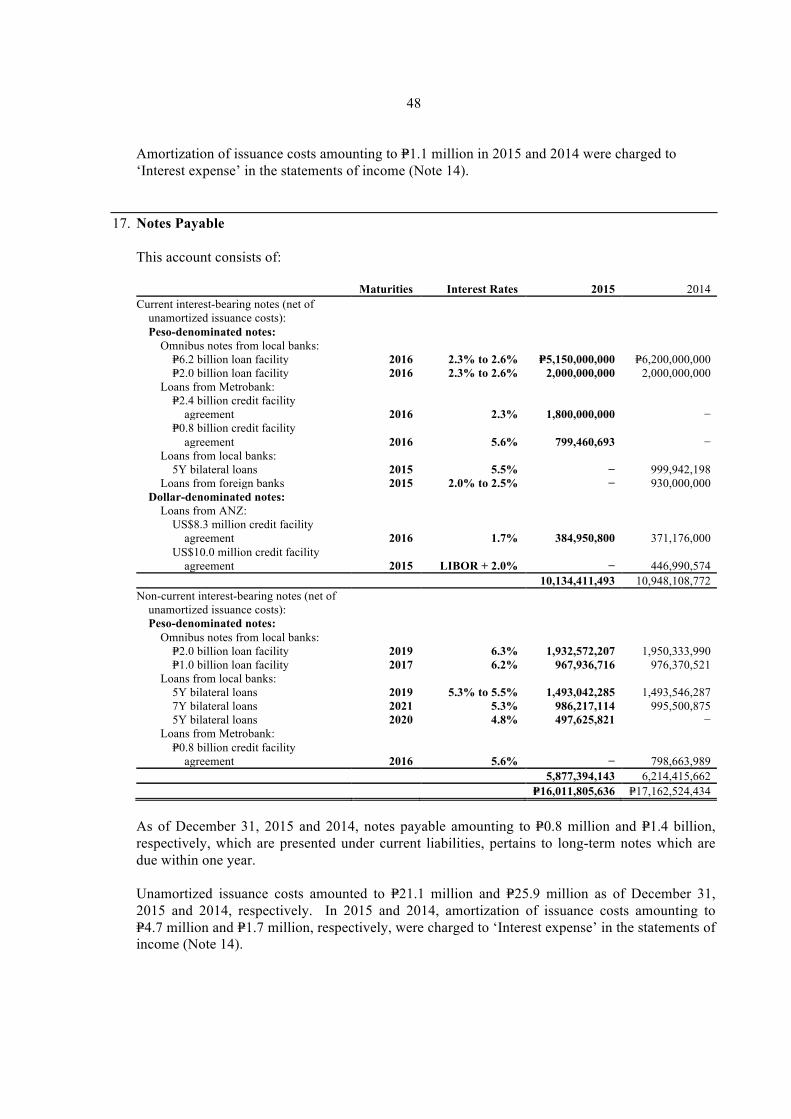
48
Amortization of issuance costs amounting to P=1.1 million in 2015 and 2014 were charged to ‘Interest expense’ in the statements of income (Note 14).
17. Notes Payable
This account consists of:
Maturities Interest Rates 2015 2014
Current interest-bearing notes (net of unamortized issuance costs):
Peso-denominated notes: Omnibus notes from local banks: P=6.2 billion loan facility 2016 2.3% to 2.6% P=5,150,000,000 P=6,200,000,000
P=2.0 billion loan facility 2016 2.3% to 2.6% 2,000,000,000 2,000,000,000 Loans from Metrobank:
P=2.4 billion credit facility agreement 2016 2.3% 1,800,000,000 −
P=0.8 billion credit facility agreement 2016 5.6% 799,460,693 −
Loans from local banks: 5Y bilateral loans 2015 5.5% − 999,942,198
Loans from foreign banks 2015 2.0% to 2.5% − 930,000,000 Dollar-denominated notes:
Loans from ANZ: US$8.3 million credit facility
agreement 2016 1.7% 384,950,800 371,176,000 US$10.0 million credit facility
agreement 2015 LIBOR + 2.0% − 446,990,574
10,134,411,493 10,948,108,772
Non-current interest-bearing notes (net of unamortized issuance costs):
Peso-denominated notes: Omnibus notes from local banks: P=2.0 billion loan facility 2019 6.3% 1,932,572,207 1,950,333,990
P=1.0 billion loan facility 2017 6.2% 967,936,716 976,370,521 Loans from local banks:
5Y bilateral loans 2019 5.3% to 5.5% 1,493,042,285 1,493,546,287 7Y bilateral loans 2021 5.3% 986,217,114 995,500,875 5Y bilateral loans 2020 4.8% 497,625,821 −
Loans from Metrobank: P=0.8 billion credit facility
agreement 2016 5.6% − 798,663,989
5,877,394,143 6,214,415,662
P=16,011,805,636 P=17,162,524,434
As of December 31, 2015 and 2014, notes payable amounting to P=0.8 million and P=1.4 billion, respectively, which are presented under current liabilities, pertains to long-term notes which are due within one year.
Unamortized issuance costs amounted to P=21.1 million and P=25.9 million as of December 31, 2015 and 2014, respectively. In 2015 and 2014, amortization of issuance costs amounting to P=4.7 million and P=1.7 million, respectively, were charged to ‘Interest expense’ in the statements of income (Note 14).

49
Following are the significant terms and conditions of the Company’s peso and dollar-denominated notes payable: Bilateral Loans Interests are due upon maturity and quarterly for short-term notes and long-term notes, respectively. The principal is due upon maturity of the notes. All loans are unsecured and subject to the following standard default provisions that would make the loan due and demandable upon: • Technical defaults, subject to curing period; or • Default in payment, loan is immediately due and demandable. In April 2014, the Company’s BOD and management decided to exercise its right to redeem the P=2.0 billion corporate notes maturing in 2015. This was refinanced via bilateral loans totaling P=2.5 billion maturing in 2019 and 2021. Loans from Metrobank Unsecured loans with quarterly interest payments subject to the following standard default provisions that would make the loan due and demandable upon: • Use of proceeds other than purpose; or • Default in payment. Loans from ANZ Unsecured loans with interest payable upon maturity and quarterly for short-term notes and long-term notes, respectively. The loans are subject to the following undertakings and provisions: • Information undertakings, the Company must provide its financial statements and notify
events with material adverse effect on the Company; • Negative pledge provision with an exception to the securitization of credit card receivables; • Provision to not enter into merger, disposal of assets or to make substantial change to the
general nature of the business; • Other general undertakings such as compliance of laws and payment of taxes; and • Acceleration clause, the loan becomes due and demandable upon occurrence of an event of
default. Omnibus Agreements The Omnibus Agreements with various local banks include a cross-default clause wherein it provides that if the Company fails to pay any amount due under any other agreement of document evidencing, guaranteeing or relating to the indebtedness of the Company or other occurrence of event of default or material breach on the part of the Company under any agreement or document, the liability shall be declared due and payable. The loans are unsecured and are obtained to finance credit card receivables.

50
18. Accrued Interest, Taxes and Other Expenses
This account consists of:
2015 2014
Accrued interest (Note 24) P=191,204,818 P=180,106,394 Accrued advertising 70,285,230 61,206,710 Accrued rewards 27,142,182 23,252,156 Accrued taxes 23,382,613 13,947,396 Accrued other expenses (Note 24) 370,627,212 346,122,330 P=682,642,055 P=624,634,986
The table below shows the breakdown of accrued other expenses:
2015 2014
Compensation and fringe benefits P=131,043,227 P=133,319,560 Service fee 77,278,351 62,550,999 Communications expense 70,244,319 81,586,701 Rental and office-related expenses (Note 24) 30,209,969 30,896,415 Computer-related expenses 16,293,456 17,588,435 Membership fees 12,491,804 7,052,176 Management and professional fees 3,824,833 3,285,338 Maintenance cost 2,394,817 2,864,453 Miscellaneous expenses 26,846,436 6,978,253
P=370,627,212 P=346,122,330
19. Equity
The details of the Company’s capital stock as of December 31, 2015 and 2014 are as follows:
Shares Amount Capital stock - P=1.0 par value Authorized 2,000,000,000 P=2,000,000,000 Issued and outstanding Balance at beginning and end of year 1,000,000,000 1,000,000,000
Retained Earnings Under the Corporation Code of the Philippines (the Code), a stock corporation is prohibited from retaining surplus profits in excess of 100.0% of its paid-in capital stock, except when: a. justified by definite corporate expansion projects or programs approved by the board of
directors; or
b. the corporation is prohibited under any loan agreement with any financial institution or creditor, whether local or foreign, from declaring dividends without its or his consent, and such consent has not yet been secured; or
c. it can be clearly shown that such retention is necessary under special circumstances obtaining in the corporation, such as when there is need for special reserve for probable contingencies.

51
The Company retains profit in line with its capital management policy (see Note 4). Appropriations On February 27, 2014, the BOD approved the appropriation of retained earnings in the amount of P=3.9 billion for the following:
a. Appropriations for various Business Technology projects, which are to be implemented by
4th quarter of 2015, amounting to P=349.0 million. The amount includes re-appropriation of P=300.0 million and additional appropriation of P=49.0 million during the year. The following Business Technology projects were approved by the BOD on December 11, 2012: • Cardlink replacement • Collection management system • Card origination system
b. Appropriations for the maintenance of capital reserve amounting to P=1.8 billion to ensure that
debt to equity ratio will not exceed 7.5 times as required in the Company’s Omnibus Notes Facility Agreement (Note 17). The amount includes re-appropriation of P=1.7 billion and additional appropriation of P=0.1 billion during the year.
c. Appropriations for the distribution of cash dividends in the amount of P=1.8 billion in favor of
stockholders of record as of May 5, 2014 which was subsequently paid on July 7, 2014 and on September 8, 2014.
On February 18, 2015, the BOD approved the appropriation of retained earnings in the amount of P=4.9 billion for the following:
a. Appropriations for various Business Technology projects, which are to be implemented by
4th quarter of 2015, amounting to P=377.0 million. The amount includes re-appropriation of P=349.0 million and additional appropriation of P=28.0 million during the year. The following Business Technology projects were approved by the BOD on December 11, 2012: • Cardlink replacement • Collection management system • Card origination system
b. Appropriations for the maintenance of capital reserve amounting to P=2.5 billion to ensure that
debt to equity ratio will not exceed 7.5 times as required in the Company’s Omnibus Notes Facility Agreement (Note 17). The amount includes re-appropriation of P=1.8 billion and additional appropriation of P=0.7 billion during the year.
c. Appropriations for the distribution of cash dividends in the amount of P=2.0 billion in favor of stockholders of record as of July 16, 2015 which was subsequently paid on August 6, 2015 for a total amount of P=2.1 billion.

52
Cash Dividends The following cash dividends were declared and paid in 2015 and 2014:
Dividend
Date of Declaration Per Share Total Amount Record Date Amount Paid Payment Date June 3, 2015 P=2.1 P=2,115.0 million July 16, 2015 P=2,115.0 million August 6, 2015 March 21, 2014 1.8 1,500.0 million May 5, 2014 1,500.0 million July 7, 2014
300.0 million May 5, 2014 300.0 million September 8, 2014
The computation of retained earnings available for dividend declaration in accordance with SEC Memorandum Circular No. 11, issued in December 2008, differs to a certain extent as compared with the computation per BSP guidelines.
20. Miscellaneous Income and Expenses
Miscellaneous income consists of:
2015 2014
Over credit limit fee P=313,617,109 P=307,497,947 Gross international fee 188,307,560 163,037,461 Service fee 104,532,683 67,418,632 Rental income (Note 21) 32,903,369 31,294,332 Transaction processing fee 19,470,630 18,835,323 Foreign exchange gain 17,276,831 4,323,122 Business process outsourcing fee (Note 24) 8,541,778 29,122,039 Gain on sale of properties (Notes 10) 268,698 701,759 Gain on sale of AFS investments (Note 8) − 328,182,999 Others 6,615,746 9,266,562
P=691,534,404 P=959,680,176
Over credit limit fees represent charges to cardholders when their outstanding balance exceeded the credit limit allowed by the Company. Others include quasi-cash fees, card replacement fees and various income generating charges.
Miscellaneous expenses consist of:
2015 2014
Collection fees P=115,476,370 P=78,381,601 Maintenance cost (Note 24) 102,505,070 84,853,425 Verification cost 45,513,548 40,670,574 Employee relations expenses 5,004,089 5,775,245 Recruitment cost 4,815,355 4,656,013 Insurance (Note 24) 4,561,583 5,381,130 Membership fees (Note 24) 2,138,159 1,889,204 Donations (Note 24) 165,000 150,000 Others 30,874,969 10,663,527
P=311,054,143 P=232,420,719

53
21. Leases
Company as lessee The Company entered into lease agreements with its Parent Company for 5 years which will end on December 31, 2016 (with annual escalation of 10.0%) and for 1 year which will end on September 15, 2017 for the premises that the Company uses in Metropolitan Park and Metrobank Plaza, respectively. The Company also entered into lease agreements to lease units of point-of-sale terminals for a minimum period of 3 to 5 years. These are cancellable and can be terminated after the specified period stated in the lease agreements.
The future minimum lease commitments under operating lease are as follows:
2015 2014
Within one year P=143,685,828 P=121,134,537 After one year but not more than five years 283,385,702 325,800,863
P=427,071,530 P=446,935,400
In 2015 and 2014, rental expense included under ‘Rent, light and water’ in the statements of income amounted to P=127.3 million and P=161.1 million, respectively. There were no direct costs incurred in relation to these leases.
Company as lessor The Company entered into a lease agreement with ANZ and a non-related party for 2 years which will end on January 16, 2018 and July 31, 2017, respectively, with annual escalation rate of 5.0% for the use of office space for sales and service retail branch. The future minimum lease commitments under operating lease are as follows:
2015 2014
Within one year P=2,370,474 P=2,214,372 After one year but not more than five years 2,975,476 5,345,950
P=5,345,950 P=7,560,322
In 2015 and 2014, rental income included under ‘Miscellaneous income’ amounted to P=16.7 million and P=15.5 million, respectively (Note 20). There were no direct costs incurred in relation to these leases.
22. Retirement Liability
The Company has a funded noncontributory defined benefit plan covering all of its officers and regular employees. The funds are being administered by the Trust Banking Group (TBG) of Metrobank under the supervision of the Retirement Committee. The Retirement Committee is responsible for giving direction to the Trustee on the investment of the assets of the fund. The Retirement Committee defines the investment strategy as often as necessary, at least annually, especially in the case of significant market developments or changes to the structure of the plan participants.

54
When defining the investment strategy, the Retirement Committee takes into account the plans’ objectives, benefit obligations and risk capacity. The investment strategy is defined in the form of a long-term target structure or investment policy.
The Retirement Committee delegates the implementation of the investment policy in accordance with the investment strategy as well as various principles and objectives to an Investment Committee, which also consists of members of the Board of Trustees, a Director and a Controller. The Controller oversees the entire investment process. Under the existing regulatory framework, Republic Act 7641 requires a provision for retirement pay to qualified private sector employees in the absence of any retirement plan in the entity, provided however that the employee’s retirement benefits under any collective bargaining and other agreements shall not be less than those provided under the law. The law does not require minimum funding of the plan.
On October 23, 2015, the Company’s Retirement Committee approved the changes in the retirement benefit plan such as increase in retirement benefits. The principal actuarial assumptions used in determining the retirement liability for the Company’s retirement plan as of December 31, 2015 and 2014 are as follow:
2015 2014
Discount rate 5.2% 4.8% Future salary increases:
For officers 8.7% 9.0% For staff P=1,930 P=2,100 Average years of service 7.4 years 6.8 years Average remaining working life 12 years 10 years Retirement age 50 55
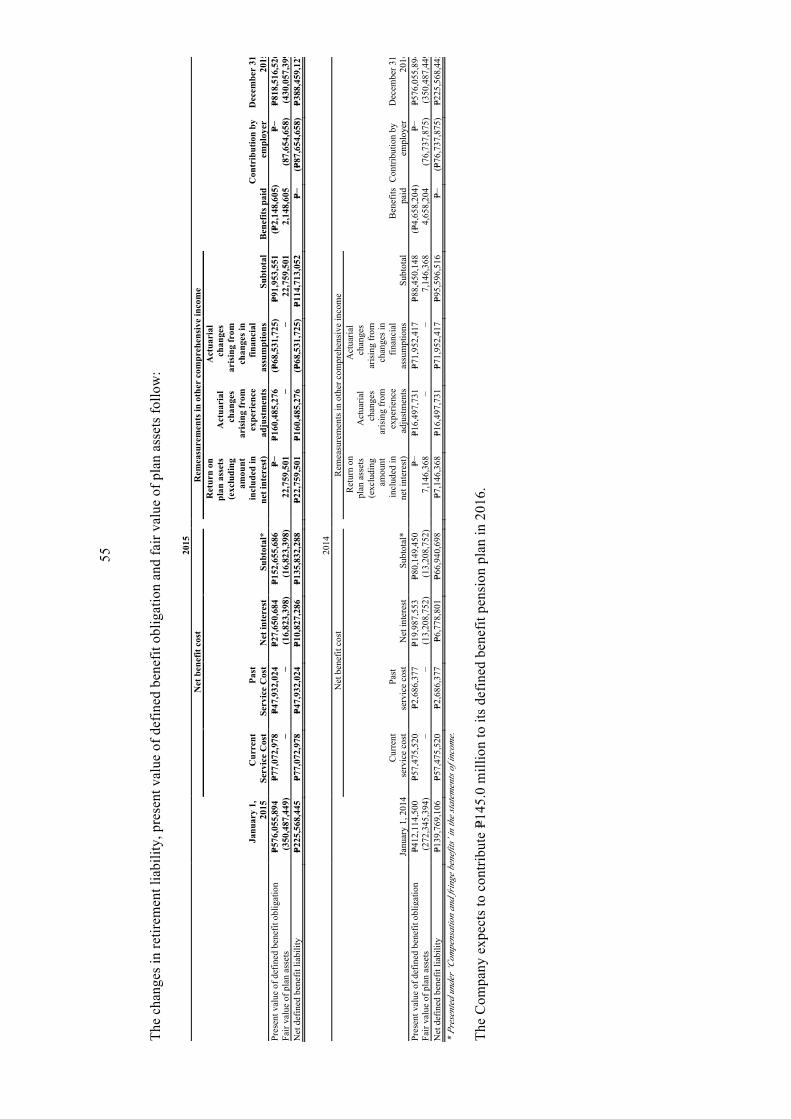
55
The
chan
ges i
n re
tirem
ent l
iabi
lity,
pre
sent
val
ue o
f def
ined
ben
efit
oblig
atio
n an
d fa
ir va
lue
of p
lan
asse
ts fo
llow
:
2015
Net
ben
efit
cost
Rem
easu
rem
ents
in o
ther
com
preh
ensi
ve in
com
e
Janu
ary
1,
2015
C
urre
nt
Serv
ice
Cos
t Pa
st
Serv
ice
Cos
t N
et in
tere
st
Subt
otal
*
Ret
urn
on
plan
ass
ets
(exc
ludi
ng
amou
nt
incl
uded
in
net i
nter
est)
Act
uari
al
chan
ges
aris
ing
from
ex
peri
ence
ad
just
men
ts
Act
uari
al
chan
ges
aris
ing
from
ch
ange
s in
finan
cial
as
sum
ptio
ns
Subt
otal
B
enef
its p
aid
Con
trib
utio
n by
em
ploy
er
Dec
embe
r 31
, 20
15
Pres
ent v
alue
of d
efin
ed b
enef
it ob
ligat
ion
P=576
,055
,894
P=7
7,07
2,97
8 P=4
7,93
2,02
4 P=2
7,65
0,68
4 P=1
52,6
55,6
86
P=−
P=1
60,4
85,2
76
(P=68
,531
,725
) P=9
1,95
3,55
1 (P=
2,14
8,60
5)
P=−
P=818
,516
,526
Fa
ir va
lue
of p
lan
asse
ts
(350
,487
,449
) −
− (1
6,82
3,39
8)
(16,
823,
398)
22,7
59,5
01
− −
22,7
59,5
01
2,14
8,60
5 (8
7,65
4,65
8)
(430
,057
,399
) N
et d
efin
ed b
enef
it lia
bilit
y P=2
25,5
68,4
45
P=77,
072,
978
P=47,
932,
024
P=10,
827,
286
P=135
,832
,288
P=22,
759,
501
P=160
,485
,276
(P=
68,5
31,7
25)
P=114
,713
,052
P=−
(P=
87,6
54,6
58)
P=388
,459
,127
20
14
N
et b
enef
it co
st
R
emea
sure
men
ts in
oth
er c
ompr
ehen
sive
inco
me
Janu
ary
1, 2
014
Ret
urn
on
plan
ass
ets
(exc
ludi
ng
amou
nt
incl
uded
in
net i
nter
est)
Act
uaria
l ch
ange
s ar
isin
g fr
om
expe
rienc
e ad
just
men
ts
Act
uaria
l ch
ange
s ar
isin
g fr
om
chan
ges i
n fin
anci
al
assu
mpt
ions
Su
btot
al
Ben
efits
pa
id C
ontri
butio
n by
em
ploy
er
Dec
embe
r 31,
20
14
Cur
rent
se
rvic
e co
st
Past
se
rvic
e co
st
Net
inte
rest
Su
btot
al*
Pr
esen
t val
ue o
f def
ined
ben
efit
oblig
atio
n P=4
12,1
14,5
00
P=57,
475,
520
P=2,6
86,3
77
P=19,
987,
553
P=80,
149,
450
P=−
P=1
6,49
7,73
1 P=7
1,95
2,41
7 P=8
8,45
0,14
8 (P=
4,65
8,20
4)
P=−
P=576
,055
,894
Fa
ir va
lue
of p
lan
asse
ts
(272
,345
,394
) −
− (1
3,20
8,75
2)
(13,
208,
752)
7,14
6,36
8 −
−
7,14
6,36
8 4,
658,
204
(76,
737,
875)
(3
50,4
87,4
49)
Net
def
ined
ben
efit
liabi
lity
P=1
39,7
69,1
06
P=57,
475,
520
P=2,6
86,3
77
P=6,7
78,8
01
P=66,
940,
698
P=7
,146
,368
P=1
6,49
7,73
1 P=7
1,95
2,41
7 P=9
5,59
6,51
6 P=−
(P=
76,7
37,8
75)
P=225
,568
,445
*
Pres
ente
d un
der ‘
Com
pens
atio
n an
d fri
nge
bene
fits’
in th
e sta
tem
ents
of in
com
e.
Th
e C
ompa
ny e
xpec
ts to
con
tribu
te P=
145.
0 m
illio
n to
its d
efin
ed b
enef
it pe
nsio
n pl
an in
201
6.
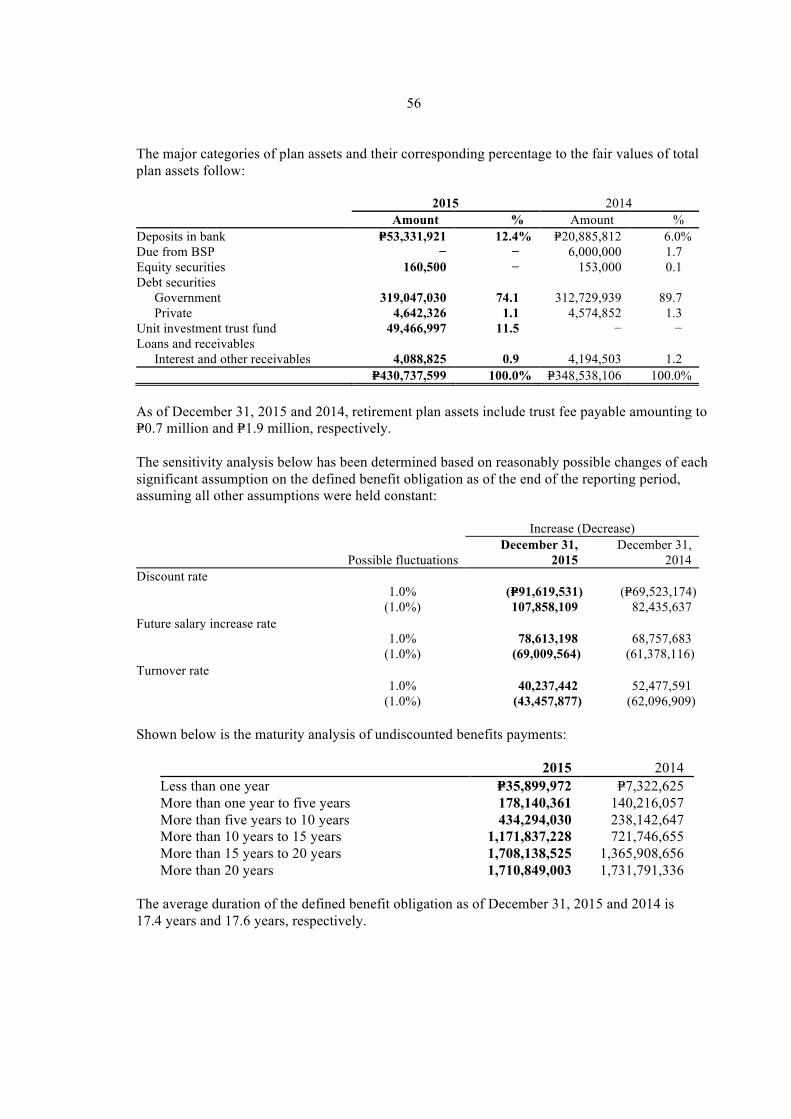
56
The major categories of plan assets and their corresponding percentage to the fair values of total plan assets follow:
2015 2014
Amount % Amount %
Deposits in bank P=53,331,921 12.4% P=20,885,812 6.0% Due from BSP − − 6,000,000 1.7 Equity securities 160,500 − 153,000 0.1 Debt securities
Government 319,047,030 74.1 312,729,939 89.7 Private 4,642,326 1.1 4,574,852 1.3
Unit investment trust fund 49,466,997 11.5 − − Loans and receivables
Interest and other receivables 4,088,825 0.9 4,194,503 1.2
P=430,737,599 100.0% P=348,538,106 100.0%
As of December 31, 2015 and 2014, retirement plan assets include trust fee payable amounting to P=0.7 million and P=1.9 million, respectively. The sensitivity analysis below has been determined based on reasonably possible changes of each significant assumption on the defined benefit obligation as of the end of the reporting period, assuming all other assumptions were held constant:
Increase (Decrease)
Possible fluctuations
December 31, 2015
December 31, 2014
Discount rate
1.0% (P=91,619,531) (P=69,523,174)
(1.0%) 107,858,109 82,435,637
Future salary increase rate
1.0% 78,613,198 68,757,683
(1.0%) (69,009,564) (61,378,116)
Turnover rate
1.0% 40,237,442 52,477,591
(1.0%) (43,457,877) (62,096,909)
Shown below is the maturity analysis of undiscounted benefits payments:
2015 2014
Less than one year P=35,899,972 P=7,322,625 More than one year to five years 178,140,361 140,216,057 More than five years to 10 years 434,294,030 238,142,647 More than 10 years to 15 years 1,171,837,228 721,746,655 More than 15 years to 20 years 1,708,138,525 1,365,908,656 More than 20 years 1,710,849,003 1,731,791,336
The average duration of the defined benefit obligation as of December 31, 2015 and 2014 is 17.4 years and 17.6 years, respectively.

57
23. Income Taxes Income taxes include corporate income tax, as discussed below, and final taxes paid at the rate of 20.0% and 7.5% on peso-denominated and foreign currency-denominated cash in banks, respectively, which is a final withholding tax on gross interest income. The RCIT rate shall be 30.0% and interest allowed as deductible expense shall be reduced by 33.0% of interest income subjected to final tax.
The NIRC of 1997 also provides for rules on the imposition of MCIT of 2.0% on the gross income as of the end of the taxable year beginning on the fourth (4th) taxable year immediately following the taxable year in which the Company commenced its business operations. Any excess MCIT over the RCIT can be carried forward on an annual basis and credited against the RCIT for the three immediately succeeding taxable years.
In addition, the NIRC of 1997 allows the Company to deduct from its taxable income for the current year its accumulated net operating losses for the immediately preceding three consecutive taxable years.
Current tax regulations also provide for the ceiling on the amount of entertainment, amusement and recreation (EAR) expense that can be claimed as a deduction against taxable income. Under the regulation, EAR expense allowed as a deductible expense for a service company is limited to the actual EAR paid or incurred but not to exceed 1.0% of net revenue. In 2015 and 2014, EAR expenses amounted to P=0.9 million.
Deferred tax asset - net The components of net deferred tax assets follow:
2015 2014
Deferred tax asset on: Allowance for credit losses (Note 12) P=508,934,510 P=495,639,329
Deferred awards revenue (Note 15) 144,143,520 122,143,335 Deferred membership fees and dues (Note 15) 124,741,977 122,739,524 Retirement liability 116,537,739 67,670,534 Accrued expenses 28,703,485 23,886,230 Unamortized past service cost 22,340,420 17,433,612 Unrealized loss on cash flow hedge (Note 7) − 1,170,508
945,401,651 850,683,072
Deferred tax liability on: Deferred acquisition costs (Note 9) (52,014,056) (60,594,884)
Unrealized foreign exchange gain (5,183,049) (1,296,511)
(57,197,105) (61,891,395)
Net deferred tax asset P=888,204,546 P=788,791,677 Management believes that the current level of deferred tax assets will be utilized in the future.

58
A reconciliation of the Company’s statutory income tax to effective income tax follows:
2015 2014
Statutory income tax P=1,153,359,865 P=1,091,427,215 Tax effects of:
Non-deductible expenses 6,377,883 775,641 Income subjected to final tax (875,796) (791,970) Others 182,775 185,384 Effective income tax P=1,159,044,727 P=1,091,596,270
24. Related Party Transactions
Parties are considered to be related if one party has the ability, directly or indirectly, to control the other party or exercise significant influence over the other party in making financial and operating decisions. The Company’s related parties include:
- Parent Company:
• Metrobank
- Significant Investor: • ANZ
- Affiliates or other related parties, which are associates, subsidiaries, and joint ventures of the
Parent Company. Affiliates with which the Company has related party transactions in 2015 and 2014 follow: • Charter Ping An Insurance Corporation • Federal Land, Inc. • First Metro Investment Corporation • Metro Remittance Center, Inc. • Metro Remittance (Hongkong) Ltd. • Metro Remittance (Italia), S.p.A. • Metro Remittance (Japan) Co. Ltd. • Metro Remittance (Singapore) Pte. Ltd. • Metro Remittance (UK) Ltd. • Metro Remittance (USA), Inc. • ORIX Metro Leasing and Finance Corporation • Philippine Axa Life Insurance Corporation • Philbancor Venture Capital Corporation • PSBank • SMBC Metro Investment Corporation • Taal Land, Inc. • Toyota Cubao, Inc. • Toyota Financial Services Philippines Corporation • Toyota Manila Bay Corporation • Toyota Motor Philippines Corporation
- Post-employment benefit plans for the benefit of the Company’s employees.

59
- Key management personnel, close family members of key management personnel and entities which are controlled, significantly influenced by or for which significant voting power is held by key management personnel or their close family members.
The Company has several business relationships with related parties. Transactions with such parties are made in the ordinary course of business and on substantially same terms, including interest and collateral, as those prevailing at the time for comparable transactions with other parties. These transactions also did not involve more than the normal risk of collectability or present other unfavorable conditions. The Company has a Related Party Committee (RPC) which is created to assist the BOD in ensuring that transactions with related parties are reviewed to assess risks and are subjected to appropriate restrictions to ensure that these are conducted at arm’s-length terms and that business resources of the Company are not misappropriated or misapplied. After appropriate review, the RPC discloses all information and endorses to the BOD with recommendations, the proposed related party transactions. The members of the RPC are appointed annually by the BOD. Currently, the RPC is composed of two (2) independent directors (including the Chairman of the Committee); two (2) regular directors; and the head of Compliance and Internal Audit (as Secretary). The RPC meets on a quarterly basis or as the need arises. The RPC’s review of proposed related party transactions covers the following: (a) identity of the parties involved in the transaction or relationship; (b) terms of the transaction or relationship and whether these are no less favorable than terms generally available to an unrelated third party under the same circumstances; (c) business purpose, timing, rationale and benefits of the transaction or relationship; (d) approximate monetary value of the transaction and the approximate monetary value of the related party’s interest in the transaction; (e) valuation methodology used and alternative approaches to valuation of the transaction; (f) information concerning potential counterparties in the transaction; (h) whether the proposed transaction includes any potential reputational risk issues that may arise as a result of or in connection with the transaction; (i) impact to a director’s independence; and (j) extent that such transaction or relationship would present an improper conflict of interest. In the ordinary course of business, the Company has transactions with Metrobank and other related companies. The major transactions include availments of loans, short-term cash placements and other regular banking transactions. The branch network of Metrobank and PSBank also acts as servicing units of the Company for the acceptance of payments from cardholders. Metrobank and PSBank charge the Company for every payment and processing of transaction which are recorded under ‘Distribution costs’ and ‘Computer-related expenses’ in the statements of income, respectively.
The following table presents the balances of material intercompany transactions of the Company as of and for the years ended December 31, 2015 and 2014 (amounts in thousands): December 31, 2015
Amount/ Outstanding Category Volume Balance Nature, Terms and Conditions Parent Company Cash and cash equivalents P=604,090 Current and savings account, and foreign currency
deposits with annual interest rates of 0.5% and 0.1%, respectively
Deposits P=560,233,023 Withdrawals (560,060,684)
Short-term placements – Short-term deposits and various overnight placements with terms of 1 to 15 days and bear annual interest rates ranging from 2.0% to 4.0%
Placements 16,590,000 Maturities (17,590,000)
(Forward)

60
December 31, 2015
Amount/ Outstanding Category Volume Balance Nature, Terms and Conditions Interbank loans receivable P=– Overnight lending with interest rates ranging from 1.8%
to 3.1% Placements P=– Maturities 400,000
Accounts receivable 101,642 Billings on merchant discount subsidy, outsourcing fees, Point-of-Sale (POS) rentals and charges for use of Visa Banking Identification Number (BIN)
Accounts payable 1,269 Service fees on availments of bills payable Accrued expense payable 17,055 Accrual of expenses from rentals, membership fees,
distribution cost, utilities and other maintenance costs Accrued interest payable 5,269 Accrued interest payable on interest-bearing notes Bills payable 1,800,000 Overnight borrowings with interest rates ranging from
2.0% to 2.5% and terms of 1 to 6 days Availments 1,800,000 Maturities –
Notes payable 800,000 Interest-bearing note with an interest rate of 5.6% and term of 5 years (gross of unamortized issuance cost) Availments –
Maturities – Interest income 2,811 Interest earned on bank deposits and overnight lending Merchant discount 65,186 Income earned on merchant discount subsidy Miscellaneous income 8,542 Income earned on outsourcing fees Interest expense 69,926 Interest expense, service fees and facility agent fees on
interbank loans payable and interest-bearing notes Rent, light and water 37,714 Rentals and utility expenses from leased premises at
Metropolitan Park and Metrobank Plaza Computer related expense 173,337 Transaction processing charges Communications 821 Telephone and courier card delivery charges Distribution cost 62,303 Over-the-counter charges for the accommodation of
cardholder payments Security, messengerial and janitorial 36 Administrative expenses Miscellaneous expense 3,893 Other membership and maintenance fees Significant Investor Cash and cash equivalents 62,081 Current and savings account, and foreign currency
deposits with annual interest rates of 0.1% Deposits 11,631,240 Withdrawals (11,604,271)
Accrued expense payable 1,908 Accrual of management and other professional fees Accrued interest payable 387 Accrued interest payable on interest-bearing notes Notes payable 1,251,489 Interest-bearing notes with an interest rate of 1.7% and
tenors of two weeks to one month Availments 4,558,501 Maturities (4,125,178)
Interest income 46 Interest earned on bank deposits Miscellaneous income 8,542 Income earned on leased office space at Metrobank Card
Center Interest expense 57,832 Interest expense, service fees and facility agent fees on
interbank loans payable and interest-bearing notes Affiliates Cash and cash equivalents 76,267 Current and savings account, and foreign currency
deposits with annual interest rates of 0.5% and 0.1%, respectively
Deposits 9,750,383 Withdrawals (9,734,746)
Short-term placements – Short-term deposits and various overnight placements with terms of 1 to 3 days and bear annual interest rates ranging from 2.5% to 3.0%
Placements 16,630,000 Maturities (16,630,000)
Accounts receivable 6,403 Accounts receivable from corporate credit card transactions
Prepaid expenses and other current assets 608 Advance payment for insurance premiums Bills payable 1,267,693 Overnight borrowings with interest rates ranging from
2.5% to 2.6% and terms of 1 to 6 days and deposit substitutes with interest rates ranging from 0.6% to 5.5% and terms of 15 to 5 years
Availments 27,815,294 Maturities (29,213,833)
Notes payable 50,000 Interest-bearing note with an interest of 8.5% and term of 5 years (gross of unamortized issuance cost) Availments –
Maturities – Accrued interest payable 4,704 Accrued interest payable on deposit substitutes and
interest-bearing notes Accrued expense payable 1,924 Over-the-counter charges for the accommodation of
cardholder payments and other accrued expenses Interest income 1,412 Interest earned on bank deposits and overnight lending Membership fees and dues 814 Annual membership fee for corporate credit cards Interest expense 58,172 Interest expense on interbank loans payable, deposit
substitutes and interest-bearing notes
(Forward)

61
December 31, 2015
Amount/ Outstanding Category Volume Balance Nature, Terms and Conditions Distribution cost P=4,922 Over-the-counter charges for the accommodation of
cardholder payments Rent, light and water 4,139 Rentals and utility expenses Insurance expense 4,562 Insurance expenses
December 31, 2014
Amount/ Outstanding Category Volume Balance Nature, Terms and Conditions Parent Company Cash and cash equivalents P=431,751 Current and savings account, and foreign currency
deposits with annual interest rates of 0.5% and 0.1%, respectively
Deposits P=384,029,498 Withdrawals (384,047,747)
Short-term placements 1,000,000 Short-term deposit has a term of 15 days and bear annual interest rate of 4.0% Placements 1,000,000
Maturities – Interbank loans receivable 400,000 Overnight lending with interest rates ranging from 1.8%
to 3.1% Placements 18,223,000 Maturities (17,823,000)
Accounts receivable 45,686 Billings on merchant discount subsidy, outsourcing fees, Point-of-Sale (POS) rentals and charges for use of Visa Banking Identification Number (BIN)
Accounts payable 1,411 Service fees on availments of bills payable Accrued expense payable 17,038 Accrual of expenses from rentals, membership fees,
distribution cost, utilities and other maintenance costs Accrued interest payable 3,400 Accrued interest payable on interest-bearing notes Bills payable – Overnight borrowings with interest rates ranging from
2.0% to 2.5% and terms of 1 to 6 days Availments 1,277,000 Maturities (1,277,000)
Notes payable 800,000 Interest-bearing note with an interest rate of 5.6% and term of 5 years (gross of unamortized issuance cost) Availments –
Maturities – Interest income 2,901 Interest earned on bank deposits and overnight lending Merchant discount 90,221 Income earned on merchant discount subsidy Miscellaneous income 35,730 Income earned on outsourcing fees Interest expense 63,880 Interest expense, service fees and facility agent fees on
interbank loans payable and interest-bearing notes Rent, light and water 35,022 Rentals and utility expenses from leased premises at
Metropolitan Park and Metrobank Plaza Computer related expense 174,838 Transaction processing charges Communications 401 Telephone and courier card delivery charges Distribution cost 60,708 Over-the-counter charges for the accommodation of
cardholder payments Security, messengerial and janitorial 20 Administrative expenses Miscellaneous expense 4,973 Other membership and maintenance fees Significant Investor Cash and cash equivalents 32,112 Current and savings account, and foreign currency
deposits with annual interest rates of 0.1% Deposits 11,322,017 Withdrawals (11,367,425)
Accrued expense payable 1,050 Accrual of management and other professional fees Accrued interest payable 294 Accrued interest payable on interest-bearing notes Notes payable 818,166 Interest-bearing notes with interest rates ranging from
1.0% to 2.0% and terms of 1 to 3 years (gross of unamortized issuance cost)
Availments 4,675,400 Maturities (6,342,309)
Interest income 1 Interest earned on bank deposits Miscellaneous income 15,464 Income earned on leased office space at Metrobank Card
Center Interest expense 144,666 Interest expense, service fees and facility agent fees from
interbank loans payable and interest-bearing notes Affiliates Cash and cash equivalents 60,630 Current and savings account, and foreign currency
deposits with annual interest rates of 0.5% and 0.1%, respectively
Deposits 9,837,109 Withdrawals (9,824,672)
Interbank loans receivable – Overnight lending with an interest rate of 2.0% Placements 200,000 Maturities (200,000)
Accounts receivable 4,420 Accounts receivable from corporate credit card transactions
(Forward)
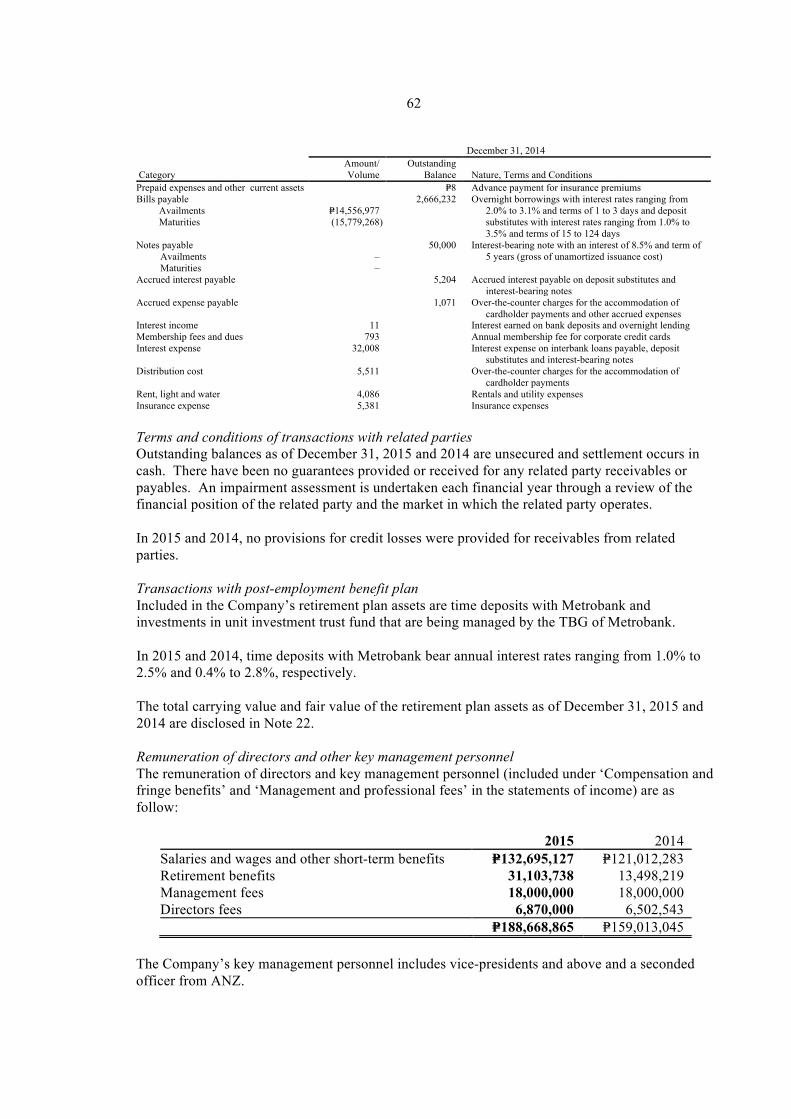
62
December 31, 2014
Amount/ Outstanding Category Volume Balance Nature, Terms and Conditions Prepaid expenses and other current assets P=8 Advance payment for insurance premiums Bills payable 2,666,232 Overnight borrowings with interest rates ranging from
2.0% to 3.1% and terms of 1 to 3 days and deposit substitutes with interest rates ranging from 1.0% to 3.5% and terms of 15 to 124 days
Availments P=14,556,977 Maturities (15,779,268)
Notes payable 50,000 Interest-bearing note with an interest of 8.5% and term of 5 years (gross of unamortized issuance cost) Availments –
Maturities – Accrued interest payable 5,204 Accrued interest payable on deposit substitutes and
interest-bearing notes Accrued expense payable 1,071 Over-the-counter charges for the accommodation of
cardholder payments and other accrued expenses Interest income 11 Interest earned on bank deposits and overnight lending Membership fees and dues 793 Annual membership fee for corporate credit cards Interest expense 32,008 Interest expense on interbank loans payable, deposit
substitutes and interest-bearing notes Distribution cost 5,511 Over-the-counter charges for the accommodation of
cardholder payments Rent, light and water 4,086 Rentals and utility expenses Insurance expense 5,381 Insurance expenses
Terms and conditions of transactions with related parties Outstanding balances as of December 31, 2015 and 2014 are unsecured and settlement occurs in cash. There have been no guarantees provided or received for any related party receivables or payables. An impairment assessment is undertaken each financial year through a review of the financial position of the related party and the market in which the related party operates. In 2015 and 2014, no provisions for credit losses were provided for receivables from related parties.
Transactions with post-employment benefit plan Included in the Company’s retirement plan assets are time deposits with Metrobank and investments in unit investment trust fund that are being managed by the TBG of Metrobank. In 2015 and 2014, time deposits with Metrobank bear annual interest rates ranging from 1.0% to 2.5% and 0.4% to 2.8%, respectively. The total carrying value and fair value of the retirement plan assets as of December 31, 2015 and 2014 are disclosed in Note 22. Remuneration of directors and other key management personnel The remuneration of directors and key management personnel (included under ‘Compensation and fringe benefits’ and ‘Management and professional fees’ in the statements of income) are as follow:
2015 2014
Salaries and wages and other short-term benefits P=132,695,127 P=121,012,283 Retirement benefits 31,103,738 13,498,219 Management fees 18,000,000 18,000,000 Directors fees 6,870,000 6,502,543
P=188,668,865 P=159,013,045
The Company’s key management personnel includes vice-presidents and above and a seconded officer from ANZ.

63
There is no agreement between the Company and any of its directors and key officers providing for benefits upon termination of employment, except for such benefits to which they may be entitled under the Company’s retirement plan.
Regulatory Reporting In the ordinary course of business, the Company has various transactions with its affiliates and with certain DOSRI. These transactions usually arise from normal banking activities such as lending, borrowing, deposit arrangements and trading of securities, among others. Under existing policies of the Company, these transactions are made substantially on the same terms as with other individuals and businesses of comparable risks. Under current banking regulations, the amount of individual loans to DOSRI, of which 70.0% must be secured, should not exceed the amount of their respective unencumbered deposits and book value of their respective investments in the Company. In the aggregate, loans to DOSRI generally should not exceed the lower of the Company’s total regulatory capital or 15.0% of the total loan portfolio.
On March 15, 2004, the BSP issued Circular No. 423 which provides for the amended definition of DOSRI accounts. The following table shows information relating to DOSRI loans as reported to the BSP:
2015 2014
Total outstanding DOSRI loans P=64,776,595 P=60,502,788 Percent of DOSRI loans to total loans 0.2% 0.2% Percent of unsecured DOSRI loans
to total DOSRI loans 1.4% 1.7% Percent of past due DOSRI loans to total
DOSRI loans 1.4% 1.7% Percent of nonperforming DOSRI loans
to total DOSRI loans 1.4% 1.5% Under BSP Circular No. 423, loans and other credit accommodations and guarantees secured by assets are considered as non-risk by the MB and therefore excluded from DOSRI individual and aggregate ceilings. BSP Circular No. 560 provides that the total outstanding loans, other credit accommodation and guarantees to each of the bank’s/quasi-bank’s subsidiaries and affiliates shall not exceed 10.0% of the net worth of the lending bank/quasi-bank, provided that the unsecured portion of which shall not exceed 5.0% of such net worth. Further, the total outstanding loans, credit accommodations and guarantees to all subsidiaries and affiliates shall not exceed 20.0% of the net worth of the lending bank/quasi-bank; and the subsidiaries and affiliates of the lending bank/quasi-bank are not related interest of any director, officer and/or stockholder of the lending institution, except where such director, officer or stockholder sits in the BOD or is appointed officer of such corporation as representative of the bank/quasi-bank. As of December 31, 2015 and 2014, the total outstanding loans, other credit accommodations and guarantees to each of the Company’s affiliates and certain DOSRI did not exceed 10.0% of the net worth of the Company, and the unsecured portion of which did not exceed 5.0% of such net worth.

64
25. Financial Performance
As of December 31, 2015 and 2014, the basic ratios which measure the financial performance of the Company are as follows:
2015 2014
Return on average equity 39.3% 40.1% Net interest margin on average earning assets 14.2% 14.7% Return on average assets 5.3% 5.8%
26. Commitments and Contingencies
In the normal course of operations, the Company has outstanding commitments to extend credit to credit cardholders which are not reflected in the financial statements. The Company does not anticipate losses that will materially affect its assets and liabilities as a result of these transactions. As of December 31, 2015 and 2014, credit cardholders’ unused credit limit amounted to P=98.0 billion and P=85.5 billion, respectively.
Various suits and claims by the Company against cardholders, and vice-versa remain unsettled as of December 31, 2015 and 2014. The estimates of the probable cost for the resolution of claims have been developed in consultation with the aid of the outside legal counsel handling the Company’s defense in these matters and are based upon analysis of potential results. Management does not believe that the outcome of these matters will affect the results of operations. It is probable, however, that future results of operations could be materially affected by changes in the estimates or in the effectiveness of the strategies relating to these proceedings.
27. Standards Issued but Not Yet Effective
The standards and interpretations that are issued, but not yet effective up to the date of issuance of the Company’s financial statements are disclosed below. The Company intends to adopt these standards and interpretations, if applicable, when they become effective. The adoption of the following standards and interpretations are not expected to have any significant impact on the financial statements of the Company. Deferred Philippine Interpretation IFRIC 15, Agreements for the Construction of Real Estate Effective January 1, 2016 • PFRS 10, Consolidated Financial Statements, and PAS 28, Investments in Associates and
Joint Ventures – Investment Entities: Applying the Consolidation Exception (Amendments) • PFRS 11, Joint Arrangements – Accounting for Acquisitions of Interests (Amendments) • PFRS 14, Regulatory Deferral Accounts • PAS 16, Property, Plant and Equipment, and PAS 41, Agriculture – Bearer Plants
(Amendments) • PAS 16, Property, Plant and Equipment, and PAS 38, Intangible Assets – Clarification of
Acceptable Methods of Depreciation and Amortization (Amendments)
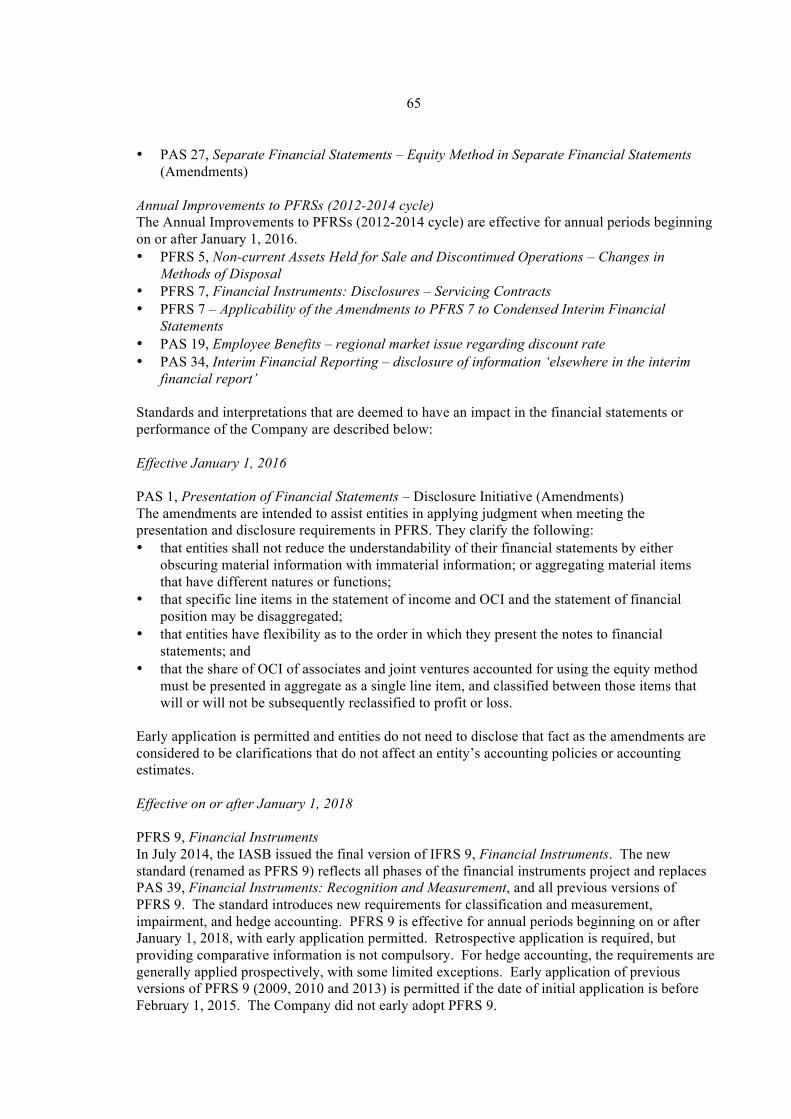
65
• PAS 27, Separate Financial Statements – Equity Method in Separate Financial Statements (Amendments)
Annual Improvements to PFRSs (2012-2014 cycle) The Annual Improvements to PFRSs (2012-2014 cycle) are effective for annual periods beginning on or after January 1, 2016. • PFRS 5, Non-current Assets Held for Sale and Discontinued Operations – Changes in
Methods of Disposal • PFRS 7, Financial Instruments: Disclosures – Servicing Contracts • PFRS 7 – Applicability of the Amendments to PFRS 7 to Condensed Interim Financial
Statements • PAS 19, Employee Benefits – regional market issue regarding discount rate • PAS 34, Interim Financial Reporting – disclosure of information ‘elsewhere in the interim
financial report’ Standards and interpretations that are deemed to have an impact in the financial statements or performance of the Company are described below:
Effective January 1, 2016 PAS 1, Presentation of Financial Statements – Disclosure Initiative (Amendments) The amendments are intended to assist entities in applying judgment when meeting the presentation and disclosure requirements in PFRS. They clarify the following: • that entities shall not reduce the understandability of their financial statements by either
obscuring material information with immaterial information; or aggregating material items that have different natures or functions;
• that specific line items in the statement of income and OCI and the statement of financial position may be disaggregated;
• that entities have flexibility as to the order in which they present the notes to financial statements; and
• that the share of OCI of associates and joint ventures accounted for using the equity method must be presented in aggregate as a single line item, and classified between those items that will or will not be subsequently reclassified to profit or loss.
Early application is permitted and entities do not need to disclose that fact as the amendments are considered to be clarifications that do not affect an entity’s accounting policies or accounting estimates. Effective on or after January 1, 2018 PFRS 9, Financial Instruments In July 2014, the IASB issued the final version of IFRS 9, Financial Instruments. The new standard (renamed as PFRS 9) reflects all phases of the financial instruments project and replaces PAS 39, Financial Instruments: Recognition and Measurement, and all previous versions of PFRS 9. The standard introduces new requirements for classification and measurement, impairment, and hedge accounting. PFRS 9 is effective for annual periods beginning on or after January 1, 2018, with early application permitted. Retrospective application is required, but providing comparative information is not compulsory. For hedge accounting, the requirements are generally applied prospectively, with some limited exceptions. Early application of previous versions of PFRS 9 (2009, 2010 and 2013) is permitted if the date of initial application is before February 1, 2015. The Company did not early adopt PFRS 9.
66
The adoption of PFRS 9 will have an effect on the classification and measurement of the Company’s financial assets and impairment methodology for financial assets, but will have no impact on the classification and measurement of the Company’s financial liabilities. The adoption will also have an effect on the Company’s application of hedge accounting and on the amount of its credit losses. Currently, the Company is in the process of developing its expected credit loss model in preparation for its adoption in 2018. International Financial Reporting Standard (IFRS) 15, Revenue from Contracts with Customers IFRS 15 was issued in May 2014 by the International Accounting Standards Board (IASB) and establishes a new five-step model that will apply to revenue arising from contracts with customers. Under IFRS 15, revenue is recognized at an amount that reflects the consideration to which an entity expects to be entitled in exchange for transferring goods or services to a customer. The principles in IFRS 15 provide a more structured approach to measuring and recognizing revenue. The new revenue standard is applicable to all entities and will supersede all current revenue recognition requirements under IFRS. Either a full or modified retrospective application is required for annual periods beginning on or after January 1, 2018. Early adoption is permitted. The Company is currently assessing the impact of IFRS 15 and plans to adopt the new standard on the required effective date once adopted locally. IFRS 16, Leases On January 13, 2016, the IASB issued its new standard, IFRS 16, which replaces International Accounting Standards (IAS) 17, the current leases standard, and the related Interpretations. Under the new standard, lessees will no longer classify their leases as either operating or finance leases in accordance with IAS 17. Rather, lessees will apply the single-asset model. Under this model, lessees will recognize the assets and related liabilities for most leases on their balance sheets, and subsequently, will depreciate the lease assets and recognize interest on the lease liabilities in their profit or loss. Leases with a term of 12 months or less or for which the underlying asset is of low value are exempted from these requirements. The accounting by lessors is substantially unchanged as the new standard carries forward the principles of lessor accounting under IAS 17. Lessors, however, will be required to disclose more information in their financial statements, particularly on the risk exposure to residual value. The new standard is effective for annual periods beginning on or after January 1, 2019. Entities may early adopt IFRS 16 but only if they have also adopted IFRS 15, Revenue from Contracts with Customers. When adopting IFRS 16, an entity is permitted to use either a full retrospective or a modified retrospective approach, with options to use certain transition reliefs. The Company is currently assessing the impact of PFRS 16 and plans to adopt the new standard on the required effective date once adopted locally.
28. Subsequent Events
On February 24, 2016, the BOD approved the net appropriation of retained earnings in the amount of P=5.3 billion for the following: 1. Appropriation of retained earnings as capital reserves amounting to P=3.7 billion. The
appropriation, in line with the capital management policy (Note 4), is aimed at strengthening the Company’s capital to comply with the debt to equity ratio of 7.5:1 per loan covenants and to meet the Capital Adequacy Ratio with due consideration of the impact of adopting the

67
expected credit loss model under PFRS 9. The amount includes re-appropriation of P=2.5 billion and additional appropriation of P=1.2 billion during the year.
2. Appropriation of retained earnings for cash dividend declaration amounting to P=1.6 billion to
be paid in 2016. 29. Approval of Release of Financial Statements
The accompanying comparative financial statements of the Company were authorized and approved for issuance by the BOD on February 24, 2016.
30. Supplementary Information Required Under RR 15-2010
In 2015, the Company reported and/or paid the following taxes which are included under ‘Taxes, duties and license fees’ in the statement of income:
GRT
P=647,730,648 Documentary stamp tax (DST)
135,005,736
Local taxes
25,043,875 Fringe benefit tax
5,921,402
License fee
4,910,838 Others
48,104,212
P=866,716,711
DST paid is related to bills payable and notes payable amounting to P=99.1 million and P=35.9 million, respectively.
Withholding Taxes As of December 31, 2015, total remittances and balance of withholding taxes are as follows:
Total remittances Balance Expanded withholding tax P=545,994,719 P=112,203,909 Withholding tax on compensation and benefits 195,279,177 10,287,609 Withholding value-added tax 4,954,391 1,237,077 Final withholding tax 266,851,807 123,862
P=1,013,080,094 P=123,852,457
