virtual and augmented reality for cultural computing and heritage
TRANSCRIPT
HAL Id: hal-00636621https://hal.archives-ouvertes.fr/hal-00636621
Submitted on 27 Oct 2011
HAL is a multi-disciplinary open accessarchive for the deposit and dissemination of sci-entific research documents, whether they are pub-lished or not. The documents may come fromteaching and research institutions in France orabroad, or from public or private research centers.
L’archive ouverte pluridisciplinaire HAL, estdestinée au dépôt et à la diffusion de documentsscientifiques de niveau recherche, publiés ou non,émanant des établissements d’enseignement et derecherche français ou étrangers, des laboratoirespublics ou privés.
Virtual and augmented reality for cultural computingand heritage: a case study of virtual exploration of
underwater archaeological sitesMahmoud Haydar, David Roussel, Samir Otmane, Malik Mallem
To cite this version:Mahmoud Haydar, David Roussel, Samir Otmane, Malik Mallem. Virtual and augmented reality forcultural computing and heritage: a case study of virtual exploration of underwater archaeologicalsites. Virtual Reality, Springer Verlag, 2011, 15 (4), pp.311–327. <10.1007/s10055-010-0176-4>.<hal-00636621>

Special Issue of Virtual Reality “Virtual Reality and Culture Technology” manuscript No.(will be inserted by the editor)
Virtual and augmented Reality for Cultural Computing andHeritage:a case study of Virtual Exploration of Underwater Archaeological Sites(preprint)
Mahmoud Haydar · David Roussel · MadjidMaıdi · Samir Otmane · Malik Mallem
the date of receipt and acceptance should be inserted later
Abstract The paper presents different issues dealing with both the preservation ofcultural heritage using Virtual Reality (VR) and Augmented Reality (AR) technolo-gies in a cultural context. While the VR/AR technologies are mentioned, the attentionis paid to the 3D visualization and 3D interaction modalities illustrated through threedifferent demonstrators: the VR demonstrators (Immersive and semi immersive) andthe AR demonstrator including tangible user interfaces. To show the benefits of theVR and AR technologies for studying and preserving cultural heritage, we investi-gated the visualisation and interaction with reconstructed underwater archaeologicalsites. The base idea behind using VR and AR techniques is to offer archaeologistsand general public new insights on the reconstructed archaeological sites allowingarchaeologists to study directly from within the virtual site and allowing the generalpublic to immersively explore a realistic reconstruction of the sites. Both activities arebased on the same VR engine but drastically differ in the way they present informa-tion and exploit interaction modalities. The visualisation and interaction techniquesdeveloped through these demonstrators are the results of the on-going dialogue be-tween the archaeological requirements and the technological solutions developed.
Keywords Underwater Archaeology ·Mixed Reality · Virtual Reality · AugmentedReality · Cultural Heritage · Cultural Computing
1 Introduction
Cultural Computing (CC) implies the application of computer technology in the fieldof culture, arts, humanities, or social sciences. It is an emerging field and the answerto the computability of culture is not clear as mentioned by Fei-Yue Wang in [41].For Tosa N et al. [38] the CC is a method for cultural translation that uses scientific
M. Haydar E-mail: [email protected] · D. Roussel E-mail: [email protected]. Maıdi E-mail: [email protected] · S. Otmane E-mail: [email protected]. Mallem E-mail: [email protected] IBISC - Universite d’Evry, 40 rue du Pelvoux, 91020 Evry, France

2
methods to represent the essential aspects of culture. An other definition of CC canbe given as a computer technology which can enhance, extend, and transform humancreative products and processes [11]. Virtual and Augmented Reality Technologieswill provide new means to create and transform culture. On one hand, VR technologyprovides us with the possibility of immersion within multimodal interactions (audio,video and haptics) to enhance user presence in digitalised culture (digital theatre;digital dance; digital music; digital heritage, etc.). On the other hand, AR or mixedreality technology provides us with the possibility to extend, transform and combinedifferent cultures in the same mixed environment (for example combine object fromdigital dance with others from digital music over space and time). However, we needto develop new interfaces and new interaction metaphors to allow 3D visualisationof culture and 3D interaction with different objects of such culture. In this paper wefocus our contribution on the domain of Archaeology by developing interfaces andnew interactions for both presentation of existing archaeological underwater sitesincluding interactions with artefacts in a cultural context as well as developing toolsfor preserving cultural heritage.
Most of the work mentioned in this paper is related to Research & Developmentperformed within the VENUS project (Virtual ExploratioN of Underwater Sites),sponsored by the European Community. The main goal of the VENUS project is toprovide scientific methodologies and technological tools for the virtual exploration ofdeep underwater archaeological sites. Such sites are generally out of reach for diversand requires new technologies and tools in order to be surveyed by archaeologists.The first step of the proposed methodology consists in performing a bathymetric andphotogrammetric survey of the site with remote operated or autonomous underwa-ter Vehicle. Bathymetric and photogrammetric data are then used to reconstruct theseabed while photogrammetric data are processed in the “Arpenteur” photogrammet-ric tool1 which measure points on artefacts (in our case Amphorae) from severalgeolocalised points of view in order to reconstruct artefacts shapes, dimensions andlocation which are then stored in an archaeological database for further examinationby archaeologists. Our role in the project consists in gathering the reconstructed ele-ments in an Immersive Virtual Environment (VE) providing tools for archaeologiststo survey such virtual sites in the most natural and easy way as possible. We havedeveloped several “demonstrators” in order to assess the benefits of Virtual and Aug-mented Reality (VR & AR) in the field of underwater archeology. All the demonstra-tors are based on the same VR engine described in section 3.2.1 but drastically differin the input and output modalities: The most simple demonstrator is called the “low-end” demonstrator and offers all the functionalities on a simple laptop. The VirtualReality demonstrators (respectively the semi-immersive and immersive demonstra-tors) uses large screen or head mounted stereo display to enhance immersion andallow interaction with 3D joysticks. Finally, the Augmented reality demonstrator fea-tures a real map of the site augmented with virtual elements where interaction isprovided through the use of various tangible tools related to the corresponding toolsof the VE.
1 “Arpenteur” photogrammetric tool is developed by Pierre Drap’s Team at LSIS, in Marseille, France[14]

3
2 Related work
Drap and Long mentioned in [15] that for many years Geographic Information Sys-tems have become common tools for archaeologists who see in this technology thealliance between the huge amounts of information collected in the field and graphicalrepresentation which supports the analysis. The GIS graphical representations mostoften originate from cartography, that is to say merging vectors, images, and symbol-ogy in 2D visualization tools. The old culture of chart reading is very useful in the useof GIS and probably one of the obstacles in the way of a truly 3D GIS. As a matter offact, even without the realistic representation, the strength of the GIS is linked to thesymbolic cartographic representation of the data offering a synthetic expression ofthe data analysis. If the 2D representation is sufficient to demonstrate the archaeolog-ical work concerning an urban scale or larger, applied to a period for which traces ofthe elevations do not exist, it is far from being the same when one is studying a build-ing, or in this present case, a ship. The need for a 3D representation is then of firstimportance and the global understanding of the study revolved around that kind ofrepresentation. For instance, Karma VI was an interface for ESRI’s spatial DatabaseEngine (which produced the arcGIS more recently) that supports powerful visual-ization, manipulation, and editing of standard GIS data in a VR environment [18],However, as mentioned by Eileen Vote in [40]: “these Immersive Virtual Reality ap-plications weren’t developed for archaeological inquiry and therefore don’t considerthe specific research tasks archaeologists need to perform”. Although efforts havebeen provided to turn underwater photogrammetric surveys into interactive virtualenvironments as mentioned in [15] which used VRML output for 3D visualisationpurposes, one the goals of the archaeological demonstrator within VENUS project isto transport archaeologists within such a reconstructed archaeological site but mostof all allow them to interact with the gathered data by connecting tools in the VE toan underlying archaeological database.
2.1 Immersive Virtual Reality
First of all, we need to establish a definition of Immersive Virtual Reality. A com-monly accepted definition of Virtual Reality have been provided by Rheingold in1991 as an experience in which a person is “surrounded by a three dimensionalcomputer-generated representation, and is able to move around in the virtual worldand see it from different angles, to reach into it, grab it, and reshape it”. [33]. Cruz-Neira et al. have proposed in [12] a definition more confined to the visual domain: “aVR system is one which provides real-time viewer-centered head tracking perspec-tive with a large angle of view, interactive control, and binocular display”. Howeverall definitions of VR agree on three distinctive features: (1) immersion, (2) interactionand (3) real time. Billinghurst defined in [5] three kinds of information presentationparadigms requiring increasingly complex head tracking technologies:
• In “Head-stabilised” information is fixed to the user’s viewpoint and doesn’tchange as the user changes viewpoint orientation or position. Any VR systemwhich doesn’t provide tracking is then considered as “Head-stabilised”. In the

4
Venus project, the low-end demonstrator running on a laptop with no trackingdevices could be considered as a “Head-stabilised” system.
• In “Body-stabilised” information is fixed relative to the user’s body position andvaries as the user changes viewpoint orientation, but not as they change position.The semi-immersive and immersive demonstrators are “Body-stabilised” systemssince head’s orientation changes viewpoint but motion within the virtual environ-ment is controlled with 3D joysticks rather than head’s position.
• And finally in “World-stabilised” information is fixed to real world locations andvaries as the user changes viewpoint orientation and position. The AugmentedReality demonstrator is typically a “world stabilised” system as position and ori-entation of the viewpoints needs to be computed in order to register the virtualenvironment over the real map. However, the immersive demonstrator could alsouse body motion in a “World-stabilised” way for small motion within the trackingspace and whereas “Body-stabilised” is considered when travelling through theenvironment with the 3D joysticks.
The ARCHAVE system created by Vote and Acevedo [40] and dedicated to thearchaeological analysis in VR of the excavated finds from the Great Temple site atPetra, Jordan, provided some interesting outcomes on the use of immersive VR forarchaeology: The system used a CAVE for display and was interfaced with an artefactdatabase containing over 250,000 catalogued finds. Concerning visualisation, usingan immersive CAVE allowed to examine the data in the context of a “life-size” repre-sentation; the immersive VR visualization gave the archaeologists the opportunity toexplore a site in a new and dynamic way and, in several cases enabled them to makediscoveries that opened new lines of investigation about the excavation. However (asmentioned by [2]) Archaeologists “consistently needed an easily accessible overviewof the model, much like the experience they obtain by flying high up over the virtualmodel, so they could study how the different artefacts were distributed over the entiresite”. This problem has been addressed by accessing a “Miniature model for a site-wide analysis” at any time during exploration. In [39] van Dam, Laidlaw and Simpsonpropose a review of experiments in immersive VR for scientific visualisation includ-ing the above mentioned ARCHAVE system. Clearly, visualisation by itself will notsolve the problem of understanding truly large datasets that would overwhelm bothdisplay and human vision system. They advocate a human-computer partnership thatuses algorithmic culling and feature-detection used to identify small fraction of thedata that should be visually examined in detail by the human. Immersive VR couldthen be a potent tool to let humans “see” patterns, trends and anomalies in their datawell beyond what they can do with conventional 3D desktop displays. The immer-sive surrounding context provides a kinesthetic depth perception that lets users betterapprehend 3D structures and spatial relationships. It makes size, distance, and anglejudgments easier since it is more like in being in the real world than looking throughthe screen of a desktop monitor to the world behind it; the advantages arise from thedifference between “looking at” a 2D image of a 3D environment on a conventionaldisplay screen and “being in” that 3D environment and basing spatial judgments rel-ative to one’s own moving body. Concerning 3D interactions, Hinckley et al. [21]presented a formal user study of interactive 3D Virtual sphere with multidimensional

5
input devices and found out that multidimensional input tasks presented a clear ad-vantage over conventional devices. The study provides clear evidence that test userswere able to take advantage of the integrated control of 3D to perform a task morequickly than with 2D input techniques.
2.1.1 Immersion with Head Mounted Displays
The main difference between the semi-immersive and the immersive demonstratoris the use of an Head Mounted Display (HMD) as the display device in the immer-sive demonstrator. We call it “fully” immersive as the HMD is tracked by an opticalA.R.T. [1] system so that the user can look around. Ruddle found in [35] that theability to look around with HMD allowed users to be less static in the environmentas they don’t have to stop travelling, take a look around and choose a new travel di-rection since looking around is allowed during travel: On average, participants whowere immersed in the virtual environment using the HMD navigated the environmenttwelve percent faster. The decreased time was attributed to the participants utilizingthe ability to “look around” while they were moving when immersed, as the partic-ipants spent eight percent more time stationary when using a desktop workstation.Bowman also studied human behaviour and performance between an HMD and afour-sided spatially immersive display (SID or CAVE) in [8]. In particular, he studiedusers’ preferences for real versus virtual turns in the virtual environment. The resultsindicated that participants have a significant preference for real turns in the HMD andfor virtual turns in the SID. This suggests that HMDs are an appropriate choice whenusers perform frequent turns and require spatial orientation. Even though HMD’sfield of view and resolution have drastically increased lately, one can not considerHMD’s field of view as larger than standing in front of large screen or several screens(in the case of a CAVE), however this drawback is easily compensated by the “lookaround” features provided by tracked HMDs: By tracking head orientation the userexperiences a hemispherical information surround - in effect a “hundred million pixeldisplay” and nowadays even more as Reichlen coined this term in [32].
2.2 Augmented Reality and Tangible Interfaces
Azuma et al. [3] define an AR system as a system which “supplements the real worldwith virtual (computer-generated) objects that appear to coexist in the same space asthe real world”. Moreover, the system should feature characteristics quite similar toVR features mentioned above such as:
• combines real and virtual objects in a real environment;• runs interactively (2), and in real time(3); and• registers (aligns) real and virtual objects with each other.
On one hand, Virtual reality technologies immerse the user in a synthetic environmentin which, he cannot see the real-world around him. On the other hand, augmented re-ality allows the user to see the real environment with superimposed virtual objects.Rather than replacing the real world, the user is immersed in an environment where

6
the virtual and real objects coexist in the same space. Interaction with the augmentedenvironment is performed with Tangible User Interfaces (TUIs) which use physicalobjects as tools to establish an interface with the virtual environment. The TUI pro-vides a natural and intuitive interface, a user can manipulate virtual 3D objects bysimply handling physical objects. A considerable amount of research has been donein the domain of TUIs and new Human-Computer Interaction approaches were pro-posed to improve the physical interaction with computational media. Kato et al. [24]implemented table-top AR environments with conventional markers and paddles forobject manipulation. They advocate designing the form of physical objects in theinterface using established Tangible User Interface design methods. Some of the tan-gible design principles include:
• Object affordances should match the physical constraints of the object to the re-quirements of the task.
• The ability to support parallel activity where multiple objects or interface ele-ments are being manipulated at once.
• Support for physically based interaction techniques (such as using object proxim-ity or spatial relations).
• The form of objects should encourage and support spatial manipulation• Support for multi-handed interaction.
So that in an AR interface the physical objects can further be enhanced in ways notnormally possible such as providing dynamic information overlay, context sensitivevisual appearance, and physically based interactions.
One of the most obvious benefits of Tangible User Interface pointed out by Katoet al. in [24] is that users do not need to learn any complicated computer interface orcommand set to use tangible interfaces.
3 Virtual and Augmented Reality for underwater archeology
Before starting to build virtual environments reflecting the surveys performed onwreck sites, a case study has been performed on a typical underwater archaeologi-cal survey and archaeologists were interviewed concerning the requirements of suchvirtual environments. Archaeologists are mainly interested in the cargo which leadsto determine the period of the wreck but also in the environment which could explainthe artefacts’ layout. A Full list of requirements was build concerning visualisation(full view and close range), navigation (free navigation, artefact’s based navigationor diver’s navigation) and interaction (Artefact’s individual data facts, inventory andartefacts statistics in terms of types, dimensions, locations and fragment status forbroken artefacts). These requirements were later transposed into a list of featuresimplemented in various ways within the different demonstrators.
Although all proposed technologies have been already used in other fields, andeven though computer graphics is a common tool to represent cultural heritage find-ings and results. Our goal is to introduce VR and AR technology as a working tool forarchaeologists allowing them to perform actual archaeological tasks rather than justa presentation tool as there is no previous such systems in underwater archaeology.

7
Within the framework of the VENUS project we propose two distinct forms forthe archaeological demonstrator featuring both VR-semi-immersive and VR-immersivetechnologies. The immersive surrounding context of VR provides a kinesthetic depthperception that lets users better apprehend 3D structures and spatial relationships. Itmakes size, distance, and angle judgments easier since it is more like being in thereal world than looking through the screen of a desktop monitor to the world behindit; the advantages arise from the difference between “looking at” a 2D image of a3D environment on a conventional display screen and “being in” that 3D environ-ment and basing spatial judgments relative to one’s own moving body. On the otherhand, by combining Augmented Reality techniques with Tangible User Interface el-ements, we can create interfaces in which users can interact with spatial data as easyas real objects. Tangible AR interfaces remove the separation between the real andvirtual worlds and so enhance natural interactions. The semi-immersive demonstra-tor is based on a large stereo display and 3D navigation and interaction are based on3D wireless joysticks (also called “flysticks”). The immersive demonstrator is basedon the same navigation and interaction devices but uses a tracked HMD to providecomplete surroundings to the user. And finally the Augmented Reality demonstratoris based on a camera tracking system associated with a see through HMD registeringthe users viewpoint and allowing interaction with tangible interfaces over a map ofthe site.
3.1 Tracking technologies
The tracking technology is an optical tracking from A.R.T. [1] using 2 infrared cam-eras (see Figure 6) for tracking unique patterns composed of retroreflective ballswhich could be used as input devices such as flysticks and handles or head trackeddevices such as LCD glasses, or HMD. Optical tracking allow users to wear or handleany wireless devices as long as they can be equipped with unique retroreflective ballspattern (as shown in Figure 1).
(a) A.R.T Trackingcamera
(b) Flystick (c) Tracked LCDglasses
(d) Tracked HMD
Fig. 1 Tracking devices

8
The A.R.T. system is capable of measuring position and orientation of severalpatterns at the same time (up to 64 balls) at a 60 Hz measure rate (54 Hz if LCDshutter glasses synchronisation is required). The achievable accuracy of the trackingsystem is 0.4 mm for position and 0.12◦ for orientation within a 3×3×3 m volume.However the average measured accuracy precision of the system is actually between0.5 and 2 mm for position and 0.3◦ for orientation due to slow decalibration of thesystem over several months, which could be easily corrected by a system recalibrationfrom time to time.
3.2 Virtual Reality demonstrators
We developed 2 versions of the VR application which uses different devices technol-ogy. The first version works with simple input/output devices (mouse, keyboard, andmonitor) in order to easily run the demonstrator without needing any specific devicesthat can be difficult to transport.
In the second version we employed more advanced visualisation and trackingdevices to offer a semi or complete immersive navigation and more natural interactionwith the environment.
3.2.1 Virtual Reality system description
This section presents the structure and the construction of virtual environment andthe corresponding virtual reality system.
3.2.1.1 Virtual Environment structure: All virtual environments for the VENUS projectare developed around the “OpenScenegraph” (OSG) open source high performance3D graphics toolkit for VE modelling and visualization [10]. The choice of OSGwas motivated by the need of a high level API abstracting rendering features forthe 3D objects, scene control and cameras views management, which is also flexibleenough to develop specially tailored visualisations and interactions techniques wher-ever they are necessary. The main structure of the VE developed for archaeologistscontains the various seabeds (large bathymetric seabed, and photogrammetric seabedwith textures) and the various artefacts (in our case amphorae) lying on the seabedand recorded in the database.
The construction of the VE is divided into 3 principal steps:
• Seabed: Seabed meshes are loaded from an XML file containing 3D vertices andtexture information.
• Artefacts: An initial request to the database is performed to retrieve artefacts para-meters such as location, orientation, status and artefacts models. Then registeredartefacts and markers 3D models are loaded.
• Virtual Environment: These elements are placed in the virtual environment andnavigation and interaction managers are started. When 3D interaction devicesare available a connection to input devices is opened by using a VRPN server[37]. The interaction manager handles inputs and eventually sends queries to thedatabase.

9
3.2.1.2 Virtual Reality System Architecture: The architecture of the VR system iscomposed of a database containing all required data such as: photos, artefacts pa-rameters, 2D/3D objects location, etc (see Figure 2). The archaeological databasecontains the pictures taken during the survey and the 2D and 3D points of artefactslying on the seabed measured during the photogrammetry process. When these pointsare labelled to belong to a recognized artefact type, an actual artefact could then bereconstructed in terms of location, orientation and size and all these artefacts’ para-meters are stored in the database. Therefore, such a database could be shared betweenthe photogrammetric reconstruction process and the virtual environments designed toimmersively explore the site. In order for VE users to extract and study properties ofthe cargo (registered artefacts), users interaction with artefacts are translated into SQLqueries sent to the database and results are displayed through selections or numericdata display depending on the nature of the results. Queries to the database can con-cern partial or complete inventory, metrology statistics (average size, similar sets,...)or spatial relationships between artefacts.
User Interaction2D Display
3D Display
VR Module
DATABASE
Metrology Informations
Coordinates informations
…
Sites Models
Pictures
Objects Models QueriesRefs
SeabedFragments
XML file
Artefacts
SeabedTextured
Fig. 2 VR system architecture
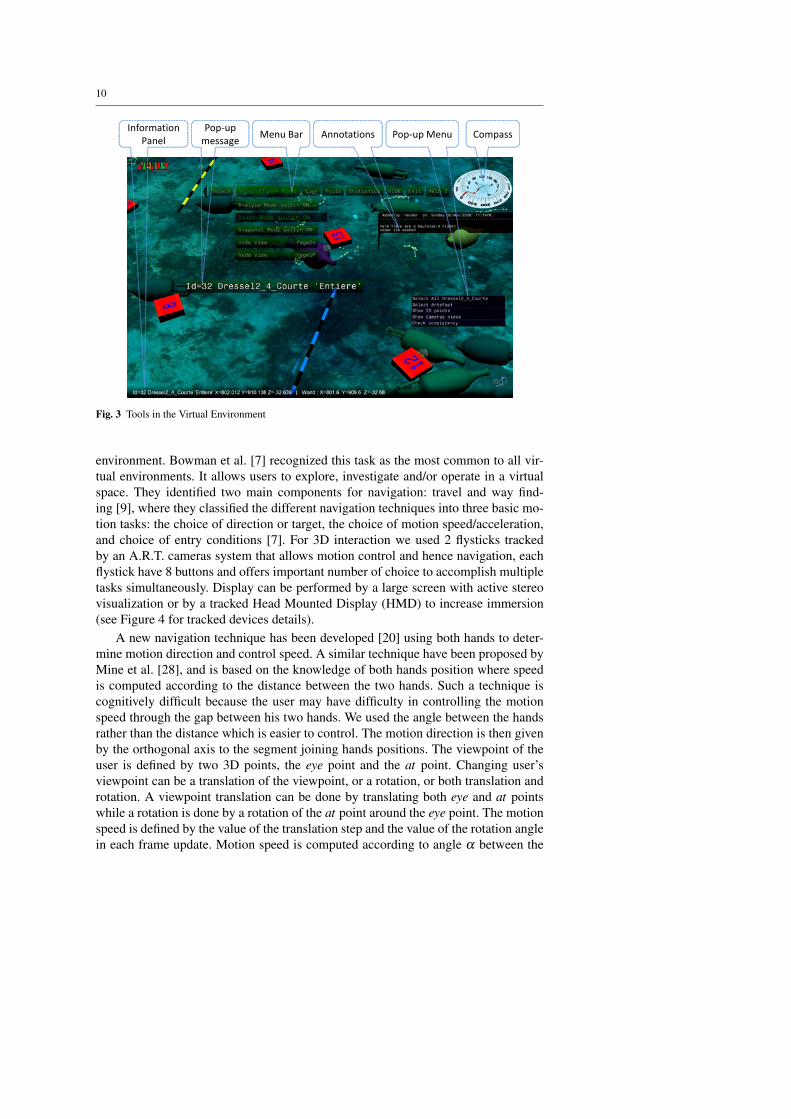
3.2.1.3 Virtual Reality Interface and Interactions: The VE interface is composed ofmany classical tools: menu bar, information panel and popup message. The menu barcontains multiple submenus, the first menu is a selection menu which proposes visu-alization/selection of any type of artefacts registered in the site, the second menu al-lows to switch between analysis and exploring navigation mode, the third one allowsto hide some parts (terrain) of the VE to highlight others parts (artefacts). Otherwise,several classical menus are provided by the interface, like, font and colour manager,help and exit menu. The information panel displayed on the bottom of the VE (Fig-ure 3) shows information about objects loading progress, user location or interactionresult (e.g. amphora Id 21 was selected). A 3D popup message is displayed whenthe mouse passes over an object (or when the flystick selection ray casts an objects)showing the type of the objects or other information on selected objects.
3D interactions with a Virtual environment can be divided into three principaltasks: Navigation, Selection and Manipulation. The Navigation or the control of theuser’s viewpoint is the most important task and most used when using the virtual
10
Information Panel
Pop-up message Pop-up Menu CompassMenu Bar Annotations
Fig. 3 Tools in the Virtual Environment
environment. Bowman et al. [7] recognized this task as the most common to all vir-tual environments. It allows users to explore, investigate and/or operate in a virtualspace. They identified two main components for navigation: travel and way find-ing [9], where they classified the different navigation techniques into three basic mo-tion tasks: the choice of direction or target, the choice of motion speed/acceleration,and choice of entry conditions [7]. For 3D interaction we used 2 flysticks trackedby an A.R.T. cameras system that allows motion control and hence navigation, eachflystick have 8 buttons and offers important number of choice to accomplish multipletasks simultaneously. Display can be performed by a large screen with active stereovisualization or by a tracked Head Mounted Display (HMD) to increase immersion(see Figure 4 for tracked devices details).
A new navigation technique has been developed [20] using both hands to deter-mine motion direction and control speed. A similar technique have been proposed byMine et al. [28], and is based on the knowledge of both hands position where speedis computed according to the distance between the two hands. Such a technique iscognitively difficult because the user may have difficulty in controlling the motionspeed through the gap between his two hands. We used the angle between the handsrather than the distance which is easier to control. The motion direction is then givenby the orthogonal axis to the segment joining hands positions. The viewpoint of theuser is defined by two 3D points, the eye point and the at point. Changing user’sviewpoint can be a translation of the viewpoint, or a rotation, or both translation androtation. A viewpoint translation can be done by translating both eye and at pointswhile a rotation is done by a rotation of the at point around the eye point. The motionspeed is defined by the value of the translation step and the value of the rotation anglein each frame update. Motion speed is computed according to angle α between the

11
Fig. 4 VE devices technology
hands. The rotation direction and speed is given by the angle β between the segmentjoining hands positions and the horizontal axis (Figure 5).
2P
1P
Y
Y ′
X ′Xy∆C
x∆β
β
α
1Pr 2Pr
1Pr2Pr
α
Fig. 5 Speed and new position computing
Considering C(xc,yc,zc) the center of [−−→P1P2] as the origin of the coordinate sys-tem. All coordinates can be computed in the new coordinate system by a simpletranslation T (xc,yc,zc). Having the position of the two points eye(xeye,yeye,zeye) andat(xat ,yat ,zat) of the current frame view f (Camera position), and having the posi-tions P1(xp1 ,yp1 ,zp1) and P2(xp2 ,yp2 ,zp2) of the hands (flysticks’ positions) and theangles rp1 and rp2 between the hands and the
−−→XX ′ axis, we need to compute the two
new positions eye′(xeye′ ,yeye′ ,zeye′) and at ′(xat ′ ,yat ′ ,zat ′) of the new frame view f ′.We define the coefficients, St ,Sr,St.max,Sr.max as the translation speed, rotation speed,max motion speed and max rotation speed respectively. St.max,Sr.max are predefinedaccording to application needs. The values of α and β are given by the equations:
{α = rp2 − rp1
β = arcsin(
∆y|P1P2|
)where ∆y = yp2 − yp1
(1)

12
Then St and Sr are defined as follows:
i f |α| ≤ 10◦ ⇒ St = St.maxi f |α| ≥ 140◦ ⇒ St = 0i f |β | ≤ 10◦ ⇒ Sr = 0i f |β | ≥ 60◦ ⇒ St = 0
Otherwise,{St =
(1− α
140
)∗St.max
Sr = β
90 ∗Sr.max(2)
The β value is limited between −90◦ and 90◦, the rotation direction is definedby the sign of β . The rotation is clockwise when β is negative and anticlockwisewhen β is positive. To avoid the motion noise, due to user hands shaking, we definea noise angle value for rotation and translation. When β is between−10◦ and 10◦ weconsider that motion is a pure translation and the rotation speed is null, whenever α
is between −10◦ and 10◦ the translation speed is considered as maximal. The valuesof the new two points positions eye′(xeye′ ,yeye′ ,zeye′) and at ′(xat ′ ,yat ′ ,zat ′) are givenby the equations:
first we apply the rotation Sr around the point eye :
xat ′ = xeye +((xat − xeye)∗ cosSr + (yat − yeye)∗ sinSr)
yat ′ = yeye +((yat − yeye)∗ cosSr − (xat − xeye)∗ sinSr)
zat ′ = zat
(3)
Then we apply the translation:
xeye′ = xeye + St ∗ sinθ
yeye′ = yeye + St ∗ cosθ
zeye′ = zeye
xat ′ = xat1 + St ∗ sinθ
yat ′ = yat1 + St ∗ cosθ
zat ′ = zat1
(4)

13
Where θ is the camera rotation around the−→ZZ′ axis of the viewer’s coordinate system.
We multiply by θ to overlay the camera and the viewer coordinate system.
3.2.2 Virtual Reality demonstrators setup
3.2.2.1 Semi - immersive demonstrator setup: The semi-immersive demonstrator (seefigure 6) allows a human-scale representation of the virtual environment with a si-multaneous navigation and interaction. It mimics the divers’ paradigm and hencerecreates but also enhance the diving process by allowing user interaction with thedata collected on the cargo. Several archaeologists can easily share the same immer-sion level to collaborate in front of the large screen and benefit from the stereo view.However, only one stereo viewpoint could be modified on the display according to atracked head position.
The semi-immersive demonstrator uses the Evr@ platform at UEVE featuring alarge screen (3.2×2.4 m) allowing a user standing 1.5 m away from the screen to ex-perience a 94◦ horizontal field of view and a 77◦ vertical field of view. Navigation andinteraction through the Virtual Environment are controlled by one or two flysticks.
(a) (b)
Fig. 6 Semi-immersive demonstrator setup
3.2.2.2 Immersive demonstrator setup: The immersive demonstrator takes up mostof the semi-immersive demonstrator’s features such as life-size stereo viewing, si-multaneous navigation and interaction but adds the look around capability whichhas proved to enhance users’ orientation and mobility within the virtual environment(see [35] and [8]).
The same tracking technologies as in the semi-immersive demonstrator is usedbut a Head Mounted Display (HMD) is used for viewing the Virtual Environment.The chosen NVisor helmet offers a 50◦ Field of view with a 100% overlap betweeneach eye display, hence ensuring a complete stereo display with a double 1280×1024resolution (see figure 7).
From a larger point of view, such a HMD with “see-through” capabilities couldalso be used in outdoor environments such as terrestrial archaeological site as the one

14
Fig. 7 Immersive demonstrator setup
reported by Drap et al. in [16]. However, in this case, another kind of localisationsensors are required, such as the ones developed for the RAXENV2 Project [42].
3.3 Augmented Reality demonstrator
Since archaeologists interest is mainly focused on the nature of the cargo one of thefirst feedbacks from archaeologists concerning VR demonstrators was that immersivenavigation didn’t provide much help to archaeological tasks in opposition to generalpublic concerns where immersive navigation provides a deeper experience of a site.This observation lead us to propose an augmented map based navigation paradigmsuch as the “World in Miniature” proposed by (Stoakley et al., [36]) and later appliedto Augmented Reality (Bell et al. [4]) which provides a much more familiar interfaceto archaeologists. Indeed, archaeologists have more ease working with maps wherethey can see the real world rather than a totally immersive environment in which it isdifficult to be localized. Moreover, the Augmented Reality paradigm offer the oppor-tunity to introduce a tangible interface (Ishii and Ullmer [22]; Poupyrev et al. [30]) tothe tools developed in the VR demonstrator for archaeologists. These elements leadto the definition of a new demonstrator for archaeologists: AR Venus.
In AR Venus, archaeologists use a real map representing the deep underwater site.AR Venus proposes to enrich this environment and complete the real-world percep-tion by adding synthetic elements to it rather than to immerse the archaeologist ina completely simulated artificial world. AR Venus provides an easy tool to interactwith the real-world using tangible interface (in our case physical objects equippedwith visual targets) to select and manipulate virtual objects by using a pose estima-tion algorithms to display artefacts models at the right location on the 2D map. Usersneed to wear special equipment, such as “see through” head mounted display, to seethe map, augmented in real time with computer-generated features (see Figure 8(a)).
2 http://raxenv.brgm.fr/

15
(a) The AR VENUS system (b) Pose estimation and overlay process
Fig. 8 The AR VENUS system and Pose estimation.
3.3.1 3D map overlay
The first step in AR Venus is to project the 3D models of the seabed on the real 2Dmap using a system of visual markers identification and a pose estimation algorithm.For this visual tracking module, we used a simple webcam for tracking visual markersmade up with printed 60×60 mm black and white fiducials. The tracking algorithmcomputes the real camera position and orientation relative to the physical markersin real time and also identify the content of the fiducial as a unique identifier (seeFigure 8(b)). Some fiducials are stuck on the real map in order to compute the poseof the virtual environment over the real map whereas others are used to interact.
We used OSGART library to identify targets and overlay the 3D models on thereal scene. OSGART has been designed to provide an easy bi-directional transitionfrom VR to AR [26] by integrating ARToolkit [23] within OpenSceneGraph. Thetracking library finds all squares in the binary image. For each square, the patterninside the square is captured and matched to some pre-trained pattern templates. Thesquare size and pattern orientation are used to compute the position of the camera rel-ative to the physical marker, hence, the pose accuracy mostly depends on the markersize. Figure 8(b) shows the different steps of pose estimation algorithm (also calledregistration).
3.3.2 Virtual objects registration
We used single and multiple targets with different scale to improve the tracking sta-bility and accuracy. We started our tests using a single marker. The obtained resultswith a single marker were not accurate and we noticed a large shift between the vir-tual model and the real one represented on the 2D map. The size ratio between thesmall target and the large map didn’t provide a correct registration, which led us aftertrying a larger target to consider a multitarget tracking approach since these targetsare lying on the same map plane.

16
3.3.3 Tangible interface
We saw in the previous section that static fiducials are used to register the virtualenvironment and artefacts, however, other targets can also be moved around the mapand associated with virtual tools allowing the users to interact with the augmentedenvironment using Tangible User Interfaces (TUI). Many research work have beendone in this field over the last years [24], several interfaces have been developedfor manipulation and exploration of digital information [19] using physical objectsas interaction tools in virtual environments [22]. Several moving targets have beenassociated with virtual tools. These tools are activated whenever the camera identifiestheir corresponding patterns and discarded when they aren’t visible anymore. such as:
• selection tool: The selection tool represents two sides of the same tangible “pal-let” or “tile” as denoted by Billinghurst & Kato in [6]. The first side is used totrigger nearby object search and when an object is selected we can then flip tothe other side for a closer inspection of the selected object (Figure 9(a)). Trackingof the selection tile is important in this case since objects are selected when thetile’s target is close the object of interest. The selection of amphorae is performedusing a probe target and the selected object stays attached to the selection probefor closer investigation. The developed technique consists in computing distancebetween the marker centre attached to the selection tool and the centre of am-phorae got from the archaeological database. For unselecting, another marker isattached in the other side of the selection probe, when this marker is visible, theamphorae is deselected and placed into its original position on the map.
• measuring tool: the measuring tool allows to measure distances (expressed in theVE dimensions) between two specific targets moved around on the real map (seeFigure 9(b)).
• inventory tool: Whenever the inventory tool target appears to the tracking cam-era, a virtual site inventory (in terms of artefacts’ type and occurences) is attachedabove the target and can be placed on the map or handled for a closer inspection(see Figure 9(c)).
• grid tool: The grid tool allows to display a north-south oriented regular grid onthe site (see Figure 9(d)). The grid target uses the same principle of a two sidedtile used for selection tool in order to provide two different grid steps. Trackingthe targets on the tile is not important in this case as only target recognition isused to trigger the two possible grids.
4 Evaluation
Some recent work [17] [13] addressing the evaluation problems in VR and AR sys-tems confirm the domination of Objective and Subjective Measurement. Objective

17
(a) selection tool (b) measure tool
(c) inventory tool (d) grid tool
Fig. 9 AR Venus tools
and Subjective measurements are measurements methods used in empirical evalu-ations. Usually we found these measurements in many evaluations [27], [25], [8].Objective measurements are studies that include objective measurements such as:completion times, accuracy/error rates and generally, statistical analyses are made onthe measured variables. Subjective measurement studies users using questionnaires.They also employ statistical analysis of the results or a descriptive analysis.
4.1 Subjective evaluation
The functionalities offered by the various demonstrators have been evaluated by ar-chaeologists during a workshop. The goal of the workshop was to present the al-ready developed features to archaeologists but also to trigger feedbacks by havingthe archaeologists actually experiment the demonstrator by themselves. After a shortpresentation of the goals and means of the archaeologists demonstrators and a quickdemo of the main features each of the archaeologists were asked to perform the fol-lowing tasks:
• Artefacts group selection.• Individual artefact selection.• Circular area selection.• Distance measuring between two artefacts.• Add an annotation on the site, modify it then remove the annotation.• Switch between seabed display mode (regular→ grid→ topographic)

18
• Display snapshot locations and images related to an artefact.
The survey was conducted individually with 11 archaeologists on two laptopsrunning the low-end demonstrator. By the end of the test they were asked to fill in aquestionnaire dedicated to help us pointing what’s good and bad in the VR demon-strator for archaeologists.
The first questionnaire was about participant skills and habits concerning com-puter usage and more specifically the use of 3D and VR software as well as theircurrent state by the end of the test. The second questionnaire was about the usabilityof the archaeological demonstrator in terms of navigation, interaction, accessing thetools and displayed data. The third questionnaire referred to users’ satisfaction andallowed users to suggest improvements. The exploitation of these evaluation resultsis part of the validation of developed software as well as part of an iterative cyclemethodology. This workshop was a unique opportunity to get feedback from a largepanel of (well known) archaeologists.
The survey has been performed by 7 women and 4 men, aged between 31 and60 with an average of 43±10 years old, hence providing a rather senior researcherspanel. Most of them are using computers on a daily basis. More than half of the usershave already used 3D software and a bit less than a half of them already used virtualreality software.
4.1.1 Usability
Users were asked to rank the difficulty (on a 1 to 5 scale) of various aspects of thedemonstrator such as navigation, interaction, accessing tools and also rank whetherdata display associated to various selection methods were satisfying. Individual datafacts refers to the data sheet associated with a single selected object (as shown onFigure 11), type data facts refers to the information displayed by selecting all in-stances of a specific type of artefact (see also Figure 12) and Area data facts refers tothe information displayed during area based selection (see also Figure 13). Figure 10presents the assessments of these various topics.
The following analysis is based on the results of the questionnaires as well asarchaeologists’ comments during the test written down by the two experimenters.
4.1.1.1 Navigation: Navigation (whether free or guided by the artefacts) was consid-ered as easy (or very easy) by 64% of the users, however 36% gave marks between2 and 3 which tends to indicate they encountered some difficulty in navigating. Thismight explain the suggestions for new navigation modes (such as diver’s mode) wehave found in the possible improvements.
4.1.1.2 Interaction: Interaction marks features the same repartition as navigation,64% found it easy and 36% encountered some difficulties. Once again, this mightexplain the number of improvements requests concerning the “Interaction with arte-facts” feature (14 improvements requests out of 27).

19
Extremely easy27%Easy37%
Neutral27% Difficult9%Navigation(a)
Extremely easy18%Easy37%Quite easy9%
Neutral27% Difficult9%Interaction(b)Extremely easy9%
Easy55%Quite easy9%Neutral27% Tools access
(c)
Extremely satisfied9% Satisfied46%Neither satisfied nor dissatisfied27%Dissatisfied18%Individual Datafacts
(d)
Fig. 10 Usability summary
4.1.1.3 Tools access: Tools are mainly situated in the menu and were considered aseasy by a majority of 73% of the users; however 27% of them gave a mark of 3 andwould have appreciated a clear separation of tools and various options in the menu.
4.1.1.4 Individual data facts: Individual data facts presenting the data sheet of a se-lected artefact were considered as satisfactory by 55% of the users, however, this alsomeans that 45% of them were not satisfied or at least had not a good opinion of it.This also shows through the improvements request as 5 of them directly concerned“Individual data facts”. The comments made on this point focused on the numericalaspect of the information presented to the user (Location and statistics) whereas theywould have appreciated pieces of information like orientation and tilt or object visualreference (as displayed in classical artefacts catalogs such as the Dressel catalogue)which has been partially fulfilled by a new information panel (see Figure 11).
4.1.1.5 Type data facts: Type data facts presents the exact opposite repartition as45% of the users only were satisfied by the information displayed by selecting types.Once again the numerical nature of the information panel (see Figure 12) could havebeen enhanced by showing an instance (the 3D model) of the selected type in the in-formation panel. Besides, selecting types leads to a viewpoint change encompassingall instances of the selected type as well as a highlight of the selected artefacts. As amatter of fact, this highlighting could have easily been confused with fracture lineson artefacts (see also Figure 12) representing broken artefacts at the moment and this

20
Fig. 11 Individual Data facts
might also explain why the improvement request concerning a “better enhancementof selected artefacts” occurred 4 times in the survey.
Type data facts
Some selected artefactsSome brocken
artefacts
Fig. 12 Type data facts, selected artefacts and fracture lines
4.1.1.6 Area data facts: 55% of the users were satisfied by information panel dis-played during circular area selection featuring the population of selected artefactsshowing artefacts’ type and occurrences (see Figure 13). But 45% had no opinion ofwere dissatisfied once again by the numerical nature of the information panel whichcould have been enhanced with artefacts type silhouettes.
This subjective evaluation performed with archaeologists allowed us to improvethe core functionalities of the demonstrators and also add some new features to thevirtual environment such as “diver’s navigation” mode which allow archaeologists toreview the site and measured artefacts just like divers would during the photogram-metric survey.

21
Fig. 13 Area data facts
4.2 Objective evaluation
In addition to the subjective evaluation mentioned above, we also evaluated the ben-efits of immersive VR versus non immersive by comparing users performances withthree distinct forms of the VR demonstrators: in our case the low-end demonstrator,the semi-immersive demonstrator and the immersive demonstrator.
4.2.1 Evaluation setup
The evaluated platforms are:
• D1: The low-end demonstrator (non-immersive), featuring only standard input/outputdevices such as keyboard, mouse and 19” monitor.
• D2: The Semi-immersive demonstrator, featuring large stereo screen display andtwo flysticks for navigation and selection tasks. Snowplough is used as a naviga-tion metaphor with the flysticks (as exposed in 3.2.1.3)
• D3: The immersive demonstrator, featuring a tracked VR helmet allowing to lookaround and the same two flysticks.
Navigation on demonstrators (D2) and (D3) uses the same technique and sameinterface.
4.2.2 Evaluation protocol and experiment
In this experiment a navigation task was carried out on all three platforms. Fifteenvolunteers (six women and nine men) performed this experiment. All of them wereright handed. Each subject was given pre-test along with a short briefing. The subjectswere divided into 3 groups. Each group performed the experiment using demonstra-tors in the following order: D1, D2 and D3 for group 1, D2, D3 and D1 for group 2and finally D3, D1 and D2 for group 3. Each group carried out four tests of each taskand for each demonstrator. The evaluation is based on task completion time for thenavigation.

22
4.2.2.1 Task completion time: Navigation task consisted in reaching a sequence ofhotspots within the virtual site (progressively appearing and disappearing once theyhave been reached).
The average completion time for this task was 99±26 seconds with the immersivedemonstrator, 120±43 seconds with the semi-immersive demonstrator and 187±81seconds with the non-imersive demonstrator with a significant ANOVA (P= 0.000185<< 0.01). These results (presented in figure 14) show that immersive conditionshave an influence on navigation task performance and the immersive demonstratorprovided the best navigation task performances.
050100150200250300
Immersive Semi-immersive Non-immersiveTime (sec)
Conditions
Mean task completion time for the navigation
Standard deviationMean navigation time
Fig. 14 Navigation task completion time under various conditions
4.2.2.2 User learning: Learning is defined here by the improvement of group perfor-mance during task repetitions. Figure 15 shows user learning during the navigationtask for various conditions (immersive, semi-immersive and non-immersive demon-strators). The results show that using immersive condition, the average completiontime was 123±35 seconds during the first test and 81±20 seconds during the fourthtest. The average completion time under semi-immersive condition was 147± 71seconds during the first test, and 101± 32 seconds during the fourth test. Similarly,the average completion time under non-immersive condition was 242±115 secondsfor the first test and 125± 54 seconds for the last test. These results show a nav-igation performance improvement of 34.22%, 31.09% and 48.24% for immersive,semi-immersive and non-immersive conditions respectively.
In this section we introduced the first results of evaluation of the three demon-strators (Immersive, semi-immersive and non-immersive). Two types of evaluationhave been accomplished: objective and subjective evaluations. We compared prin-cipally the influence of the immersion type with the navigation and selection tasksperformances. Results show that the performances for the navigation task are clearlybetter with the immersive demonstrator. However, the performances for the selectiontask are better with the non-immersive. It is necessary to note that the preliminaryobjective evaluation introduced here is based on task completion time performancemeasurements. Other measurements (selection and/or navigation errors) can be con-sidered in the future. In the same way, the use of the virtual guides [34], [29] and [31]

23
050100150200250300
Test 1 Test 2 Test 3 Test 4Time (sec)
Tests
Navigation Learning curve
ImmersiveSemi-ImmersiveNon-Immersive
Fig. 15 Illustration of user learning for various conditions in navigation task
as assistance tools for navigation and in selection could also contribute to improve 3Dinteraction tasks performances. Some other evaluations concerning the AugmentedReality (AR) demonstrator still need to be performed. We will attempt to study theinfluence of this type of immersion on navigation and selection task performancesand to compare it with the three previous demonstrators.
5 Conclusion and perspectives
We have described an attempt to introduce VR and AR technologies in the field ofunderwater archaeology as a working tool rather than the usual presentation tool.Pursuing this goal we tried to apply various levels of immersion and interaction fa-cilities to a virtual environment designed to allow archaeologists to review and studyunderwater wreck sites possibly unreachable to divers reconstructed in terms of envi-ronment (seabed) and content (cargo) only through bathymetric and photogrammetricsurveys. Several demonstrators using VR and AR technologies were build around thisenvironment allowing us to start evaluating the benefits of these technologies with ar-chaeologists.
A first subjective evaluation with archaeologists allowed us to review and amendthe features of the virtual environment and also introduce new features resulting fromthis first “handover” and enter the iterative cycle of refining the features. In a sim-ilar way, preliminary evaluations have been performed to compare immersive andnon-immersive VR demonstrator in terms of performance gain in order to assess thebenefits of immersive VR. However deeper evaluation needs to be performed as wellas an evaluation of the AR demonstrator against the other ones.
Using these innovative methods of research and dissemination can capture theimagination of the general public and generate interest not only in the historical aspectof archaeology but also in the work and expertise that goes into supporting thesearchaeological surveys.
Acknowledgements VENUS is partially supported by the European Community under project VENUS(Contract IST-034924) of the “Information Society Technologies (IST) programme of the 6th FP for RTD”.

24
The authors are solely responsible for the content of this paper. It does not represent the opinion of theEuropean Community, and the European Community is not responsible for any use that might be made ofdata appearing therein.
References
1. Advanced realtime tracking (2009). URL http://www.ar-tracking.de/ accessed March 20092. Acevedo, D., Vote, E., Laidlaw, D.H., Joukowsky, M.S.: Archaeological data visualization in vr:
analysis of lamp finds at the great temple of petra, a case study. In: Proceedings of the 12th IEEEconference on Visualization (VIS ’01), pp. 493–496. IEEE Computer Society, Washington, DC, USA(2001). URL http://graphics.cs.brown.edu/research/sciviz/archaeology/archave/
3. Azuma, R., Baillot, Y., Behringer, R., Feiner, S., Julier, S., MacIntyre, B.: Recent advances in aug-mented reality. IEEE Computer Graphics and Applications 21(6), 34–47 (2001)
4. Bell, B., Hollerer, T., Feiner, S.: An annotated situation-awareness aid for augmented reality. In: UIST’02: Proceedings of the 15th annual ACM symposium on User interface software and technology, pp.213–216. ACM, New York, NY, USA (2002)
5. Billinghurst, M., Bowskill, J., Dyer, N., Morphett, J.: An evaluation of wearable information spaces.In: VRAIS ’98: Proceedings of the Virtual Reality Annual International Symposium, p. 20. IEEEComputer Society, Washington, DC, USA (1998)
6. Billinghurst, M., Kato, H., Poupyrev, I.: Collaboration with tangible augmented reality interfaces.In: HCI ’2001 : International Conference on Human Computer Interaction. New Orleans, LA, USA(2001)
7. Bowman, A., Kruijff, E., Laviola J. Poupyrev, I.: 3D User Interfaces : Theory and Practice. AddisonWesley Longman Publishing Co., Inc., Redwood City, CA, USA (2005)
8. Bowman, D.A., Datey, A., Ryu, Y.S., Farooq, U., Vasnaik, O.: Empirical comparison of human be-havior and performance with different display devices for virtual environments. In: Proceedings ofthe Human Factors and Ergonomics Society Annual Meeting (HFES’ 02), pp. 2134–2138. HumanFactors and Ergonomics Society (2002)
9. Bowman, D.A., Koller, D., Hodges, L.F.: Travel in immersive virtual environments: An evaluation ofviewpoint motion control techniques. In: VRAIS ’97: Proceedings of the 1997 Virtual Reality AnnualInternational Symposium (VRAIS ’97), p. 45. IEEE Computer Society, Washington, DC, USA (1997)
10. Burns, D., Osfield, R.: Open scene graph a: Introduction, b: Examples and applications. In: VR ’04:Proceedings of the IEEE Virtual Reality 2004, p. 265. IEEE Computer Society, Washington, DC, USA(2004)
11. The cultural computing program (2009). URL http://cultural.cs.uiuc.edu/whatis.html accessed April2009
12. Cruz-Neira, C., Sandin, D., DeFanti, T.: Surround-screen projection-based virtual reality: the designand implementation of the cave. In: Proceedings of the 20th annual conference on Computer graphicsand interactive techniques, pp. 135–142. ACM New York, NY, USA (1993)
13. Domingues, C., Otmane, S., Davesne, F., Mallem, M.: Creating 3d interaction technique empiricalevaluation with the use of a knowledge database of interaction experiments. In: Human SystemInteractions, 2008 Conference on, pp. 170–175 (2008)
14. Drap, P., Grussenmeyer, P.: A digital photogrammetric workstation on the web. Journal of Photogram-metry and Remote Sensing 55(1), 48–58 (2000). URL http://www.arpenteur.net
15. Drap, P., Long, L.: Towards a digital excavation data management system: the ”grand ribaud f” es-truscan deep-water wreck. In: VAST ’01: Proceedings of the 2001 conference on Virtual reality,archeology, and cultural heritage, pp. 17–26. ACM, New York, NY, USA (2001)
16. Drap, P., Nedir, M., Seinturier, J., Papini, O., Chapman, P., Boucault, F., Viant, W., Vannini, G., Nuc-cioti, M.: Toward a photogrammetry and virtual reality based heritage information system: A casestudy of shawbak castle in jordan. In: Joint event conference of the37th CIPA International Work-shop dedicated on e-Documentation and Standardisation in Cultural Heritage, 7th VAST InternationalSymposium on Virtual Reality, Archaeology and Cultural Heritage, 4th Eurographics Workshop onGraphics and Cultural Heritage and 1st Euro-Med Conference on IT in Cultural Heritage. (2006)
17. Dunser, A., Grasset, R., Billinghurst, M.: A survey of evaluation techniques used in augmented realitystudies. In: International Conference on Computer Graphics and Interactive Techniques. ACM NewYork, NY, USA (2008)

25
18. Germs, R., Van Maren, G., Verbree, E., Jansen, F.: A multi-view vr interface for 3d gis. Computers &Graphics 23(4), 497–506 (1999)
19. Gorbet, M.G., Orth, M., Ishii, H.: Triangles: tangible interface for manipulation and exploration ofdigital information topography. In: CHI ’98: Proceedings of the SIGCHI conference on Human factorsin computing systems, pp. 49–56. ACM Press/Addison-Wesley Publishing Co., New York, NY, USA(1998)
20. Haydar, M., Maıdi, M., Roussel, D., Mallem, M.: A new navigation method for 3d virtual environmentexploration. In: AIP (ed.) The 2nd Mediterranean Conference on Intelligent Systems and Automation(CISA 2009), vol. 1107, pp. 190–195. AIP, Zarzis (Tunisia) (2009)
21. Hinckley, K., Tullio, J., Pausch, R., Proffitt, D., Kassell, N.: Usability analysis of 3d rotation tech-niques. In: Proceedings of the 10th annual ACM symposium on User interface software and technol-ogy, pp. 1–10. ACM New York, NY, USA (1997)
22. Ishii, H., Ullmer, B.: Tangible bits: towards seamless interfaces between people, bits and atoms. In:CHI ’97: Proceedings of the SIGCHI conference on Human factors in computing systems, pp. 234–241. ACM Press, New York, NY, USA (1997)
23. Kato, H., Billinghurst, M., Blanding, B., May, R.: Artoolkit (technical report). Tech. rep., HiroshimaCity University (1999)
24. Kato, H., Billinghurst, M., Poupyrev, I., Imamoto, K., Tachibana, K.: Virtual object manipulation on atable-top ar environment. In: ISAR’ 00 : Proceedings of the International Symposium on AugmentedReality, pp. 111–119. Munich, Germany (2000)
25. Looser, J., Billinghurst, M., Grasset, R., Cockburn, A.: An evaluation of virtual lenses for objectselection in augmented reality. In: Proceedings of the 5th international conference on Computergraphics and interactive techniques in Australia and Southeast Asia, pp. 203–210. ACM New York,NY, USA (2007)
26. Looser, J., Grasset, R., Seichter, H., Billinghurst, M.: Osgart - a pragmatic approach to mr. In: In-ternational Symposium of Mixed and Augmented Reality (ISMAR 2006). Santa Barbara, CA, USA(2006)
27. McMahan, R., Bowman, D.: An empirical comparison of task sequences for immersive virtual envi-ronments. In: IEEE Symposium on 3D User Interfaces (2007)
28. Mine, M.R., Frederick P. Brooks, J., Sequin, C.H.: Moving objects in space: exploiting proprioceptionin virtual-environment interaction. In: SIGGRAPH ’97: Proceedings of the 24th annual conferenceon Computer graphics and interactive techniques, vol. 31, pp. 19–26. ACM Press/Addison-WesleyPublishing Co. (1997)
29. Otmane, S., Mallem, M., Kheddar, A., Chavand, F.: Active virtual guide as an apparatus for augmentedreality based telemanipulation system on the internet. In: Proceedings of the 33rd Annual SimulationSymposium, 2000. (SS 2000). IEEE Computer Society (2000)
30. Poupyrev, I., Tan, D.S., Billinghurst, M., Kato, H., Regenbrecht, H., Tetsutani, N.: Tiles: A mixedreality authoring interface. In: INTERACT 2001 Conference on Human Computer Interaction, pp.334–341. Tokyo, Japan (2001)
31. Prada, R., Payandeh, S.: On study of design and implementation of virtual fixtures. Virtual RealityJournal 13(2), 117–129 (2009)
32. Reichlen, B.: Sparcchair: A one hundred million pixel display. In: 1993 IEEE Virtual Reality AnnualInternational Symposium, 1993., pp. 300–307 (1993)
33. Rheingold, H.: Virtual Reality. Summit Books, London (1991)34. Rosenberg, L.: Virtual fixtures: perceptual tools for telerobotic manipulation. In: Proceedings of IEEE
virtual reality international symposium, pp. 76–82 (1993)35. Ruddle, R., Payne, S., Jones, D.: Navigating large-scale virtual environments: what differences occur
between helmet-mounted and desk-top displays? Presence: Teleoperators & Virtual Environments8(2), 157–168 (1999)
36. Stoakley, R., Conway, M.J., Pausch, R.: Virtual reality on a wim: interactive worlds in miniature.In: CHI ’95: Proceedings of the SIGCHI conference on Human factors in computing systems, pp.265–272. ACM Press/Addison-Wesley Publishing Co., New York, NY, USA (1995)
37. Taylor II, R.M., Hudson, T.C., Seeger, A., Weber, H., Juliano, J., Helser, A.T.: Vrpn: a device-independent, network-transparent vr peripheral system. In: VRST ’01: Proceedings of the ACMsymposium on Virtual reality software and technology, pp. 55–61. ACM, New York, NY, USA (2001)
38. Tosa, N., Matsuoka, S., Ellis, B., Ueda, H., Nakatsu, R.: Cultural computing with context-aware ap-plication: Zenetic computer. Lecture Notes in Computer Science 3711, 13–23 (2009)
39. Van Dam, A., Laidlaw, D., Simpson, R.: Experiments in immersive virtual reality for scientific visu-alization. Computers & Graphics 26(4), 535–555 (2002)

26
40. Vote, E., Acevedo Feliz, D., Laidlaw, D.H., Joukowsky, M.S.: Discovering petra: Archaeologicalanalysis in vr. IEEE Comput. Graph. Appl. 22(5), 38–50 (2002)
41. Wang, F.Y.: Is culture computable? IEEE Intelligent Systems 24(2), 2–3 (2009)42. Zendjebil, I., Ababsa, F., Didier, J., Vairon, J., Frauciel, L., Hachet, M., Guitton, P., Delmont, R.:
Outdoor augmented reality: State of the art and issues. In: Virtual Reality International Conference,pp. 177–187 (2008)