visualization for hyper-heuristics: back-end...
TRANSCRIPT
Visualization for Hyper-Heuristics:Back-End Processing
Luke Simon
Faculty AdvisorDr. Daniel Tauritz, Department of Computer Science
Natural Computation Laboratory
Sandia National Laboratories1
March 28, 2015
1Sandia National Laboratories is a multi-program laboratory managed and operated by SandiaCorporation, a wholly owned subsidiary of Lockheed Martin Corporation, for the U.S. Departmentof Energy’s National Nuclear Security Administration under contract DE-AC04-94AL85000.
SAND2015-2327R

Abstract
Modern society is faced with increasingly complex problems, many of which can be formu-lated as generate-and-test optimization problems. Yet, general-purpose optimization algo-rithms may sometimes require too much computational time. In these instances, hyper-heuristics may be used. Hyper-heuristics automate the design of algorithms to create acustom algorithm for a particular scenario, finding the solution significantly faster than itspredecessor. However, it may be difficult to understand exactly how a design was derivedand why it should be trusted. This project aims to address these issues by creating aneasy-to-use graphical user interface (GUI) for hyper-heuristics and an easy-to-understandscientific visualization for the produced solutions. To support the development of this GUI,my portion of the research involved developing algorithms that would allow for parsing ofthe data produced by the hyper-heuristics. This data would then be sent to the front-end,where it would be displayed to the end user.
1 Introduction
There are many problems within the realm of computer science for which exhaustive searchmethods cannot find optimal solutions. In these instances, using exhaustive search methodsto find the optimal solution can cost too much time. Instead, practitioners may use what arecalled heuristics to find a solution. Though heuristics are incomplete search methods thatfind sub-optimal solutions to problems, they find these solutions significantly faster thanexhaustive search methods[1]. Hyper-heuristics, then, automate the design of algorithms bycombining multiple heuristics in order to create a custom algorithm for a particular scenario.
While hyper-heuristics are efficient at building supposed good solutions to generic prob-lem sets, they are not good at telling exactly why a particular solution is favorable over othersolutions. Not knowing where a solution comes from could potentially lead the practitionerto abandon it altogether in favor of a lesser solution of known origin. Though the optimalsolution is found, it remains unused and its validity unproven.
The main purpose of this research was to provide a Graphical User Interface (GUI)whereby practitioners could quickly and easily validate a particular solution generated by ahyper-heuristic. By providing tools which delineate the origin of a particular solution, thelegitimacy can be trusted and the solution used. In order to provide this GUI, our researchintegrated with an already created framework. Rather than generate the solution itself, ourresearch focused instead on validating a solution produced by a standalone framework.
The VASUKI system was integrated with the Hyper-Heuristic Developed Robust Algo-rithms (HYDRA) framework. HYDRA focuses on using Hyper-Heuristics to produce BlackBox Search Algorithms (BBSAs)[2]. In order to validate these solutions, we sought methodsto visualize both the individual BBSAs and their traits and the phylogenetic trees displayingthe genetic ancestry of these BBSAs. By providing these two visualization tools, the practi-tioner could not only determine which attributes a supposed optimal solution contained butalso where these attributes came from. Doing so would hopefully allow the practitioner to
1
validate the produced solutions.
2 Design Decisions
A GUI’s usefulness lies not only in the scope of its functionality, but also in its usability[3].An interface containing vast amounts of functionality not easily accessible is perhaps lesslikely to be used than an interface containing limited though easily accessible functionality.Furthermore, a GUI whose functionality is limited to a single machine or framework mayalso prove to be inadequate. This being considered, usability largely motivated the designof the VASUKI interface.
2.1 The Need for a Cross-Platform System
Limiting the capability of VASUKI to a single operating system would greatly hinder thesystem’s usage. Thus, choosing a development language that supported this cross-platformgoal became crucial. Initially, the entirety of the VASUKI system was to be written anddeveloped using Python’s Tkinter1. Being that HYDRA was developed using Python, wethought it relatively easily to integrate this framework into the VASUKI system if VASUKIwas also developed in Python. However, the limitations of Tkinter quickly became manifest.Though Tkinter could potentially allow for easy integration of Python based hyper-heuristicframeworks, it did not support cross-platform development as well as other potential alter-natives. Although Tkinter was easily compatible with desktop based operating systems, itwas not compatible with mobile operating systems. Thus, we explored other options.
Immediately after abandoning Tkinter we were drawn to the idea of developing VASUKIas a web-based application. The power of web-based applications lies in their ability tobe run from any device that has an Internet browser. Developing VASUKI in this manneropened up the possibility of utilizing the system on a mobile device. The system could easilybe custom built for any screen size, and run on virtually any platform. In addition to thesebenefits, numerous JavaScript libraries exist that render useful data visualization. Ratherthan develop our own methods to visualize data, we could simply use existing visualizationtechniques and spend more time developing algorithms that suited other needs such asparsing through the data.
Though it did not meet the need for a cross-platform system, Tkinter did provide amethod for easy integration of other frameworks because of its native Python language.Thus, we did not completely abandon Python. Rather than use Tkinter, we decided to useDjango2 to create our web application. With this approach, our Django app could sit onthe same server containing some of the frameworks VASUKI supports, such as HYDRA.The Django/Python code would then be able to act as an interface between the client sideJavaScript and the HYDRA code, also potentially making it possible to do remote runs ofHYDRA in the future.
1A Graphical User Interface (GUI) that comes standard with Python2Django is a high-level Python web framework that allows for rapid development.
2
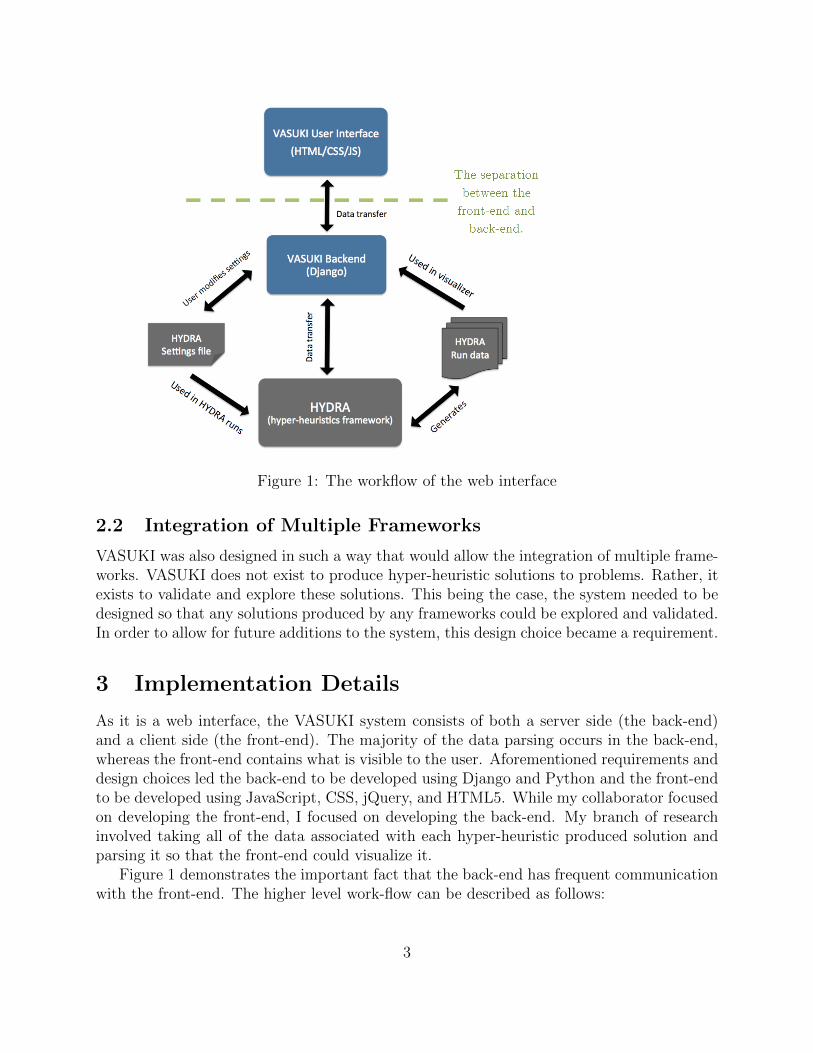
Figure 1: The workflow of the web interface
2.2 Integration of Multiple Frameworks
VASUKI was also designed in such a way that would allow the integration of multiple frame-works. VASUKI does not exist to produce hyper-heuristic solutions to problems. Rather, itexists to validate and explore these solutions. This being the case, the system needed to bedesigned so that any solutions produced by any frameworks could be explored and validated.In order to allow for future additions to the system, this design choice became a requirement.
3 Implementation Details
As it is a web interface, the VASUKI system consists of both a server side (the back-end)and a client side (the front-end). The majority of the data parsing occurs in the back-end,whereas the front-end contains what is visible to the user. Aforementioned requirements anddesign choices led the back-end to be developed using Django and Python and the front-endto be developed using JavaScript, CSS, jQuery, and HTML5. While my collaborator focusedon developing the front-end, I focused on developing the back-end. My branch of researchinvolved taking all of the data associated with each hyper-heuristic produced solution andparsing it so that the front-end could visualize it.
Figure 1 demonstrates the important fact that the back-end has frequent communicationwith the front-end. The higher level work-flow can be described as follows:
3
1. Based off of the provided settings file, HYDRA uses hyper-heuristics to generate sup-posed optimal BBSA solutions to a problem.
2. The generated run data is sent to the VASUKI back-end, where it will later be analyzedand parsed.
3. Once the run data has been parsed and stored in a useful format, it is sent to thefront-end.
4. The front-end then provides tools to interact with and visualize the data, thus allowingthe practitioner to hopefully validate an optimal solution.
5. Data may then be sent again to the back-end, where it is parsed and updated again tobe resent to the front-end.
3.1 Developing Generic Solutions
To develop the back-end meant to develop very generic solutions to particular parsing prob-lems. Mainly because there was only a single integrated framework instead of multiple, itwould have been easiest to explicitly hard-code all of the data parsing. HYDRA has a stan-dard format that all produced data files are in, and a specific solution to parse these datafiles would have been straightforward to implement. However, this would have been contraryto the entire vision of the research. We wished to allow for additional framework support ifdesired, and the system had to be designed in such a way that allowed for this. Parsing usinga method specific to the data from an individual framework would have greatly discouragedadditional frameworks from being integrated. Thus, extra time was spent to ensure that anydeveloped code was generic and robust enough to parse data from multiple frameworks. Thiswould prove to be very difficult. However, it also ensured that VASUKI remained robust tochanging requirements and desires of the practitioner.
3.2 Dynamically Parsing the Settings File
The HYDRA framework relies on a settings file to define specifics for each run. Specificssuch as but not limited to problem type and representation, convergence, penalties, andothers are defined by this file. One of the first objectives within this research was to developa methodology that would enable a user to easily view and edit the settings files usedby HYDRA. By displaying the settings file in an easily recognizable and editable form, weenabled the practitioner to have a further understanding of where a particular hyper-heuristicsolution comes from. In order to display the settings file in an easily recognizable format, ithad to first be parsed by the back-end. To allow for the best user experience, the front-endrequired information about the data type, tool-tip, and requirement of each field. All of thisinformation was parsed and stored within Python. The process was greatly expedited bythe developer of the HYDRA system, who provided a file containing all information related
4
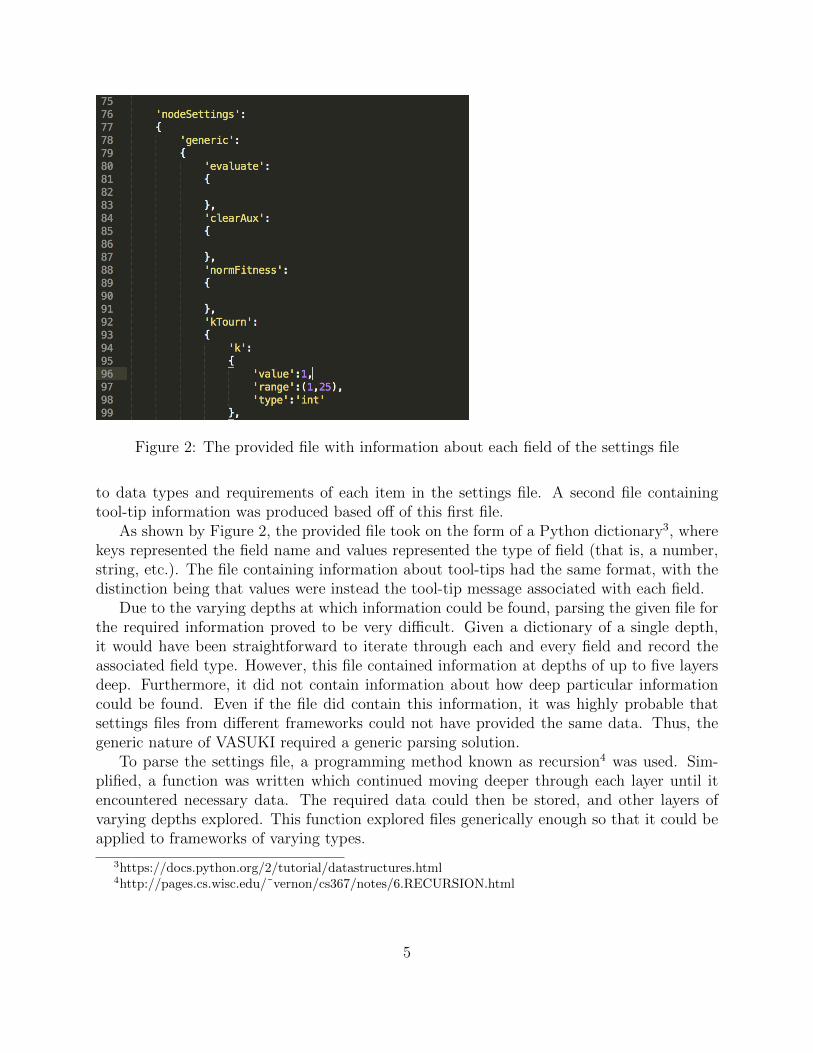
Figure 2: The provided file with information about each field of the settings file
to data types and requirements of each item in the settings file. A second file containingtool-tip information was produced based off of this first file.
As shown by Figure 2, the provided file took on the form of a Python dictionary3, wherekeys represented the field name and values represented the type of field (that is, a number,string, etc.). The file containing information about tool-tips had the same format, with thedistinction being that values were instead the tool-tip message associated with each field.
Due to the varying depths at which information could be found, parsing the given file forthe required information proved to be very difficult. Given a dictionary of a single depth,it would have been straightforward to iterate through each and every field and record theassociated field type. However, this file contained information at depths of up to five layersdeep. Furthermore, it did not contain information about how deep particular informationcould be found. Even if the file did contain this information, it was highly probable thatsettings files from different frameworks could not have provided the same data. Thus, thegeneric nature of VASUKI required a generic parsing solution.
To parse the settings file, a programming method known as recursion4 was used. Sim-plified, a function was written which continued moving deeper through each layer until itencountered necessary data. The required data could then be stored, and other layers ofvarying depths explored. This function explored files generically enough so that it could beapplied to frameworks of varying types.
3https://docs.python.org/2/tutorial/datastructures.html4http://pages.cs.wisc.edu/˜vernon/cs367/notes/6.RECURSION.html
5

Figure 3: The BBSA visualizer
3.3 Displaying BBSA trees
HYDRA uses an initial population to evolve BBSAs fitted to particular problems. One ofthe tools (see Figure 3) provided by VASUKI is used to edit and create the BBSAs usedfor this initial population. The user is able to upload a BBSA tree to edit and visualizeits traits, and then output the new BBSA in the same format used for uploading. Thiscapability is greatly advantageous. Giving practitioners the ability to view and edit theinitial population used by HYDRA provides yet another method of tracing the origin of asolution. Being able to visualize the BBSAs found within this initial population allows formore insight into what initial conditions may produce superior solutions, and being ableto edit the BBSA trees allows the practitioner to investigate through experimentation thecausation of these superior solutions.
Each BBSA tree is made up of multiple nodes of varying types (forLoop, ifConverge,kTourn, etc.). The available types can all be found within the settings file provided by theHYDRA developer. Hence, the data associated with BBSA trees had to be parsed in away similar to how the settings file was parsed. Thankfully, this functionality was alreadyprovided from previous implementation. The provided implementation was used to parsethe given data, and the result sent to the front-end. The benefit of compartmentalizationis shown quite obviously here. The back-end simply parses the data and makes it usableby the front-end. What the front-end does with this data is not known by the back-end.Thus, changing either component does not require updating the other component. Thisallows developers to work independently on either part. In this instance, the back-endsimply makes available the potential nodes and their associated data. How these individualnodes are rendered and the BBSA tree created is unimportant from the point of view of the
6
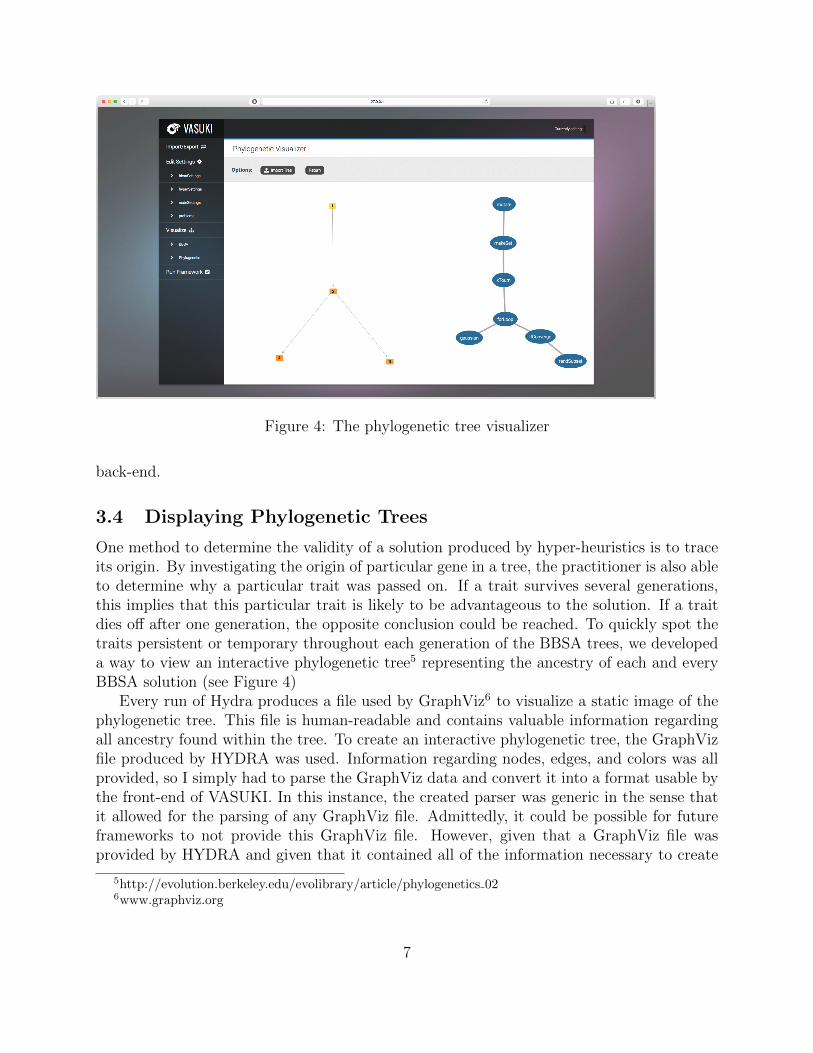
Figure 4: The phylogenetic tree visualizer
back-end.
3.4 Displaying Phylogenetic Trees
One method to determine the validity of a solution produced by hyper-heuristics is to traceits origin. By investigating the origin of particular gene in a tree, the practitioner is also ableto determine why a particular trait was passed on. If a trait survives several generations,this implies that this particular trait is likely to be advantageous to the solution. If a traitdies off after one generation, the opposite conclusion could be reached. To quickly spot thetraits persistent or temporary throughout each generation of the BBSA trees, we developeda way to view an interactive phylogenetic tree5 representing the ancestry of each and everyBBSA solution (see Figure 4)
Every run of Hydra produces a file used by GraphViz6 to visualize a static image of thephylogenetic tree. This file is human-readable and contains valuable information regardingall ancestry found within the tree. To create an interactive phylogenetic tree, the GraphVizfile produced by HYDRA was used. Information regarding nodes, edges, and colors was allprovided, so I simply had to parse the GraphViz data and convert it into a format usable bythe front-end of VASUKI. In this instance, the created parser was generic in the sense thatit allowed for the parsing of any GraphViz file. Admittedly, it could be possible for futureframeworks to not provide this GraphViz file. However, given that a GraphViz file wasprovided by HYDRA and given that it contained all of the information necessary to create
5http://evolution.berkeley.edu/evolibrary/article/phylogenetics 026www.graphviz.org
7
an interactive phylogenetic tree, this detail was ignored and the functionality implemented.Furthermore, one could easily generate the GraphViz file of a future framework using anintermediate step. The produced file could then be used to create the interactive phylogenetictree.
4 Conclusion
Runs performed in hyper-heuristic frameworks produce complex data that can be difficultto interpret. The visualizations produced by VASUKI facilitate understanding evolutionarypaths. The strength of Vasuki lies in its interactive creation of visualizations, rather than justdisplaying static diagrams. Examining a solution more closely or tracing its origin can granta practitioner further confidence that the solution produced by a hyper-heuristic is valid andtrustworthy. By providing tools that visualize many stages of hyper-heuristic frameworks,VASUKI aids the practitioner in understanding hyper-heuristics and their resulting solutions.
5 Acknowledgments
Acknowledgments go to my faculty advisor, Dr. Daniel Tauritz, and mentor, Dr. SamuelMulder. Furthermore, I would like to thank my collaborator Lauren Kroenung for hercontinued support throughout this project.
References
[1] Burke, Edmund. ”Hyper-Heuristics.” Search Methodologies: Introductory Tutorials inOptimization and Decision Support Techniques. Second ed. Springer, 2013. Print.
[2] Matthew A. Martin and Daniel R. Tauritz. 2013. Evolving black-box search algorithmsemploying genetic programming. In Proceedings of the 15th annual conference companionon Genetic and evolutionary computation (GECCO ’13 Companion), Christian Blum(Ed.). ACM, New York, NY, USA, 1497-1504.
[3] Nielsen, Jakob. ”Nielsen Norman Group.” Usability 101: Introductionto Usability. Nielsen Norman Group, 4 Jan. 2012. Web. 20 Mar. 2015.http://www.nngroup.com/articles/usability-101-introduction-to-usability/ .
8