visualizing and quantifying difference in cytoplasmic and nuclear metabolism in the hepatoliary...
TRANSCRIPT

Visualizing and quantifying differencein cytoplasmic and nuclearmetabolism in the hepatobiliarysystem in vivo
Chih-Ju LinNing KangJian-Ye LeeHsuan-Shu LeeChen-Yuan Dong
Downloaded From: http://biomedicaloptics.spiedigitallibrary.org/ on 08/03/2016 Terms of Use: http://spiedigitallibrary.org/ss/TermsOfUse.aspx
Visualizing and quantifying difference in cytoplasmicand nuclear metabolism in the hepatobiliary systemin vivo
Chih-Ju Lin,a Ning Kang,a Jian-Ye Lee,a Hsuan-Shu Lee,b,c,* and Chen-Yuan Donga,d,e,*aNational Taiwan University, Department of Physics, Taipei 106, TaiwanbNational Taiwan University Hospital and National Taiwan University, College of Medicine, Department of Internal Medicine, Taipei 100, TaiwancNational Taiwan University, Institute of Biotechnology, Taipei 106, TaiwandNational Taiwan University, Center for Optoelectronic Biomedicine, Taipei 106, TaiwaneNational Taiwan University, Center for Quantum Science and Engineering, Taipei 106, Taiwan
Abstract. The liver is a major organ responsible for performing xenobiotic metabolism. In this process, xeno-biotic is uptaken and processed in hepatocytes and subsequently excreted into the bile canaliculi. However, theintracellular heterogeneity in such metabolic processes is not known. We use the molecular probe 6-carboxy-fluorescein diacetate (6-CFDA) to investigate xenobiotic metabolism in hepatocytes with intravital multiphotonfluorescence microscopy. 6-CFDA is processed by intracellular esterase to fluorescent 6-CF, which can beimaged and quantified. We found that compared to the nucleus, cytoplasmic 6-CF fluorescence intensityreached a maximum earlier (cytoplasm: 11.3� 4.4 min; nucleus: 14.7� 4.9 min) following 6-CFDA injection.We also found a slight difference in the rate of 6-CFDA metabolism as the rates of 6-CF decay at rates of 1.43�0.75 and 1.27� 0.72 photons∕min for the cytoplasm and nucleus, respectively. These results indicate thatmolecular transport to the nucleus is additionally hindered and can affect drug transport there. © 2015 Society of
Photo-Optical Instrumentation Engineers (SPIE) [DOI: 10.1117/1.JBO.20.1.016020]
Keywords: intravital imaging; multiphoton fluorescence microscopy; hepatocyte; hepatobiliary metabolism.
Paper 140711LR received Oct. 30, 2014; accepted for publication Dec. 30, 2014; published online Jan. 22, 2015.
1 IntroductionThe liver is the main organ that performs metabolism ofunwanted metabolites. Individual hepatocytes would uptake,process, and excrete metabolites into the bile canaculi.However, differences in metabolic kinetics of different organ-elles are not known. Since the nucleus contains nucleolus,DNA, RNA, and ribosome, it is not expected to be the key com-ponent responsible in hepatocellular metabolism. However, thepresence of nuclear receptors1 and their roles in affecting theexpression of metabolic enzymes and transporters means thatthe nucleus mediates signal transduction interactions with cyto-plasm and, therefore, can be used as a drug target. In fact, nucleihave been targeted by both drug molecules and nanoparticles forcancer treatment purposes.2–4 Therefore, understanding trans-port dynamics in different cellular compartments in vivo maybe significant in drug delivery applications.
In previous studies, 6-carboxyfluorescein diacetate (6-CFDA)has been used as a probe for investigating simulate xenobioticmetabolism in the hepatobiliary system. Upon hepatocyte uptakeof the neutral 6-CFDA and processing by intracellular esterase,nonfluorescent 6-CFDA is converted into fluorescent 6-CF,which is subsequently excreted into the bile canaculi via the api-cal (canalicular) membrane.5–7 Multidrug resistance associatedprotein 2 (Mrp2) is the main channel protein responsible in6-CF excretion.8 Therefore, time-lapse fluorescence imagingwould allow hepatobiliary dynamics to be studied5,6,9 as
6-CFDA was used to investigate changes in hepatobiliarymetabolism in acetaminophen induced hepatic necrosis.7 Inthis study, we performed intravital multiphoton microscopy tovisualize and quantify differences in 6-CFDA/6-CF metabolismbetween the cytoplasm and nucleus.
2 Materials and MethodsWe used a home-built multiphoton fluorescence microscopein this study. The 780 nm output of a femtosecond, titanium-sapphire (ti-sa) laser (Tsunami, Spectra Physics, MountainView, CA, USA) pumped by a diode-pump, solid-state laser(Millennia X, Spectra Physics) was used as the excitationsource. The ti-sa source was adjusted to be circularly polarizedby a quarter waveplate and the power of the laser source wascontrolled by a combination of a half waveplate and linearpolarizer. Subsequently, the laser source was directed into aninverted microscope (Nikon, ECLIPSE TE2000-U, Tokyo,Japan). The ti-sa source was reflected by the main dichroic(700DCSPXRUV-3p, Chroma Technology, Rockingham, VT,USA) into the back aperture of the focusing objective(PlanFlour 20 × ∕NA0.75, oil immersion, Nikon) and theon-sample power was ∼80 mW. The excited fluorescencewas detected in the epi-illumination geometry, and passedthrough the main dichroic, secondary dichroic (435DCXR,495DCXR, 555DCLP, Chroma Technology), and additionalband-pass filters (HQ390/20, HQ460/50, HQ525/50, HQ610/75, Chroma Technology) before reaching single-photon
*Address all correspondence to: Hsuan-Shu Lee and Chen-Yuan Dong, E-mail:[email protected] and [email protected] 0091-3286/2015/$25.00 © 2015 SPIE
Journal of Biomedical Optics 016020-1 January 2015 • Vol. 20(1)
Journal of Biomedical Optics 20(1), 016020 (January 2015)
Downloaded From: http://biomedicaloptics.spiedigitallibrary.org/ on 08/03/2016 Terms of Use: http://spiedigitallibrary.org/ss/TermsOfUse.aspx

counting photomultiplier tubes (R7400P, Hamamatsu, Japan)for detection. In this manner, spectrally resolved images at380 to 400 nm (second harmonic generation), 435 to 485 nm(blue fluorescence), 500 to 550 nm (green fluorescence), and550 to 630 nm (red fluorescence) were acquired.
The animals used in this study were seven- to nine-week-oldmale C57BL/6 mice kept in a 12 h light/12 h dark clock cycle at23� 1°C and 60� 10% humidity. For intravital imaging, intra-vital hepatic imaging chambers were installed on the mice aspreviously described.5 Following the installation of the intravitalhepatic imaging chamber, the mouse was anesthetized and acatheter (PE-10, Becton Dickinson and Company, NJ, USA)was inserted into the jugular vein for intravenous injection.Rhodamine B isothicyanate-dextran 70,000 (Sigma, SaintLouis, MO, USA) at the dose of 2.50 mg∕mouse [50 mg∕mlin phosphate buffered saline (PBS)] was injected to label thehepatic vasculature, and 6-CFDA at the dose of 50 ml(1 mg∕ml) in PBS (C1157, Invitrogen, USA) was the probeused for studying hepatocellular metabolism.
With the optical scanning system, the scanned area is limitedto 200 × 200 μm2 (x-y mirror scanning system, Model 6220,Cambridge Technology, Lexington, MA). In order to probethe hepatobiliary metabolism over a larger area, a stage scanner(H117, Prior Scientific Inc., Rockland, MA, USA) was used totranslate the mouse after each optical scan. In this manner, wewere able to acquire a large-area map consisting of 3 × 3 small-area optical images. In this manner, each 3 × 3 frame took 1 minto acquire.
3 Results and DiscussionsTime-lapse images were acquired over 60 min with time inter-vals of ∼1 min. In each mouse, 600 × 600 μm2 images weretaken (Fig. 1). 6-CFDA was intravenously injected at the endof the zeroth minute and 6-CF started appearing at the first
minute. As Mrp2 transported 6-CF into the bile duct, the cellularconcentration of 6-CF would be decreased with time.
To analyze the temporal dynamics of 6-CF metabolism, thecytoplasm and nucleus of individual hepatocytes were ana-lyzed. As shown in Fig. 2, the cytoplasm and nucleus of aselected hepatocyte (yellow arrow) was calculated, and the6-CF fluorescence profiles are shown in Fig. 2(g). One metricwe used for quantification is the time of maximum fluores-cence intensity (TMFI). Qualitatively, 6-CF fluorescencedynamics appear to be different in the cytoplasm and nucleus
Fig. 1 Time-lapse, intravital multiphoton imaging of hepatobiliarymetabolism. Images from four time points following 6-carboxyfluores-cein diacetate (6-CFDA) injection were shown (0, 1, 10, and 60 min,with minute 0 as the time point of 6-CFDA injection). Red: rhodamineB isothicyanate-dextran to label vasculature; green: 6-CF fluores-cence; white: hepatic stellate cell. Scale bar was 50 μm.
Fig. 2 (a) to (f) show that 6-CF was not present in the nucleus in thefirst few minutes following 6-CFDA injection. (g) 6-CF fluorescenceintensity curve of the enclosed hepatic nucleus and cytoplasm.Scale bar was 50 μm.
Journal of Biomedical Optics 016020-2 January 2015 • Vol. 20(1)
Lin et al.: Visualizing and quantifying difference in cytoplasmic and nuclear metabolism. . .
Downloaded From: http://biomedicaloptics.spiedigitallibrary.org/ on 08/03/2016 Terms of Use: http://spiedigitallibrary.org/ss/TermsOfUse.aspx
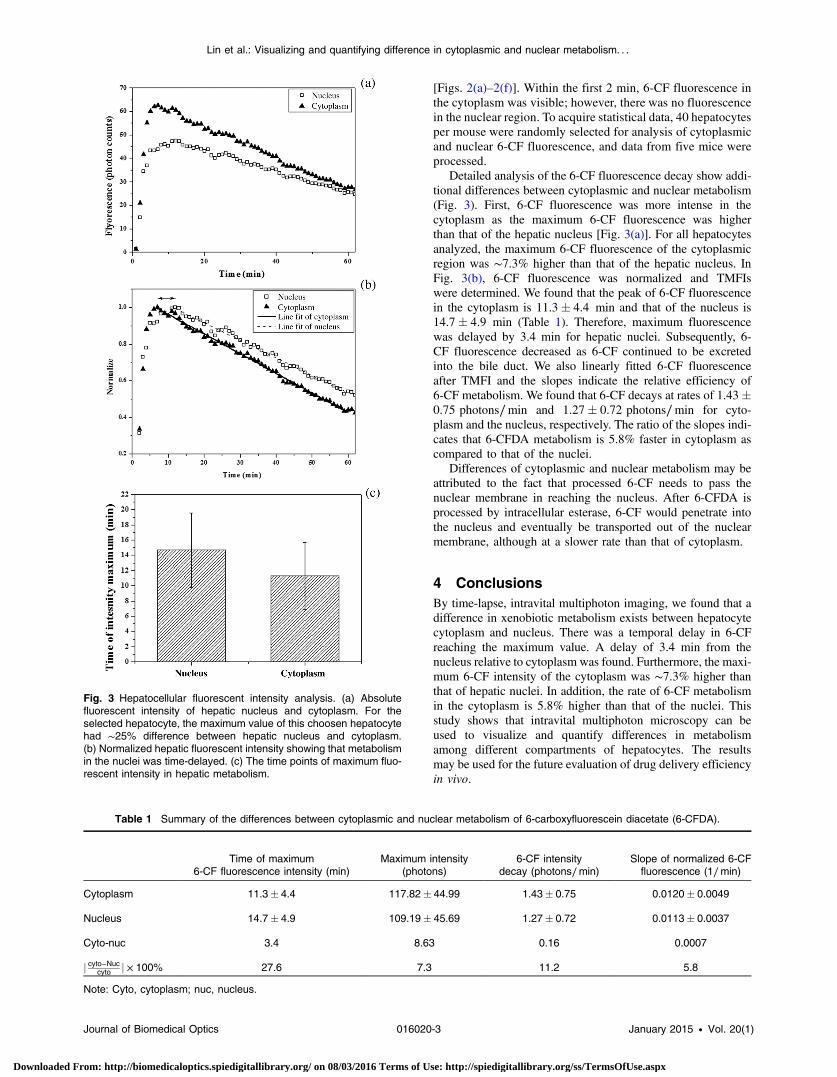
[Figs. 2(a)–2(f)]. Within the first 2 min, 6-CF fluorescence inthe cytoplasm was visible; however, there was no fluorescencein the nuclear region. To acquire statistical data, 40 hepatocytesper mouse were randomly selected for analysis of cytoplasmicand nuclear 6-CF fluorescence, and data from five mice wereprocessed.
Detailed analysis of the 6-CF fluorescence decay show addi-tional differences between cytoplasmic and nuclear metabolism(Fig. 3). First, 6-CF fluorescence was more intense in thecytoplasm as the maximum 6-CF fluorescence was higherthan that of the hepatic nucleus [Fig. 3(a)]. For all hepatocytesanalyzed, the maximum 6-CF fluorescence of the cytoplasmicregion was ∼7.3% higher than that of the hepatic nucleus. InFig. 3(b), 6-CF fluorescence was normalized and TMFIswere determined. We found that the peak of 6-CF fluorescencein the cytoplasm is 11.3� 4.4 min and that of the nucleus is14.7� 4.9 min (Table 1). Therefore, maximum fluorescencewas delayed by 3.4 min for hepatic nuclei. Subsequently, 6-CF fluorescence decreased as 6-CF continued to be excretedinto the bile duct. We also linearly fitted 6-CF fluorescenceafter TMFI and the slopes indicate the relative efficiency of6-CF metabolism. We found that 6-CF decays at rates of 1.43�0.75 photons∕min and 1.27� 0.72 photons∕min for cyto-plasm and the nucleus, respectively. The ratio of the slopes indi-cates that 6-CFDA metabolism is 5.8% faster in cytoplasm ascompared to that of the nuclei.
Differences of cytoplasmic and nuclear metabolism may beattributed to the fact that processed 6-CF needs to pass thenuclear membrane in reaching the nucleus. After 6-CFDA isprocessed by intracellular esterase, 6-CF would penetrate intothe nucleus and eventually be transported out of the nuclearmembrane, although at a slower rate than that of cytoplasm.
4 ConclusionsBy time-lapse, intravital multiphoton imaging, we found that adifference in xenobiotic metabolism exists between hepatocytecytoplasm and nucleus. There was a temporal delay in 6-CFreaching the maximum value. A delay of 3.4 min from thenucleus relative to cytoplasm was found. Furthermore, the maxi-mum 6-CF intensity of the cytoplasm was ∼7.3% higher thanthat of hepatic nuclei. In addition, the rate of 6-CF metabolismin the cytoplasm is 5.8% higher than that of the nuclei. Thisstudy shows that intravital multiphoton microscopy can beused to visualize and quantify differences in metabolismamong different compartments of hepatocytes. The resultsmay be used for the future evaluation of drug delivery efficiencyin vivo.
Fig. 3 Hepatocellular fluorescent intensity analysis. (a) Absolutefluorescent intensity of hepatic nucleus and cytoplasm. For theselected hepatocyte, the maximum value of this choosen hepatocytehad ∼25% difference between hepatic nucleus and cytoplasm.(b) Normalized hepatic fluorescent intensity showing that metabolismin the nuclei was time-delayed. (c) The time points of maximum fluo-rescent intensity in hepatic metabolism.
Table 1 Summary of the differences between cytoplasmic and nuclear metabolism of 6-carboxyfluorescein diacetate (6-CFDA).
Time of maximum6-CF fluorescence intensity (min)
Maximum intensity(photons)
6-CF intensitydecay (photons∕min)
Slope of normalized 6-CFfluorescence (1∕min)
Cytoplasm 11.3� 4.4 117.82� 44.99 1.43� 0.75 0.0120� 0.0049
Nucleus 14.7� 4.9 109.19� 45.69 1.27� 0.72 0.0113� 0.0037
Cyto-nuc 3.4 8.63 0.16 0.0007
j cyto−Nuccyto j × 100% 27.6 7.3 11.2 5.8
Note: Cyto, cytoplasm; nuc, nucleus.
Journal of Biomedical Optics 016020-3 January 2015 • Vol. 20(1)
Lin et al.: Visualizing and quantifying difference in cytoplasmic and nuclear metabolism. . .
Downloaded From: http://biomedicaloptics.spiedigitallibrary.org/ on 08/03/2016 Terms of Use: http://spiedigitallibrary.org/ss/TermsOfUse.aspx

AcknowledgmentsWe acknowledge the support of the Ministry of Science andTechnology (National Science Council) (NSC101-2112-M-002-003-MY3, NSC102-2221-E-002-030-MY3) in Taiwan,National Taiwan University (NTU103R7804), the Center forQuantum Science and Engineering (NTU-ERP-103R891401),and the National Health Research Institute (NHRI-EX102-10041EI).
References1. Y. Hasegawa et al., “Altered expression of nuclear receptors affects the
expression of metabolic enzymes and transporters in a rat model of cho-lestasis,” Biol. Pharm. Bull. 32(12), 2046–2052 (2009).
2. A. L. B. Seynhaeve et al., “Intact doxil is taken up intracellularly andreleased doxorubicin sequesters in the lysosome: evaluated by in vitro/in vivo live cell imaging,” J. Control. Release 172(1), 330–340 (2013)
3. X. J. Zhou et al., “Lactosylated liposomes for targeted delivery of dox-orubicin to hepatocellular carcinoma,” Int. J. Nanomed. 7, 5465–5474(2012).
4. N. B. Shah, J. P. Dong, and J. C. Bischof, “Cellular uptake and nanoscalelocalization of gold nanoparticles in cancer using label-free confocalRaman microscopy,” Mol. Pharm. 8(1), 176–184 (2011).
5. F. C. Li et al., “In vivo dynamic metabolic imaging of obstructive cho-lestasis in mice,” Am. J. Physiol.-Gastroint. Liver Physiol. 296(5),G1091–G1097 (2009).
6. Y. Liu et al., “Visualization of hepatobiliary excretory function by intra-vital multiphoton microscopy,” J. Biomed. Opt. 12(1), 5 (2007).
7. F. C. Li et al., “Apical membrane rupture and backward bile flooding inacetaminophen-induced hepatocyte necrosis,” Cell Death Dis. 2, e183(2011).
8. M. Tomita et al., “Suppression of efflux transporters in the intestines ofendotoxin-treated rats,” Int. J. Pharm. 428(1–2), 33–38 (2012).
9. P. Y. T. Wang et al., “Sex-specific extraction of organic anions by the ratliver,” Life Sci. 82(7–8), 436–443 (2008).
Journal of Biomedical Optics 016020-4 January 2015 • Vol. 20(1)
Lin et al.: Visualizing and quantifying difference in cytoplasmic and nuclear metabolism. . .
Downloaded From: http://biomedicaloptics.spiedigitallibrary.org/ on 08/03/2016 Terms of Use: http://spiedigitallibrary.org/ss/TermsOfUse.aspx