vm case studies - ibm
TRANSCRIPT
IBM Systems & Technology Group
10/23/2009 © 2007 IBM Corporation
z/VM Performance Case Studies
Bill BitnerVM Performance [email protected]
IBM Systems and Technology Group
© 2007 IBM Corporation2 10/23/2009
TrademarksTrademarks
The following are trademarks of the International Business Machines Corporation in the United States and/or other countries. For a complete list of IBM Trademarks, see www.ibm.com/legal/copytrade.shtml: AS/400, DBE, e-business logo, ESCO, eServer, FICON, IBM, IBM Logo, iSeries, MVS, OS/390, pSeries, RS/6000, S/30, VM/ESA, VSE/ESA, Websphere, xSeries, z/OS, zSeries, z/VM
The following are trademarks or registered trademarks of other companies
Lotus, Notes, and Domino are trademarks or registered trademarks of Lotus Development CorporationJava and all Java-related trademarks and logos are trademarks of Sun Microsystems, Inc., in the United States and other countriesLINUX is a registered trademark of Linus TorvaldsUNIX is a registered trademark of The Open Group in the United States and other countries.Microsoft, Windows and Windows NT are registered trademarks of Microsoft Corporation.SET and Secure Electronic Transaction are trademarks owned by SET Secure Electronic Transaction LLC.Intel is a registered trademark of Intel Corporation* All other products may be trademarks or registered trademarks of their respective companies.
NOTES:
Performance is in Internal Throughput Rate (ITR) ratio based on measurements and projections using standard IBM benchmarks in a controlled environment. The actual throughput that any user will experience will vary depending upon considerations such as the amount of multiprogramming in the user's job stream, the I/O configuration, the storage configuration, and the workload processed. Therefore, no assurance can be given that an individual user will achieve throughput improvements equivalent to the performance ratios stated here.
IBM hardware products are manufactured from new parts, or new and serviceable used parts. Regardless, our warranty terms apply.
All customer examples cited or described in this presentation are presented as illustrations of the manner in which some customers have used IBM products and the results they may have achieved. Actual environmental costs and performance characteristics will vary depending on individual customer configurations and conditions.
This publication was produced in the United States. IBM may not offer the products, services or features discussed in this document in other countries, and the information may be subject to change without notice. Consult your local IBM business contact for information on the product or services available in your area.
All statements regarding IBM's future direction and intent are subject to change or withdrawal without notice, and represent goals and objectives only.
Information about non-IBM products is obtained from the manufacturers of those products or their published announcements. IBM has not tested those products and cannot confirm the performance, compatibility, or any other claims related to non-IBM products. Questions on the capabilities of non-IBM products should be addressed to the suppliers of those products.
Prices subject to change without notice. Contact your IBM representative or Business Partner for the most current pricing in your geography.
References in this document to IBM products or services do not imply that IBM intends to make them available in every country.
Any proposed use of claims in this presentation outside of the United States must be reviewed by local IBM country counsel prior to such use.
The information could include technical inaccuracies or typographical errors. Changes are periodically made to the information herein; these changes will be incorporated in new editions of the publication. IBM may make improvements and/or changes in the product(s) and/or the program(s) described in this publication at any time without notice.
Any references in this information to non-IBM Web sites are provided for convenience only and do not in any manner serve as an endorsement of those Web sites. The materials at those Web sites are not part of the materials for this IBM product and use of those Web sites is at your own risk.
IBM Systems and Technology Group
© 2007 IBM Corporation3 10/23/2009
Agenda
Thanks to the z/VM Performance Team, particularlyBrian Wade, for their contributions to this material.
Acknowledgments
Brief review of collecting performance data. Brief review of IBM Performance SupportCase Studies
IBM Systems and Technology Group
© 2007 IBM Corporation4 10/23/2009
Collecting Raw Monitor Data
What is raw monitor data?
How do I set up to collect it?
When do I collect it?
What tools are available to help me collect it?
How do I package it for transmission?
How do I study it myself?
Summary
IBM Systems and Technology Group
© 2007 IBM Corporation5 10/23/2009
What is Raw Monitor Data?
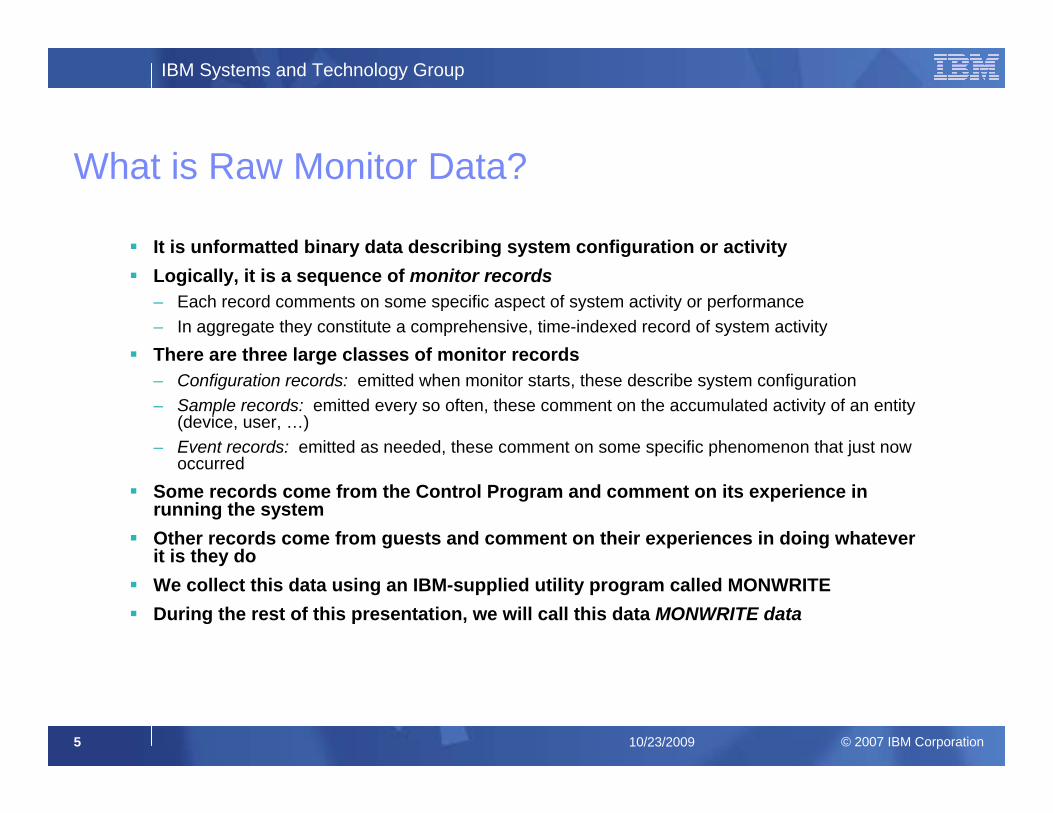
It is unformatted binary data describing system configuration or activityLogically, it is a sequence of monitor records– Each record comments on some specific aspect of system activity or performance– In aggregate they constitute a comprehensive, time-indexed record of system activityThere are three large classes of monitor records– Configuration records: emitted when monitor starts, these describe system configuration– Sample records: emitted every so often, these comment on the accumulated activity of an entity
(device, user, …)– Event records: emitted as needed, these comment on some specific phenomenon that just now
occurredSome records come from the Control Program and comment on its experience in running the systemOther records come from guests and comment on their experiences in doing whatever it is they doWe collect this data using an IBM-supplied utility program called MONWRITEDuring the rest of this presentation, we will call this data MONWRITE data
IBM Systems and Technology Group
© 2007 IBM Corporation6 10/23/2009
How Do I Collect MONWRITE Data?
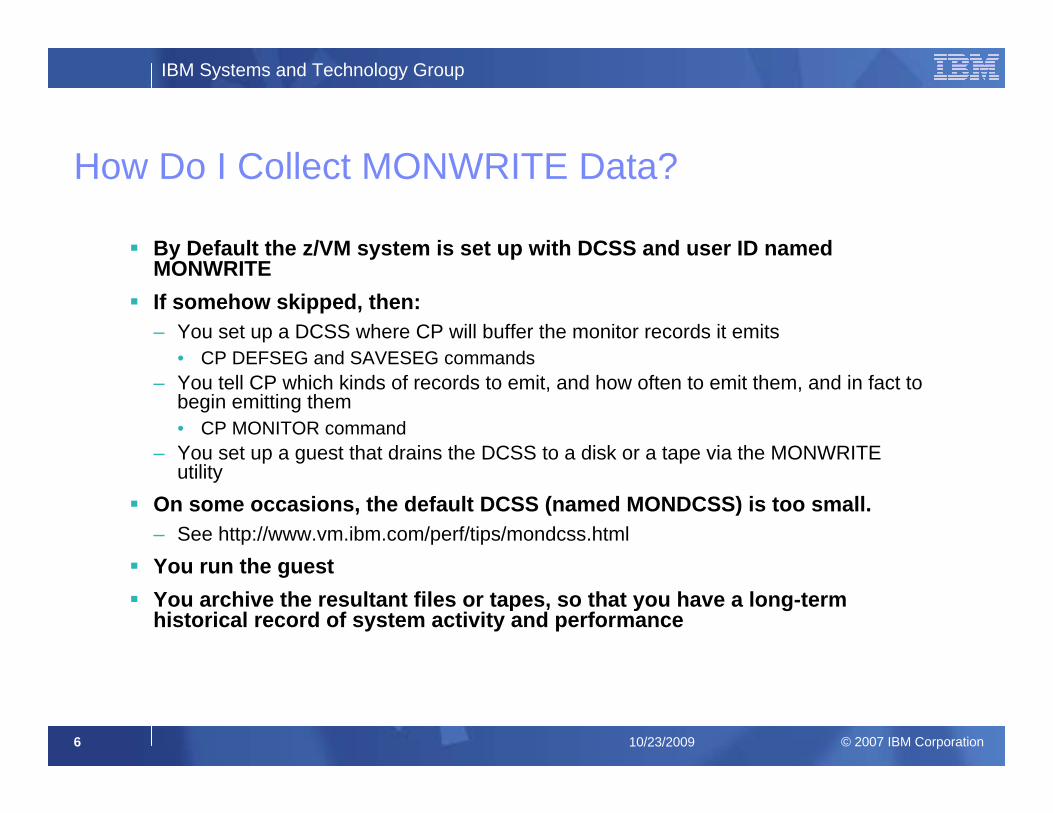
By Default the z/VM system is set up with DCSS and user ID namedMONWRITEIf somehow skipped, then:– You set up a DCSS where CP will buffer the monitor records it emits
• CP DEFSEG and SAVESEG commands– You tell CP which kinds of records to emit, and how often to emit them, and in fact to
begin emitting them• CP MONITOR command
– You set up a guest that drains the DCSS to a disk or a tape via the MONWRITE utility
On some occasions, the default DCSS (named MONDCSS) is too small.– See http://www.vm.ibm.com/perf/tips/mondcss.htmlYou run the guestYou archive the resultant files or tapes, so that you have a long-term historical record of system activity and performance
IBM Systems and Technology Group
© 2007 IBM Corporation7 10/23/2009
When Do I Collect MONWRITE Data?
Periodically, collect and archive some data during your peak periods, so that you have a historical record– Every Tuesday at 10 AM for an hour
– Month-end processing
– Whenever you do that really big thing you do
When directed by IBM– Health check, PMR, crit sit, ESP, whatever
IBM Systems and Technology Group
© 2007 IBM Corporation8 10/23/2009
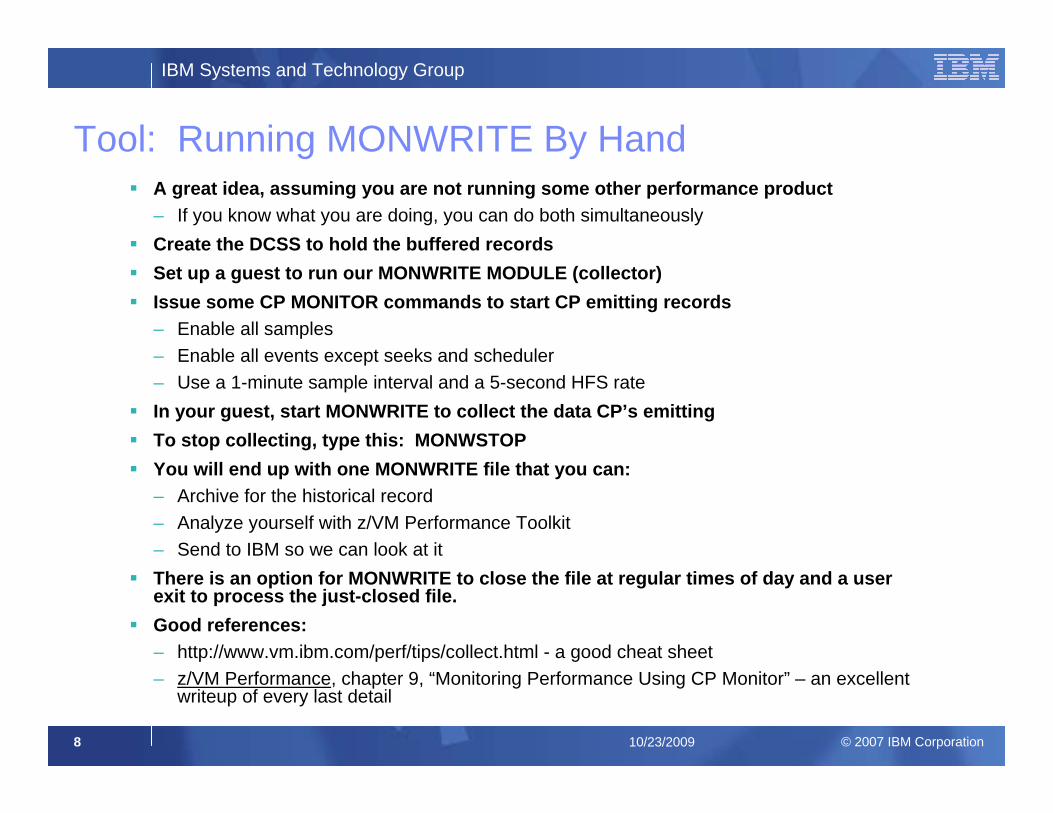
Tool: Running MONWRITE By HandA great idea, assuming you are not running some other performance product– If you know what you are doing, you can do both simultaneouslyCreate the DCSS to hold the buffered recordsSet up a guest to run our MONWRITE MODULE (collector)Issue some CP MONITOR commands to start CP emitting records– Enable all samples– Enable all events except seeks and scheduler– Use a 1-minute sample interval and a 5-second HFS rateIn your guest, start MONWRITE to collect the data CP’s emittingTo stop collecting, type this: MONWSTOPYou will end up with one MONWRITE file that you can:– Archive for the historical record– Analyze yourself with z/VM Performance Toolkit– Send to IBM so we can look at itThere is an option for MONWRITE to close the file at regular times of day and a user exit to process the just-closed file.Good references:– http://www.vm.ibm.com/perf/tips/collect.html - a good cheat sheet – z/VM Performance, chapter 9, “Monitoring Performance Using CP Monitor” – an excellent
writeup of every last detail
IBM Systems and Technology Group
© 2007 IBM Corporation9 10/23/2009
Packaging MONWRITE Data For TransmissionMONWRITE files are binary CMS files, F 4096.Just attaching them to an e-mail is NOT recommended.The standard z/VM Level 2 process for FTPing files calls for COPYFILE (PACK – This is unnecessary for MONWRITE and VMARC files.Always, always, always:– Move the files in binary (ASCII is a sure showstopper)– Do not use FTP’s SITE FIXREC, QUOTE SITE FIXREC, or LOCSITE FIXREC features (error-prone)You will probably FTP your data to IBM’s receiving server in Boulder, CO– Testcase.boulder.ibm.com, cd /toibm/vm– Name your file mnemonically and send us a note about it– See http://techsupport.services.ibm.com/390/tcprocs.html for additional info on the Testcase process– In PMR and/or note be clear as to what is sent and how packagedWe suggest you use the VMARC file archiver that runs on CMS for very large files or when several files are being sent.– Kind of like “zipping” on a PC (compresses, combines)
• MONWRITE data is very compressible• Sometimes you also want to send us a console spool, or some QUERY outputs, or whatever• You can package everything into one VMARC archive and just send us that
There are VMARC instructions near the bottom of http://www.vm.ibm.com/devpages/bkw/monitor.html
IBM Systems and Technology Group
© 2007 IBM Corporation10 10/23/2009
Studying MONWRITE Data
z/VM Performance Toolkit
Interactively – possible, but not so useful
PERFKIT BATCH command – pretty useful– Control files tell Perfkit which reports to produce
– You can then inspect the reports by hand or programmatically
See z/VM Performance Toolkit Reference for information on how to use PERFKIT BATCH
IBM Systems and Technology Group
© 2007 IBM Corporation11 10/23/2009
Other Types of Data Confused with MONWRITE Data
Asking for “raw VM monitor” data can be confusing.– Velocity has their own form of raw monitor data and
history files, and even a form that mimics MONWRITE.
– “VM Monitor” sounds like the “VM:product” often associated with CA products.
– Performance Toolkit’s history, trend, and summary files do not have the same detail.
Be specific when asking for data.
IBM Systems and Technology Group
© 2007 IBM Corporation12 10/23/2009
Monwrite Summary
MONWRITE data is a comprehensive record of system activity
It is invaluable in diagnosing performance concerns
If you ask IBM for performance help, IBM will very likely ask you for MONWRITE data
Practice collecting and transmitting MONWRITE data when you are not under duress
Archive your MONWRITE data routinely so that you have a good record of your system’s usual behavior
Learn to use PERFKIT BATCH to generate reports, and get familiar with a few of the basic reports
IBM Systems and Technology Group
© 2007 IBM Corporation13 10/23/2009
1. z/VM is Doing Fine: This study shows how to recognize a healthy z/VM system.2. Logical to Physical CPUs: We’ll look at measures of processor time in an LPAR
environment and how the over commitment of logical to real can affect both LPAR and z/VM.
3. Emergency Scan: We get asked about “emergency scan” from time to time. This case study explains it and tells why seeing it is not always an “emergency” in the literal sense.
4. Why Doesn’t My System Page Faster?: This system isn’t broken, but the customer didn’t understand its behavior. The case study illustrates why it’s important to know the big picture when trying to discern meaning in measurement data.
5. Undersized LPAR: This system is generally short on storage, CPU, and paging. The case study illustrates how to detect it and how to fix it.
6. PAV and MDC: This customer called in with a performance PMR and we ended up taking an APAR. See how we put the finger on a CP bug using CP monitor data.
7. Paging Difficulties: This system was grossly under configured for paging. The case study illustrates what we examined and what changes we recommended. It also illustrates what happens when one relieves a constraint: namely, one usually bumps into another one.
8. HiperSockets Performance: HiperSockets is thought of as a super high speed connectivity feature. This case study looks at some aspects of that performance and a scenario where it might not be as fast as expected.
9. The Grinch that Stole Performance: This case study illustrates how system performance can change when hardware fails. CP Monitor showed where the problem was and pointed the way for a hardware fix.
IBM Systems and Technology Group
© 2007 IBM Corporation14 10/23/2009
Case Study:z/VM is Running
Fine

IBM Systems and Technology Group
© 2007 IBM Corporation15 10/23/2009
Question from Customer
Linux on z/VM on 2086
Java core and heap dumps
Linux transaction rollback exceptions
Linux slow response time
Can you please take a look
I have MONWRITE data for you– … that’s always tempting, so we looked
IBM Systems and Technology Group
© 2007 IBM Corporation16 10/23/2009
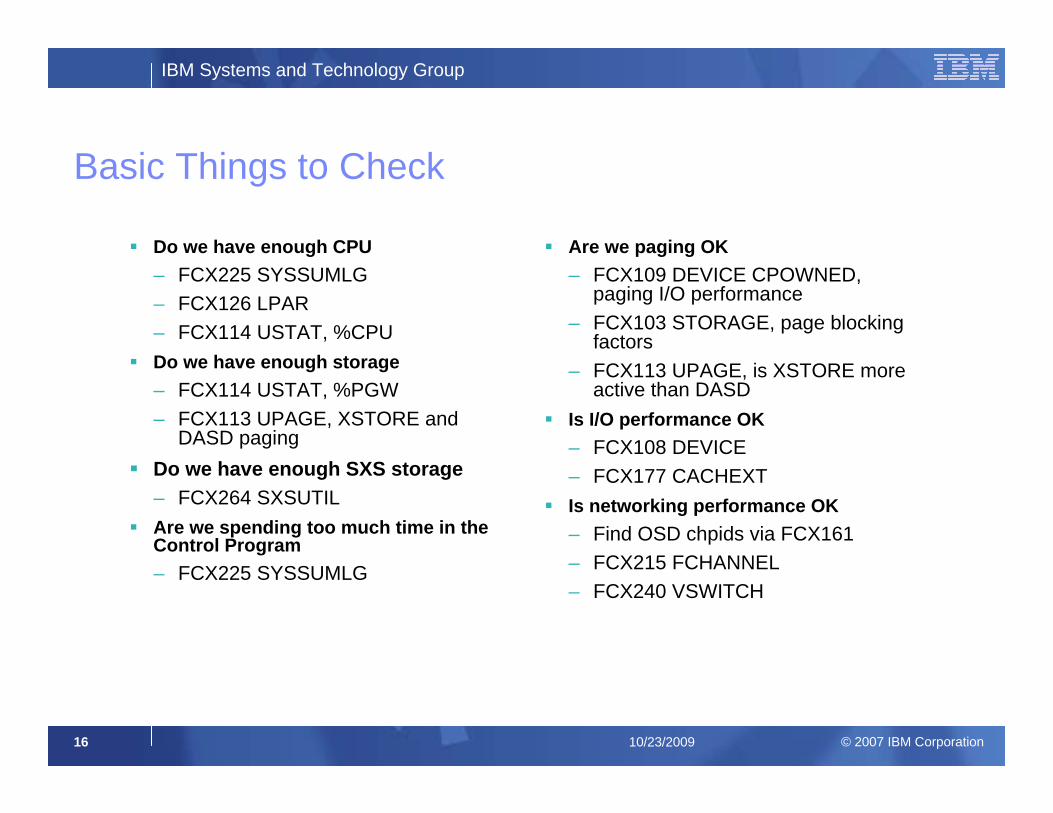
Basic Things to Check
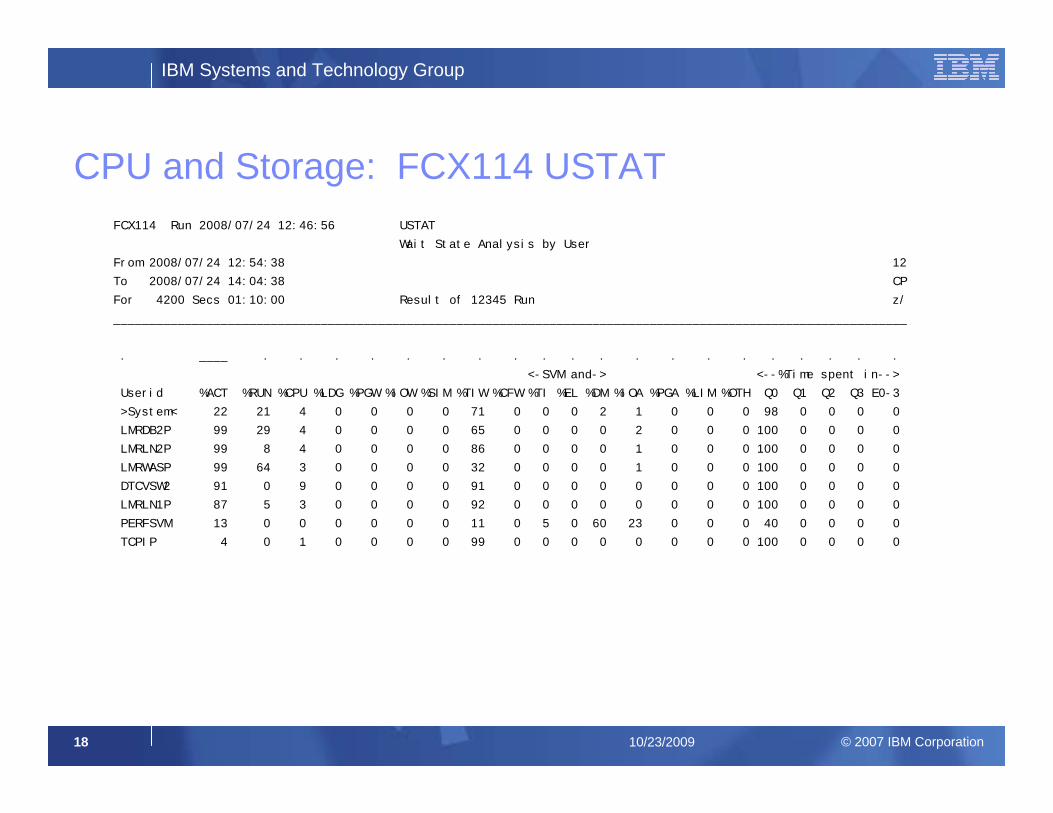
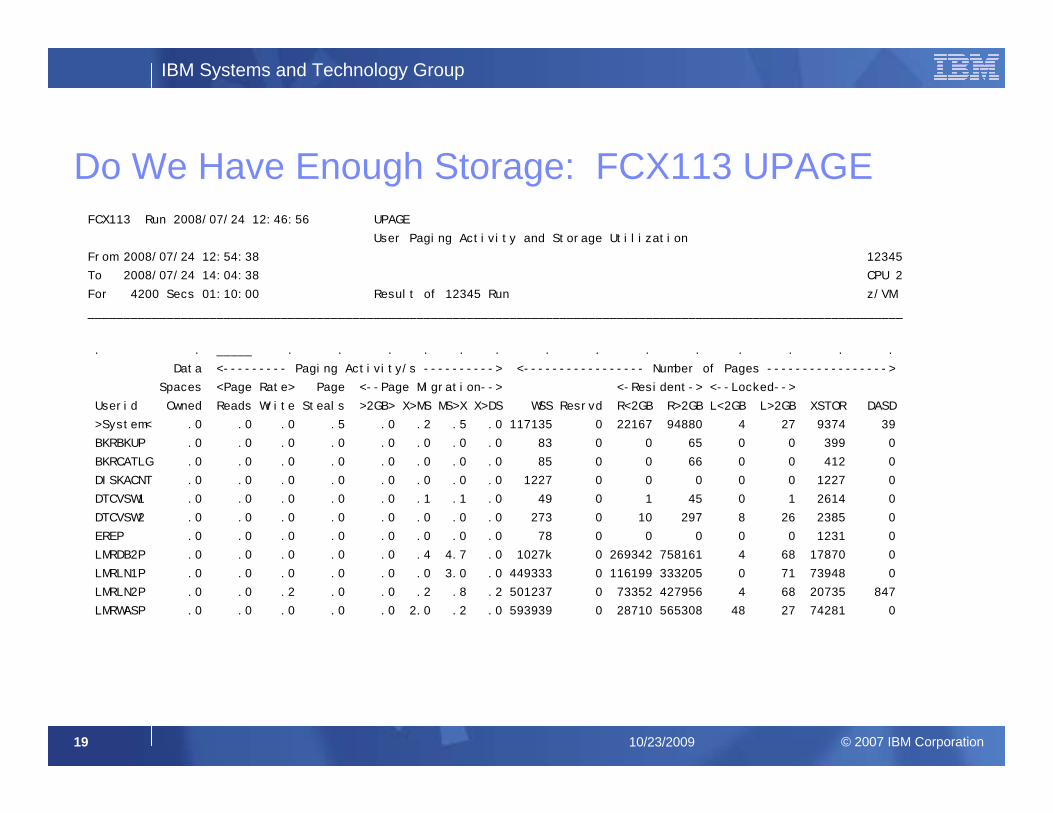
Do we have enough CPU– FCX225 SYSSUMLG– FCX126 LPAR– FCX114 USTAT, %CPUDo we have enough storage– FCX114 USTAT, %PGW– FCX113 UPAGE, XSTORE and
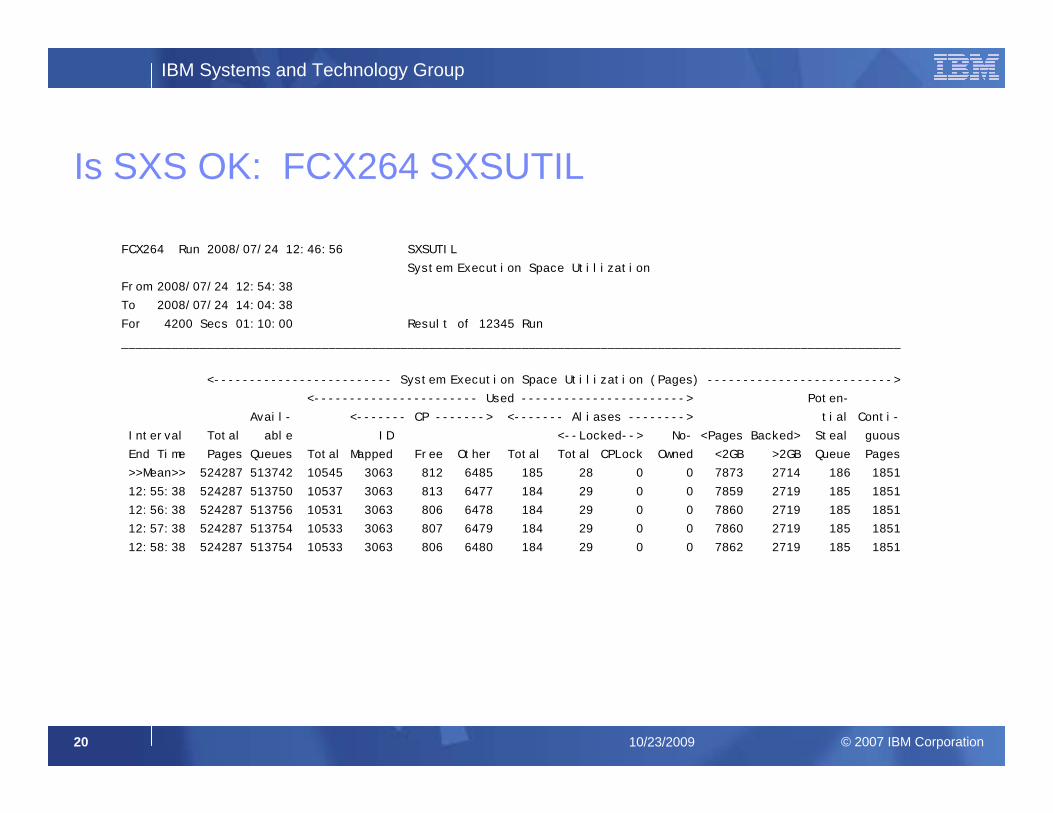
DASD pagingDo we have enough SXS storage– FCX264 SXSUTILAre we spending too much time in the Control Program– FCX225 SYSSUMLG
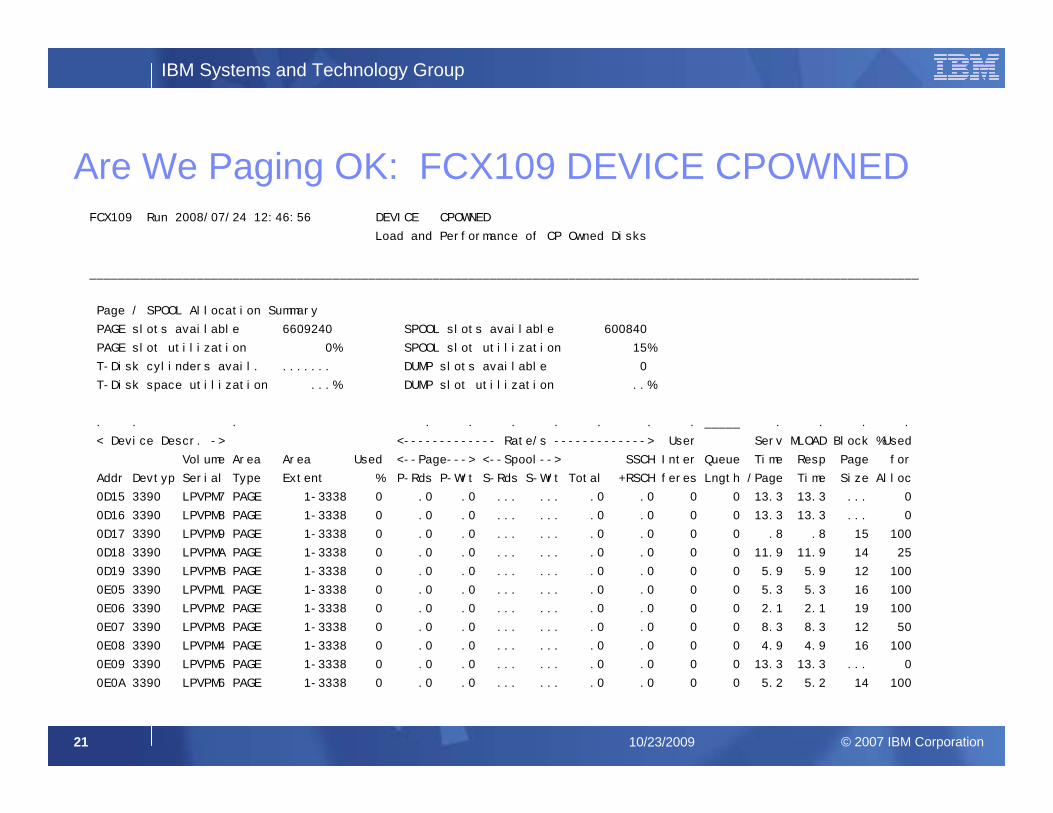
Are we paging OK– FCX109 DEVICE CPOWNED,
paging I/O performance– FCX103 STORAGE, page blocking
factors– FCX113 UPAGE, is XSTORE more
active than DASDIs I/O performance OK– FCX108 DEVICE– FCX177 CACHEXTIs networking performance OK– Find OSD chpids via FCX161– FCX215 FCHANNEL– FCX240 VSWITCH
IBM Systems and Technology Group
© 2007 IBM Corporation17 10/23/2009
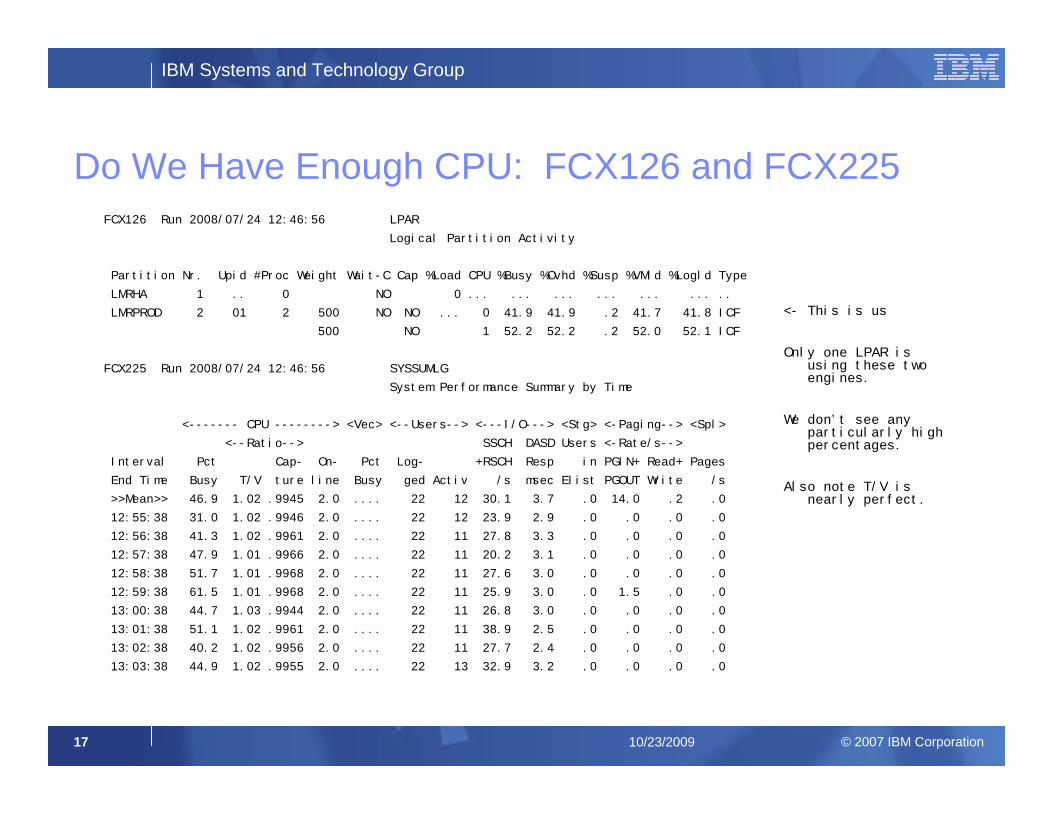
Do We Have Enough CPU: FCX126 and FCX225FCX126 Run 2008/07/24 12:46:56 LPAR
Logical Partition Activity
Partition Nr. Upid #Proc Weight Wait-C Cap %Load CPU %Busy %Ovhd %Susp %VMld %Logld Type
LMRHA 1 .. 0 NO 0 ... ... ... ... ... ... ..
LMRPROD 2 01 2 500 NO NO ... 0 41.9 41.9 .2 41.7 41.8 ICF
500 NO 1 52.2 52.2 .2 52.0 52.1 ICF
FCX225 Run 2008/07/24 12:46:56 SYSSUMLG
System Performance Summary by Time
<------- CPU --------> <Vec> <--Users--> <---I/O---> <Stg> <-Paging--> <Spl>
<--Ratio--> SSCH DASD Users <-Rate/s-->
Interval Pct Cap- On- Pct Log- +RSCH Resp in PGIN+ Read+ Pages
End Time Busy T/V ture line Busy ged Activ /s msec Elist PGOUT Write /s
>>Mean>> 46.9 1.02 .9945 2.0 .... 22 12 30.1 3.7 .0 14.0 .2 .0
12:55:38 31.0 1.02 .9946 2.0 .... 22 12 23.9 2.9 .0 .0 .0 .0
12:56:38 41.3 1.02 .9961 2.0 .... 22 11 27.8 3.3 .0 .0 .0 .0
12:57:38 47.9 1.01 .9966 2.0 .... 22 11 20.2 3.1 .0 .0 .0 .0
12:58:38 51.7 1.01 .9968 2.0 .... 22 11 27.6 3.0 .0 .0 .0 .0
12:59:38 61.5 1.01 .9968 2.0 .... 22 11 25.9 3.0 .0 1.5 .0 .0
13:00:38 44.7 1.03 .9944 2.0 .... 22 11 26.8 3.0 .0 .0 .0 .0
13:01:38 51.1 1.02 .9961 2.0 .... 22 11 38.9 2.5 .0 .0 .0 .0
13:02:38 40.2 1.02 .9956 2.0 .... 22 11 27.7 2.4 .0 .0 .0 .0
13:03:38 44.9 1.02 .9955 2.0 .... 22 13 32.9 3.2 .0 .0 .0 .0
<- This is us
Only one LPAR is using these two engines.
We don’t see any particularly high percentages.
Also note T/V is nearly perfect.
IBM Systems and Technology Group
© 2007 IBM Corporation18 10/23/2009
CPU and Storage: FCX114 USTATFCX114 Run 2008/07/24 12:46:56 USTAT
Wait State Analysis by User
From 2008/07/24 12:54:38 12
To 2008/07/24 14:04:38 CP
For 4200 Secs 01:10:00 Result of 12345 Run z/
_______________________________________________________________________________________________________________
. ____ . . . . . . . . . . . . . . . . . . . .
<-SVM and-> <--%Time spent in-->
Userid %ACT %RUN %CPU %LDG %PGW %IOW %SIM %TIW %CFW %TI %EL %DM %IOA %PGA %LIM %OTH Q0 Q1 Q2 Q3 E0-3
>System< 22 21 4 0 0 0 0 71 0 0 0 2 1 0 0 0 98 0 0 0 0
LMRDB2P 99 29 4 0 0 0 0 65 0 0 0 0 2 0 0 0 100 0 0 0 0
LMRLN2P 99 8 4 0 0 0 0 86 0 0 0 0 1 0 0 0 100 0 0 0 0
LMRWASP 99 64 3 0 0 0 0 32 0 0 0 0 1 0 0 0 100 0 0 0 0
DTCVSW2 91 0 9 0 0 0 0 91 0 0 0 0 0 0 0 0 100 0 0 0 0
LMRLN1P 87 5 3 0 0 0 0 92 0 0 0 0 0 0 0 0 100 0 0 0 0
PERFSVM 13 0 0 0 0 0 0 11 0 5 0 60 23 0 0 0 40 0 0 0 0
TCPIP 4 0 1 0 0 0 0 99 0 0 0 0 0 0 0 0 100 0 0 0 0
IBM Systems and Technology Group
© 2007 IBM Corporation19 10/23/2009
Do We Have Enough Storage: FCX113 UPAGEFCX113 Run 2008/07/24 12:46:56 UPAGE
User Paging Activity and Storage Utilization
From 2008/07/24 12:54:38 12345
To 2008/07/24 14:04:38 CPU 2
For 4200 Secs 01:10:00 Result of 12345 Run z/VM
__________________________________________________________________________________________________________________
. . _____ . . . . . . . . . . . . . .
Data <--------- Paging Activity/s ----------> <----------------- Number of Pages ----------------->
Spaces <Page Rate> Page <--Page Migration--> <-Resident-> <--Locked-->
Userid Owned Reads Write Steals >2GB> X>MS MS>X X>DS WSS Resrvd R<2GB R>2GB L<2GB L>2GB XSTOR DASD
>System< .0 .0 .0 .5 .0 .2 .5 .0 117135 0 22167 94880 4 27 9374 39
BKRBKUP .0 .0 .0 .0 .0 .0 .0 .0 83 0 0 65 0 0 399 0
BKRCATLG .0 .0 .0 .0 .0 .0 .0 .0 85 0 0 66 0 0 412 0
DISKACNT .0 .0 .0 .0 .0 .0 .0 .0 1227 0 0 0 0 0 1227 0
DTCVSW1 .0 .0 .0 .0 .0 .1 .1 .0 49 0 1 45 0 1 2614 0
DTCVSW2 .0 .0 .0 .0 .0 .0 .0 .0 273 0 10 297 8 26 2385 0
EREP .0 .0 .0 .0 .0 .0 .0 .0 78 0 0 0 0 0 1231 0
LMRDB2P .0 .0 .0 .0 .0 .4 4.7 .0 1027k 0 269342 758161 4 68 17870 0
LMRLN1P .0 .0 .0 .0 .0 .0 3.0 .0 449333 0 116199 333205 0 71 73948 0
LMRLN2P .0 .0 .2 .0 .0 .2 .8 .2 501237 0 73352 427956 4 68 20735 847
LMRWASP .0 .0 .0 .0 .0 2.0 .2 .0 593939 0 28710 565308 48 27 74281 0
IBM Systems and Technology Group
© 2007 IBM Corporation20 10/23/2009
Is SXS OK: FCX264 SXSUTIL
FCX264 Run 2008/07/24 12:46:56 SXSUTIL
System Execution Space Utilization
From 2008/07/24 12:54:38
To 2008/07/24 14:04:38
For 4200 Secs 01:10:00 Result of 12345 Run
_____________________________________________________________________________________________________________
<------------------------- System Execution Space Utilization (Pages) -------------------------->
<----------------------- Used -----------------------> Poten-
Avail- <------- CP -------> <------- Aliases --------> tial Conti-
Interval Total able ID <--Locked--> No- <Pages Backed> Steal guous
End Time Pages Queues Total Mapped Free Other Total Total CPLock Owned <2GB >2GB Queue Pages
>>Mean>> 524287 513742 10545 3063 812 6485 185 28 0 0 7873 2714 186 1851
12:55:38 524287 513750 10537 3063 813 6477 184 29 0 0 7859 2719 185 1851
12:56:38 524287 513756 10531 3063 806 6478 184 29 0 0 7860 2719 185 1851
12:57:38 524287 513754 10533 3063 807 6479 184 29 0 0 7860 2719 185 1851
12:58:38 524287 513754 10533 3063 806 6480 184 29 0 0 7862 2719 185 1851
IBM Systems and Technology Group
© 2007 IBM Corporation21 10/23/2009
Are We Paging OK: FCX109 DEVICE CPOWNEDFCX109 Run 2008/07/24 12:46:56 DEVICE CPOWNED
Load and Performance of CP Owned Disks
____________________________________________________________________________________________________________________
Page / SPOOL Allocation Summary
PAGE slots available 6609240 SPOOL slots available 600840
PAGE slot utilization 0% SPOOL slot utilization 15%
T-Disk cylinders avail. ....... DUMP slots available 0
T-Disk space utilization ...% DUMP slot utilization ..%
. . . . . . . . . . _____ . . . .
< Device Descr. -> <------------- Rate/s -------------> User Serv MLOAD Block %Used
Volume Area Area Used <--Page---> <--Spool--> SSCH Inter Queue Time Resp Page for
Addr Devtyp Serial Type Extent % P-Rds P-Wrt S-Rds S-Wrt Total +RSCH feres Lngth /Page Time Size Alloc
0D15 3390 LPVPM7 PAGE 1-3338 0 .0 .0 ... ... .0 .0 0 0 13.3 13.3 ... 0
0D16 3390 LPVPM8 PAGE 1-3338 0 .0 .0 ... ... .0 .0 0 0 13.3 13.3 ... 0
0D17 3390 LPVPM9 PAGE 1-3338 0 .0 .0 ... ... .0 .0 0 0 .8 .8 15 100
0D18 3390 LPVPMA PAGE 1-3338 0 .0 .0 ... ... .0 .0 0 0 11.9 11.9 14 25
0D19 3390 LPVPMB PAGE 1-3338 0 .0 .0 ... ... .0 .0 0 0 5.9 5.9 12 100
0E05 3390 LPVPM1 PAGE 1-3338 0 .0 .0 ... ... .0 .0 0 0 5.3 5.3 16 100
0E06 3390 LPVPM2 PAGE 1-3338 0 .0 .0 ... ... .0 .0 0 0 2.1 2.1 19 100
0E07 3390 LPVPM3 PAGE 1-3338 0 .0 .0 ... ... .0 .0 0 0 8.3 8.3 12 50
0E08 3390 LPVPM4 PAGE 1-3338 0 .0 .0 ... ... .0 .0 0 0 4.9 4.9 16 100
0E09 3390 LPVPM5 PAGE 1-3338 0 .0 .0 ... ... .0 .0 0 0 13.3 13.3 ... 0
0E0A 3390 LPVPM6 PAGE 1-3338 0 .0 .0 ... ... .0 .0 0 0 5.2 5.2 14 100
IBM Systems and Technology Group
© 2007 IBM Corporation22 10/23/2009
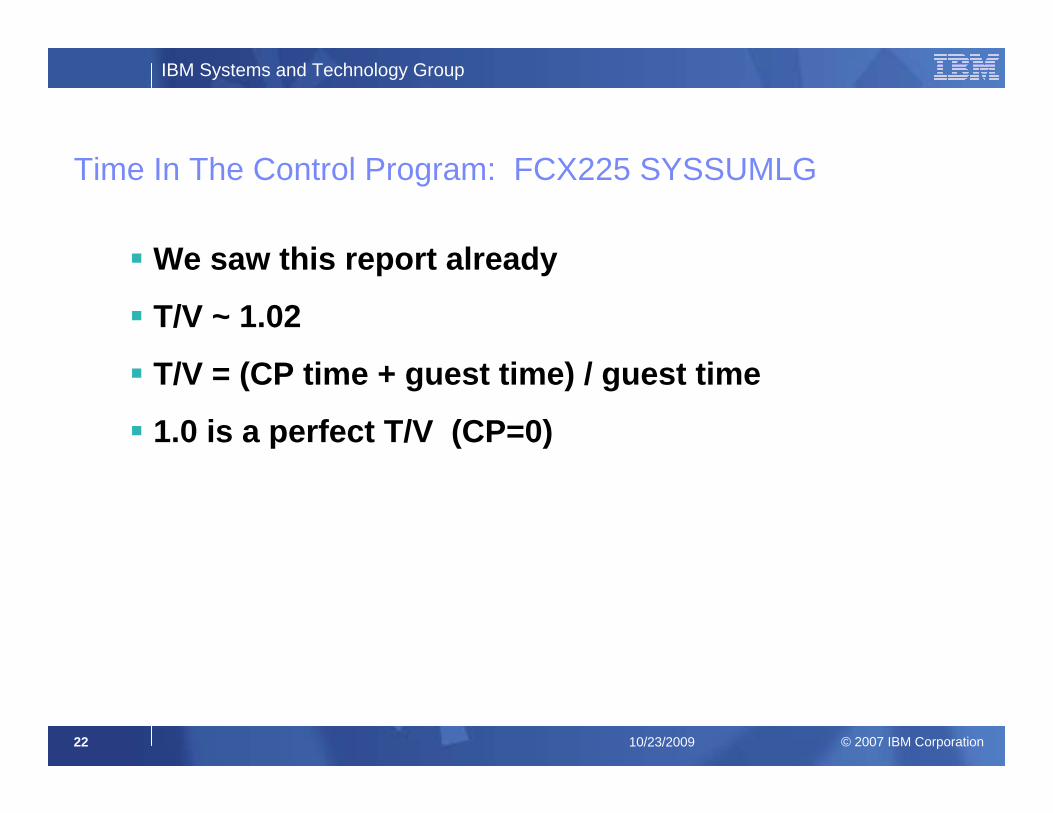
Time In The Control Program: FCX225 SYSSUMLG
We saw this report already
T/V ~ 1.02
T/V = (CP time + guest time) / guest time
1.0 is a perfect T/V (CP=0)
IBM Systems and Technology Group
© 2007 IBM Corporation23 10/23/2009
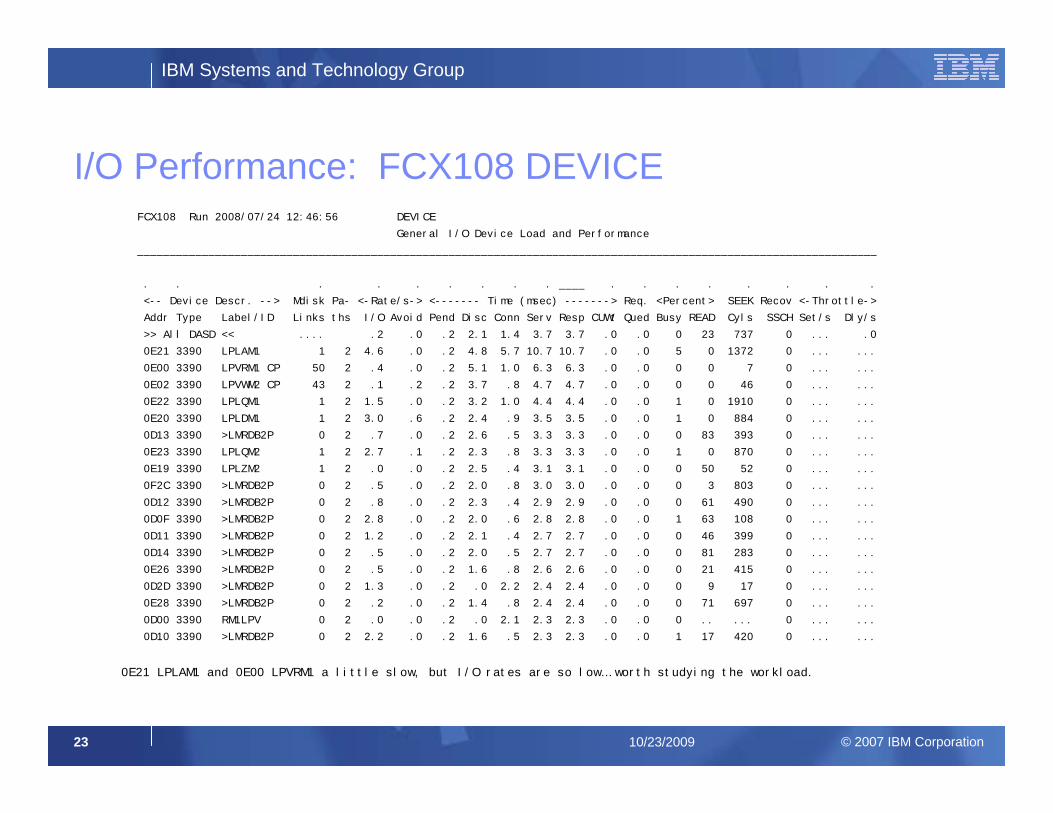
I/O Performance: FCX108 DEVICEFCX108 Run 2008/07/24 12:46:56 DEVICE
General I/O Device Load and Performance
__________________________________________________________________________________________________________________
. . . . . . . . . ____ . . . . . . . .
<-- Device Descr. --> Mdisk Pa- <-Rate/s-> <------- Time (msec) -------> Req. <Percent> SEEK Recov <-Throttle->
Addr Type Label/ID Links ths I/O Avoid Pend Disc Conn Serv Resp CUWt Qued Busy READ Cyls SSCH Set/s Dly/s
>> All DASD << .... .2 .0 .2 2.1 1.4 3.7 3.7 .0 .0 0 23 737 0 ... .0
0E21 3390 LPLAM1 1 2 4.6 .0 .2 4.8 5.7 10.7 10.7 .0 .0 5 0 1372 0 ... ...
0E00 3390 LPVRM1 CP 50 2 .4 .0 .2 5.1 1.0 6.3 6.3 .0 .0 0 0 7 0 ... ...
0E02 3390 LPVWM2 CP 43 2 .1 .2 .2 3.7 .8 4.7 4.7 .0 .0 0 0 46 0 ... ...
0E22 3390 LPLQM1 1 2 1.5 .0 .2 3.2 1.0 4.4 4.4 .0 .0 1 0 1910 0 ... ...
0E20 3390 LPLDM1 1 2 3.0 .6 .2 2.4 .9 3.5 3.5 .0 .0 1 0 884 0 ... ...
0D13 3390 >LMRDB2P 0 2 .7 .0 .2 2.6 .5 3.3 3.3 .0 .0 0 83 393 0 ... ...
0E23 3390 LPLQM2 1 2 2.7 .1 .2 2.3 .8 3.3 3.3 .0 .0 1 0 870 0 ... ...
0E19 3390 LPLZM2 1 2 .0 .0 .2 2.5 .4 3.1 3.1 .0 .0 0 50 52 0 ... ...
0F2C 3390 >LMRDB2P 0 2 .5 .0 .2 2.0 .8 3.0 3.0 .0 .0 0 3 803 0 ... ...
0D12 3390 >LMRDB2P 0 2 .8 .0 .2 2.3 .4 2.9 2.9 .0 .0 0 61 490 0 ... ...
0D0F 3390 >LMRDB2P 0 2 2.8 .0 .2 2.0 .6 2.8 2.8 .0 .0 1 63 108 0 ... ...
0D11 3390 >LMRDB2P 0 2 1.2 .0 .2 2.1 .4 2.7 2.7 .0 .0 0 46 399 0 ... ...
0D14 3390 >LMRDB2P 0 2 .5 .0 .2 2.0 .5 2.7 2.7 .0 .0 0 81 283 0 ... ...
0E26 3390 >LMRDB2P 0 2 .5 .0 .2 1.6 .8 2.6 2.6 .0 .0 0 21 415 0 ... ...
0D2D 3390 >LMRDB2P 0 2 1.3 .0 .2 .0 2.2 2.4 2.4 .0 .0 0 9 17 0 ... ...
0E28 3390 >LMRDB2P 0 2 .2 .0 .2 1.4 .8 2.4 2.4 .0 .0 0 71 697 0 ... ...
0D00 3390 RM1LPV 0 2 .0 .0 .2 .0 2.1 2.3 2.3 .0 .0 0 .. ... 0 ... ...
0D10 3390 >LMRDB2P 0 2 2.2 .0 .2 1.6 .5 2.3 2.3 .0 .0 1 17 420 0 ... ...
0E21 LPLAM1 and 0E00 LPVRM1 a little slow, but I/O rates are so low… worth studying the workload.
IBM Systems and Technology Group
© 2007 IBM Corporation24 10/23/2009
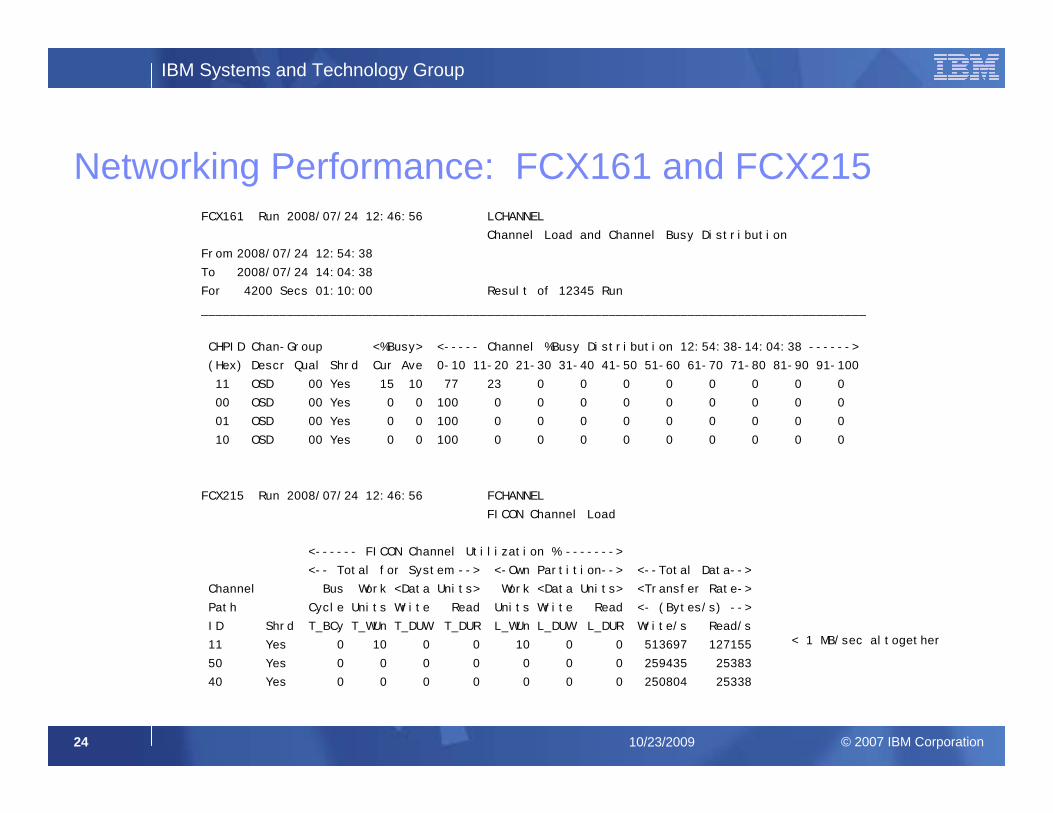
Networking Performance: FCX161 and FCX215FCX161 Run 2008/07/24 12:46:56 LCHANNEL
Channel Load and Channel Busy Distribution
From 2008/07/24 12:54:38
To 2008/07/24 14:04:38
For 4200 Secs 01:10:00 Result of 12345 Run
_____________________________________________________________________________________________
CHPID Chan-Group <%Busy> <----- Channel %Busy Distribution 12:54:38-14:04:38 ------>
(Hex) Descr Qual Shrd Cur Ave 0-10 11-20 21-30 31-40 41-50 51-60 61-70 71-80 81-90 91-100
11 OSD 00 Yes 15 10 77 23 0 0 0 0 0 0 0 0
00 OSD 00 Yes 0 0 100 0 0 0 0 0 0 0 0 0
01 OSD 00 Yes 0 0 100 0 0 0 0 0 0 0 0 0
10 OSD 00 Yes 0 0 100 0 0 0 0 0 0 0 0 0
FCX215 Run 2008/07/24 12:46:56 FCHANNEL
FICON Channel Load
<------ FICON Channel Utilization % ------->
<-- Total for System --> <-Own Partition--> <--Total Data-->
Channel Bus Work <Data Units> Work <Data Units> <Transfer Rate->
Path Cycle Units Write Read Units Write Read <- (Bytes/s) -->
ID Shrd T_BCy T_WUn T_DUW T_DUR L_WUn L_DUW L_DUR Write/s Read/s
11 Yes 0 10 0 0 10 0 0 513697 127155
50 Yes 0 0 0 0 0 0 0 259435 25383
40 Yes 0 0 0 0 0 0 0 250804 25338
< 1 MB/sec altogether
IBM Systems and Technology Group
© 2007 IBM Corporation25 10/23/2009
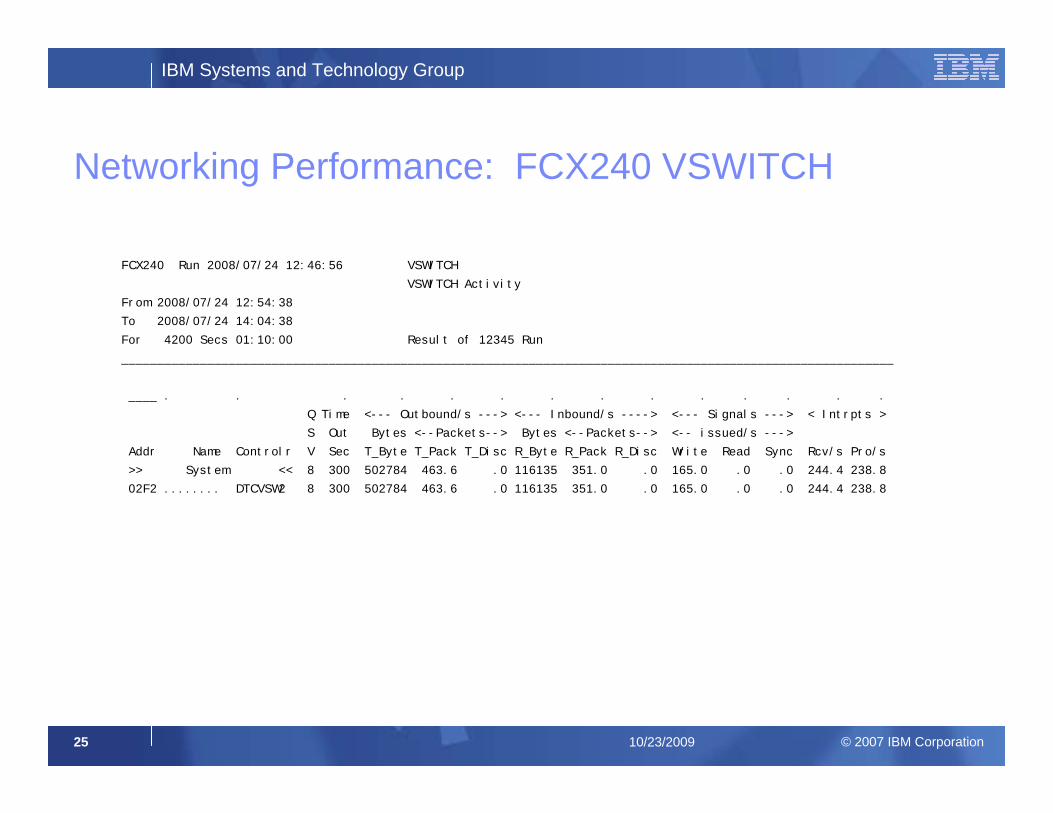
Networking Performance: FCX240 VSWITCH
FCX240 Run 2008/07/24 12:46:56 VSWITCH
VSWITCH Activity
From 2008/07/24 12:54:38
To 2008/07/24 14:04:38
For 4200 Secs 01:10:00 Result of 12345 Run
____________________________________________________________________________________________________________
____ . . . . . . . . . . . . . .
Q Time <--- Outbound/s ---> <--- Inbound/s ----> <--- Signals ---> < Intrpts >
S Out Bytes <--Packets--> Bytes <--Packets--> <-- issued/s --->
Addr Name Controlr V Sec T_Byte T_Pack T_Disc R_Byte R_Pack R_Disc Write Read Sync Rcv/s Pro/s
>> System << 8 300 502784 463.6 .0 116135 351.0 .0 165.0 .0 .0 244.4 238.8
02F2 ........ DTCVSW2 8 300 502784 463.6 .0 116135 351.0 .0 165.0 .0 .0 244.4 238.8
IBM Systems and Technology Group
© 2007 IBM Corporation26 10/23/2009
Summary
There doesn’t seem to be anything wrong with this z/VM
It’s worth looking inside the Linux guests
The questioner directed to Linux support
IBM Systems and Technology Group
© 2007 IBM Corporation27 10/23/2009
Case Study:Logical to Physical
IBM Systems and Technology Group
© 2007 IBM Corporation28 10/23/2009
Logical to Physical Processor Ratios
As the number of partitions and their size increases, questions continue to arise as to how to configure z/VM systems
This case study illustrates some of the factors and information that can be examined
More complex scenarios would include mixed engine environments
IBM Systems and Technology Group
© 2007 IBM Corporation29 10/23/2009
Configuration
2097-401
18 Physical Processors– 1 CP
– 17 IFLs• 3 Dedicated
11 Partitions– 5 Active Shared: 3+3+13+13+2 = 34 logicals IFLs
Ratio of Non-dedicated Logical to Physical CPUs: 2.4
IBM Systems and Technology Group
© 2007 IBM Corporation30 10/23/2009
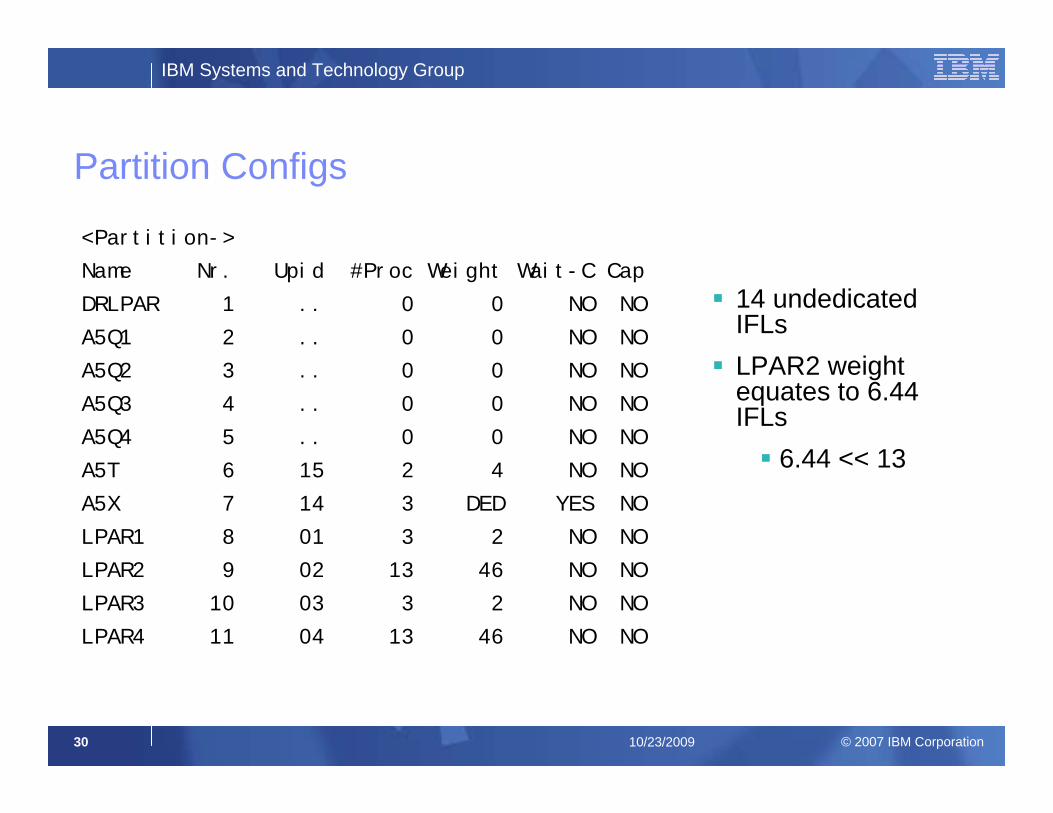
Partition Configs
<Partition->
Name Nr. Upid #Proc Weight Wait-C Cap
DRLPAR 1 .. 0 0 NO NO
A5Q1 2 .. 0 0 NO NO
A5Q2 3 .. 0 0 NO NO
A5Q3 4 .. 0 0 NO NO
A5Q4 5 .. 0 0 NO NO
A5T 6 15 2 4 NO NO
A5X 7 14 3 DED YES NO
LPAR1 8 01 3 2 NO NO
LPAR2 9 02 13 46 NO NO
LPAR3 10 03 3 2 NO NO
LPAR4 11 04 13 46 NO NO
14 undedicated IFLsLPAR2 weight equates to 6.44 IFLs
6.44 << 13
IBM Systems and Technology Group
© 2007 IBM Corporation31 10/23/2009
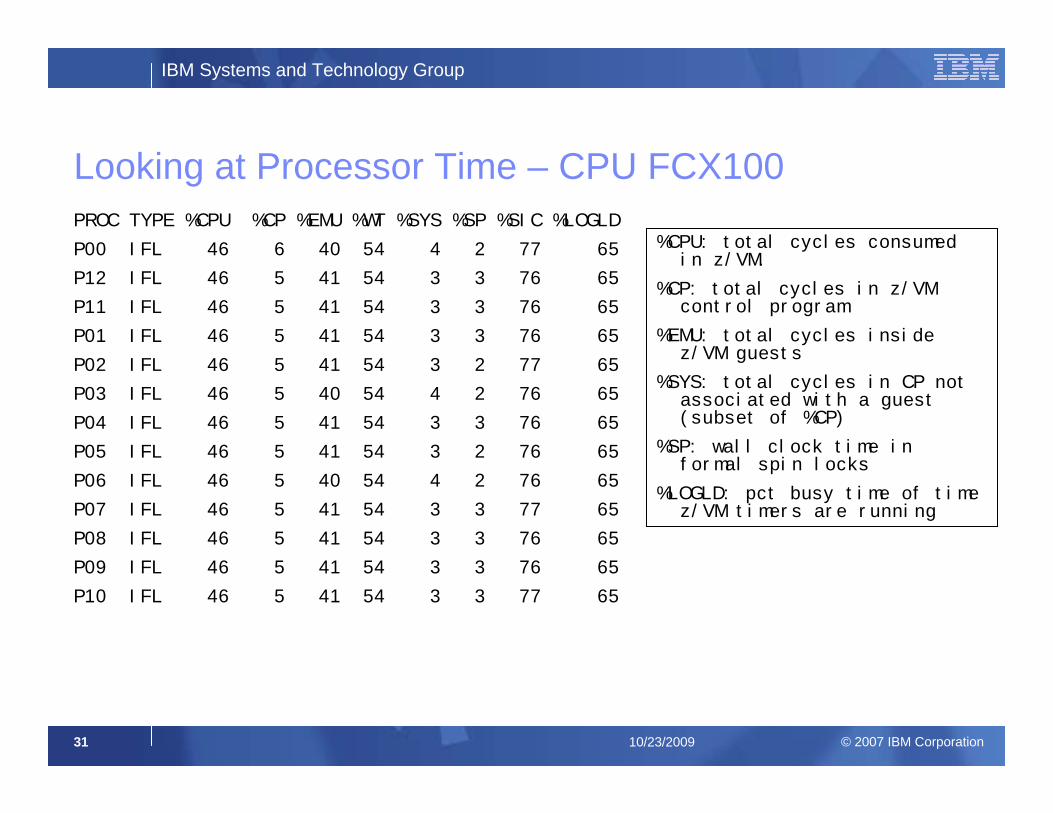
Looking at Processor Time – CPU FCX100PROC TYPE %CPU %CP %EMU %WT %SYS %SP %SIC %LOGLD
P00 IFL 46 6 40 54 4 2 77 65
P12 IFL 46 5 41 54 3 3 76 65
P11 IFL 46 5 41 54 3 3 76 65
P01 IFL 46 5 41 54 3 3 76 65
P02 IFL 46 5 41 54 3 2 77 65
P03 IFL 46 5 40 54 4 2 76 65
P04 IFL 46 5 41 54 3 3 76 65
P05 IFL 46 5 41 54 3 2 76 65
P06 IFL 46 5 40 54 4 2 76 65
P07 IFL 46 5 41 54 3 3 77 65
P08 IFL 46 5 41 54 3 3 76 65
P09 IFL 46 5 41 54 3 3 76 65
P10 IFL 46 5 41 54 3 3 77 65
%CPU: total cycles consumed in z/VM.
%CP: total cycles in z/VM control program
%EMU: total cycles inside z/VM guests
%SYS: total cycles in CP not associated with a guest (subset of %CP)
%SP: wall clock time in formal spin locks
%LOGLD: pct busy time of time z/VM timers are running
IBM Systems and Technology Group
© 2007 IBM Corporation32 10/23/2009
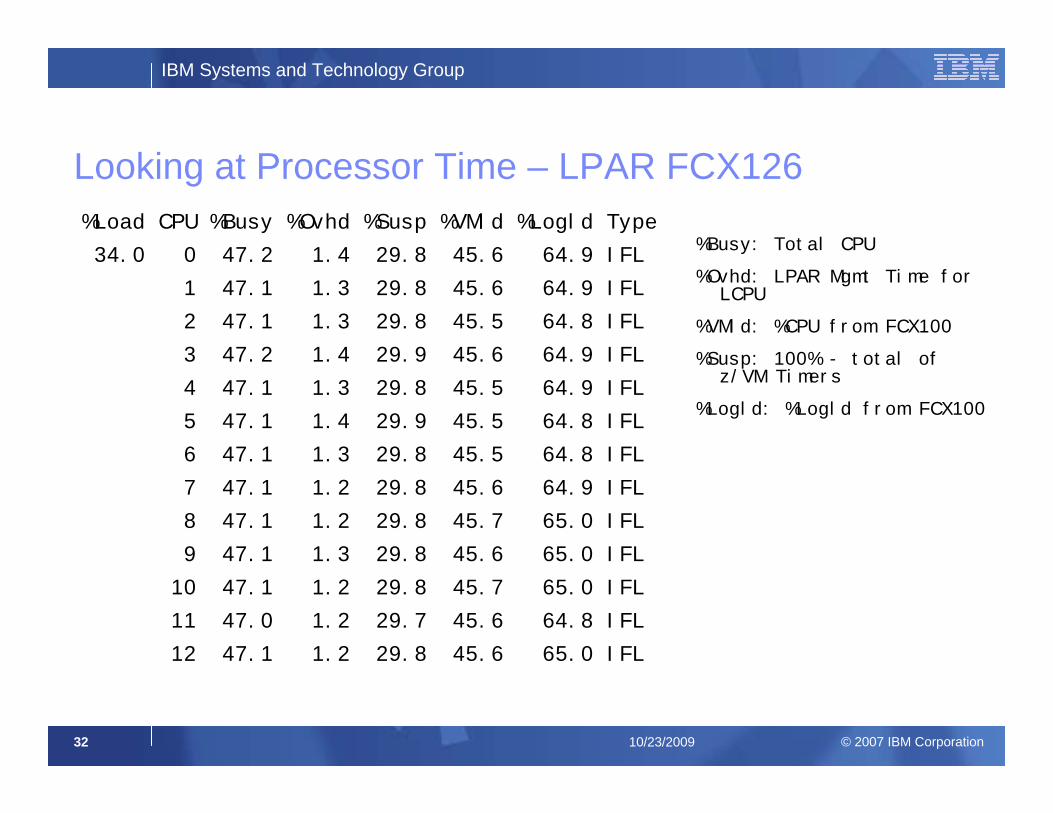
Looking at Processor Time – LPAR FCX126%Load CPU %Busy %Ovhd %Susp %VMld %Logld Type
34.0 0 47.2 1.4 29.8 45.6 64.9 IFL
1 47.1 1.3 29.8 45.6 64.9 IFL
2 47.1 1.3 29.8 45.5 64.8 IFL
3 47.2 1.4 29.9 45.6 64.9 IFL
4 47.1 1.3 29.8 45.5 64.9 IFL
5 47.1 1.4 29.9 45.5 64.8 IFL
6 47.1 1.3 29.8 45.5 64.8 IFL
7 47.1 1.2 29.8 45.6 64.9 IFL
8 47.1 1.2 29.8 45.7 65.0 IFL
9 47.1 1.3 29.8 45.6 65.0 IFL
10 47.1 1.2 29.8 45.7 65.0 IFL
11 47.0 1.2 29.7 45.6 64.8 IFL
12 47.1 1.2 29.8 45.6 65.0 IFL
%Busy: Total CPU
%Ovhd: LPAR Mgmt Time for LCPU
%VMld: %CPU from FCX100
%Susp: 100% - total of z/VM Timers
%Logld: %Logld from FCX100
IBM Systems and Technology Group
© 2007 IBM Corporation33 10/23/2009
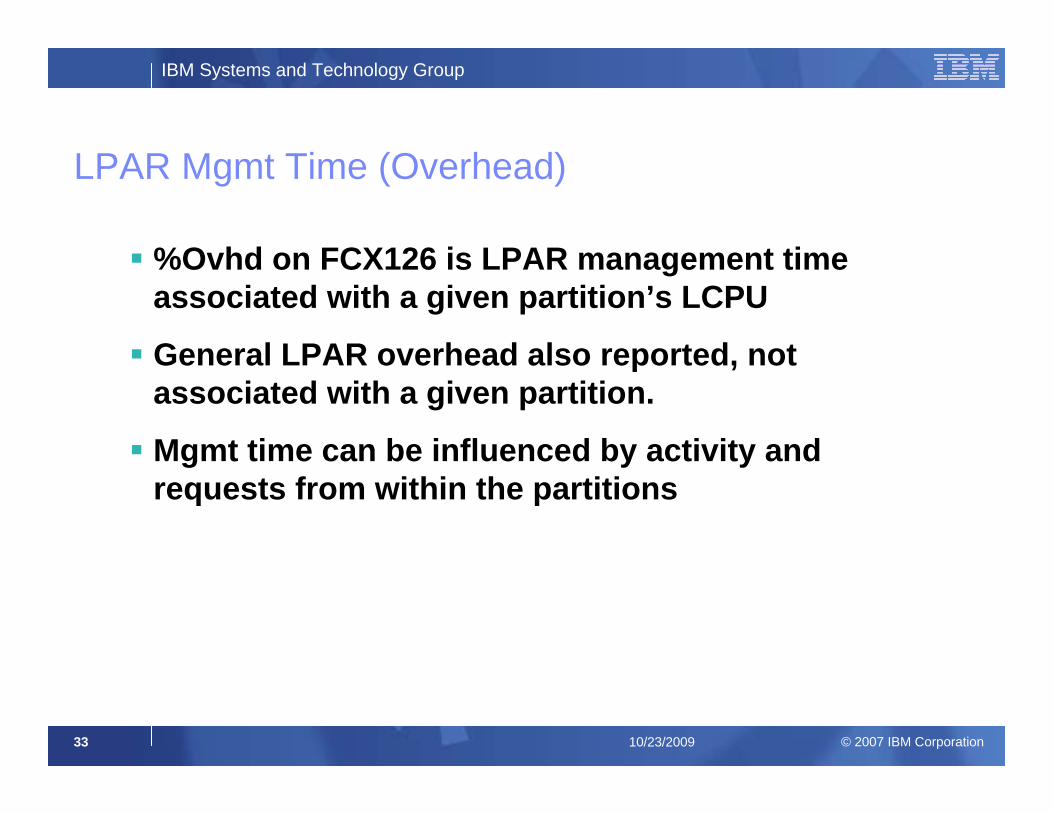
LPAR Mgmt Time (Overhead)
%Ovhd on FCX126 is LPAR management time associated with a given partition’s LCPU
General LPAR overhead also reported, not associated with a given partition.
Mgmt time can be influenced by activity and requests from within the partitions
IBM Systems and Technology Group
© 2007 IBM Corporation34 10/23/2009
LPAR Suspend Time
An approximation of when z/VM partition is removed from running for either:– Being capped
– Running other partitions
– z/VM giving up time via diagnoses while waiting on locks
Another side effect of high suspend time– z/VM User State Sampling could be skewed
IBM Systems and Technology Group
© 2007 IBM Corporation35 10/23/2009
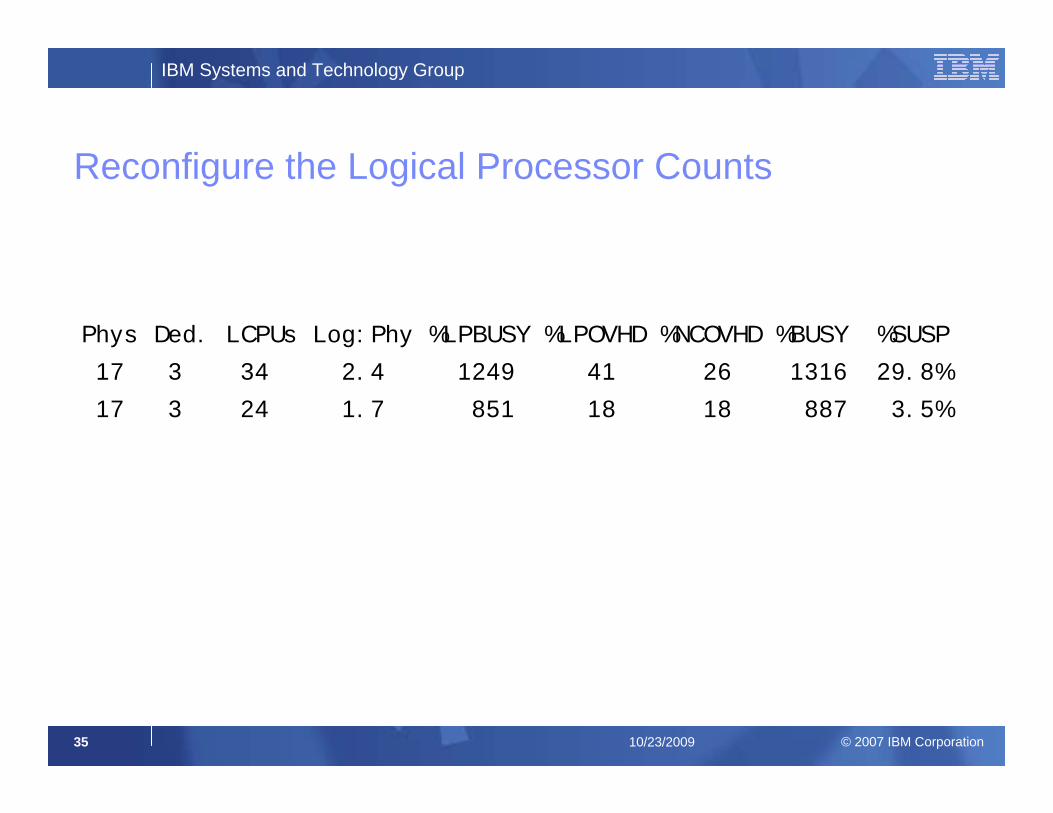
Reconfigure the Logical Processor Counts
Phys Ded. LCPUs Log:Phy %LPBUSY %LPOVHD %NCOVHD %BUSY %SUSP
17 3 34 2.4 1249 41 26 1316 29.8%
17 3 24 1.7 851 18 18 887 3.5%
IBM Systems and Technology Group
© 2007 IBM Corporation36 10/23/2009
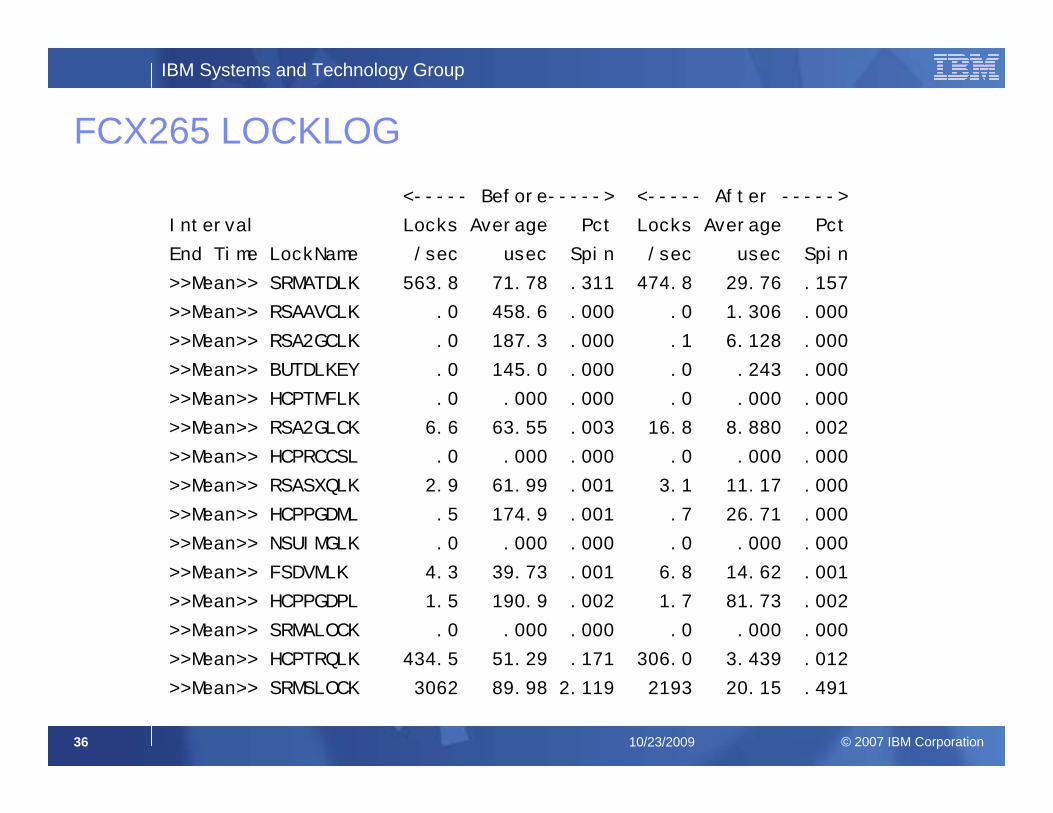
FCX265 LOCKLOG<----- Before-----> <----- After ----->
Interval Locks Average Pct Locks Average Pct
End Time LockName /sec usec Spin /sec usec Spin
>>Mean>> SRMATDLK 563.8 71.78 .311 474.8 29.76 .157
>>Mean>> RSAAVCLK .0 458.6 .000 .0 1.306 .000
>>Mean>> RSA2GCLK .0 187.3 .000 .1 6.128 .000
>>Mean>> BUTDLKEY .0 145.0 .000 .0 .243 .000
>>Mean>> HCPTMFLK .0 .000 .000 .0 .000 .000
>>Mean>> RSA2GLCK 6.6 63.55 .003 16.8 8.880 .002
>>Mean>> HCPRCCSL .0 .000 .000 .0 .000 .000
>>Mean>> RSASXQLK 2.9 61.99 .001 3.1 11.17 .000
>>Mean>> HCPPGDML .5 174.9 .001 .7 26.71 .000
>>Mean>> NSUIMGLK .0 .000 .000 .0 .000 .000
>>Mean>> FSDVMLK 4.3 39.73 .001 6.8 14.62 .001
>>Mean>> HCPPGDPL 1.5 190.9 .002 1.7 81.73 .002
>>Mean>> SRMALOCK .0 .000 .000 .0 .000 .000
>>Mean>> HCPTRQLK 434.5 51.29 .171 306.0 3.439 .012
>>Mean>> SRMSLOCK 3062 89.98 2.119 2193 20.15 .491
IBM Systems and Technology Group
© 2007 IBM Corporation37 10/23/2009
Summary
Various rules of thumbs for Logical to Physical
Starting points
Look at data
Suspend time is helpful but has multiple causes
IBM Systems and Technology Group
© 2007 IBM Corporation38 10/23/2009
Case Study:Emergency Scan
IBM Systems and Technology Group
© 2007 IBM Corporation39 10/23/2009
Question from Customer
My system seems to have a high percentage of emergency scan
Application performance doesn’t seem bothered
Should I be worried?
IBM Systems and Technology Group
© 2007 IBM Corporation40 10/23/2009
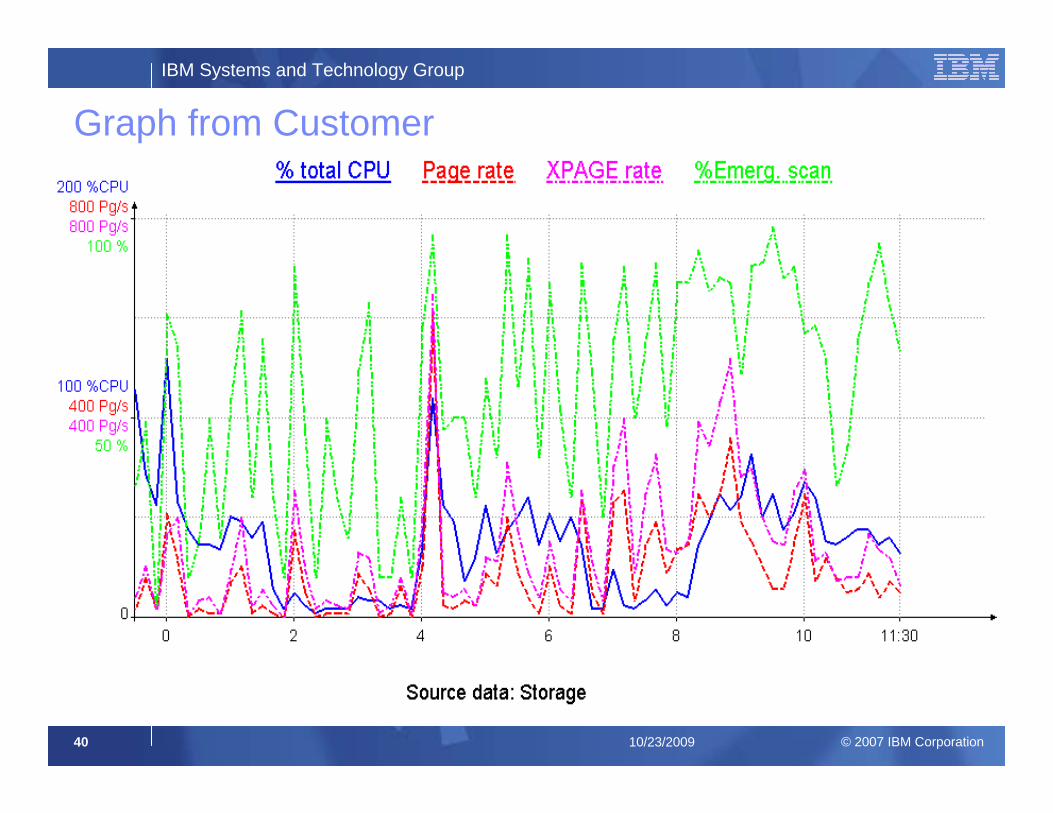
Graph from Customer
IBM Systems and Technology Group
© 2007 IBM Corporation41 10/23/2009
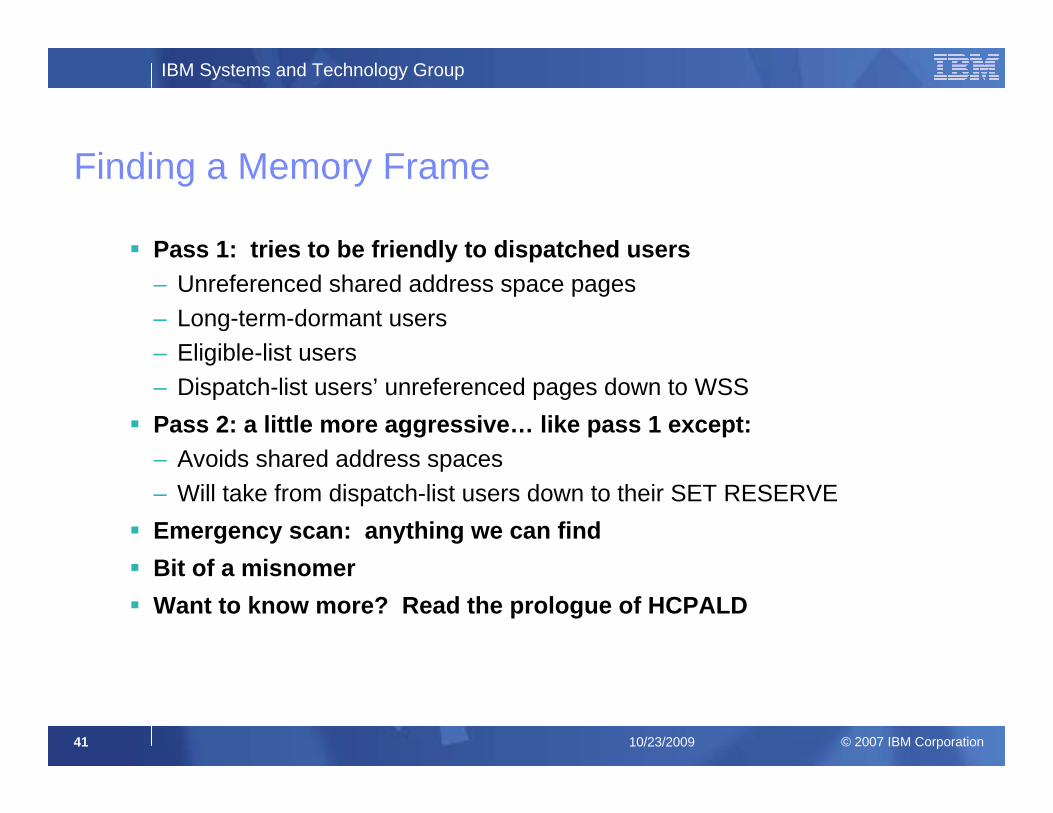
Finding a Memory Frame
Pass 1: tries to be friendly to dispatched users– Unreferenced shared address space pages– Long-term-dormant users– Eligible-list users– Dispatch-list users’ unreferenced pages down to WSSPass 2: a little more aggressive… like pass 1 except:– Avoids shared address spaces– Will take from dispatch-list users down to their SET RESERVEEmergency scan: anything we can findBit of a misnomerWant to know more? Read the prologue of HCPALD
IBM Systems and Technology Group
© 2007 IBM Corporation42 10/23/2009
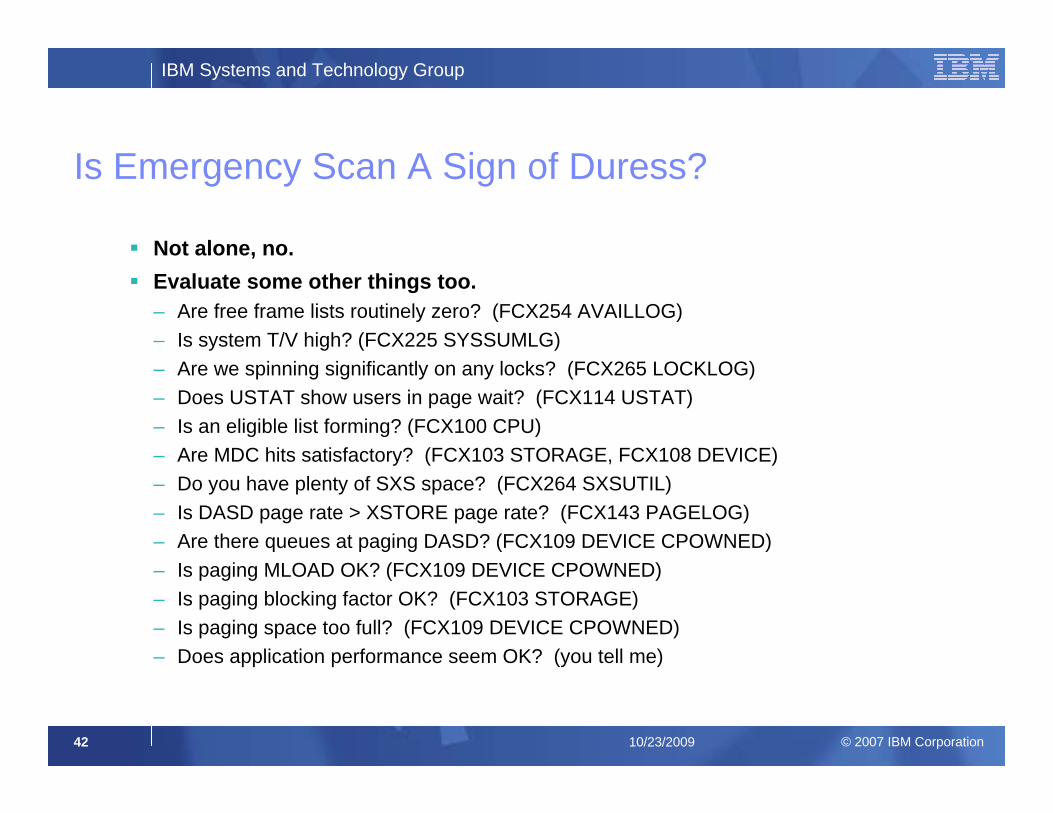
Is Emergency Scan A Sign of Duress?
Not alone, no.Evaluate some other things too.– Are free frame lists routinely zero? (FCX254 AVAILLOG)– Is system T/V high? (FCX225 SYSSUMLG)– Are we spinning significantly on any locks? (FCX265 LOCKLOG)– Does USTAT show users in page wait? (FCX114 USTAT)– Is an eligible list forming? (FCX100 CPU)– Are MDC hits satisfactory? (FCX103 STORAGE, FCX108 DEVICE)– Do you have plenty of SXS space? (FCX264 SXSUTIL)– Is DASD page rate > XSTORE page rate? (FCX143 PAGELOG)– Are there queues at paging DASD? (FCX109 DEVICE CPOWNED)– Is paging MLOAD OK? (FCX109 DEVICE CPOWNED)– Is paging blocking factor OK? (FCX103 STORAGE)– Is paging space too full? (FCX109 DEVICE CPOWNED)– Does application performance seem OK? (you tell me)
IBM Systems and Technology Group
© 2007 IBM Corporation43 10/23/2009
Storage Management and VDISKs
Referenced VDISK pages are avoided in Pass 1
This customer realized he had a lot of VDISK for Linux swap space
If those VDISK pages are used often, they will tend to stick and be ejectable by only emergency scan
Hmm, customer tried an experiment…
IBM Systems and Technology Group
© 2007 IBM Corporation44 10/23/2009
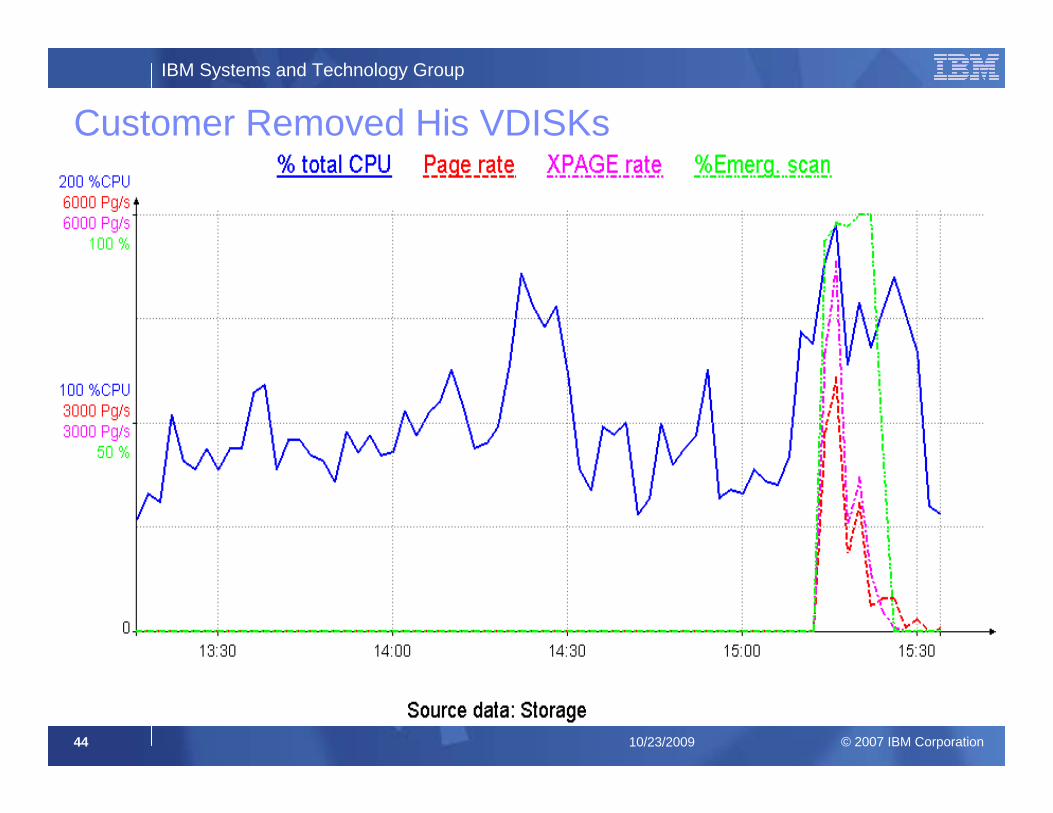
Customer Removed His VDISKs
IBM Systems and Technology Group
© 2007 IBM Corporation45 10/23/2009
Summary
Try to look at system as a whole
Whether applications seem debilitated is the best indicator of whether the system is suffering
IBM Systems and Technology Group
© 2007 IBM Corporation46 10/23/2009
Case Study: Why Doesn’t My System
Page Faster
IBM Systems and Technology Group
© 2007 IBM Corporation47 10/23/2009
Question from Customer
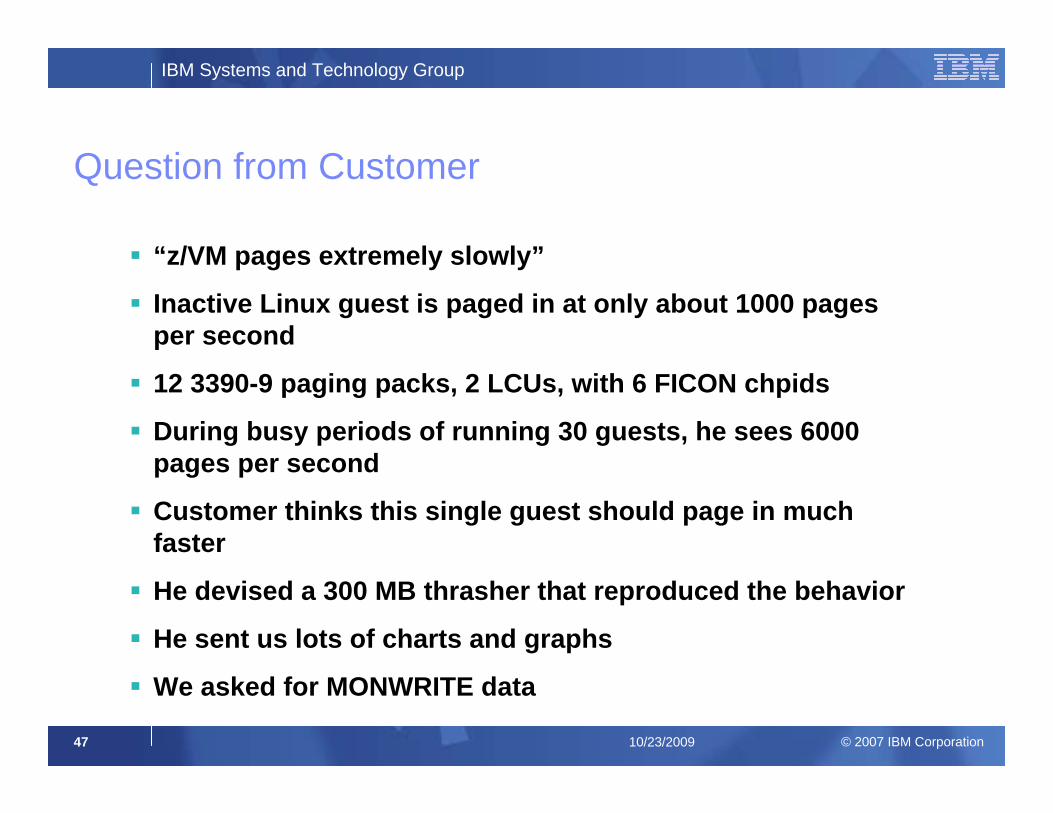
“z/VM pages extremely slowly”
Inactive Linux guest is paged in at only about 1000 pages per second
12 3390-9 paging packs, 2 LCUs, with 6 FICON chpids
During busy periods of running 30 guests, he sees 6000 pages per second
Customer thinks this single guest should page in much faster
He devised a 300 MB thrasher that reproduced the behavior
He sent us lots of charts and graphs
We asked for MONWRITE data

IBM Systems and Technology Group
© 2007 IBM Corporation48 10/23/2009
Customer Sent MONWRITE Data
User LIN102 is running the 300 MB thrasher
It touched 64,000 pages in 61 seconds (1049/sec)
The interesting time period is 15:12:30 to 15:13:20
He used MONITOR SAMPLE 10 SEC (brilliant!)
Ran his data through PERFKIT BATCH
Looked at some interesting reports for that period
IBM Systems and Technology Group
© 2007 IBM Corporation49 10/23/2009
User Configuration
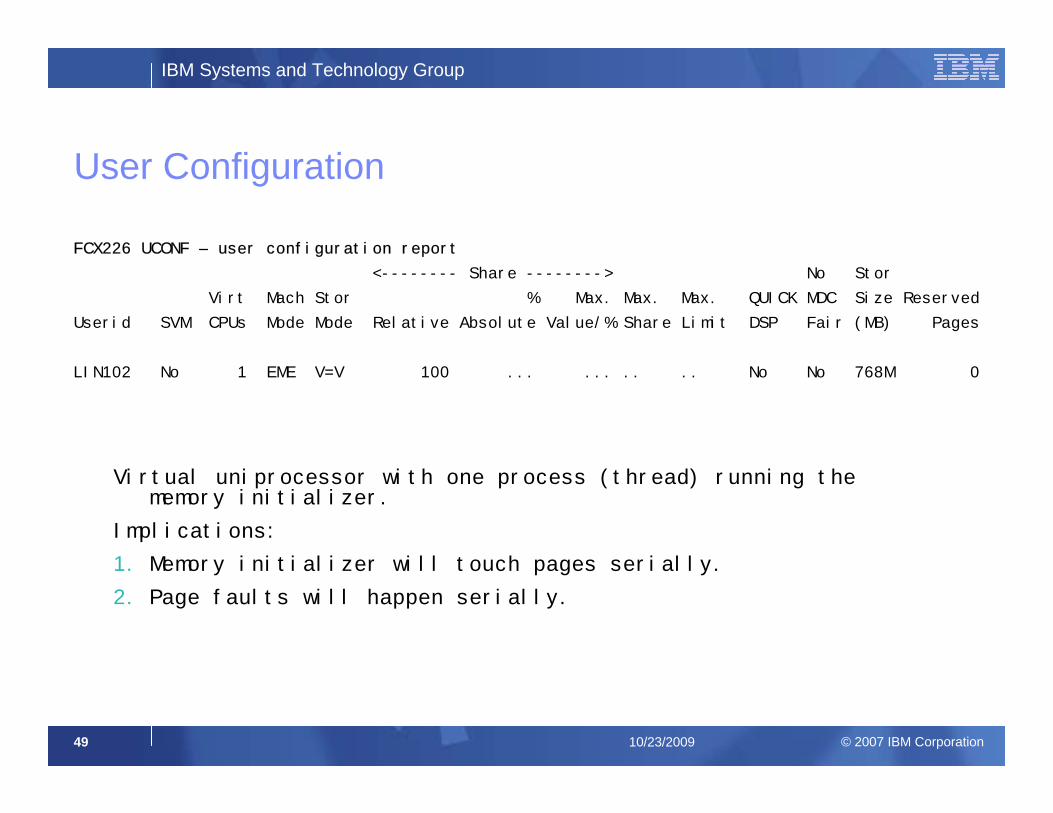
FCX226 UCONF – user configuration report
<-------- Share --------> No Stor
Virt Mach Stor % Max. Max. Max. QUICK MDC Size Reserved
Userid SVM CPUs Mode Mode Relative Absolute Value/% Share Limit DSP Fair (MB) Pages
LIN102 No 1 EME V=V 100 ... ... .. .. No No 768M 0
Virtual uniprocessor with one process (thread) running the memory initializer.
Implications:
1. Memory initializer will touch pages serially.
2. Page faults will happen serially.
IBM Systems and Technology Group
© 2007 IBM Corporation50 10/23/2009
Activity on Paging DASD
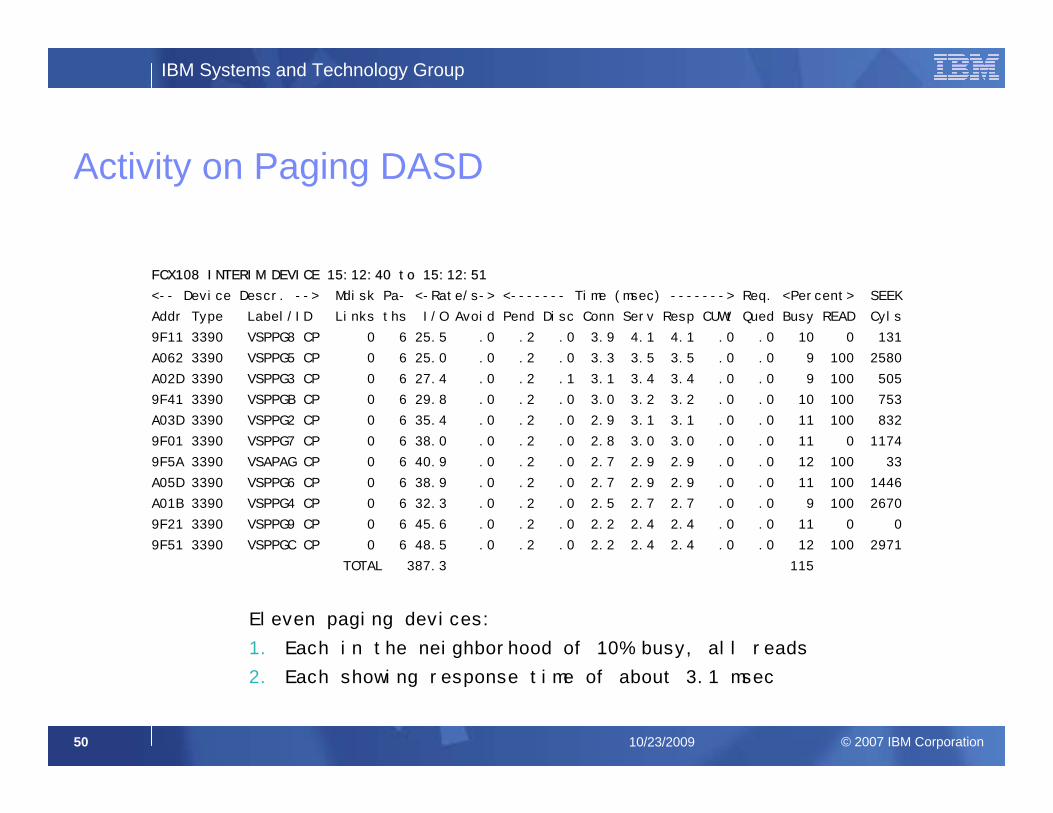
FCX108 INTERIM DEVICE 15:12:40 to 15:12:51
<-- Device Descr. --> Mdisk Pa- <-Rate/s-> <------- Time (msec) -------> Req. <Percent> SEEK
Addr Type Label/ID Links ths I/O Avoid Pend Disc Conn Serv Resp CUWt Qued Busy READ Cyls
9F11 3390 VSPPG8 CP 0 6 25.5 .0 .2 .0 3.9 4.1 4.1 .0 .0 10 0 131
A062 3390 VSPPG5 CP 0 6 25.0 .0 .2 .0 3.3 3.5 3.5 .0 .0 9 100 2580
A02D 3390 VSPPG3 CP 0 6 27.4 .0 .2 .1 3.1 3.4 3.4 .0 .0 9 100 505
9F41 3390 VSPPGB CP 0 6 29.8 .0 .2 .0 3.0 3.2 3.2 .0 .0 10 100 753
A03D 3390 VSPPG2 CP 0 6 35.4 .0 .2 .0 2.9 3.1 3.1 .0 .0 11 100 832
9F01 3390 VSPPG7 CP 0 6 38.0 .0 .2 .0 2.8 3.0 3.0 .0 .0 11 0 1174
9F5A 3390 VSAPAG CP 0 6 40.9 .0 .2 .0 2.7 2.9 2.9 .0 .0 12 100 33
A05D 3390 VSPPG6 CP 0 6 38.9 .0 .2 .0 2.7 2.9 2.9 .0 .0 11 100 1446
A01B 3390 VSPPG4 CP 0 6 32.3 .0 .2 .0 2.5 2.7 2.7 .0 .0 9 100 2670
9F21 3390 VSPPG9 CP 0 6 45.6 .0 .2 .0 2.2 2.4 2.4 .0 .0 11 0 0
9F51 3390 VSPPGC CP 0 6 48.5 .0 .2 .0 2.2 2.4 2.4 .0 .0 12 100 2971
TOTAL 387.3 115
Eleven paging devices:
1. Each in the neighborhood of 10% busy, all reads
2. Each showing response time of about 3.1 msec
IBM Systems and Technology Group
© 2007 IBM Corporation51 10/23/2009
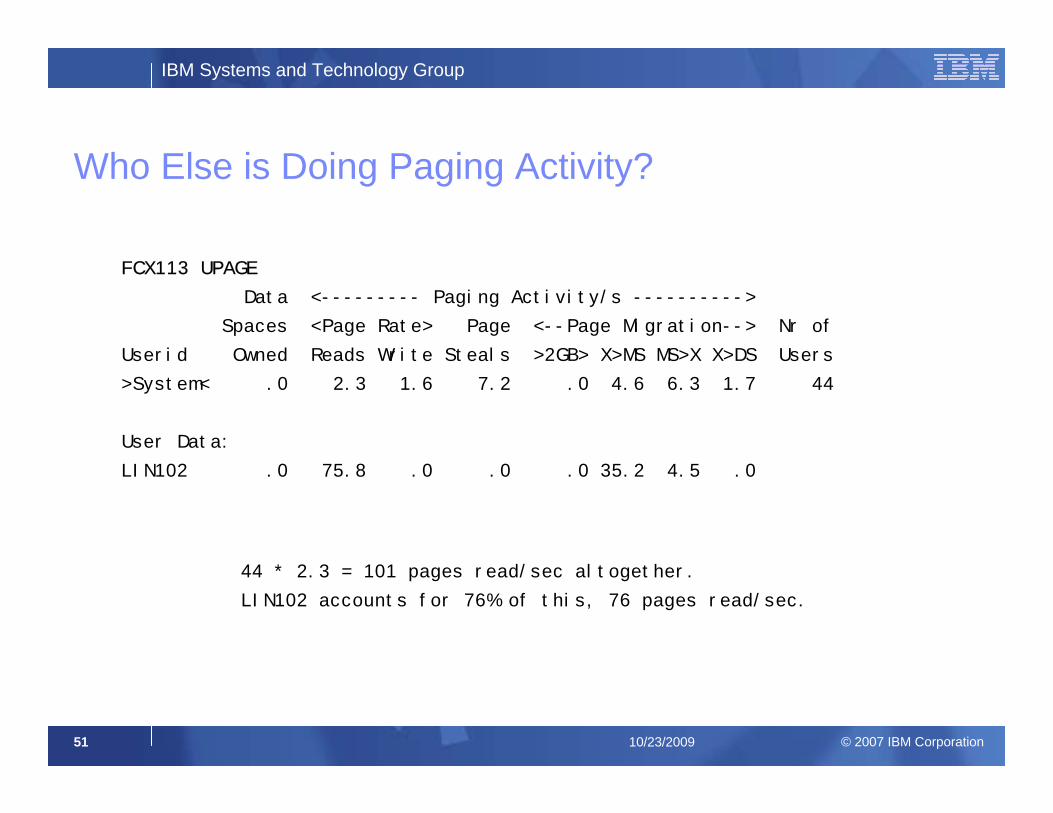
Who Else is Doing Paging Activity?
FCX113 UPAGE
Data <--------- Paging Activity/s ---------->
Spaces <Page Rate> Page <--Page Migration--> Nr of
Userid Owned Reads Write Steals >2GB> X>MS MS>X X>DS Users
>System< .0 2.3 1.6 7.2 .0 4.6 6.3 1.7 44
User Data:
LIN102 .0 75.8 .0 .0 .0 35.2 4.5 .0
44 * 2.3 = 101 pages read/sec altogether.
LIN102 accounts for 76% of this, 76 pages read/sec.
IBM Systems and Technology Group
© 2007 IBM Corporation52 10/23/2009
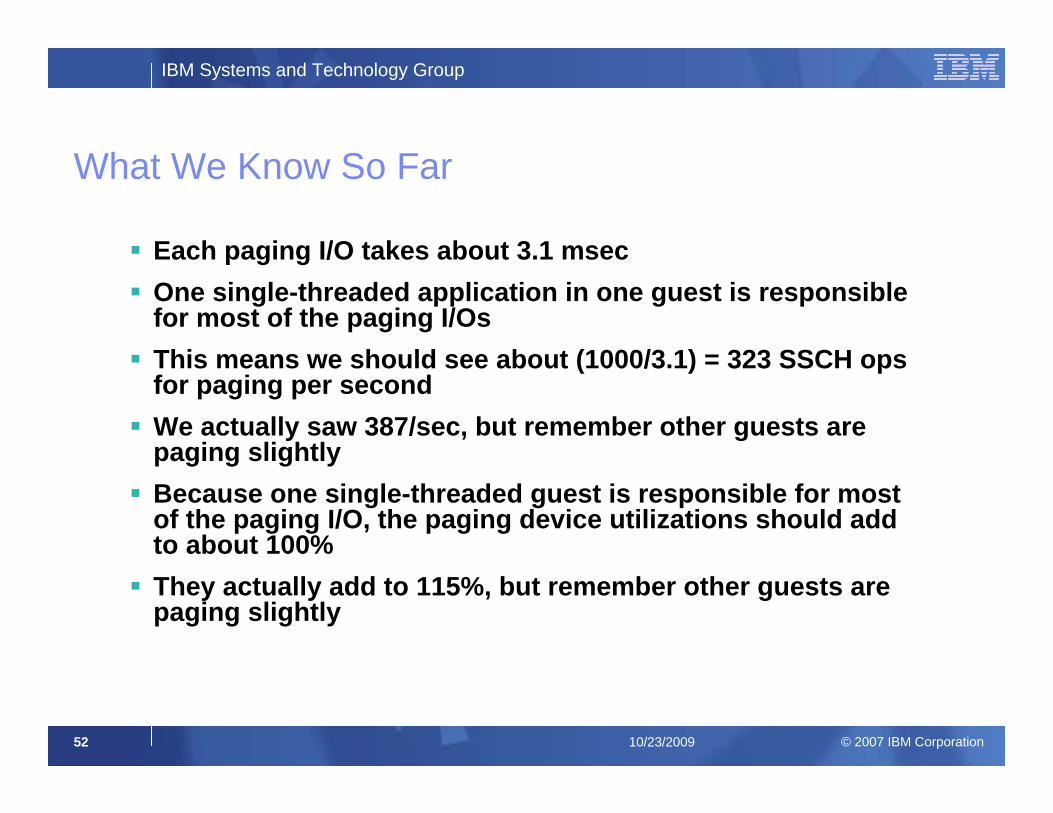
What We Know So Far
Each paging I/O takes about 3.1 msecOne single-threaded application in one guest is responsible for most of the paging I/OsThis means we should see about (1000/3.1) = 323 SSCH ops for paging per secondWe actually saw 387/sec, but remember other guests are paging slightlyBecause one single-threaded guest is responsible for most of the paging I/O, the paging device utilizations should add to about 100%They actually add to 115%, but remember other guests are paging slightly
IBM Systems and Technology Group
© 2007 IBM Corporation53 10/23/2009
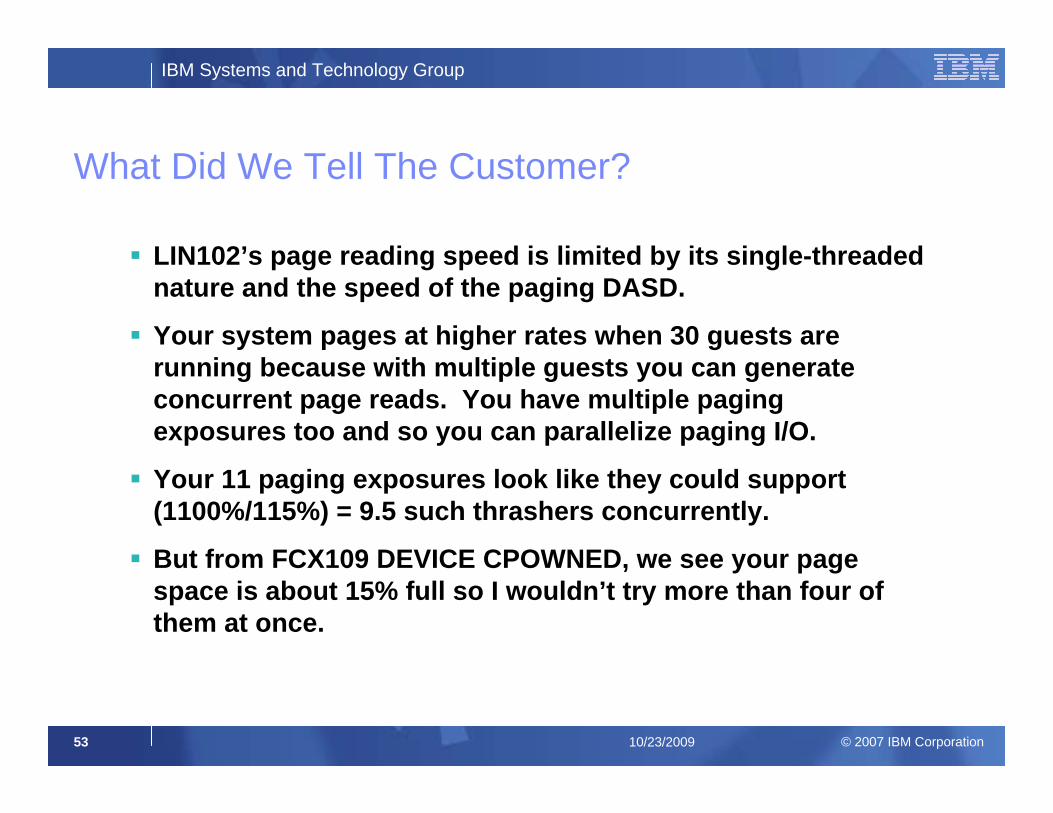
What Did We Tell The Customer?
LIN102’s page reading speed is limited by its single-threaded nature and the speed of the paging DASD.
Your system pages at higher rates when 30 guests are running because with multiple guests you can generate concurrent page reads. You have multiple paging exposures too and so you can parallelize paging I/O.
Your 11 paging exposures look like they could support (1100%/115%) = 9.5 such thrashers concurrently.
But from FCX109 DEVICE CPOWNED, we see your page space is about 15% full so I wouldn’t try more than four of them at once.
IBM Systems and Technology Group
© 2007 IBM Corporation54 10/23/2009
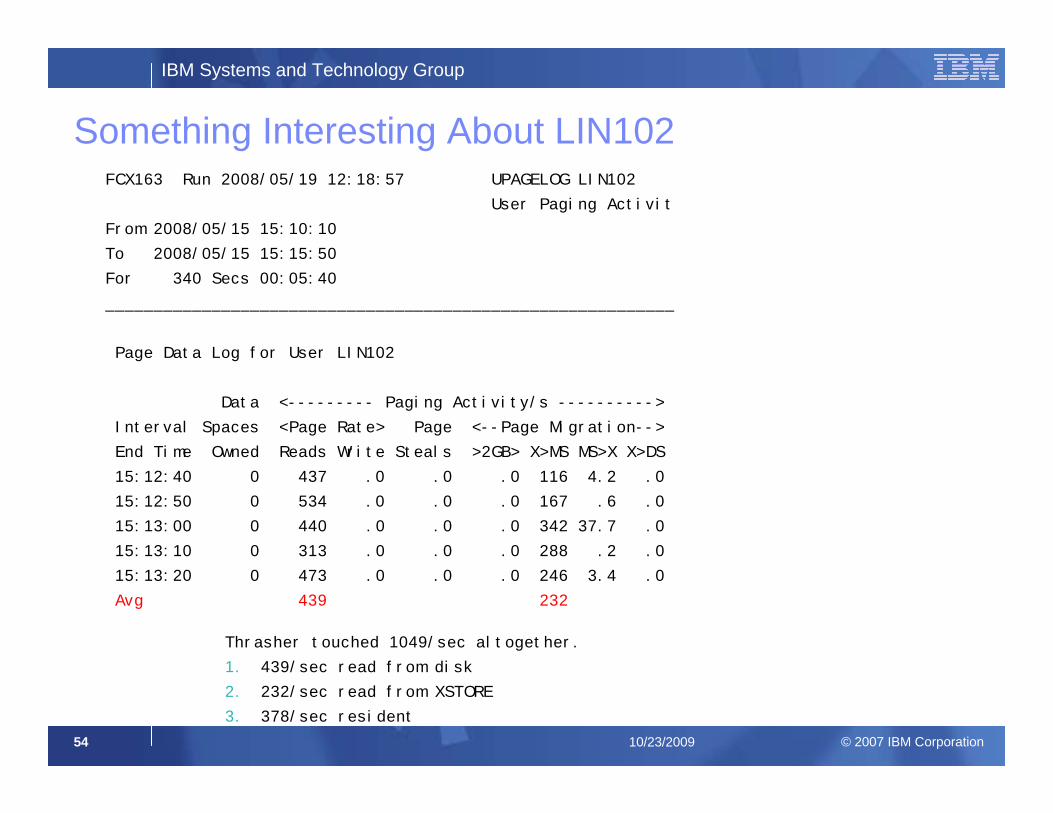
Something Interesting About LIN102FCX163 Run 2008/05/19 12:18:57 UPAGELOG LIN102
User Paging Activit
From 2008/05/15 15:10:10
To 2008/05/15 15:15:50
For 340 Secs 00:05:40
___________________________________________________________
Page Data Log for User LIN102
Data <--------- Paging Activity/s ---------->
Interval Spaces <Page Rate> Page <--Page Migration-->
End Time Owned Reads Write Steals >2GB> X>MS MS>X X>DS
15:12:40 0 437 .0 .0 .0 116 4.2 .0
15:12:50 0 534 .0 .0 .0 167 .6 .0
15:13:00 0 440 .0 .0 .0 342 37.7 .0
15:13:10 0 313 .0 .0 .0 288 .2 .0
15:13:20 0 473 .0 .0 .0 246 3.4 .0
Avg 439 232
Thrasher touched 1049/sec altogether.
1. 439/sec read from disk
2. 232/sec read from XSTORE
3. 378/sec resident
IBM Systems and Technology Group
© 2007 IBM Corporation55 10/23/2009
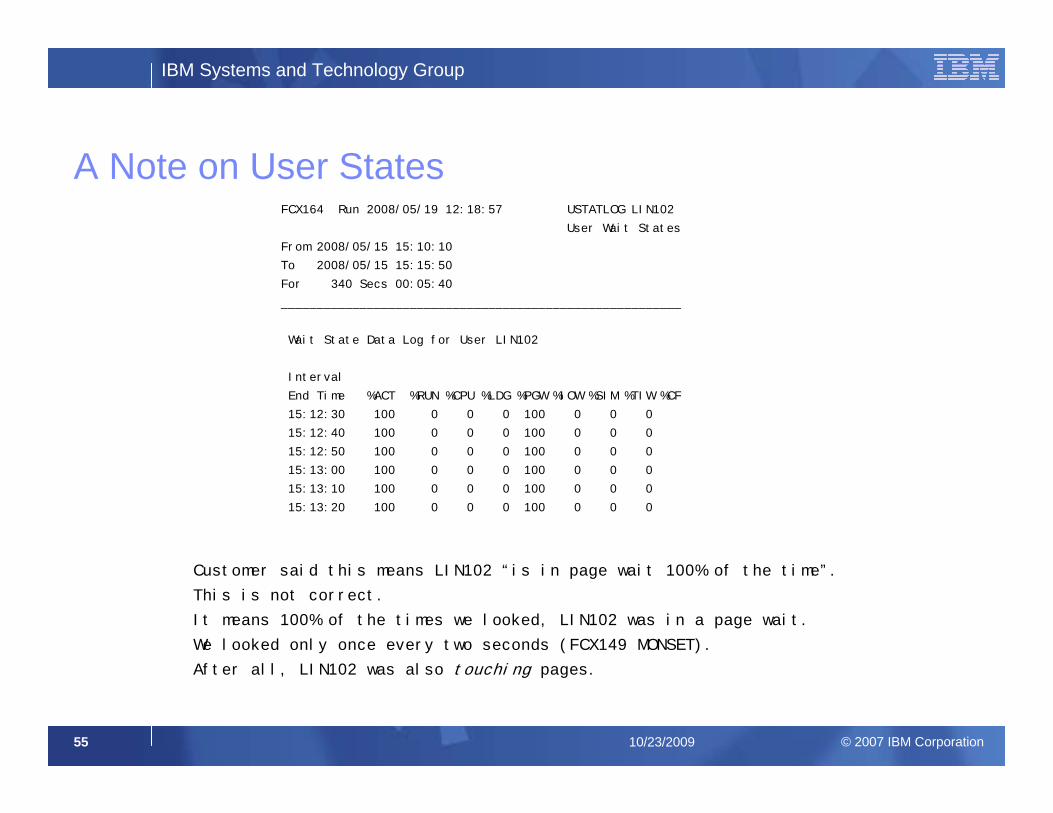
A Note on User StatesFCX164 Run 2008/05/19 12:18:57 USTATLOG LIN102
User Wait States
From 2008/05/15 15:10:10
To 2008/05/15 15:15:50
For 340 Secs 00:05:40
________________________________________________________
Wait State Data Log for User LIN102
Interval
End Time %ACT %RUN %CPU %LDG %PGW %IOW %SIM %TIW %CF
15:12:30 100 0 0 0 100 0 0 0
15:12:40 100 0 0 0 100 0 0 0
15:12:50 100 0 0 0 100 0 0 0
15:13:00 100 0 0 0 100 0 0 0
15:13:10 100 0 0 0 100 0 0 0
15:13:20 100 0 0 0 100 0 0 0
Customer said this means LIN102 “is in page wait 100% of the time”.
This is not correct.
It means 100% of the times we looked, LIN102 was in a page wait.
We looked only once every two seconds (FCX149 MONSET).
After all, LIN102 was also touching pages.
IBM Systems and Technology Group
© 2007 IBM Corporation56 10/23/2009
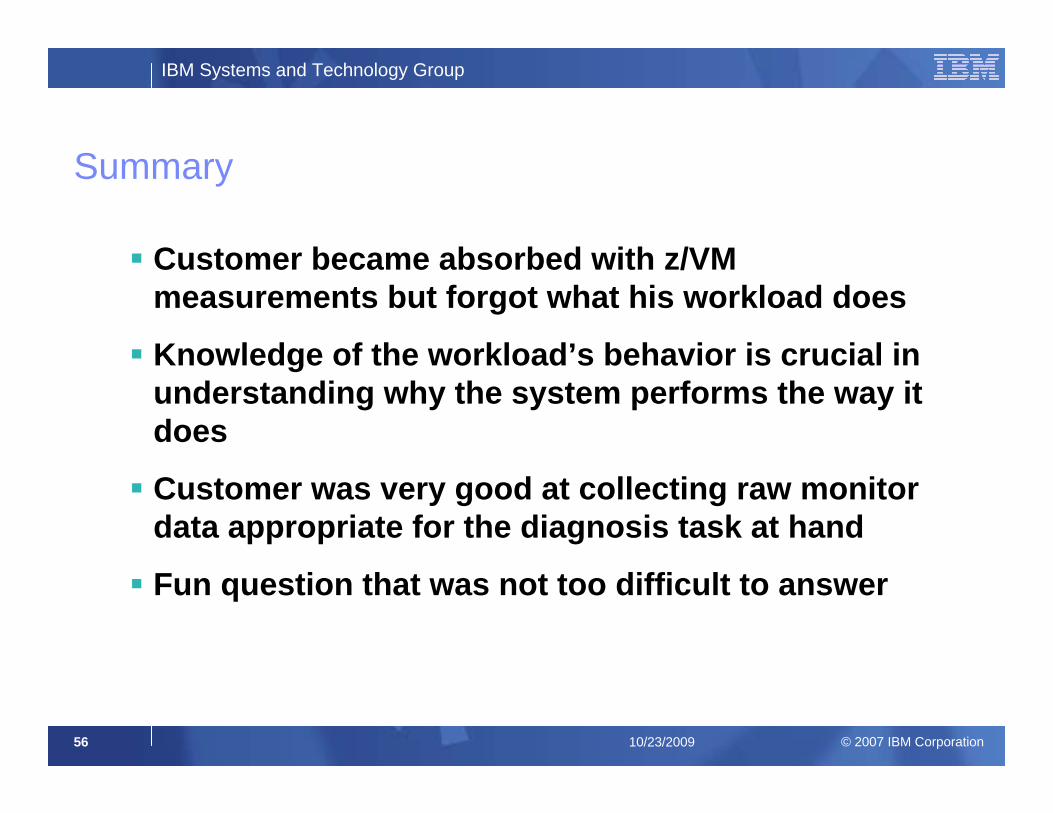
Summary
Customer became absorbed with z/VM measurements but forgot what his workload does
Knowledge of the workload’s behavior is crucial in understanding why the system performs the way it does
Customer was very good at collecting raw monitor data appropriate for the diagnosis task at hand
Fun question that was not too difficult to answer
IBM Systems and Technology Group
© 2007 IBM Corporation57 10/23/2009
Case Study:Undersized LPAR
IBM Systems and Technology Group
© 2007 IBM Corporation58 10/23/2009
Question from Customer
Why do my workloads run so slowly?
IBM Systems and Technology Group
© 2007 IBM Corporation59 10/23/2009
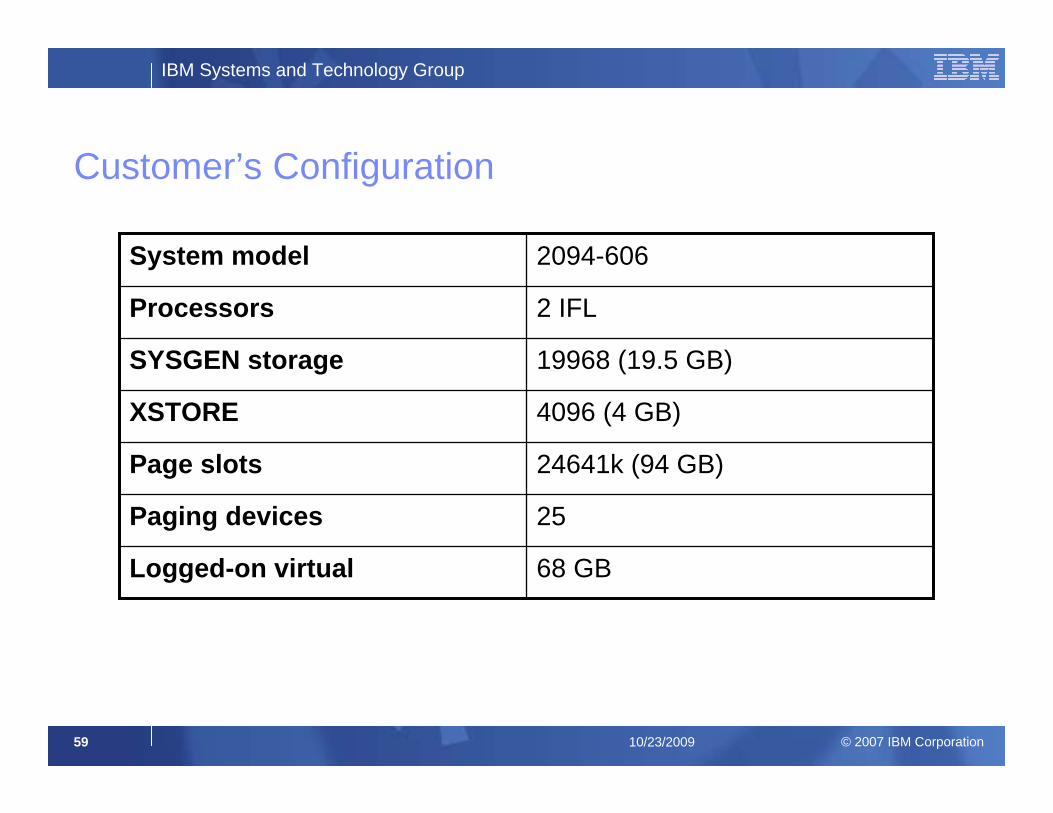
Customer’s Configuration
68 GBLogged-on virtual
25Paging devices
24641k (94 GB)Page slots
4096 (4 GB)XSTORE
19968 (19.5 GB)SYSGEN storage
2 IFLProcessors
2094-606System model
IBM Systems and Technology Group
© 2007 IBM Corporation60 10/23/2009
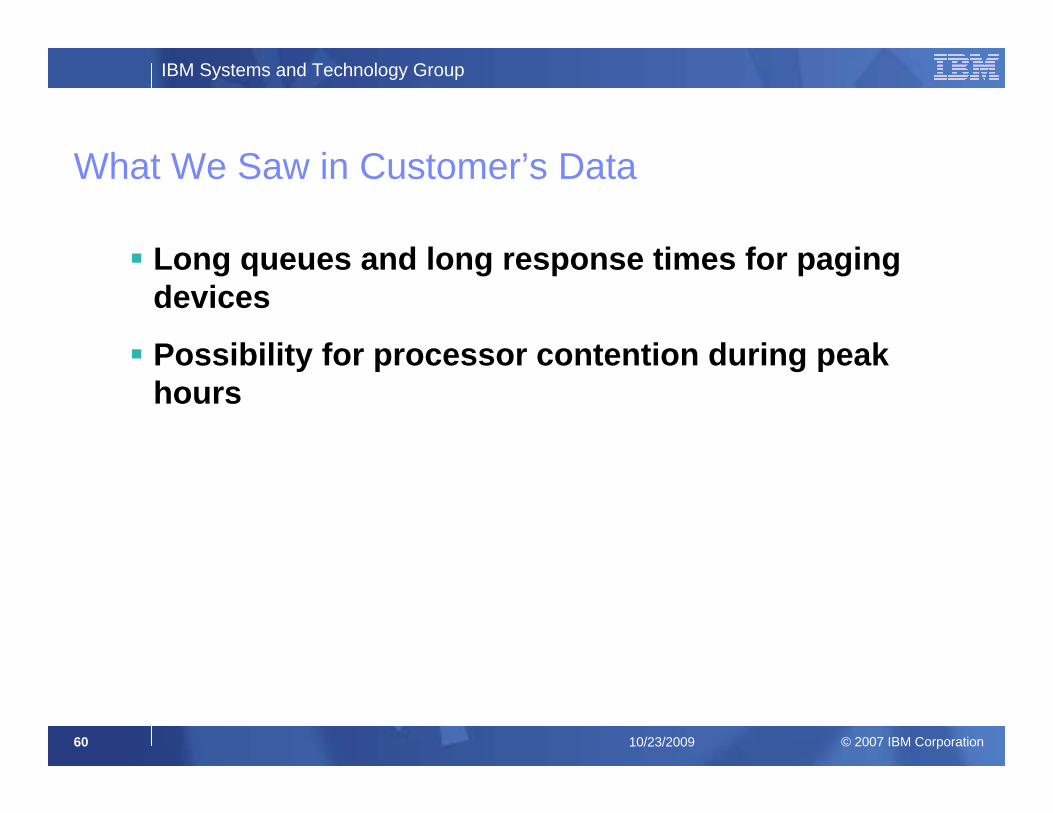
What We Saw in Customer’s Data
Long queues and long response times for paging devices
Possibility for processor contention during peak hours
IBM Systems and Technology Group
© 2007 IBM Corporation61 10/23/2009
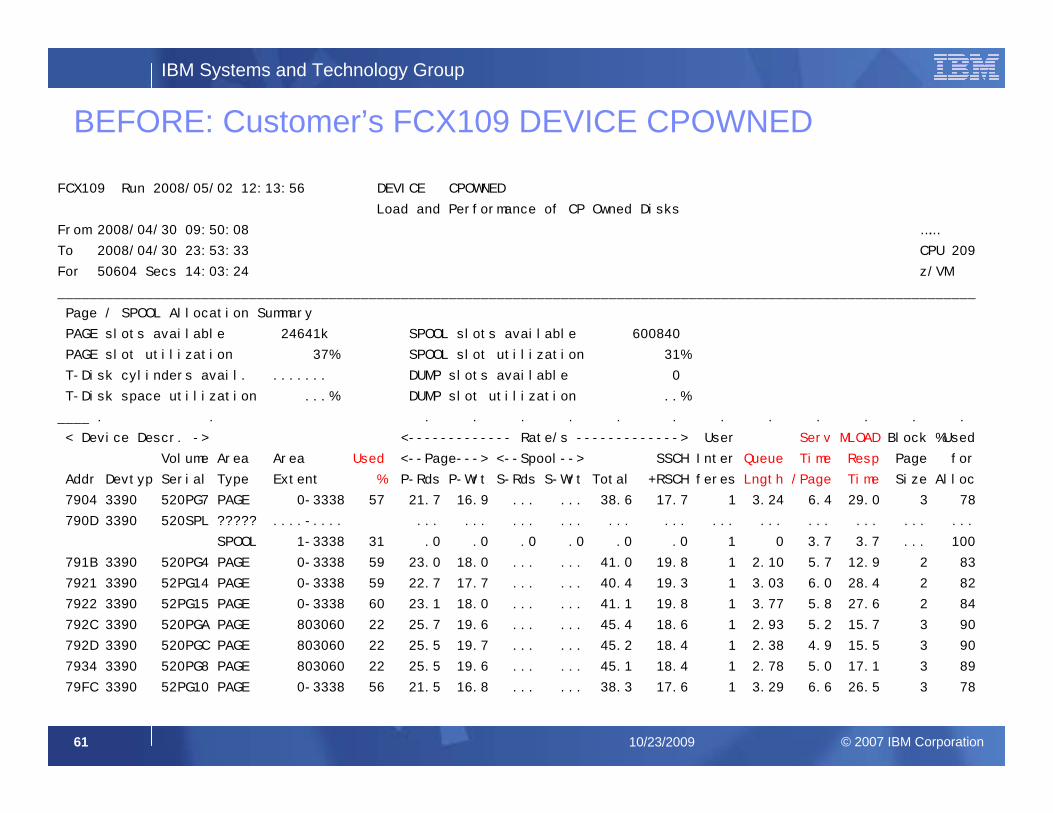
BEFORE: Customer’s FCX109 DEVICE CPOWNED
FCX109 Run 2008/05/02 12:13:56 DEVICE CPOWNED
Load and Performance of CP Owned Disks
From 2008/04/30 09:50:08 ……
To 2008/04/30 23:53:33 CPU 209
For 50604 Secs 14:03:24 z/VM
___________________________________________________________________________________________________________________
Page / SPOOL Allocation Summary
PAGE slots available 24641k SPOOL slots available 600840
PAGE slot utilization 37% SPOOL slot utilization 31%
T-Disk cylinders avail. ....... DUMP slots available 0
T-Disk space utilization ...% DUMP slot utilization ..%
____ . . . . . . . . . . . . . .
< Device Descr. -> <------------- Rate/s -------------> User Serv MLOAD Block %Used
Volume Area Area Used <--Page---> <--Spool--> SSCH Inter Queue Time Resp Page for
Addr Devtyp Serial Type Extent % P-Rds P-Wrt S-Rds S-Wrt Total +RSCH feres Lngth /Page Time Size Alloc
7904 3390 520PG7 PAGE 0-3338 57 21.7 16.9 ... ... 38.6 17.7 1 3.24 6.4 29.0 3 78
790D 3390 520SPL ????? ....-.... ... ... ... ... ... ... ... ... ... ... ... ...
SPOOL 1-3338 31 .0 .0 .0 .0 .0 .0 1 0 3.7 3.7 ... 100
791B 3390 520PG4 PAGE 0-3338 59 23.0 18.0 ... ... 41.0 19.8 1 2.10 5.7 12.9 2 83
7921 3390 52PG14 PAGE 0-3338 59 22.7 17.7 ... ... 40.4 19.3 1 3.03 6.0 28.4 2 82
7922 3390 52PG15 PAGE 0-3338 60 23.1 18.0 ... ... 41.1 19.8 1 3.77 5.8 27.6 2 84
792C 3390 520PGA PAGE 803060 22 25.7 19.6 ... ... 45.4 18.6 1 2.93 5.2 15.7 3 90
792D 3390 520PGC PAGE 803060 22 25.5 19.7 ... ... 45.2 18.4 1 2.38 4.9 15.5 3 90
7934 3390 520PG8 PAGE 803060 22 25.5 19.6 ... ... 45.1 18.4 1 2.78 5.0 17.1 3 89
79FC 3390 52PG10 PAGE 0-3338 56 21.5 16.8 ... ... 38.3 17.6 1 3.29 6.6 26.5 3 78
IBM Systems and Technology Group
© 2007 IBM Corporation62 10/23/2009
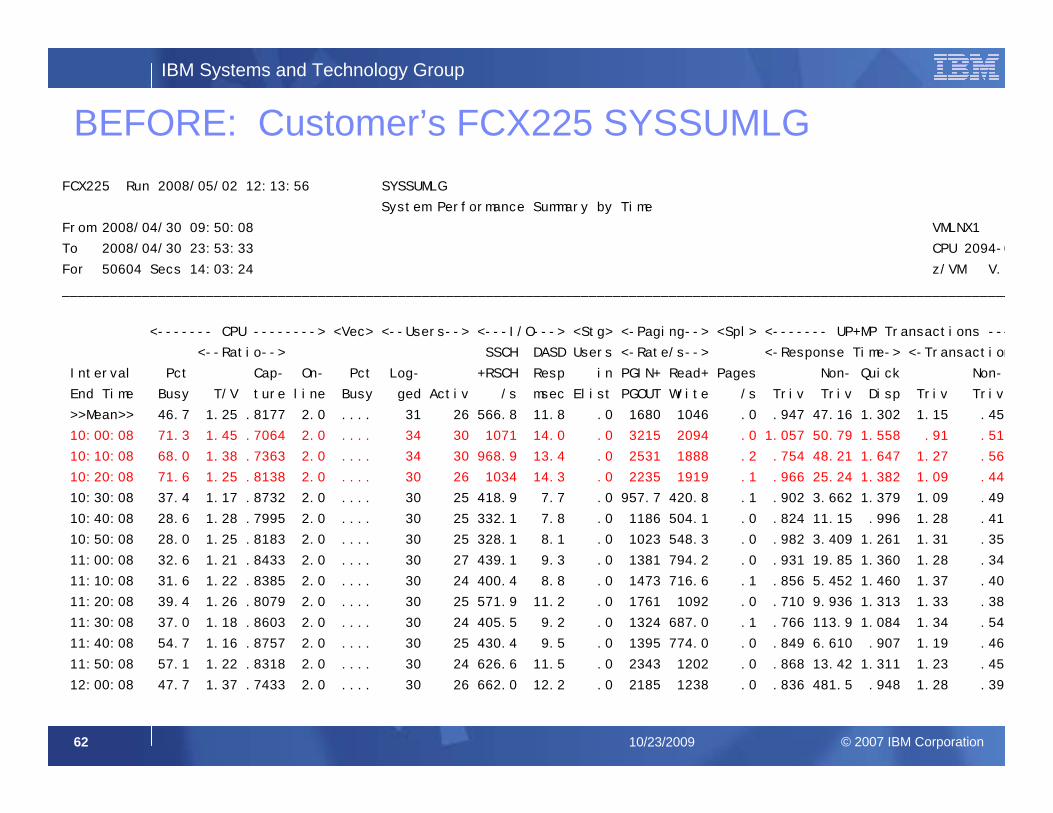
BEFORE: Customer’s FCX225 SYSSUMLGFCX225 Run 2008/05/02 12:13:56 SYSSUMLG
System Performance Summary by Time
From 2008/04/30 09:50:08 VMLNX1
To 2008/04/30 23:53:33 CPU 2094-6
For 50604 Secs 14:03:24 z/VM V.
_______________________________________________________________________________________________________________________
<------- CPU --------> <Vec> <--Users--> <---I/O---> <Stg> <-Paging--> <Spl> <------- UP+MP Transactions ---
<--Ratio--> SSCH DASD Users <-Rate/s--> <-Response Time-> <-Transaction
Interval Pct Cap- On- Pct Log- +RSCH Resp in PGIN+ Read+ Pages Non- Quick Non-
End Time Busy T/V ture line Busy ged Activ /s msec Elist PGOUT Write /s Triv Triv Disp Triv Triv
>>Mean>> 46.7 1.25 .8177 2.0 .... 31 26 566.8 11.8 .0 1680 1046 .0 .947 47.16 1.302 1.15 .45
10:00:08 71.3 1.45 .7064 2.0 .... 34 30 1071 14.0 .0 3215 2094 .0 1.057 50.79 1.558 .91 .51
10:10:08 68.0 1.38 .7363 2.0 .... 34 30 968.9 13.4 .0 2531 1888 .2 .754 48.21 1.647 1.27 .56
10:20:08 71.6 1.25 .8138 2.0 .... 30 26 1034 14.3 .0 2235 1919 .1 .966 25.24 1.382 1.09 .44
10:30:08 37.4 1.17 .8732 2.0 .... 30 25 418.9 7.7 .0 957.7 420.8 .1 .902 3.662 1.379 1.09 .49
10:40:08 28.6 1.28 .7995 2.0 .... 30 25 332.1 7.8 .0 1186 504.1 .0 .824 11.15 .996 1.28 .41
10:50:08 28.0 1.25 .8183 2.0 .... 30 25 328.1 8.1 .0 1023 548.3 .0 .982 3.409 1.261 1.31 .35
11:00:08 32.6 1.21 .8433 2.0 .... 30 27 439.1 9.3 .0 1381 794.2 .0 .931 19.85 1.360 1.28 .34
11:10:08 31.6 1.22 .8385 2.0 .... 30 24 400.4 8.8 .0 1473 716.6 .1 .856 5.452 1.460 1.37 .40
11:20:08 39.4 1.26 .8079 2.0 .... 30 25 571.9 11.2 .0 1761 1092 .0 .710 9.936 1.313 1.33 .38
11:30:08 37.0 1.18 .8603 2.0 .... 30 24 405.5 9.2 .0 1324 687.0 .1 .766 113.9 1.084 1.34 .54
11:40:08 54.7 1.16 .8757 2.0 .... 30 25 430.4 9.5 .0 1395 774.0 .0 .849 6.610 .907 1.19 .46
11:50:08 57.1 1.22 .8318 2.0 .... 30 24 626.6 11.5 .0 2343 1202 .0 .868 13.42 1.311 1.23 .45
12:00:08 47.7 1.37 .7433 2.0 .... 30 26 662.0 12.2 .0 2185 1238 .0 .836 481.5 .948 1.28 .39
IBM Systems and Technology Group
© 2007 IBM Corporation63 10/23/2009
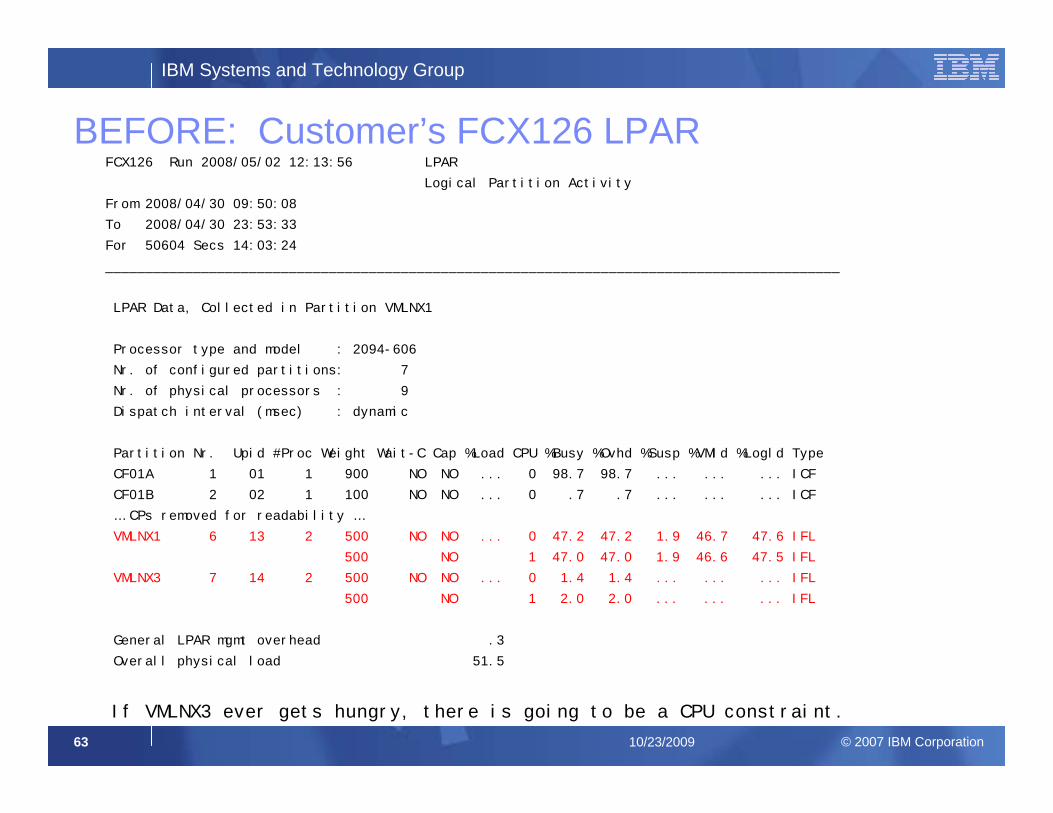
BEFORE: Customer’s FCX126 LPARFCX126 Run 2008/05/02 12:13:56 LPAR
Logical Partition Activity
From 2008/04/30 09:50:08
To 2008/04/30 23:53:33
For 50604 Secs 14:03:24
____________________________________________________________________________________________
LPAR Data, Collected in Partition VMLNX1
Processor type and model : 2094-606
Nr. of configured partitions: 7
Nr. of physical processors : 9
Dispatch interval (msec) : dynamic
Partition Nr. Upid #Proc Weight Wait-C Cap %Load CPU %Busy %Ovhd %Susp %VMld %Logld Type
CF01A 1 01 1 900 NO NO ... 0 98.7 98.7 ... ... ... ICF
CF01B 2 02 1 100 NO NO ... 0 .7 .7 ... ... ... ICF
… CPs removed for readability …
VMLNX1 6 13 2 500 NO NO ... 0 47.2 47.2 1.9 46.7 47.6 IFL
500 NO 1 47.0 47.0 1.9 46.6 47.5 IFL
VMLNX3 7 14 2 500 NO NO ... 0 1.4 1.4 ... ... ... IFL
500 NO 1 2.0 2.0 ... ... ... IFL
General LPAR mgmt overhead .3
Overall physical load 51.5
If VMLNX3 ever gets hungry, there is going to be a CPU constraint.
IBM Systems and Technology Group
© 2007 IBM Corporation64 10/23/2009
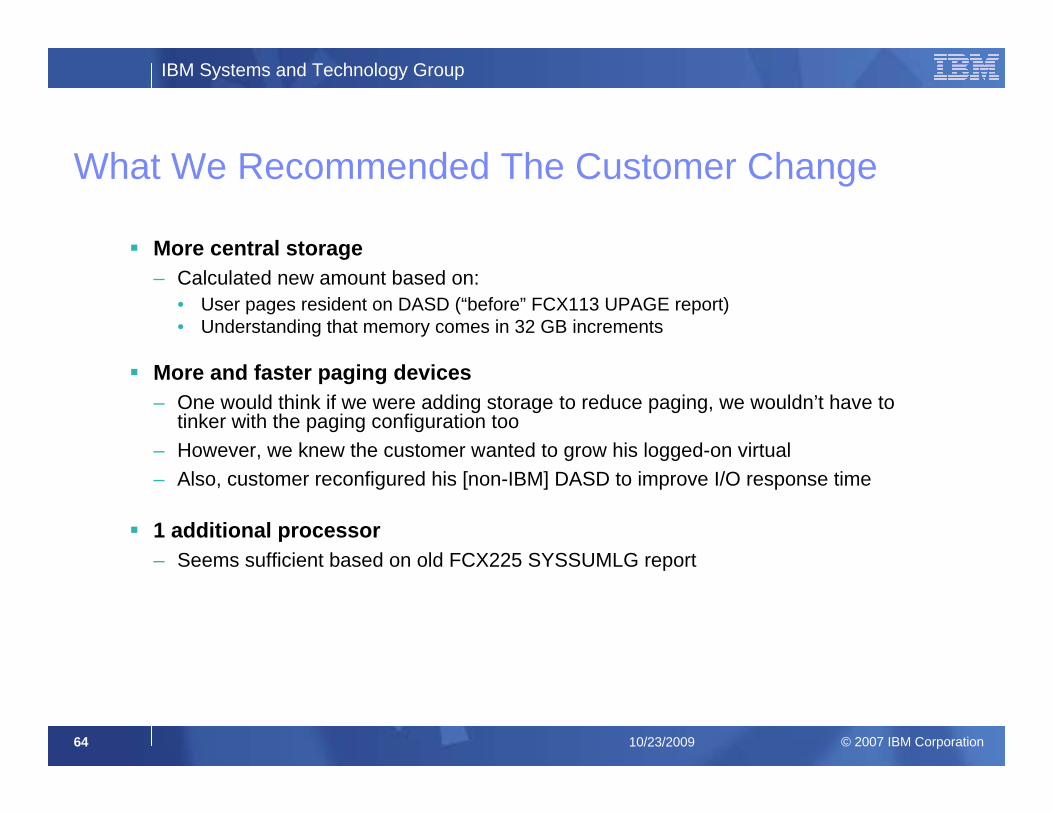
What We Recommended The Customer Change
More central storage– Calculated new amount based on:
• User pages resident on DASD (“before” FCX113 UPAGE report)• Understanding that memory comes in 32 GB increments
More and faster paging devices– One would think if we were adding storage to reduce paging, we wouldn’t have to
tinker with the paging configuration too– However, we knew the customer wanted to grow his logged-on virtual– Also, customer reconfigured his [non-IBM] DASD to improve I/O response time
1 additional processor– Seems sufficient based on old FCX225 SYSSUMLG report
IBM Systems and Technology Group
© 2007 IBM Corporation65 10/23/2009
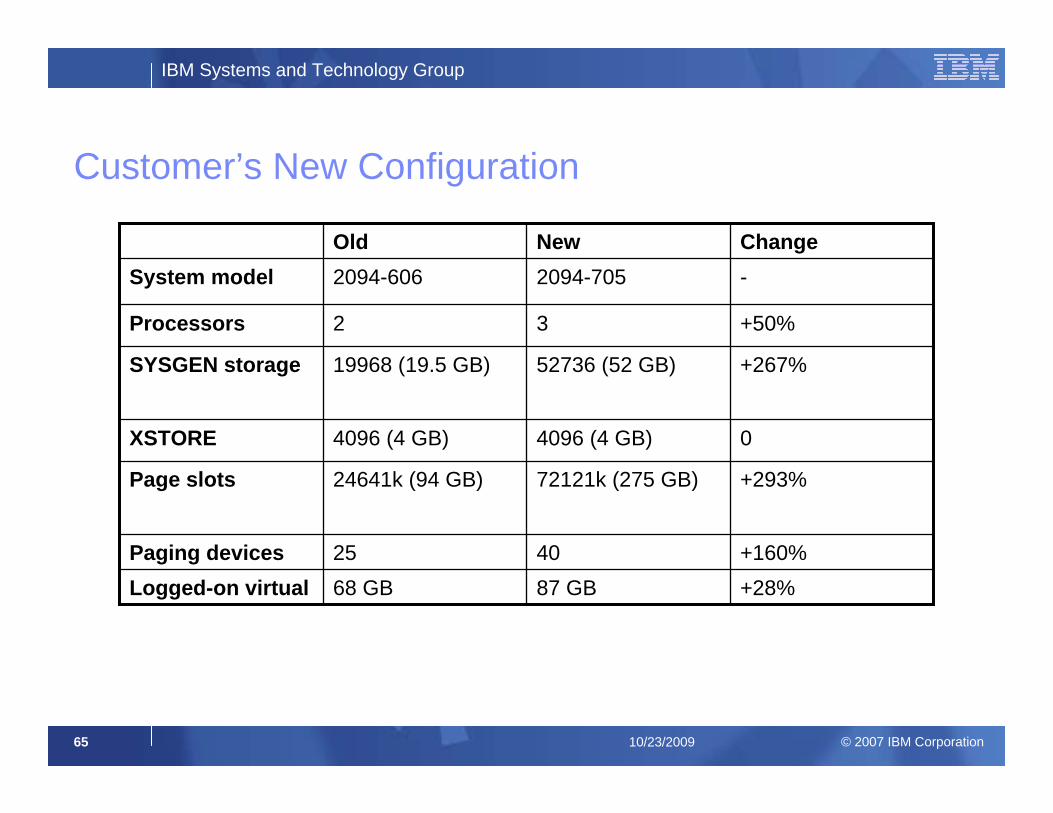
Customer’s New Configuration
+28%87 GB68 GBLogged-on virtual+160%4025Paging devices
+293%72121k (275 GB)24641k (94 GB)Page slots
04096 (4 GB)4096 (4 GB)XSTORE
+267%52736 (52 GB)19968 (19.5 GB)SYSGEN storage
+50%32Processors
-2094-7052094-606System modelChangeNewOld
IBM Systems and Technology Group
© 2007 IBM Corporation66 10/23/2009
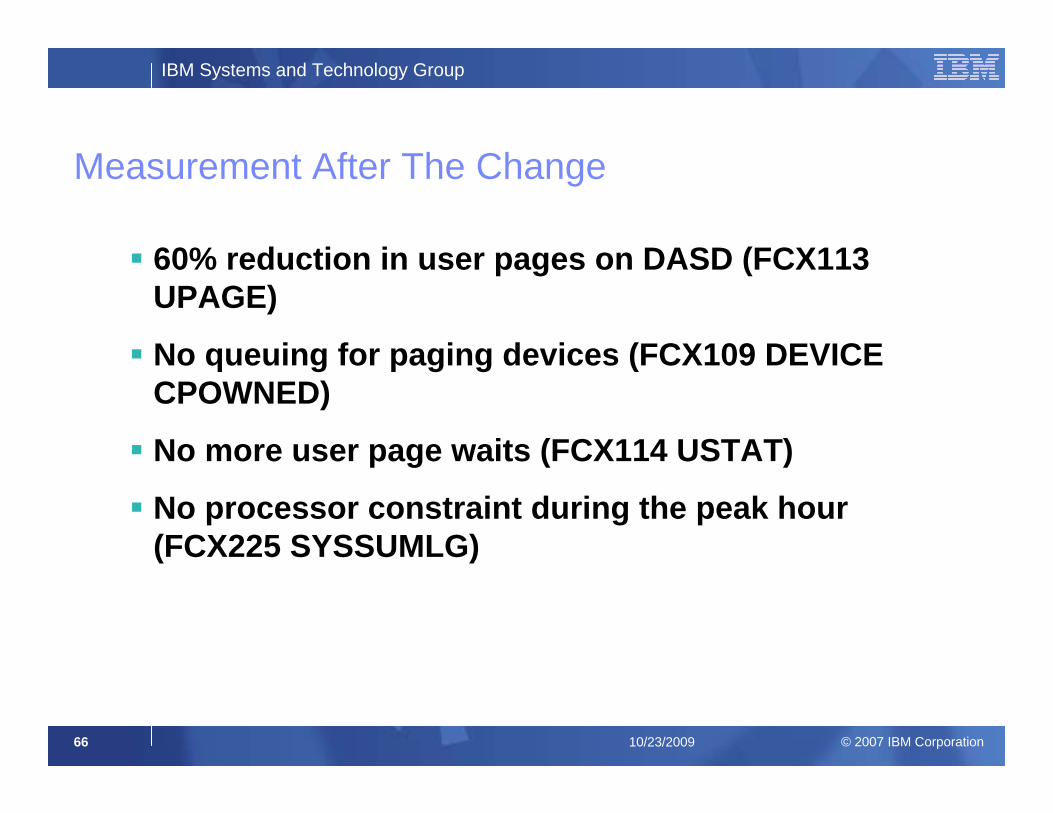
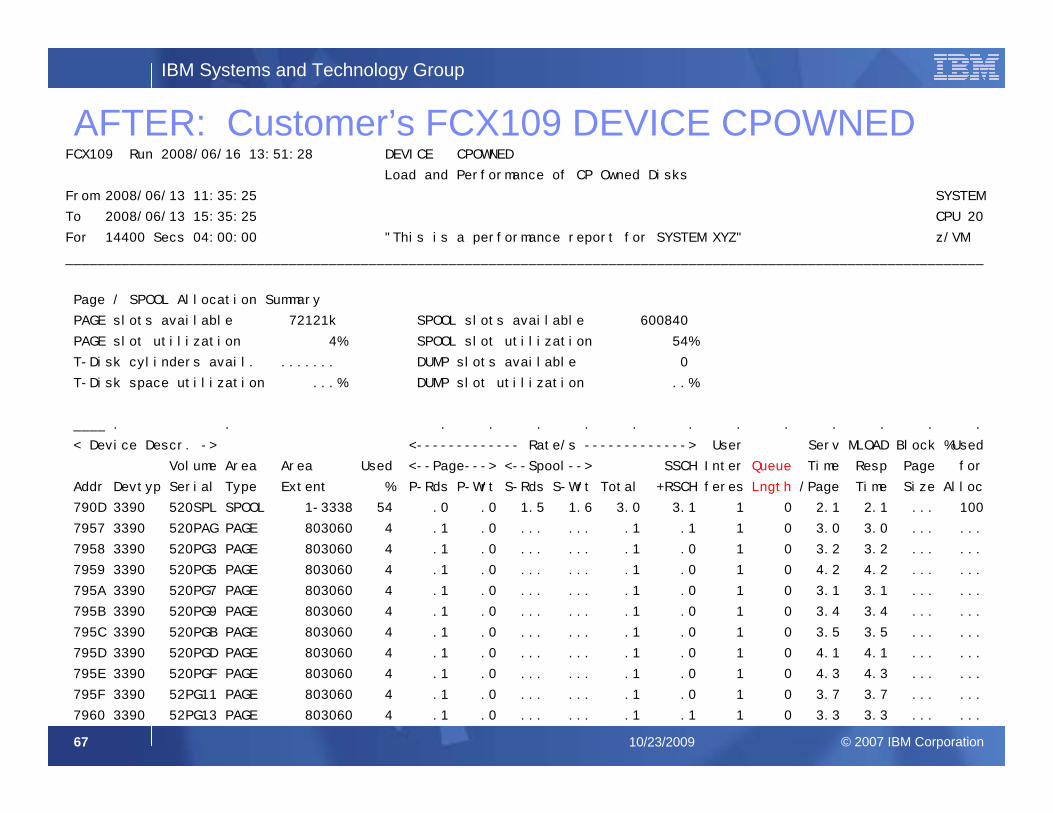
Measurement After The Change
60% reduction in user pages on DASD (FCX113 UPAGE)
No queuing for paging devices (FCX109 DEVICE CPOWNED)
No more user page waits (FCX114 USTAT)
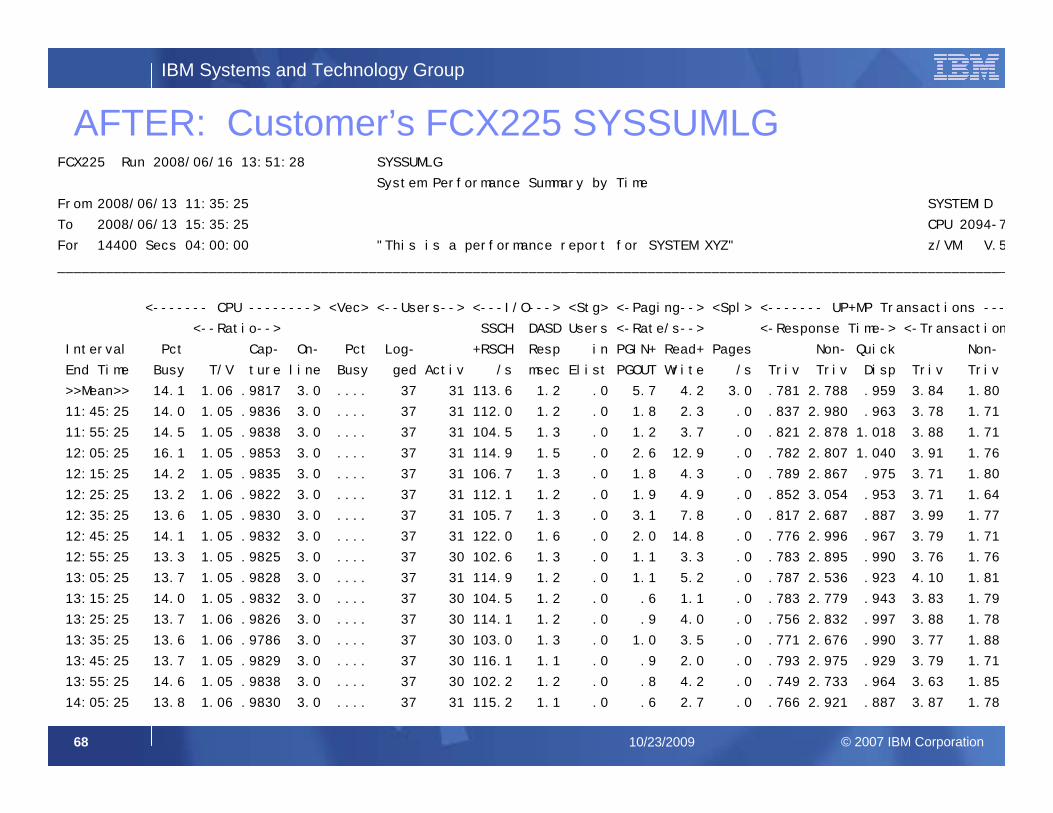
No processor constraint during the peak hour (FCX225 SYSSUMLG)
IBM Systems and Technology Group
© 2007 IBM Corporation67 10/23/2009
AFTER: Customer’s FCX109 DEVICE CPOWNEDFCX109 Run 2008/06/16 13:51:28 DEVICE CPOWNED
Load and Performance of CP Owned Disks
From 2008/06/13 11:35:25 SYSTEM
To 2008/06/13 15:35:25 CPU 20
For 14400 Secs 04:00:00 "This is a performance report for SYSTEM XYZ" z/VM
___________________________________________________________________________________________________________________
Page / SPOOL Allocation Summary
PAGE slots available 72121k SPOOL slots available 600840
PAGE slot utilization 4% SPOOL slot utilization 54%
T-Disk cylinders avail. ....... DUMP slots available 0
T-Disk space utilization ...% DUMP slot utilization ..%
____ . . . . . . . . . . . . . .
< Device Descr. -> <------------- Rate/s -------------> User Serv MLOAD Block %Used
Volume Area Area Used <--Page---> <--Spool--> SSCH Inter Queue Time Resp Page for
Addr Devtyp Serial Type Extent % P-Rds P-Wrt S-Rds S-Wrt Total +RSCH feres Lngth /Page Time Size Alloc
790D 3390 520SPL SPOOL 1-3338 54 .0 .0 1.5 1.6 3.0 3.1 1 0 2.1 2.1 ... 100
7957 3390 520PAG PAGE 803060 4 .1 .0 ... ... .1 .1 1 0 3.0 3.0 ... ...
7958 3390 520PG3 PAGE 803060 4 .1 .0 ... ... .1 .0 1 0 3.2 3.2 ... ...
7959 3390 520PG5 PAGE 803060 4 .1 .0 ... ... .1 .0 1 0 4.2 4.2 ... ...
795A 3390 520PG7 PAGE 803060 4 .1 .0 ... ... .1 .0 1 0 3.1 3.1 ... ...
795B 3390 520PG9 PAGE 803060 4 .1 .0 ... ... .1 .0 1 0 3.4 3.4 ... ...
795C 3390 520PGB PAGE 803060 4 .1 .0 ... ... .1 .0 1 0 3.5 3.5 ... ...
795D 3390 520PGD PAGE 803060 4 .1 .0 ... ... .1 .0 1 0 4.1 4.1 ... ...
795E 3390 520PGF PAGE 803060 4 .1 .0 ... ... .1 .0 1 0 4.3 4.3 ... ...
795F 3390 52PG11 PAGE 803060 4 .1 .0 ... ... .1 .0 1 0 3.7 3.7 ... ...
7960 3390 52PG13 PAGE 803060 4 .1 .0 ... ... .1 .1 1 0 3.3 3.3 ... ...
IBM Systems and Technology Group
© 2007 IBM Corporation68 10/23/2009
AFTER: Customer’s FCX225 SYSSUMLGFCX225 Run 2008/06/16 13:51:28 SYSSUMLG
System Performance Summary by Time
From 2008/06/13 11:35:25 SYSTEMID
To 2008/06/13 15:35:25 CPU 2094-7
For 14400 Secs 04:00:00 "This is a performance report for SYSTEM XYZ" z/VM V.5
_______________________________________________________________________________________________________________________
<------- CPU --------> <Vec> <--Users--> <---I/O---> <Stg> <-Paging--> <Spl> <------- UP+MP Transactions ---
<--Ratio--> SSCH DASD Users <-Rate/s--> <-Response Time-> <-Transaction
Interval Pct Cap- On- Pct Log- +RSCH Resp in PGIN+ Read+ Pages Non- Quick Non-
End Time Busy T/V ture line Busy ged Activ /s msec Elist PGOUT Write /s Triv Triv Disp Triv Triv
>>Mean>> 14.1 1.06 .9817 3.0 .... 37 31 113.6 1.2 .0 5.7 4.2 3.0 .781 2.788 .959 3.84 1.80
11:45:25 14.0 1.05 .9836 3.0 .... 37 31 112.0 1.2 .0 1.8 2.3 .0 .837 2.980 .963 3.78 1.71
11:55:25 14.5 1.05 .9838 3.0 .... 37 31 104.5 1.3 .0 1.2 3.7 .0 .821 2.878 1.018 3.88 1.71
12:05:25 16.1 1.05 .9853 3.0 .... 37 31 114.9 1.5 .0 2.6 12.9 .0 .782 2.807 1.040 3.91 1.76
12:15:25 14.2 1.05 .9835 3.0 .... 37 31 106.7 1.3 .0 1.8 4.3 .0 .789 2.867 .975 3.71 1.80
12:25:25 13.2 1.06 .9822 3.0 .... 37 31 112.1 1.2 .0 1.9 4.9 .0 .852 3.054 .953 3.71 1.64
12:35:25 13.6 1.05 .9830 3.0 .... 37 31 105.7 1.3 .0 3.1 7.8 .0 .817 2.687 .887 3.99 1.77
12:45:25 14.1 1.05 .9832 3.0 .... 37 31 122.0 1.6 .0 2.0 14.8 .0 .776 2.996 .967 3.79 1.71
12:55:25 13.3 1.05 .9825 3.0 .... 37 30 102.6 1.3 .0 1.1 3.3 .0 .783 2.895 .990 3.76 1.76
13:05:25 13.7 1.05 .9828 3.0 .... 37 31 114.9 1.2 .0 1.1 5.2 .0 .787 2.536 .923 4.10 1.81
13:15:25 14.0 1.05 .9832 3.0 .... 37 30 104.5 1.2 .0 .6 1.1 .0 .783 2.779 .943 3.83 1.79
13:25:25 13.7 1.06 .9826 3.0 .... 37 30 114.1 1.2 .0 .9 4.0 .0 .756 2.832 .997 3.88 1.78
13:35:25 13.6 1.06 .9786 3.0 .... 37 30 103.0 1.3 .0 1.0 3.5 .0 .771 2.676 .990 3.77 1.88
13:45:25 13.7 1.05 .9829 3.0 .... 37 30 116.1 1.1 .0 .9 2.0 .0 .793 2.975 .929 3.79 1.71
13:55:25 14.6 1.05 .9838 3.0 .... 37 30 102.2 1.2 .0 .8 4.2 .0 .749 2.733 .964 3.63 1.85
14:05:25 13.8 1.06 .9830 3.0 .... 37 31 115.2 1.1 .0 .6 2.7 .0 .766 2.921 .887 3.87 1.78
IBM Systems and Technology Group
© 2007 IBM Corporation69 10/23/2009
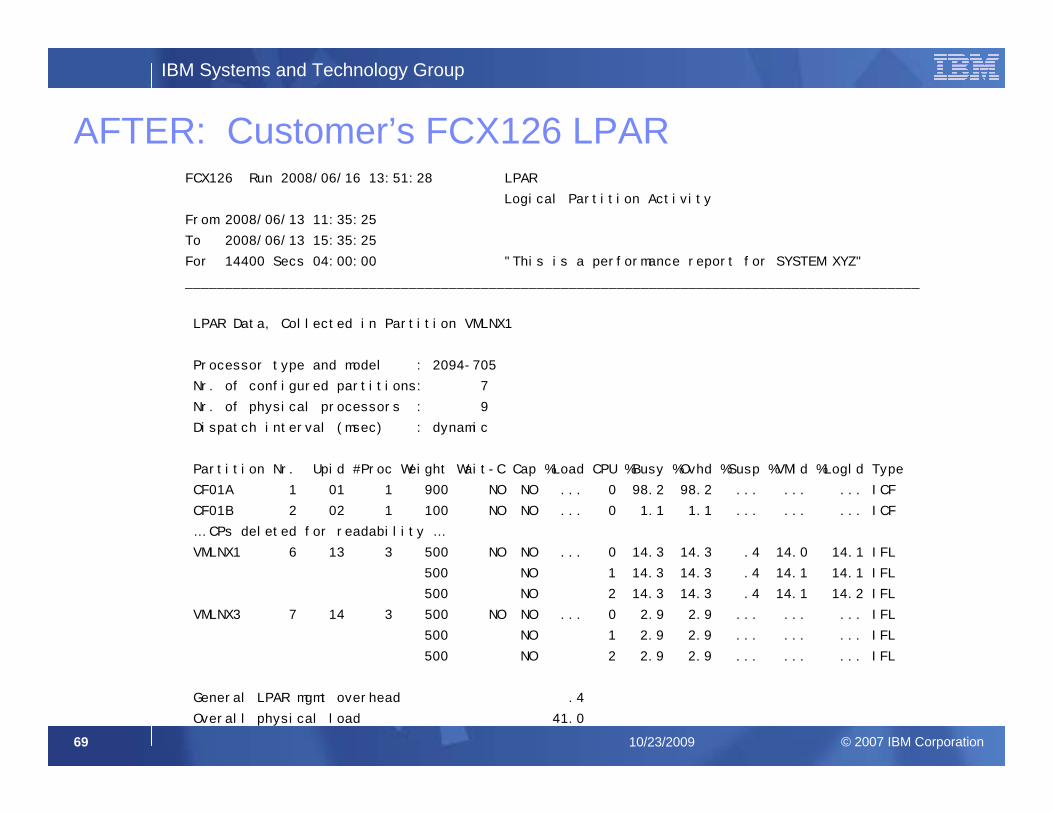
AFTER: Customer’s FCX126 LPARFCX126 Run 2008/06/16 13:51:28 LPAR
Logical Partition Activity
From 2008/06/13 11:35:25
To 2008/06/13 15:35:25
For 14400 Secs 04:00:00 "This is a performance report for SYSTEM XYZ"
____________________________________________________________________________________________
LPAR Data, Collected in Partition VMLNX1
Processor type and model : 2094-705
Nr. of configured partitions: 7
Nr. of physical processors : 9
Dispatch interval (msec) : dynamic
Partition Nr. Upid #Proc Weight Wait-C Cap %Load CPU %Busy %Ovhd %Susp %VMld %Logld Type
CF01A 1 01 1 900 NO NO ... 0 98.2 98.2 ... ... ... ICF
CF01B 2 02 1 100 NO NO ... 0 1.1 1.1 ... ... ... ICF
… CPs deleted for readability …
VMLNX1 6 13 3 500 NO NO ... 0 14.3 14.3 .4 14.0 14.1 IFL
500 NO 1 14.3 14.3 .4 14.1 14.1 IFL
500 NO 2 14.3 14.3 .4 14.1 14.2 IFL
VMLNX3 7 14 3 500 NO NO ... 0 2.9 2.9 ... ... ... IFL
500 NO 1 2.9 2.9 ... ... ... IFL
500 NO 2 2.9 2.9 ... ... ... IFL
General LPAR mgmt overhead .4
Overall physical load 41.0
IBM Systems and Technology Group
© 2007 IBM Corporation70 10/23/2009
Summary
System was running “as it was designed to run”before the changes
Workloads ran as expected after the changes
IBM Systems and Technology Group
© 2007 IBM Corporation71 10/23/2009
Case Study: PAV and MDC
IBM Systems and Technology Group
© 2007 IBM Corporation72 10/23/2009
Customer Called IBM
I have disk I/O problems on z/VM 5.2When I turn on MDC, my system slows downOK, nobody panic or speculateSend us some raw monitor data...ƒFor MDC off, when things are goodƒFor MDC on, when things are not so good
Customer sent two very descriptive sets of dataSo good, in fact, that we easily replicated the customer's problem on GDLSPRF3
IBM Systems and Technology Group
© 2007 IBM Corporation73 10/23/2009
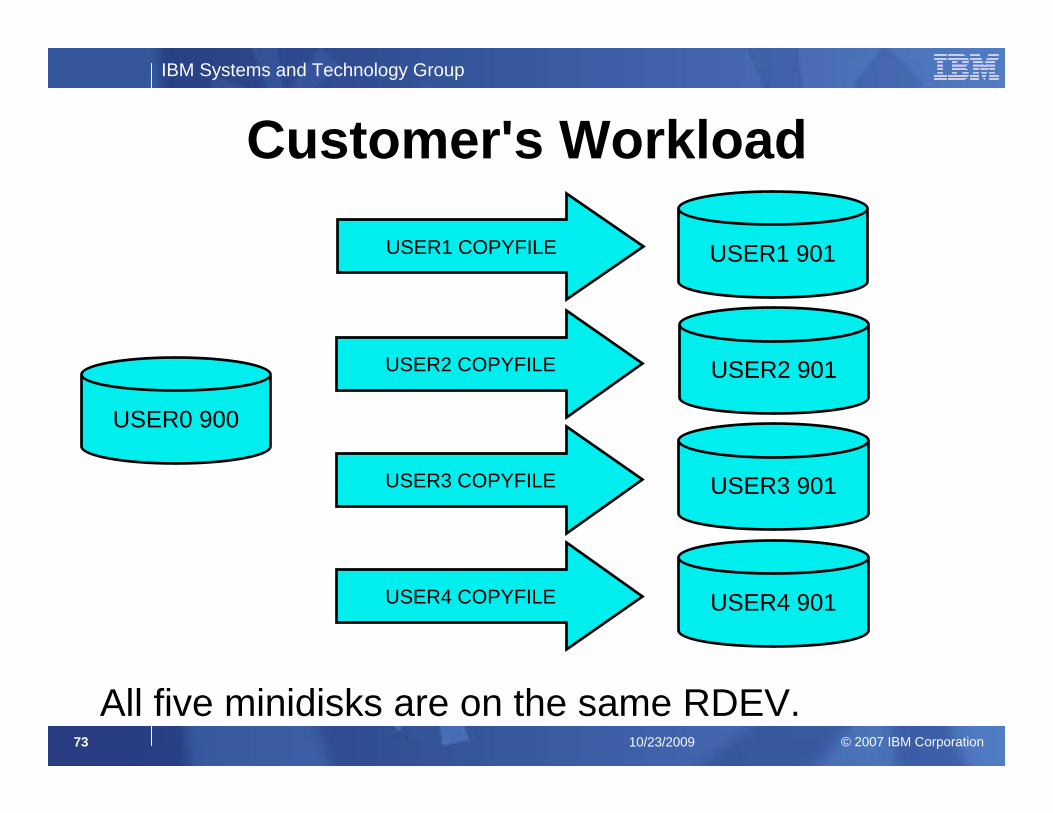
Customer's Workload
USER4 901
USER0 900
USER2 901
USER3 901
USER1 901
USER2 COPYFILE
All five minidisks are on the same RDEV.
USER3 COPYFILE
USER4 COPYFILE
USER1 COPYFILE
IBM Systems and Technology Group
© 2007 IBM Corporation74 10/23/2009
Without MDC
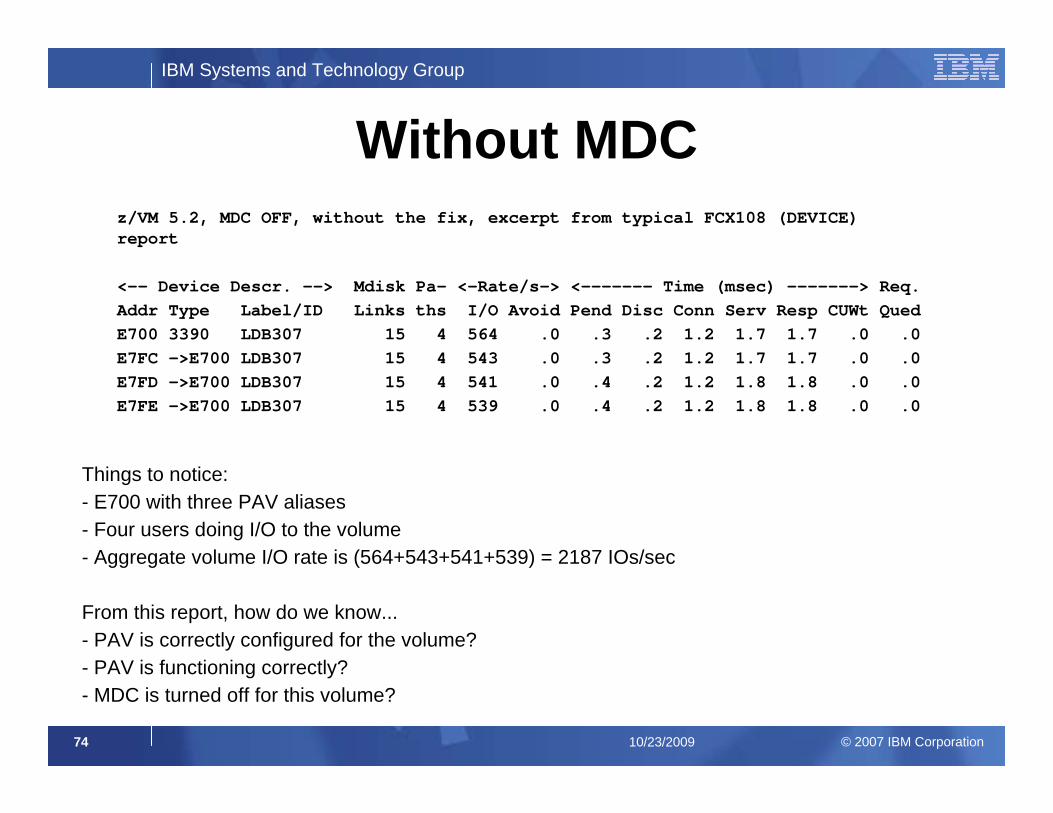
Things to notice:- E700 with three PAV aliases- Four users doing I/O to the volume- Aggregate volume I/O rate is (564+543+541+539) = 2187 IOs/sec
From this report, how do we know...- PAV is correctly configured for the volume?- PAV is functioning correctly?- MDC is turned off for this volume?
z/VM 5.2, MDC OFF, without the fix, excerpt from typical FCX108 (DEVICE) report
<-- Device Descr. --> Mdisk Pa- <-Rate/s-> <------- Time (msec) -------> Req. Addr Type Label/ID Links ths I/O Avoid Pend Disc Conn Serv Resp CUWt Qued E700 3390 LDB307 15 4 564 .0 .3 .2 1.2 1.7 1.7 .0 .0 E7FC ->E700 LDB307 15 4 543 .0 .3 .2 1.2 1.7 1.7 .0 .0 E7FD ->E700 LDB307 15 4 541 .0 .4 .2 1.2 1.8 1.8 .0 .0 E7FE ->E700 LDB307 15 4 539 .0 .4 .2 1.2 1.8 1.8 .0 .0

IBM Systems and Technology Group
© 2007 IBM Corporation75 10/23/2009
But With MDC...
Things to ask ourselves:- Is MDC really on for this volume?- What is the MDC-on volume I/O rate? (564+90.6+.5+.3+.3) = 655.7 IOs/sec- Is it correct that the volume I/O rate should go down with MDC on?- Is the CP I/O subsystem functioning correctly? Why or why not?
z/VM 5.2, MDC ON, without the fix
<-- Device Descr. --> Mdisk Pa- <-Rate/s-> <------- Time (msec) -------> Req. Addr Type Label/ID Links ths I/O Avoid Pend Disc Conn Serv Resp CUWt Qued E700 3390 LDB307 15 4 564 90.6 .3 .1 1.3 1.7 1.9 .0 2.9 E7FC ->E700 LDB307 15 4 .5 .0 .3 .3 1.5 2.1 2.3 .0 .0 E7FD ->E700 LDB307 15 4 .3 .0 .3 .3 1.4 2.0 2.2 .0 .0 E7FE ->E700 LDB307 15 4 .3 .0 .3 .6 1.3 2.2 2.4 .0 .0
IBM Systems and Technology Group
© 2007 IBM Corporation76 10/23/2009
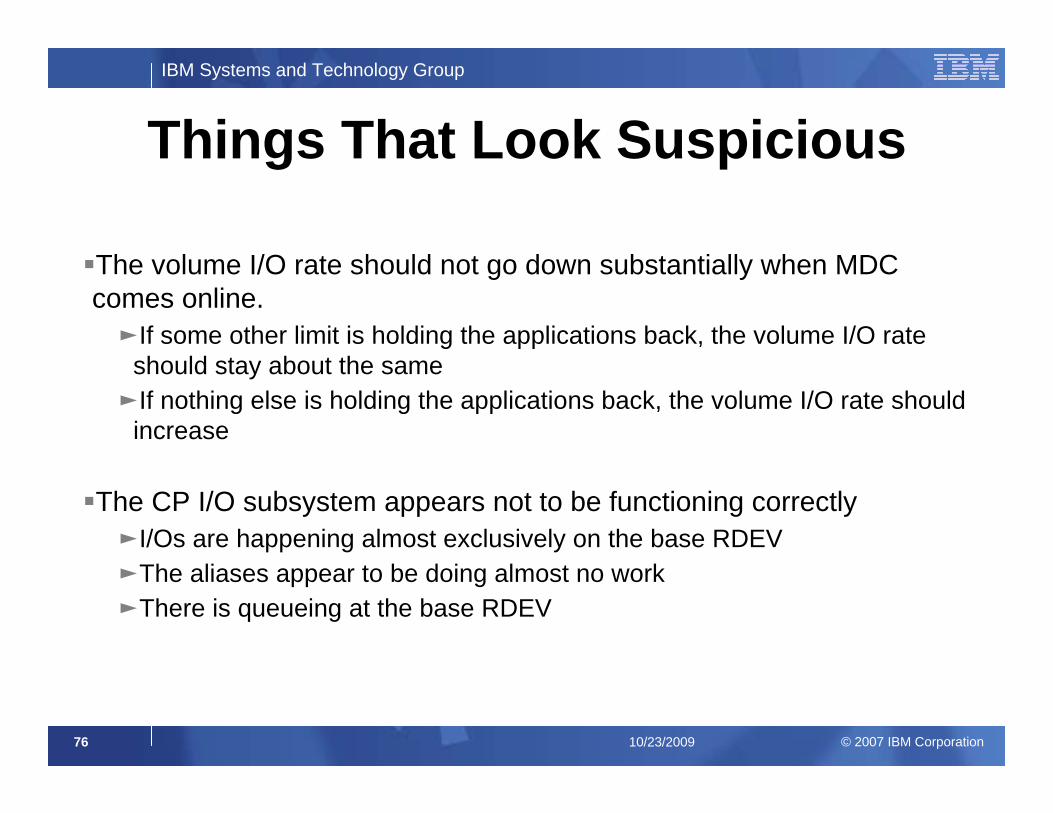
Things That Look Suspicious
The volume I/O rate should not go down substantially when MDC comes online.ƒIf some other limit is holding the applications back, the volume I/O rate
should stay about the sameƒIf nothing else is holding the applications back, the volume I/O rate should
increase
The CP I/O subsystem appears not to be functioning correctlyƒI/Os are happening almost exclusively on the base RDEVƒThe aliases appear to be doing almost no workƒThere is queueing at the base RDEV
IBM Systems and Technology Group
© 2007 IBM Corporation77 10/23/2009
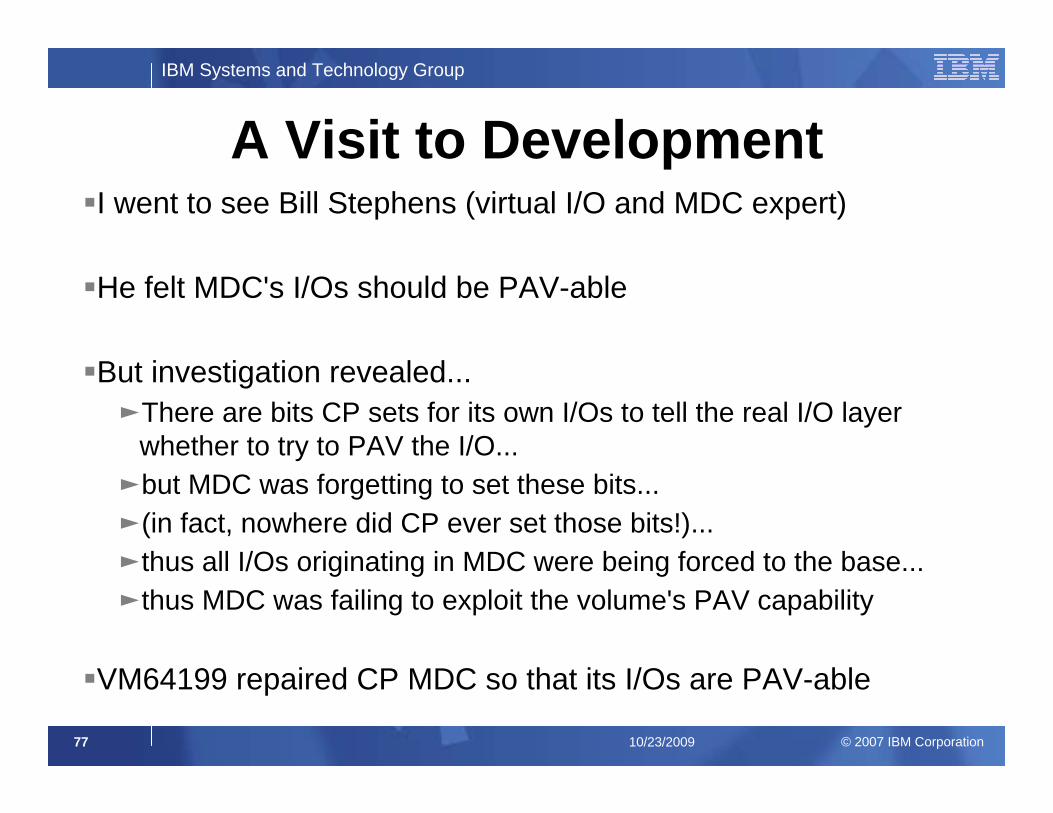
A Visit to DevelopmentI went to see Bill Stephens (virtual I/O and MDC expert)
He felt MDC's I/Os should be PAV-able
But investigation revealed...ƒThere are bits CP sets for its own I/Os to tell the real I/O layer
whether to try to PAV the I/O...ƒbut MDC was forgetting to set these bits...ƒ(in fact, nowhere did CP ever set those bits!)...ƒthus all I/Os originating in MDC were being forced to the base...ƒthus MDC was failing to exploit the volume's PAV capability
VM64199 repaired CP MDC so that its I/Os are PAV-able
IBM Systems and Technology Group
© 2007 IBM Corporation78 10/23/2009
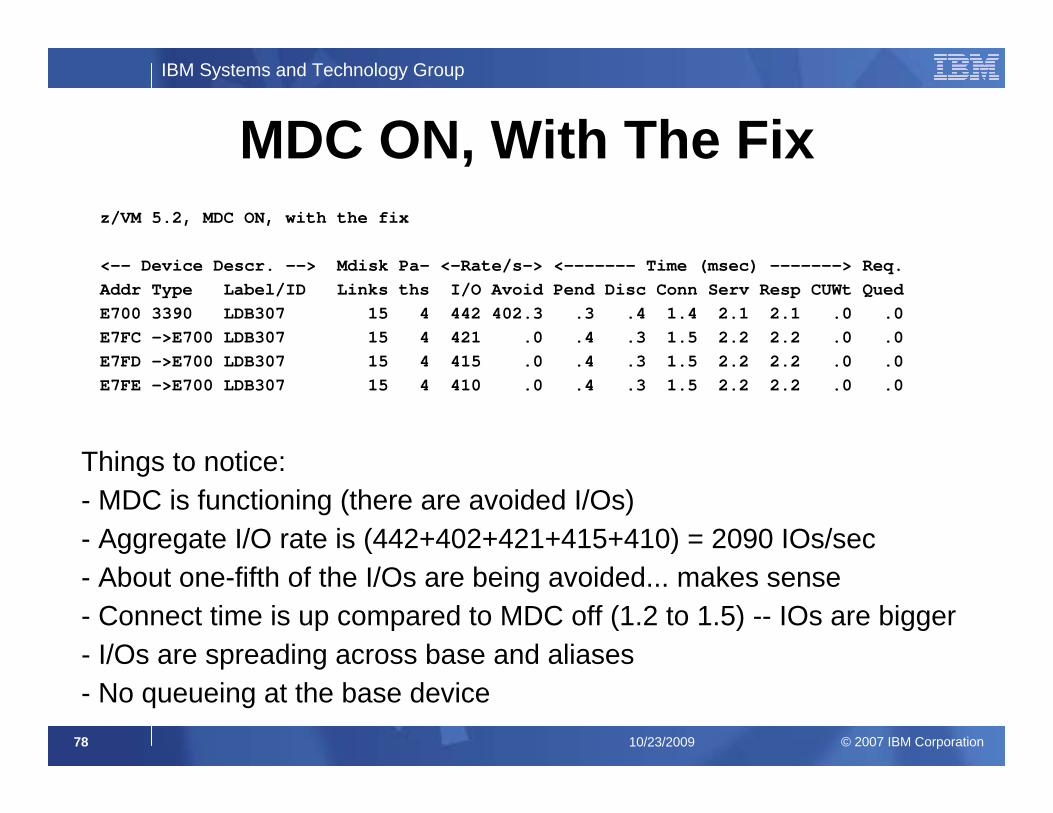
MDC ON, With The Fixz/VM 5.2, MDC ON, with the fix
<-- Device Descr. --> Mdisk Pa- <-Rate/s-> <------- Time (msec) -------> Req. Addr Type Label/ID Links ths I/O Avoid Pend Disc Conn Serv Resp CUWt Qued E700 3390 LDB307 15 4 442 402.3 .3 .4 1.4 2.1 2.1 .0 .0 E7FC ->E700 LDB307 15 4 421 .0 .4 .3 1.5 2.2 2.2 .0 .0 E7FD ->E700 LDB307 15 4 415 .0 .4 .3 1.5 2.2 2.2 .0 .0 E7FE ->E700 LDB307 15 4 410 .0 .4 .3 1.5 2.2 2.2 .0 .0
Things to notice:- MDC is functioning (there are avoided I/Os)- Aggregate I/O rate is (442+402+421+415+410) = 2090 IOs/sec- About one-fifth of the I/Os are being avoided... makes sense- Connect time is up compared to MDC off (1.2 to 1.5) -- IOs are bigger- I/Os are spreading across base and aliases- No queueing at the base device
IBM Systems and Technology Group
© 2007 IBM Corporation79 10/23/2009
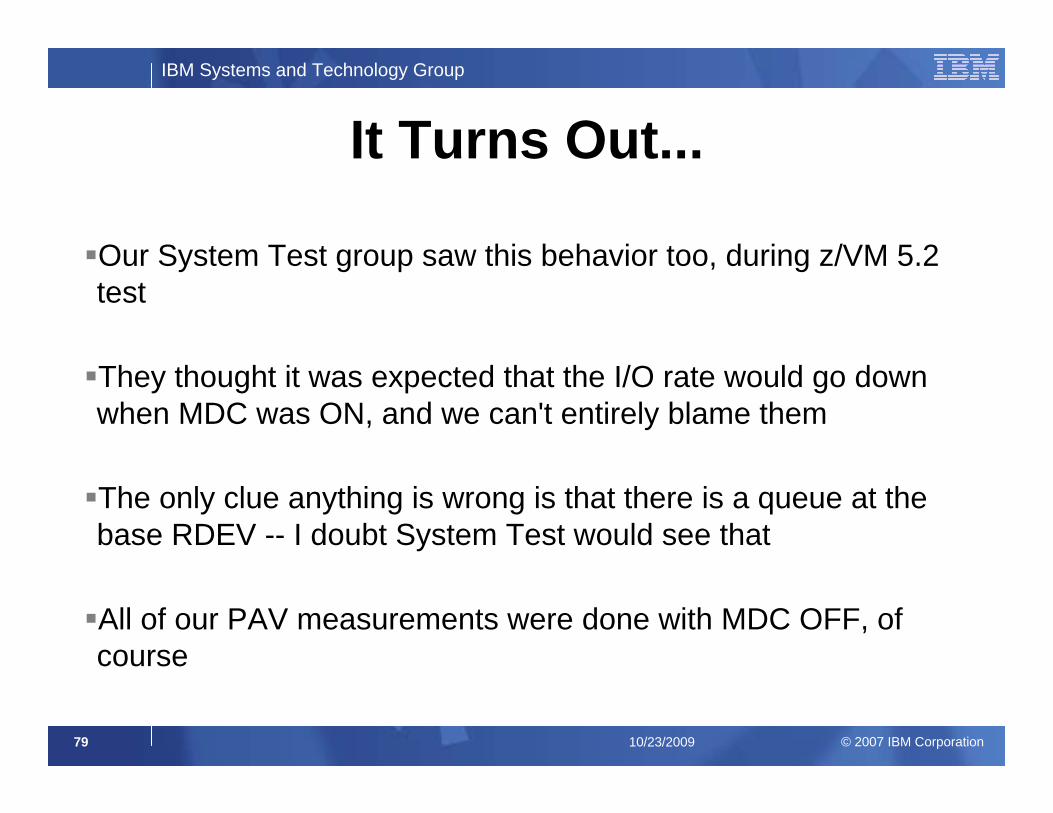
It Turns Out...
Our System Test group saw this behavior too, during z/VM 5.2 test
They thought it was expected that the I/O rate would go down when MDC was ON, and we can't entirely blame them
The only clue anything is wrong is that there is a queue at the base RDEV -- I doubt System Test would see that
All of our PAV measurements were done with MDC OFF, of course
IBM Systems and Technology Group
© 2007 IBM Corporation80 10/23/2009
StatusAPAR VM64199, UM32047 (z/VM 5.2), UM32048 (z/VM 5.3)
Is on the GA RSU for z/VM 5.3
In the base of z/VM 5.4
IBM Systems and Technology Group
© 2007 IBM Corporation81 10/23/2009
Case Study: Paging Difficulties
IBM Systems and Technology Group
© 2007 IBM Corporation82 10/23/2009
Customer Calls InMy system isn't running fast, but it isn't paging either
My application formats lots of VDISKs... aren't they in memory? Shouldn't this be fast?
I have raw monitor data... will you take a look?
Customer sent raw monitor file 20070501 MD111606
He says his workload uses disk volumes 1240-59 and 16C0-E3
We took a look-see

IBM Systems and Technology Group
© 2007 IBM Corporation83 10/23/2009
Basic System SummaryFCX225 Run 2007/05/02 12:56:34 SYSSUMLG
System Performance Summary by Time
From 2007/05/01 11:16:08
To 2007/05/01 12:37:10
For 4861 Secs 01:21:01 Result of 20070501 Run
__________________________________________________________________________________
<------- CPU --------> <Vec> <--Users--> <---I/O---> <Stg> <-Paging-->
<--Ratio--> SSCH DASD Users <-Rate/s-->
Interval Pct Cap- On- Pct Log- +RSCH Resp in PGIN+ Read+
End Time Busy T/V ture line Busy ged Activ /s msec Elist PGOUT Write
>>Mean>> 10.3 106.3 .7577 27.0 .... 280 263 122.7 11.1 .0 5418 1445
11:23:41 9.9 180.7 .8232 27.0 .... 280 263 25.8 .8 .0 2645 .0
11:24:40 10.3 193.5 .8051 27.0 .... 280 263 23.8 .7 .0 2707 .0
11:25:39 10.5 196.8 .8218 27.0 .... 280 262 23.6 .8 .0 2825 .0
11:27:10 9.7 159.5 .8232 27.0 .... 280 262 29.9 .7 .0 3714 .0
11:28:09 9.8 108.2 .8015 27.0 .... 280 266 48.4 .8 .0 8942 .1
11:29:40 9.8 119.2 .8134 27.0 .... 280 264 33.2 .9 .0 8602 2.8
11:36:10 10.3 119.6 .8048 27.0 .... 280 263 45.7 .6 .0 9327 .0
11:37:40 10.5 136.8 .8028 27.0 .... 280 262 30.3 .6 .0 9213 .0
11:39:10 10.8 144.2 .8158 27.0 .... 280 264 30.7 .7 .0 9189 .0
11:40:40 10.5 135.6 .8093 27.0 .... 280 264 32.5 .7 .0 10083 .0
11:41:39 10.7 166.5 .8124 27.0 .... 280 262 25.2 .8 .0 8942 .0
11:42:41 10.2 167.6 .8070 27.0 .... 280 262 23.0 .7 .0 9311 .0 Look at those T/V ratios! What is CP doing?
IBM Systems and Technology Group
© 2007 IBM Corporation84 10/23/2009
Think About the Application
Customer says he is formatting VDISKs
VDISKs are address spaces
We page them when storage gets tight
We do seem to be spending a lot of time in CP
Let's see if DEVICE CPOWNED shows us anything
IBM Systems and Technology Group
© 2007 IBM Corporation85 10/23/2009
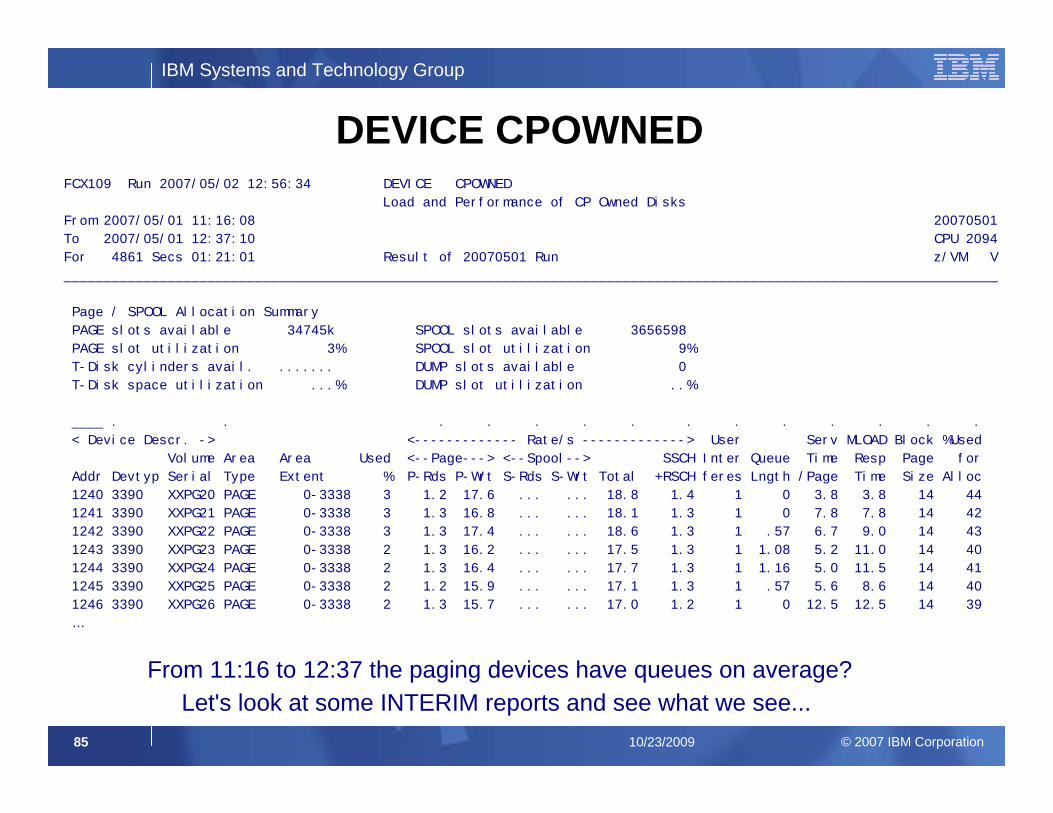
DEVICE CPOWNEDFCX109 Run 2007/05/02 12:56:34 DEVICE CPOWNED
Load and Performance of CP Owned Disks
From 2007/05/01 11:16:08 20070501
To 2007/05/01 12:37:10 CPU 2094
For 4861 Secs 01:21:01 Result of 20070501 Run z/VM V
_____________________________________________________________________________________________________________________
Page / SPOOL Allocation Summary
PAGE slots available 34745k SPOOL slots available 3656598
PAGE slot utilization 3% SPOOL slot utilization 9%
T-Disk cylinders avail. ....... DUMP slots available 0
T-Disk space utilization ...% DUMP slot utilization ..%
____ . . . . . . . . . . . . . .
< Device Descr. -> <------------- Rate/s -------------> User Serv MLOAD Block %Used
Volume Area Area Used <--Page---> <--Spool--> SSCH Inter Queue Time Resp Page for
Addr Devtyp Serial Type Extent % P-Rds P-Wrt S-Rds S-Wrt Total +RSCH feres Lngth /Page Time Size Alloc
1240 3390 XXPG20 PAGE 0-3338 3 1.2 17.6 ... ... 18.8 1.4 1 0 3.8 3.8 14 44
1241 3390 XXPG21 PAGE 0-3338 3 1.3 16.8 ... ... 18.1 1.3 1 0 7.8 7.8 14 42
1242 3390 XXPG22 PAGE 0-3338 3 1.3 17.4 ... ... 18.6 1.3 1 .57 6.7 9.0 14 43
1243 3390 XXPG23 PAGE 0-3338 2 1.3 16.2 ... ... 17.5 1.3 1 1.08 5.2 11.0 14 40
1244 3390 XXPG24 PAGE 0-3338 2 1.3 16.4 ... ... 17.7 1.3 1 1.16 5.0 11.5 14 41
1245 3390 XXPG25 PAGE 0-3338 2 1.2 15.9 ... ... 17.1 1.3 1 .57 5.6 8.6 14 40
1246 3390 XXPG26 PAGE 0-3338 2 1.3 15.7 ... ... 17.0 1.2 1 0 12.5 12.5 14 39
…
From 11:16 to 12:37 the paging devices have queues on average?Let's look at some INTERIM reports and see what we see...
IBM Systems and Technology Group
© 2007 IBM Corporation86 10/23/2009
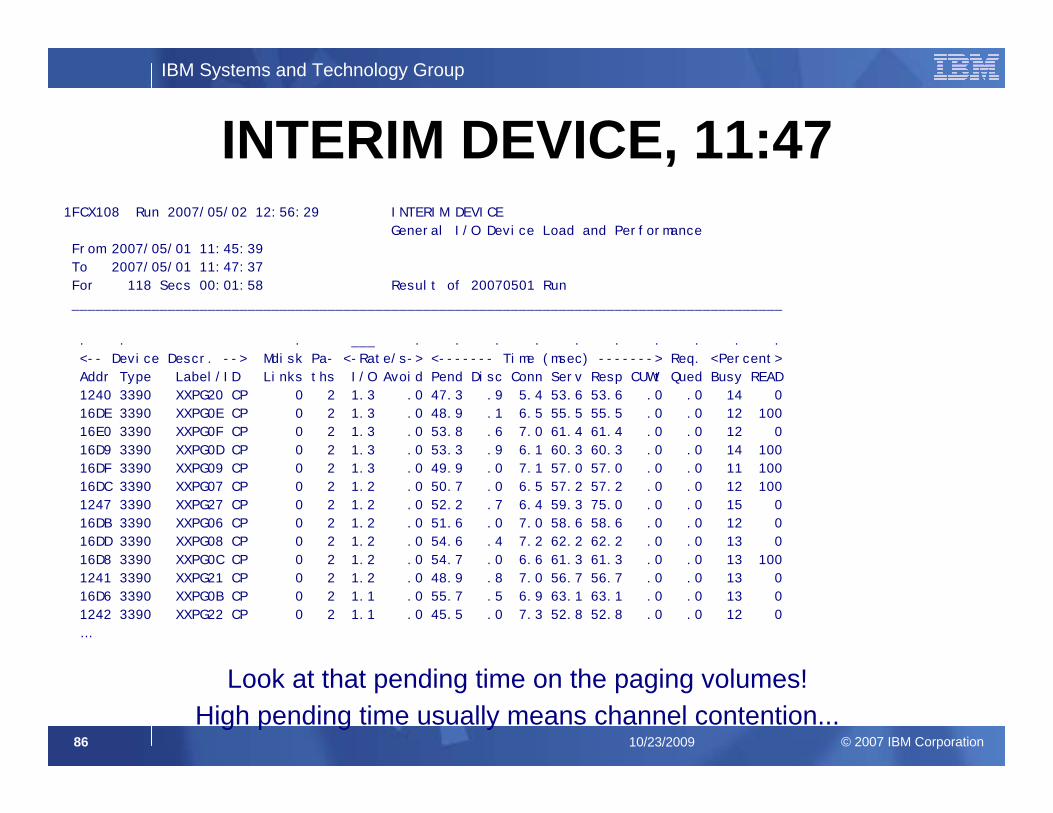
INTERIM DEVICE, 11:471FCX108 Run 2007/05/02 12:56:29 INTERIM DEVICE
General I/O Device Load and Performance
From 2007/05/01 11:45:39
To 2007/05/01 11:47:37
For 118 Secs 00:01:58 Result of 20070501 Run
_________________________________________________________________________________________
. . . ___ . . . . . . . . . .
<-- Device Descr. --> Mdisk Pa- <-Rate/s-> <------- Time (msec) -------> Req. <Percent>
Addr Type Label/ID Links ths I/O Avoid Pend Disc Conn Serv Resp CUWt Qued Busy READ
1240 3390 XXPG20 CP 0 2 1.3 .0 47.3 .9 5.4 53.6 53.6 .0 .0 14 0
16DE 3390 XXPG0E CP 0 2 1.3 .0 48.9 .1 6.5 55.5 55.5 .0 .0 12 100
16E0 3390 XXPG0F CP 0 2 1.3 .0 53.8 .6 7.0 61.4 61.4 .0 .0 12 0
16D9 3390 XXPG0D CP 0 2 1.3 .0 53.3 .9 6.1 60.3 60.3 .0 .0 14 100
16DF 3390 XXPG09 CP 0 2 1.3 .0 49.9 .0 7.1 57.0 57.0 .0 .0 11 100
16DC 3390 XXPG07 CP 0 2 1.2 .0 50.7 .0 6.5 57.2 57.2 .0 .0 12 100
1247 3390 XXPG27 CP 0 2 1.2 .0 52.2 .7 6.4 59.3 75.0 .0 .0 15 0
16DB 3390 XXPG06 CP 0 2 1.2 .0 51.6 .0 7.0 58.6 58.6 .0 .0 12 0
16DD 3390 XXPG08 CP 0 2 1.2 .0 54.6 .4 7.2 62.2 62.2 .0 .0 13 0
16D8 3390 XXPG0C CP 0 2 1.2 .0 54.7 .0 6.6 61.3 61.3 .0 .0 13 100
1241 3390 XXPG21 CP 0 2 1.2 .0 48.9 .8 7.0 56.7 56.7 .0 .0 13 0
16D6 3390 XXPG0B CP 0 2 1.1 .0 55.7 .5 6.9 63.1 63.1 .0 .0 13 0
1242 3390 XXPG22 CP 0 2 1.1 .0 45.5 .0 7.3 52.8 52.8 .0 .0 12 0
…
Look at that pending time on the paging volumes!High pending time usually means channel contention...
IBM Systems and Technology Group
© 2007 IBM Corporation87 10/23/2009
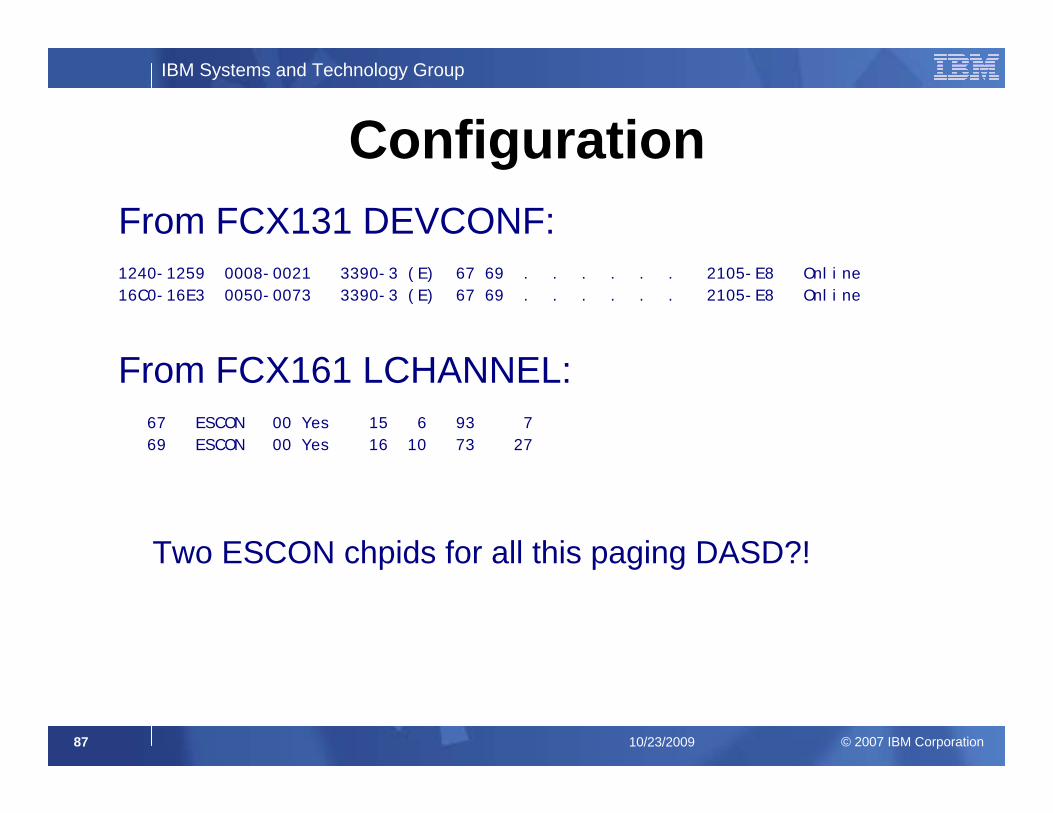
Configuration
67 ESCON 00 Yes 15 6 93 7
69 ESCON 00 Yes 16 10 73 27
From FCX161 LCHANNEL:
Two ESCON chpids for all this paging DASD?!
From FCX131 DEVCONF:1240-1259 0008-0021 3390-3 (E) 67 69 . . . . . . 2105-E8 Online
16C0-16E3 0050-0073 3390-3 (E) 67 69 . . . . . . 2105-E8 Online
IBM Systems and Technology Group
© 2007 IBM Corporation88 10/23/2009
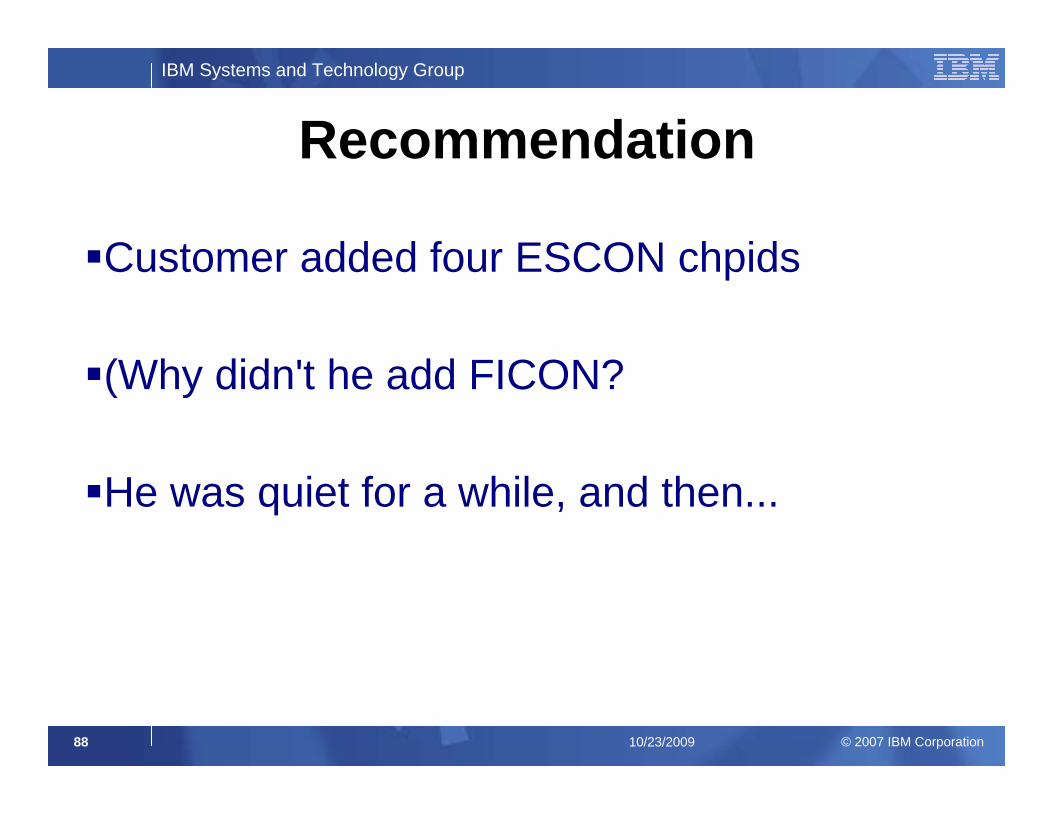
Recommendation
Customer added four ESCON chpids
(Why didn't he add FICON?
He was quiet for a while, and then...
IBM Systems and Technology Group
© 2007 IBM Corporation89 10/23/2009
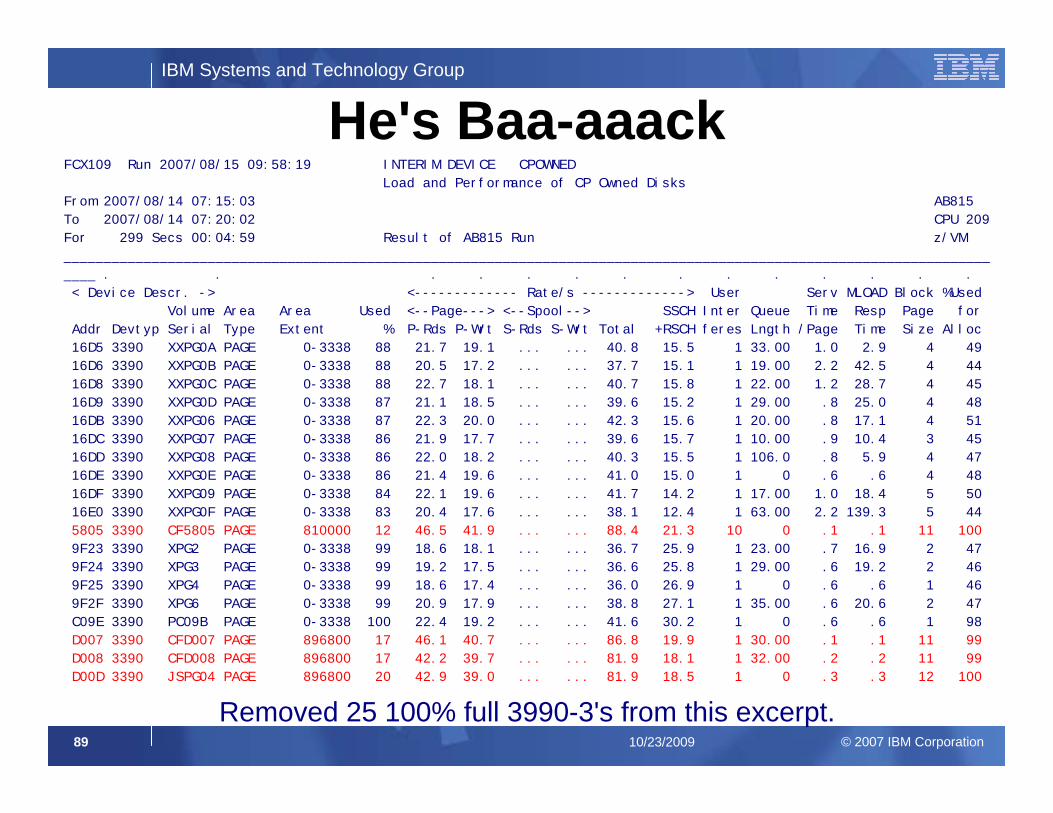
He's Baa-aaackFCX109 Run 2007/08/15 09:58:19 INTERIM DEVICE CPOWNED
Load and Performance of CP Owned Disks
From 2007/08/14 07:15:03 AB815
To 2007/08/14 07:20:02 CPU 209
For 299 Secs 00:04:59 Result of AB815 Run z/VM
____________________________________________________________________________________________________________________
____ . . . . . . . . . . . . . .
< Device Descr. -> <------------- Rate/s -------------> User Serv MLOAD Block %Used
Volume Area Area Used <--Page---> <--Spool--> SSCH Inter Queue Time Resp Page for
Addr Devtyp Serial Type Extent % P-Rds P-Wrt S-Rds S-Wrt Total +RSCH feres Lngth /Page Time Size Alloc
16D5 3390 XXPG0A PAGE 0-3338 88 21.7 19.1 ... ... 40.8 15.5 1 33.00 1.0 2.9 4 49
16D6 3390 XXPG0B PAGE 0-3338 88 20.5 17.2 ... ... 37.7 15.1 1 19.00 2.2 42.5 4 44
16D8 3390 XXPG0C PAGE 0-3338 88 22.7 18.1 ... ... 40.7 15.8 1 22.00 1.2 28.7 4 45
16D9 3390 XXPG0D PAGE 0-3338 87 21.1 18.5 ... ... 39.6 15.2 1 29.00 .8 25.0 4 48
16DB 3390 XXPG06 PAGE 0-3338 87 22.3 20.0 ... ... 42.3 15.6 1 20.00 .8 17.1 4 51
16DC 3390 XXPG07 PAGE 0-3338 86 21.9 17.7 ... ... 39.6 15.7 1 10.00 .9 10.4 3 45
16DD 3390 XXPG08 PAGE 0-3338 86 22.0 18.2 ... ... 40.3 15.5 1 106.0 .8 5.9 4 47
16DE 3390 XXPG0E PAGE 0-3338 86 21.4 19.6 ... ... 41.0 15.0 1 0 .6 .6 4 48
16DF 3390 XXPG09 PAGE 0-3338 84 22.1 19.6 ... ... 41.7 14.2 1 17.00 1.0 18.4 5 50
16E0 3390 XXPG0F PAGE 0-3338 83 20.4 17.6 ... ... 38.1 12.4 1 63.00 2.2 139.3 5 44
5805 3390 CF5805 PAGE 810000 12 46.5 41.9 ... ... 88.4 21.3 10 0 .1 .1 11 100
9F23 3390 XPG2 PAGE 0-3338 99 18.6 18.1 ... ... 36.7 25.9 1 23.00 .7 16.9 2 47
9F24 3390 XPG3 PAGE 0-3338 99 19.2 17.5 ... ... 36.6 25.8 1 29.00 .6 19.2 2 46
9F25 3390 XPG4 PAGE 0-3338 99 18.6 17.4 ... ... 36.0 26.9 1 0 .6 .6 1 46
9F2F 3390 XPG6 PAGE 0-3338 99 20.9 17.9 ... ... 38.8 27.1 1 35.00 .6 20.6 2 47
C09E 3390 PC09B PAGE 0-3338 100 22.4 19.2 ... ... 41.6 30.2 1 0 .6 .6 1 98
D007 3390 CFD007 PAGE 896800 17 46.1 40.7 ... ... 86.8 19.9 1 30.00 .1 .1 11 99
D008 3390 CFD008 PAGE 896800 17 42.2 39.7 ... ... 81.9 18.1 1 32.00 .2 .2 11 99
D00D 3390 JSPG04 PAGE 896800 20 42.9 39.0 ... ... 81.9 18.5 1 0 .3 .3 12 100
Removed 25 100% full 3990-3's from this excerpt.
IBM Systems and Technology Group
© 2007 IBM Corporation90 10/23/2009
So What's The Problem
40 3390-3 paging volumes nearly full
4 3390-9 paging volumes have the free space
We can do only one I/O at a time to those gigantic model 9's
Get rid of those mod 9's and add a lot of mod 3's
He's working on it
IBM Systems and Technology Group
© 2007 IBM Corporation91 10/23/2009
Case Study:HiperSockets
IBM Systems and Technology Group
© 2007 IBM Corporation92 10/23/2009
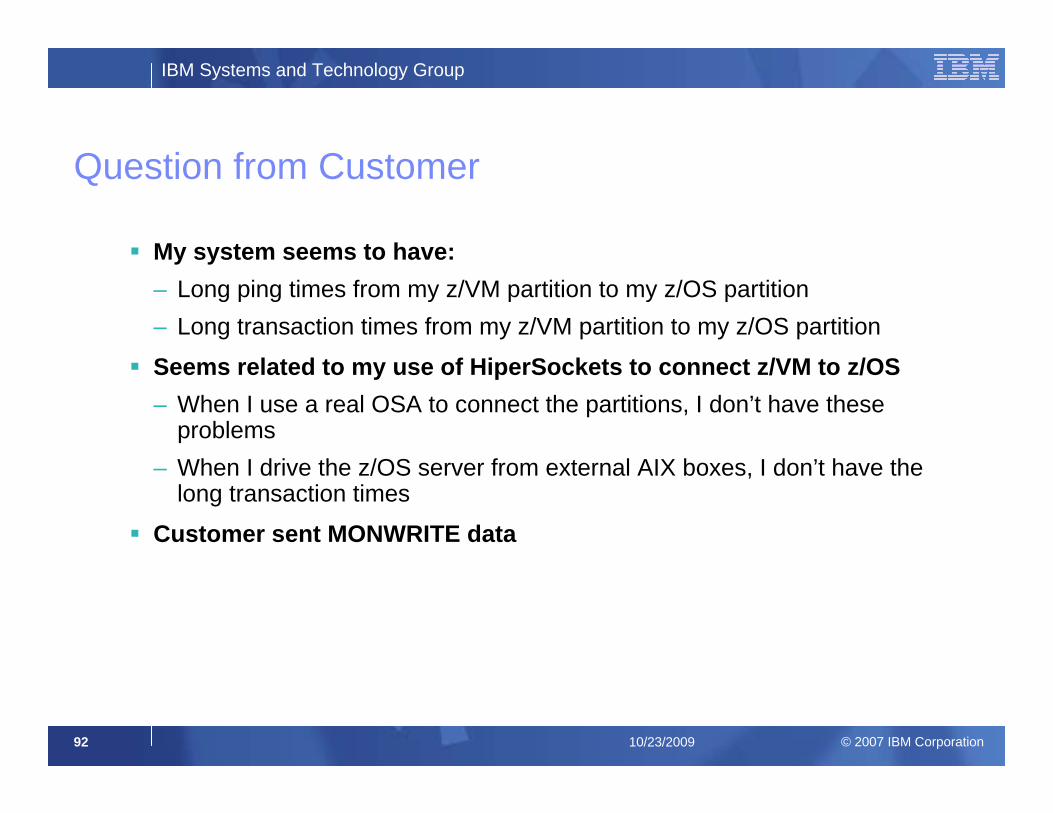
Question from Customer
My system seems to have:– Long ping times from my z/VM partition to my z/OS partition– Long transaction times from my z/VM partition to my z/OS partition
Seems related to my use of HiperSockets to connect z/VM to z/OS– When I use a real OSA to connect the partitions, I don’t have these
problems– When I drive the z/OS server from external AIX boxes, I don’t have the
long transaction times
Customer sent MONWRITE data

IBM Systems and Technology Group
© 2007 IBM Corporation93 10/23/2009
CEC and LPAR Configuration, from MONWRITE Data
2094 with:– 6 CPs– 4 ICFs– 12 IFLs– 4 zIIPs
Several z/VM partitions, all shared IFL 12-ways, but only one of these partitions is activeSeveral z/OS partitions, all shared, with varying logical PU configurations, that use the CPs and zIIPsTwo coupling partitions that use the ICFs, dedicated
IBM Systems and Technology Group
© 2007 IBM Corporation94 10/23/2009
Workload Configuration, from Customer
Linux on z/VM is the origin
Over to z/OS database server via real HiperSocket
Back to Linux on z/VM via real HiperSocket
Transaction ends
IBM Systems and Technology Group
© 2007 IBM Corporation95 10/23/2009
Long Response Time? Let’s Hunt z/VM Constraints
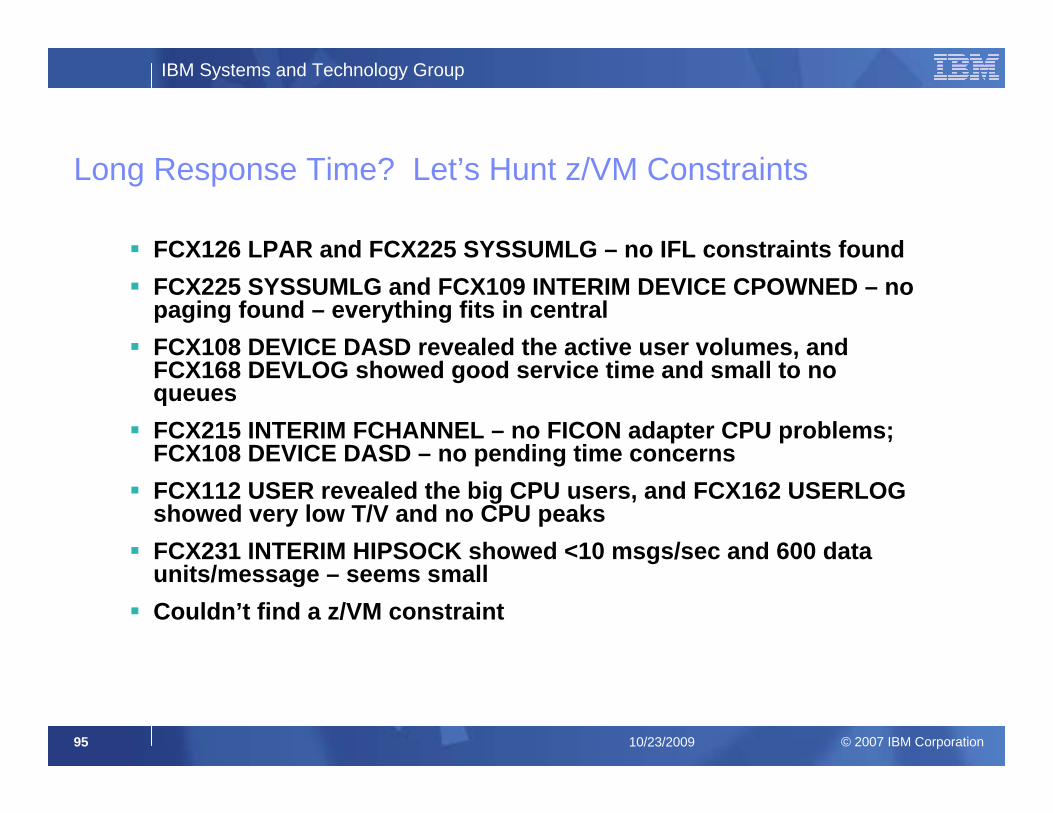
FCX126 LPAR and FCX225 SYSSUMLG – no IFL constraints foundFCX225 SYSSUMLG and FCX109 INTERIM DEVICE CPOWNED – no paging found – everything fits in centralFCX108 DEVICE DASD revealed the active user volumes, and FCX168 DEVLOG showed good service time and small to no queuesFCX215 INTERIM FCHANNEL – no FICON adapter CPU problems; FCX108 DEVICE DASD – no pending time concernsFCX112 USER revealed the big CPU users, and FCX162 USERLOG showed very low T/V and no CPU peaksFCX231 INTERIM HIPSOCK showed <10 msgs/sec and 600 data units/message – seems smallCouldn’t find a z/VM constraint
IBM Systems and Technology Group
© 2007 IBM Corporation96 10/23/2009
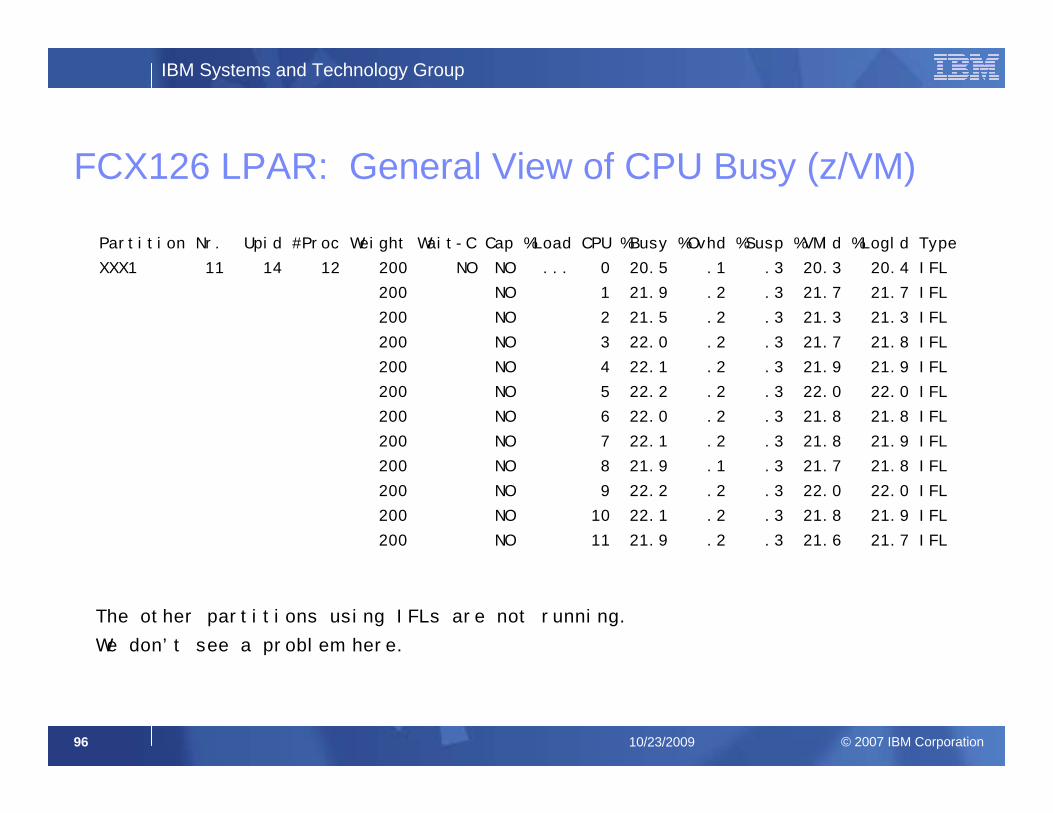
FCX126 LPAR: General View of CPU Busy (z/VM)
Partition Nr. Upid #Proc Weight Wait-C Cap %Load CPU %Busy %Ovhd %Susp %VMld %Logld Type
XXX1 11 14 12 200 NO NO ... 0 20.5 .1 .3 20.3 20.4 IFL
200 NO 1 21.9 .2 .3 21.7 21.7 IFL
200 NO 2 21.5 .2 .3 21.3 21.3 IFL
200 NO 3 22.0 .2 .3 21.7 21.8 IFL
200 NO 4 22.1 .2 .3 21.9 21.9 IFL
200 NO 5 22.2 .2 .3 22.0 22.0 IFL
200 NO 6 22.0 .2 .3 21.8 21.8 IFL
200 NO 7 22.1 .2 .3 21.8 21.9 IFL
200 NO 8 21.9 .1 .3 21.7 21.8 IFL
200 NO 9 22.2 .2 .3 22.0 22.0 IFL
200 NO 10 22.1 .2 .3 21.8 21.9 IFL
200 NO 11 21.9 .2 .3 21.6 21.7 IFL
The other partitions using IFLs are not running.
We don’t see a problem here.
IBM Systems and Technology Group
© 2007 IBM Corporation97 10/23/2009
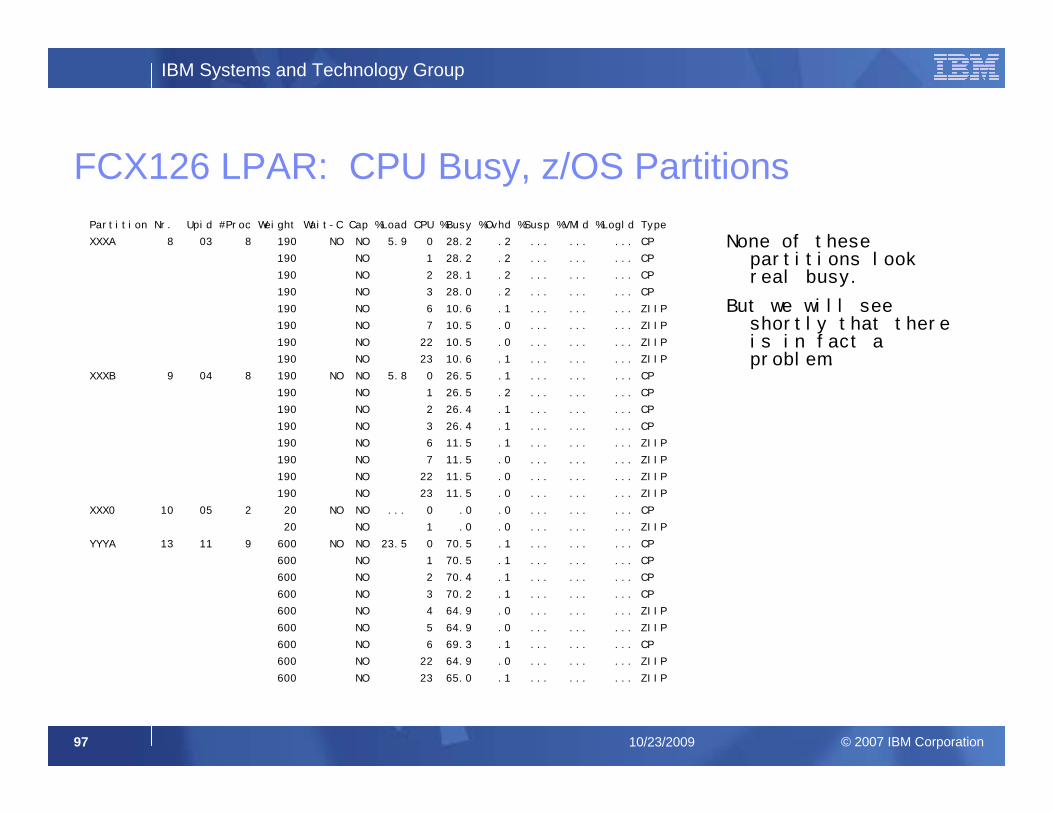
FCX126 LPAR: CPU Busy, z/OS PartitionsPartition Nr. Upid #Proc Weight Wait-C Cap %Load CPU %Busy %Ovhd %Susp %VMld %Logld Type
XXXA 8 03 8 190 NO NO 5.9 0 28.2 .2 ... ... ... CP
190 NO 1 28.2 .2 ... ... ... CP
190 NO 2 28.1 .2 ... ... ... CP
190 NO 3 28.0 .2 ... ... ... CP
190 NO 6 10.6 .1 ... ... ... ZIIP
190 NO 7 10.5 .0 ... ... ... ZIIP
190 NO 22 10.5 .0 ... ... ... ZIIP
190 NO 23 10.6 .1 ... ... ... ZIIP
XXXB 9 04 8 190 NO NO 5.8 0 26.5 .1 ... ... ... CP
190 NO 1 26.5 .2 ... ... ... CP
190 NO 2 26.4 .1 ... ... ... CP
190 NO 3 26.4 .1 ... ... ... CP
190 NO 6 11.5 .1 ... ... ... ZIIP
190 NO 7 11.5 .0 ... ... ... ZIIP
190 NO 22 11.5 .0 ... ... ... ZIIP
190 NO 23 11.5 .0 ... ... ... ZIIP
XXX0 10 05 2 20 NO NO ... 0 .0 .0 ... ... ... CP
20 NO 1 .0 .0 ... ... ... ZIIP
YYYA 13 11 9 600 NO NO 23.5 0 70.5 .1 ... ... ... CP
600 NO 1 70.5 .1 ... ... ... CP
600 NO 2 70.4 .1 ... ... ... CP
600 NO 3 70.2 .1 ... ... ... CP
600 NO 4 64.9 .0 ... ... ... ZIIP
600 NO 5 64.9 .0 ... ... ... ZIIP
600 NO 6 69.3 .1 ... ... ... CP
600 NO 22 64.9 .0 ... ... ... ZIIP
600 NO 23 65.0 .1 ... ... ... ZIIP
None of these partitions look real busy.
But we will see shortly that there is in fact a problem.
IBM Systems and Technology Group
© 2007 IBM Corporation98 10/23/2009
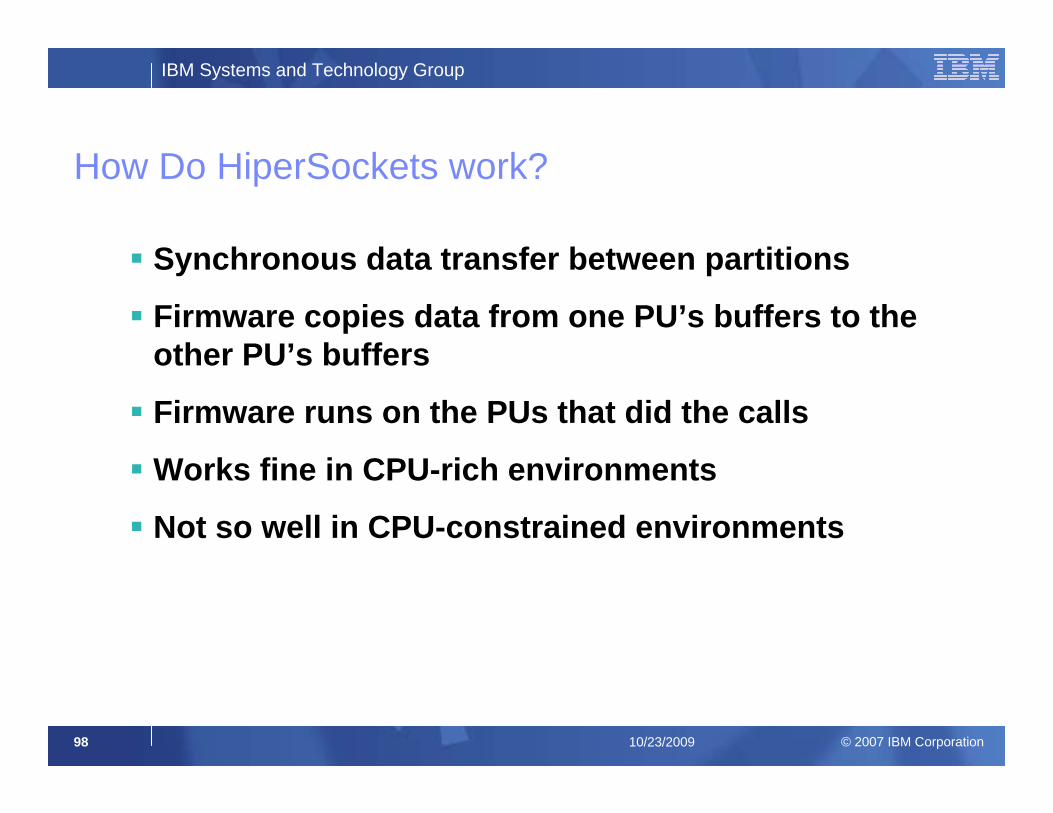
How Do HiperSockets work?
Synchronous data transfer between partitions
Firmware copies data from one PU’s buffers to the other PU’s buffers
Firmware runs on the PUs that did the calls
Works fine in CPU-rich environments
Not so well in CPU-constrained environments
IBM Systems and Technology Group
© 2007 IBM Corporation99 10/23/2009
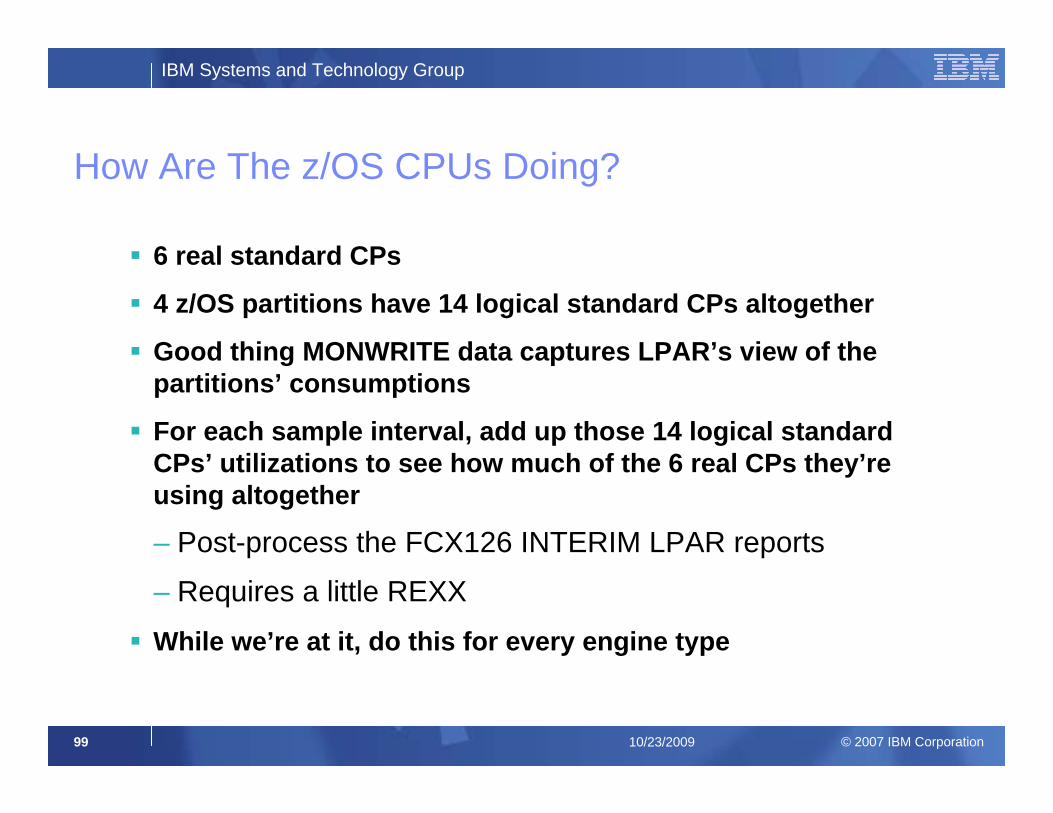
How Are The z/OS CPUs Doing?
6 real standard CPs
4 z/OS partitions have 14 logical standard CPs altogether
Good thing MONWRITE data captures LPAR’s view of the partitions’ consumptions
For each sample interval, add up those 14 logical standard CPs’ utilizations to see how much of the 6 real CPs they’re using altogether
– Post-process the FCX126 INTERIM LPAR reports
– Requires a little REXX
While we’re at it, do this for every engine type
IBM Systems and Technology Group
© 2007 IBM Corporation100 10/23/2009
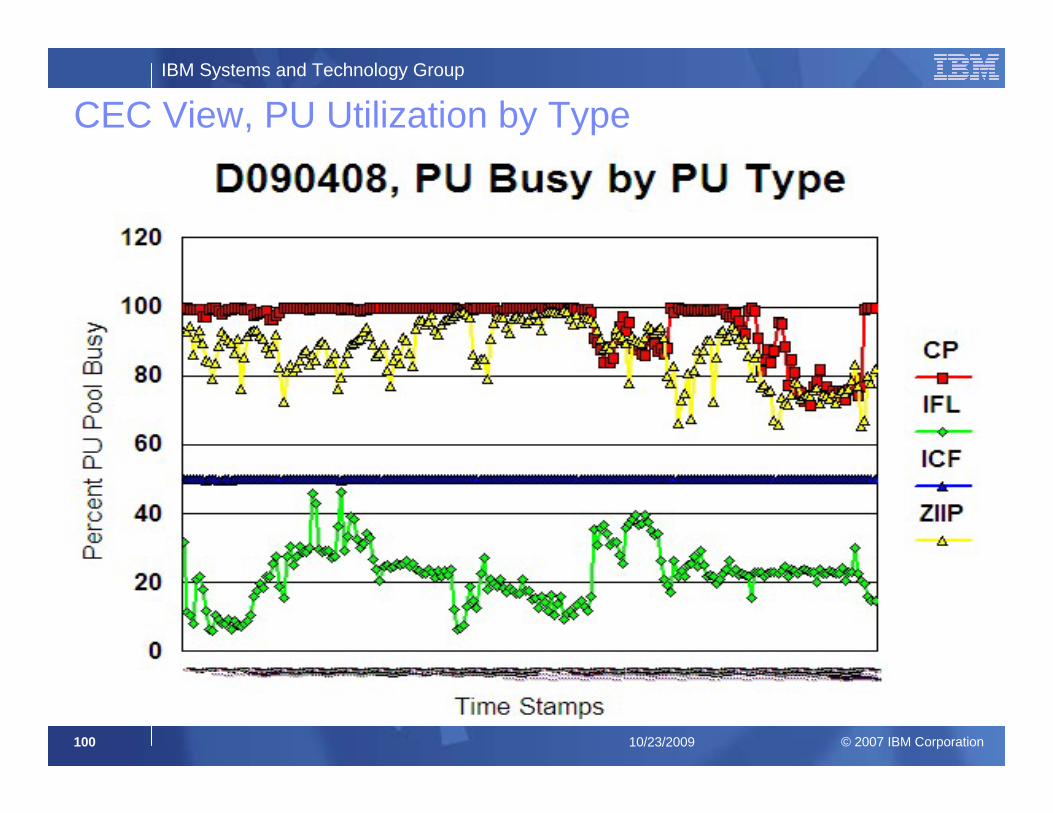
CEC View, PU Utilization by Type
IBM Systems and Technology Group
© 2007 IBM Corporation101 10/23/2009
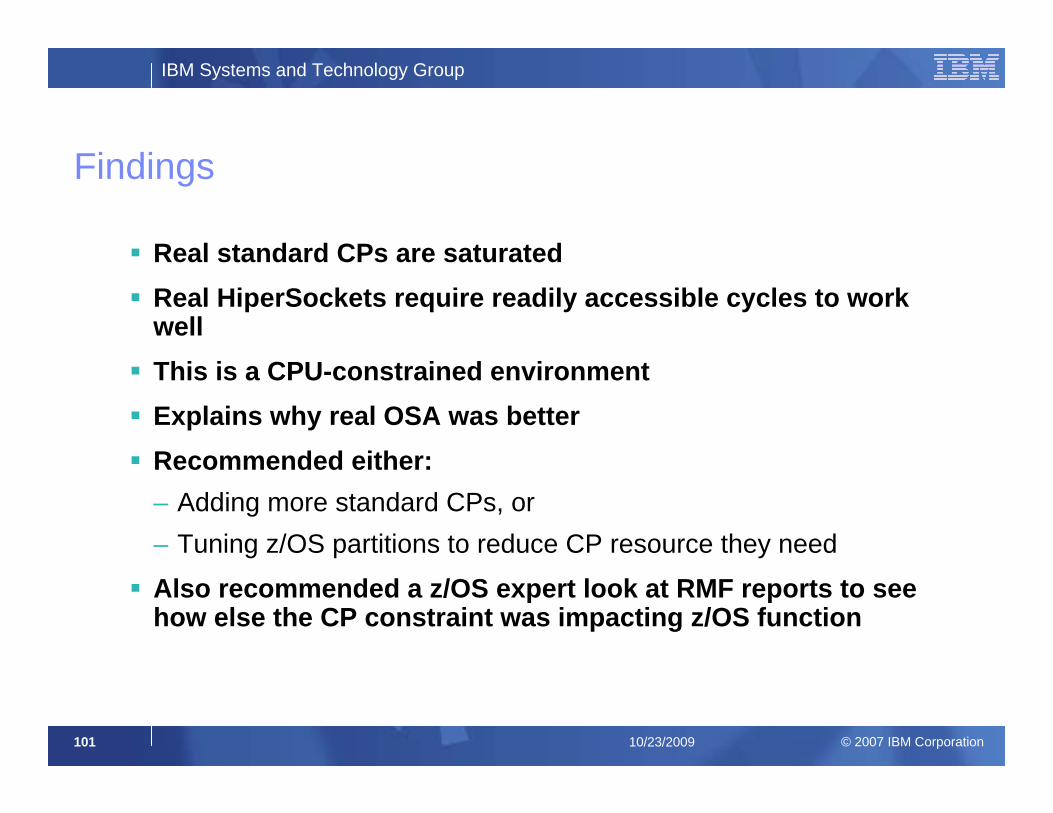
Findings
Real standard CPs are saturatedReal HiperSockets require readily accessible cycles to work wellThis is a CPU-constrained environmentExplains why real OSA was betterRecommended either:– Adding more standard CPs, or– Tuning z/OS partitions to reduce CP resource they need
Also recommended a z/OS expert look at RMF reports to see how else the CP constraint was impacting z/OS function

IBM Systems and Technology Group
© 2007 IBM Corporation102 10/23/2009
Case Study:Grinch that Stole
Performance
IBM Systems and Technology Group
© 2007 IBM Corporation103 10/23/2009
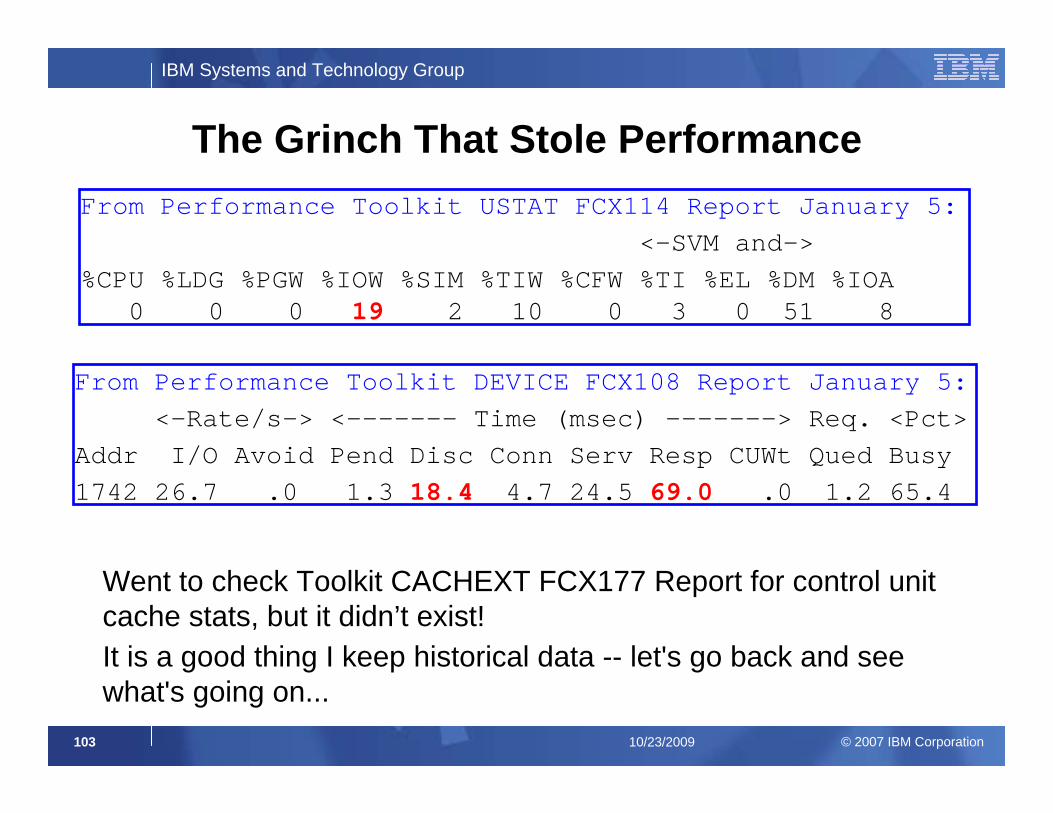
The Grinch That Stole Performance
From Performance Toolkit DEVICE FCX108 Report January 5:<-Rate/s-> <------- Time (msec) -------> Req. <Pct>
Addr I/O Avoid Pend Disc Conn Serv Resp CUWt Qued Busy1742 26.7 .0 1.3 18.4 4.7 24.5 69.0 .0 1.2 65.4
Went to check Toolkit CACHEXT FCX177 Report for control unit cache stats, but it didn’t exist!It is a good thing I keep historical data -- let's go back and see what's going on...
From Performance Toolkit USTAT FCX114 Report January 5:<-SVM and->
%CPU %LDG %PGW %IOW %SIM %TIW %CFW %TI %EL %DM %IOA0 0 0 19 2 10 0 3 0 51 8

IBM Systems and Technology Group
© 2007 IBM Corporation104 10/23/2009
When Did We Last See Cache?
From Performance Toolkit DEVICE FCX108 Report:<-Rate/s-> <------- Time (msec) -------> Req. <Pct>
Addr I/O Avoid Pend Disc Conn Serv Resp CUWt Qued BusyDec8 41.0 .0 0.3 0.2 2.0 2.6 2.9 .0 .0 10.5Jan5 26.7 .0 1.3 18.4 4.7 24.5 69.0 .0 1.2 65.4
From Performance Toolkit CACHEXT FCX177 Dec. 8th Report:<--------- Rate/s ----------> <------Percent---------->Total Total Read Read Write <------ Hits ------>Cache SCMBK N-Seq Seq FW Read Tot RdHt Wrt DFW CFW53.0 41.0 52.3 0 0.6 99 99 99 96 96 ..
IBM Systems and Technology Group
© 2007 IBM Corporation105 10/23/2009
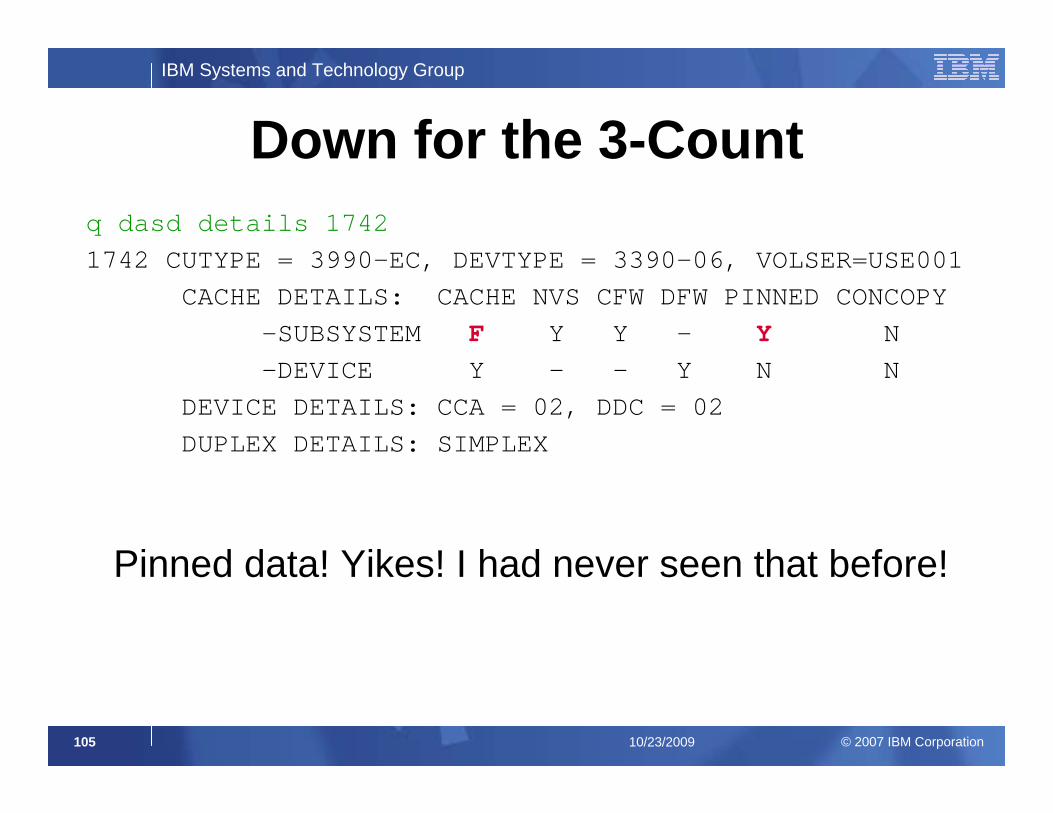
Down for the 3-Countq dasd details 1742 1742 CUTYPE = 3990-EC, DEVTYPE = 3390-06, VOLSER=USE001
CACHE DETAILS: CACHE NVS CFW DFW PINNED CONCOPY -SUBSYSTEM F Y Y - Y N-DEVICE Y - - Y N N
DEVICE DETAILS: CCA = 02, DDC = 02 DUPLEX DETAILS: SIMPLEX
Pinned data! Yikes! I had never seen that before!
IBM Systems and Technology Group
© 2007 IBM Corporation106 10/23/2009
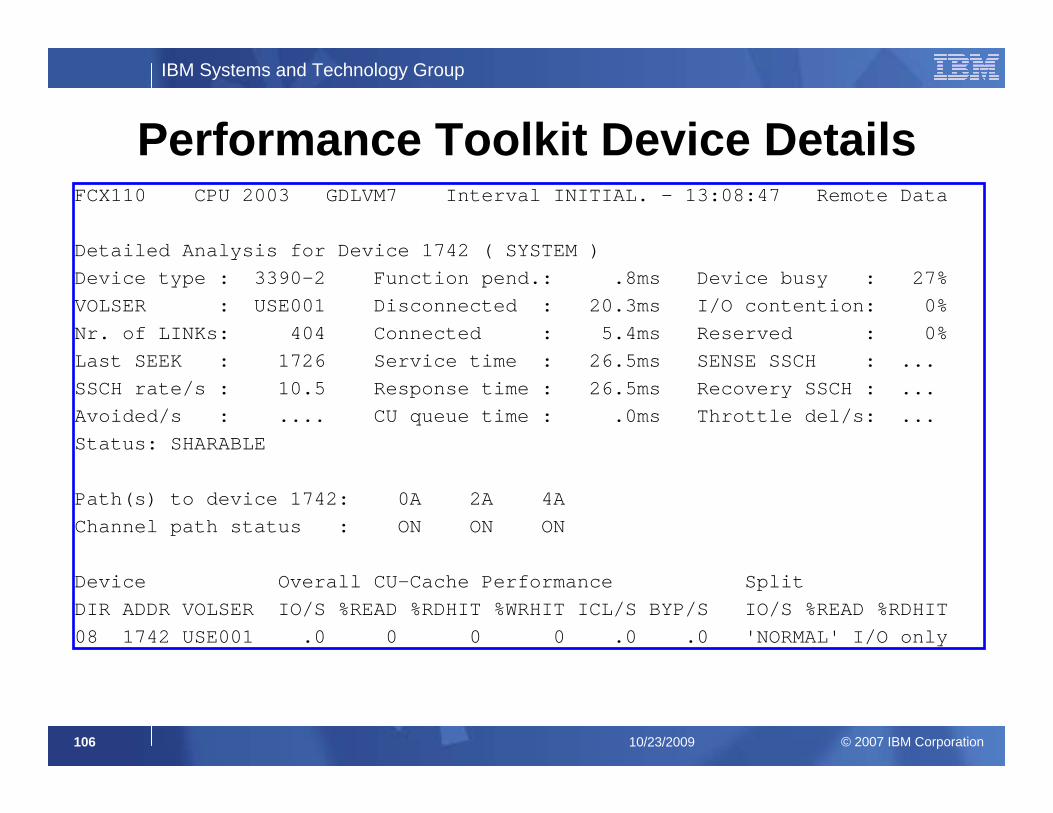
Performance Toolkit Device DetailsFCX110 CPU 2003 GDLVM7 Interval INITIAL. - 13:08:47 Remote Data
Detailed Analysis for Device 1742 ( SYSTEM ) Device type : 3390-2 Function pend.: .8ms Device busy : 27%VOLSER : USE001 Disconnected : 20.3ms I/O contention: 0%Nr. of LINKs: 404 Connected : 5.4ms Reserved : 0%Last SEEK : 1726 Service time : 26.5ms SENSE SSCH : ... SSCH rate/s : 10.5 Response time : 26.5ms Recovery SSCH : ... Avoided/s : .... CU queue time : .0ms Throttle del/s: ... Status: SHARABLE
Path(s) to device 1742: 0A 2A 4A Channel path status : ON ON ON
Device Overall CU-Cache Performance Split DIR ADDR VOLSER IO/S %READ %RDHIT %WRHIT ICL/S BYP/S IO/S %READ %RDHIT 08 1742 USE001 .0 0 0 0 .0 .0 'NORMAL' I/O only
IBM Systems and Technology Group
© 2007 IBM Corporation107 10/23/2009
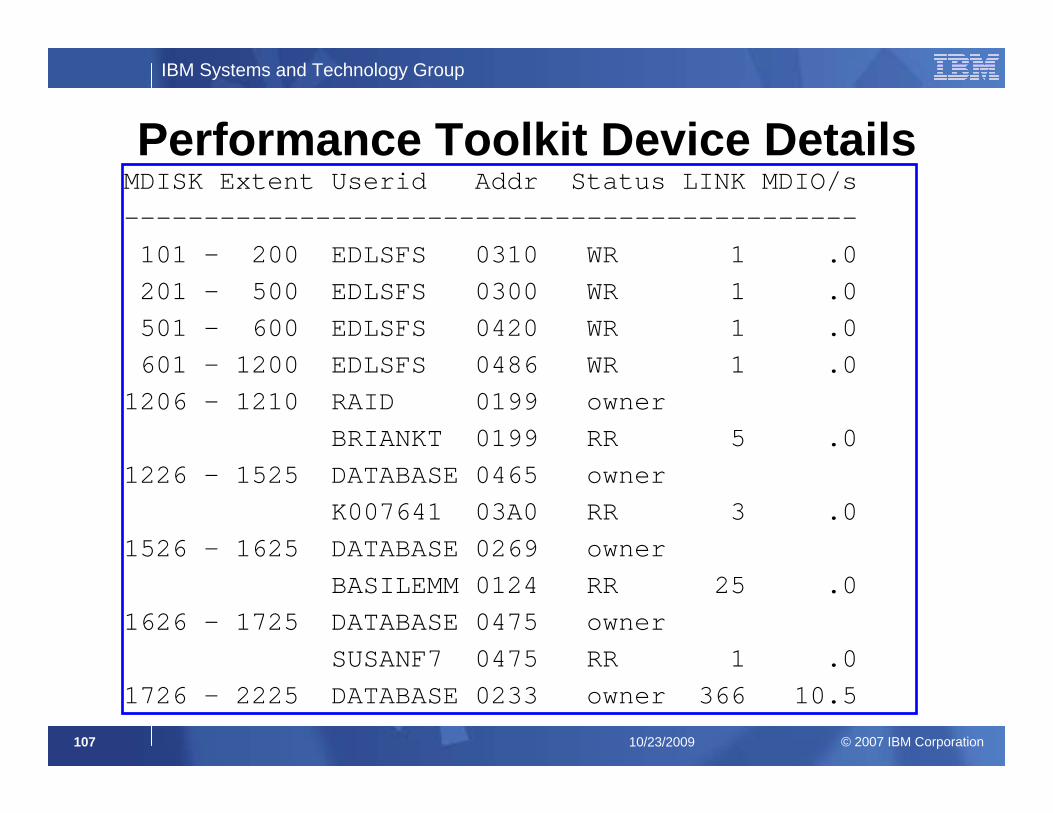
Performance Toolkit Device DetailsMDISK Extent Userid Addr Status LINK MDIO/s----------------------------------------------101 - 200 EDLSFS 0310 WR 1 .0201 - 500 EDLSFS 0300 WR 1 .0501 - 600 EDLSFS 0420 WR 1 .0601 - 1200 EDLSFS 0486 WR 1 .0
1206 - 1210 RAID 0199 owner BRIANKT 0199 RR 5 .0
1226 - 1525 DATABASE 0465 owner K007641 03A0 RR 3 .0
1526 - 1625 DATABASE 0269 owner BASILEMM 0124 RR 25 .0
1626 - 1725 DATABASE 0475 owner SUSANF7 0475 RR 1 .0
1726 - 2225 DATABASE 0233 owner 366 10.5
IBM Systems and Technology Group
© 2007 IBM Corporation108 10/23/2009
Solution
Use Q PINNED CP command to check for what data is pinned.Discussion with Storage Management team.Moved data off string until corrected.
Pinned data is very rare, but when it happens it is serious.