voice ui v3 - dsp concepts · mand—often known as voice user interface, or voice ui—an in ......
TRANSCRIPT

The runaway success of the Amazon Echo and Echo Dot smart speakers, ofwhich 10 million are expected to ship in 2017 alone, has made voice com-mand—often known as voice user interface, or voice UI—an in-demand fea-ture in new tech products. The feature is already included in everysmartphone and tablet, in most new automobiles, and in a fast-growing num-ber of audio products. It’s not unreasonable to expect that eventually, mosthome appliances, audio and video products, and even wearables such asfitness trackers, will feature voice command.
“The better the ratio of desired signal(the user’s voice) to noise (any othersounds), the more reliably a voice UIsystem will work.”Now that millions of voice UI productsare out in the field, we can start tosee what consumers will expect ofthese devices—and how challengingit will be to meet those expectations.The limited success of previous, moreprimitive voice command productssuggests that beyond learning a trig-ger word, such as “Alexa” or “OKGoogle,” consumers are unwilling toadapt their behavior to the require-ments that a more primitive voicecommand product may place onthem, such as pushing a button towake the device up, or speaking di-rectly into a remote control. In thehome, at least, consumers expect avoice UI product to respond to com-mands spoken from across a room,and if possible, even from a differentroom. They expect dependable voicerecognition no matter what the acous-tical properties of a room, and nomatter where the product is placed in
the room. And they expect voice UI towork even in the presence of moder-ately loud environmental noise.
Although sophisticated voice recogni-tion systems rely on Internet-basedcomputing power, much of the perfor-mance of a voice UI system dependson the quality of the voice signal thatthe system receives. The old maxim“garbage in, garbage out” applies asmuch to these systems as it does toany other technology. The better theratio of desired signal (the user’svoice) to noise (any other sounds),the more reliably a voice UI systemwill work.
Voice UI systems receive their com-mands using multiple microphones,usually arranged into arrays con-trolled through digital signal process-ing. Much of the accuracy of a voicerecognition system depends on the
Voice UI–or voice user inter-face–features found in the Am-
azon Echo and Google Homehave captured the attention of
consumers. This paper outlinesthe basic concerns product de-
velopers face when creating andoptimizing voice UI products;examines ways of measuring
and evaluating them; and rec-ommends best practices in
voice UI systems engineering.
FUNDAMENTALS OF VOICE UI
1800 Wyatt Dr. • Suite 14Santa Clara, CA 95054
408-747-5200
www.dspconcepts.com

ability of these arrays to focus on the user’s voice andreject unwanted stimuli, such as environmental noise orsounds emanating from the device itself. Most of the re-search into optimizing these arrays and the algorithmsthat control them is closely held by the companies thathave pioneered these products, leaving product develop-ers with few, if any, references that can help them makeinformed design tradeoffs.
Complicating matters is the unfamiliarity of microphonearray design. Although countless engineers possess ex-pertise in loudspeaker design and applications, far fewerhave comparable experience with microphones—andwhile most engineers’ ears can usually give them at leasta rough idea of what’s wrong with a speaker, it’s muchmore difficult to assess microphone performance prob-lems. The challenge becomes increasingly complex whenthe number of microphones is multiplied for an array. Nowthe engineer must determine which types of microphoneswill work best for the array, what number of microphonesto use, and in what physical configuration to place them.
A processing algorithm is then needed to allow the arrayto identify the direction of the user’s voice and focus onthat voice while rejecting other sounds. Many such algo-rithms are available, and all must be optimized for theperformance of the microphones, the size and configura-tion of the array, and the acoustical effects of the enclo-sure in which they are mounted.
The goal of this paper and the follow-up paper, “Optimiz-ing Performance of Mic Arrays and Voice UI Systems,”will be to address each of these variables, using data toshow the effects of the various design choices, and togive product design engineers the information they needto make the most appropriate choices for their application.This paper will start by explaining the basics of micro-phone arrays and voice UI algorithm functions.
Microphones Used in Voice UI
Almost all of the microphones used in voice UI productsare monophonic MEMS (Micro Electrical Mechanical Sys-tems) types. MEMS microphones offer numerous advan-tages in the design of microphone arrays for voice UIproducts:
Compact size: MEMS microphones are typically no larg-er than 5mm on each side, making it possible to fit asmany as seven mics inside a small product form factor.Surface-mount design further reduces their footprint.
Low cost: As the number of microphones in a productmultiplies, cost can become an important consideration.MEMS mics are manufactured with the methods used forintegrated circuits, so they tend to be inexpensive. Theycan also interface directly with processors that have PDM(Pulse Digital Modulation) ports, without needing costlyA/D converters.
Consistency: Predictable functionality of a microphonearray demands that the mics within the array be wellmatched. Because MEMS microphones are manufacturedusing a completely automated process much like thatused to manufacture ICs, unit-to-unit consistency is typi-cally good.
Most of the microphones used in voice UI products areomnidirectional, receiving sound equally from all direc-tions. Because the directionality of a microphone array iscreated through an algorithm rather than through inherentdirectionality of the microphones, using omnidirectionalmicrophones allows the algorithm full flexibility in the wayit processes the various mic signals to create directionalpickup beams.
Fundamentals of Voice UI | page 2

Another benefit of omni microphones is that they have flat-ter frequency response than directional (cardioid) mics. Thischaracteristic reduces the processing load on the algorithm,and thus orientation of omni mics in product assembly is notcritical.
Within the available selection of MEMS microphones, themic array designer can select from a range of capabilitiesand qualities, including sensitivity, noise, frequency re-sponse matching, and digital and analog output. Some ofthese characteristics will be addressed in the follow-up tothis white paper, “Optimizing Performance of Mic Arraysand Voice UI Systems.”
Components of a Voice UI Algorithm
The algorithm that makes a voice UI product possible is ac-tually a collection of several algorithms, each with a specificfunction that helps the microphone array to focus on a us-er’s voice and ignore unwanted sounds. Here is a brief de-scription of the algorithms typically used in voice UI.
Trigger/Wake WordA voice UI system uses an assigned trigger word—such as“Alexa” or “OK Google”—that the user employs to activatethe voice UI device. Recognizing this trigger word presentschallenges because the device must do the recognition im-mediately, using its own algorithm on device; using Internetresources would create too much delay. The device mustalways be active to some degree because it must constant-ly listen for the trigger word.
Choosing an appropriate trigger word to incorporate into thealgorithm is critical to recognition of the trigger word andthus the operation of the voice UI device. The trigger wordmust be sufficiently complex to produce a distinctive wave-form at the microphone output that the algorithm can easilydistinguish from normal speech, otherwise the percentageof successful recognition may be unacceptably low. Thetrigger word must not be a word or phrase that will be com-monly used, otherwise the rate of false triggering may beunacceptably high. It also should not be too long, becausethe longer the phrase, the more likely that a consumer willfind using the device cumbersome. Typically, a trigger wordusing three to five syllables is the best choice.
When evaluating the performance of a trigger word algo-rithm, there are two main factors to consider. First, how of-ten does the algorithm indicate a trigger when none ispresent? This is measured as false alarms per hour. Sec-ond, how well does the algorithm correctly detect the triggerphrase in the presence of background noise? This is mea-sured as detection percentage.
Most trigger algorithms come in different sizes. Small algo-rithms take less memory and processing but make moremistakes; large algorithms require more resources butmake fewer mistakes. Models are also tunable, allowingproduct designers to make them stricter (fewer false alarmsbut more difficult to trigger) or more lenient (more falsealarms but easier to trigger). Most product designerschoose stricter tunings, because while customers tend toaccept the need to repeat themselves occasionally whenissuing a command, they are less forgiving of false triggers.
“Choosing an appropriatetrigger word to incorporateinto the algorithm is criticalto recognition of the triggerword and thus the operationof the voice UI device.”False alarms are measured by playing hours of spokencontent and counting how often the algorithm produces afalse trigger. Under this test, the difference in performanceof the different model sizes becomes obvious. Figure 1 onthe next page compares the performance of a small, medi-um and large trigger models for different tuning points.These conditions are challenging, with almost continuousspoken dialog presented to the trigger word algorithm.Achieving fewer than two false triggers per hour underthese conditions is a reasonable goal. The small model isable to achieve this only with the two strictest tunings on thefar-left hand side of the graph. The medium and large mod-els achieve this goal over a wider operating range.
Fundamentals of Voice UI | page 3

.
Figure 1: False alarms per hour tested with small, medium and large algorithm models,with stricter tuning to the left and more lenient tunings to the right.
When measuring the performance of trigger algorithms innoise, our research shows that the main factor determiningtrigger detection rate in the presence of environmentalnoise is the signal-to-noise ratio (SNR) measured at themicrophone. The “signal” represents how loud the person’svoice is at the microphone and the “noise” is the level of thebackground noise. In our testing, we use “babble” noise thatsimulates typical noise and light conversation in a home.Graphs for the three model sizes are shown in Figure 2 onthe next page and all models have been tuned to achievefewer than two false triggers per hour. The X-axis repre-sents the SNR, with higher SNRs (cleaner signals) towardsthe right. The Y-axis is the probability of detection. For the
most part, the algorithms have the same performance with-in 1 or 2 dB.
We should note here that an SNR of 10 dB or so may seemunacceptable when compared with SNR numbers of 80 to120 dB for most audio playback equipment. However, invoice UI applications the user’s voice is often only a few dBlouder than the surrounding noise, and as the chart belowshows, an SNR of 10 to 20 dB can deliver excellent resultsin voice UI applications. Accordingly, a 2 dB increase inSNR can significantly improve voice UI performance, eventhough the same increase would likely be subjectively un-noticeable in audio playback systems.
Fundamentals of Voice UI | page 4
“… a 2 dB increase in SNR can significantly improve voice UIperformance, even though the same increase would likely be
subjectively unnoticeable in audio playback systems.”
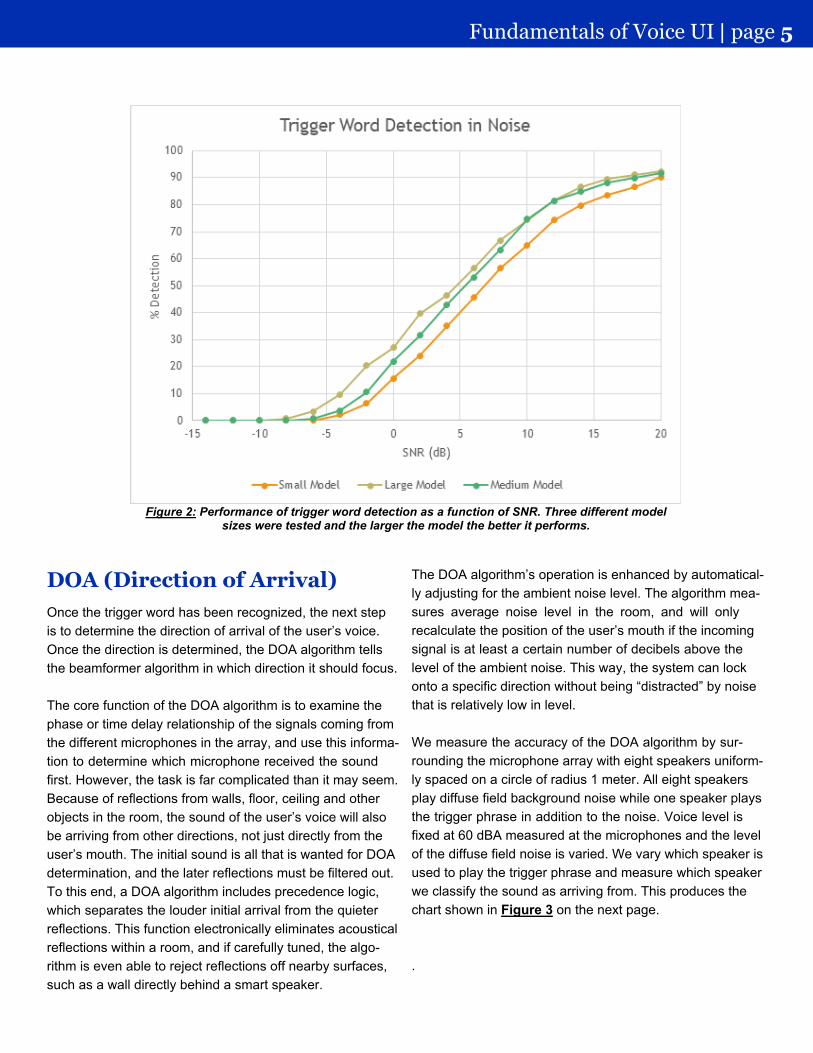
Figure 2: Performance of trigger word detection as a function of SNR. Three different modelsizes were tested and the larger the model the better it performs.
DOA (Direction of Arrival)Once the trigger word has been recognized, the next stepis to determine the direction of arrival of the user’s voice.Once the direction is determined, the DOA algorithm tellsthe beamformer algorithm in which direction it should focus.
The core function of the DOA algorithm is to examine thephase or time delay relationship of the signals coming fromthe different microphones in the array, and use this informa-tion to determine which microphone received the soundfirst. However, the task is far complicated than it may seem.Because of reflections from walls, floor, ceiling and otherobjects in the room, the sound of the user’s voice will alsobe arriving from other directions, not just directly from theuser’s mouth. The initial sound is all that is wanted for DOAdetermination, and the later reflections must be filtered out.To this end, a DOA algorithm includes precedence logic,which separates the louder initial arrival from the quieterreflections. This function electronically eliminates acousticalreflections within a room, and if carefully tuned, the algo-rithm is even able to reject reflections off nearby surfaces,such as a wall directly behind a smart speaker.
The DOA algorithm’s operation is enhanced by automatical-ly adjusting for the ambient noise level. The algorithm mea-sures average noise level in the room, and will onlyrecalculate the position of the user’s mouth if the incomingsignal is at least a certain number of decibels above thelevel of the ambient noise. This way, the system can lockonto a specific direction without being “distracted” by noisethat is relatively low in level.
We measure the accuracy of the DOA algorithm by sur-rounding the microphone array with eight speakers uniform-ly spaced on a circle of radius 1 meter. All eight speakersplay diffuse field background noise while one speaker playsthe trigger phrase in addition to the noise. Voice level isfixed at 60 dBA measured at the microphones and the levelof the diffuse field noise is varied. We vary which speaker isused to play the trigger phrase and measure which speakerwe classify the sound as arriving from. This produces thechart shown in Figure 3 on the next page.
.
Fundamentals of Voice UI | page 5

Figure 3: Confusion matrix showing the results of the direction of arrival tests. The row index correspondsto the actual direction that the sound arrived from; the column index indicates which direction was re-
turned by the DOA algorithm. Ideally, the only non-zero values should be along the diagonal of the matrixrunning from top left to bottom right.
It is more useful to condense a confusion matrix down intoa single number which represents the overall accuracy ofthe algorithm at a specific noise level. In the DOA algorithm,we weight errors based on how far they are from the correctvalue, so the single-number result we use is the error in de-grees at a certain SNR. A result of 0 would be perfect DOA
determination, and a result of 180 (the opposite directionfrom 0 degrees) is equivalent to the algorithm getting themost inaccurate possible result. Figure 4 below shows thatthe DOA algorithm under test here starts to perform reliablyat SNR above 0 dB. From then on, the algorithm performswell with a very small average error.
Figure 4: Consolidated DOA results. The X axis represents the signal-to-noise ratio of the wake word utter-ance. The Y axis is the deviation error in degrees. The DOA algorithm starts to deliver useful performance
at SNR above 0 dB, and accurate performance at SNR is above 5 dB.
Fundamentals of Voice UI | page 6

AEC (Acoustic Echo Canceller)
In a voice UI device that incorporates speakers, such as asmart speaker or car audio system, one source of noisethat interferes with voice commands is the speakers them-selves, which may be playing voice feedback, music, radio,etc. The voice UI device must subtract the sounds itsspeaker produces from the sounds picked up by the mics.
This may seem as simple as blending a phase-reversedversion of the program material into the signals comingfrom the microphones, with a slight delay added to compen-sate for the time it takes for the sound to travel from thespeaker to the microphones. However, this process ismerely the starting point of an AEC algorithm; it is inade-quate to deal with the numerous complications that realworld applications present.
The first complication is that the waveform of the programmaterial is altered by the speaker, by the DSP used toequalize the speaker, and by the microphones used in thearray. Fortunately, it is possible to compare the outputs ofthe microphones with the original (pre-DSP) input signaland calculate correction curves that the algorithm can useto subtract the direct sound from the speaker from thewaveform of the voice command.
However, the program material is also affected by acousti-cal reflections. These reflections may number in the thou-sands, and in a large living room they might arrive at themics as much as 1 second after the direct sound from thespeaker. The spectral content of the reflections will differfrom the content of the direct sound from the speaker, de-
pending on room modes and the absorptive effects of roomfurnishings. These effects will be different in every setting,and will change as people and pets walk around the room,or as the number of occupants in a vehicle changes.
In order to subtract enough of these acoustical echoes fromthe microphone signals to achieve an acceptable SNR, theAEC algorithm must “look for” sounds that match the pro-gram material within a certain margin of error (to compen-sate for changes to the waveform caused by acoustics),and over a defined time window that corresponds to the ex-pected reverberation time. Because of the distances be-tween the microphones in an array, each microphonereceives a slightly different set of echoes and a differentdirect sound from the speaker, so achieving maximum SNRrequires separate AEC processing for each microphone.
The performance of an echo canceller is usually defined byits “echo return loss enhancement,” or ERLE. This is thegain reduction, in dB, that the echo canceller is able to re-duce the speaker signal at the microphone. Echo cancellersshould achieve at least 25 dB of cancellation for good per-formance. The best ones are able to cancel over 30 dB.
The time period over which the AEC looks for reflections iscalled the “echo tail length.” The longer the echo tail length,the more reflections can be canceled and the better the al-gorithm performs. Longer tails, however, require morememory and more processing. Figure 5 below shows theecho return loss as a function of the tail length. This mea-surement was done in a semi-anechoic sound room. Youcan see that most of the cancellation has been achievedwith 200 msec of tail length and longer tails provide onlymarginal improvements.
Fundamentals of Voice UI | page 7
Figure 5: Echo canceller performance as a function of the tail length. This measurement wasdone in a semi-anechoic sound room and it shows that there is little improvement after 200 msec.

A semi-anechoic room is fairly easy to deal with and doesnot represent real-world usage. Figure 6 below shows theperformance of the echo canceller in progressively more
reverberant rooms. The need for longer echo tails is nowobvious and the most reverberant space could benefit froman even longer echo tail.
Figure 6: Echo canceller performance in four rooms with increasing reverberation time.The larger rooms benefit from algorithms using long echo tails.
Fundamentals of Voice UI | page 8
AEC algorithm performance is better when the speaker per-forms in a linear fashion. If the speaker exhibits distortion atloud levels, then distortion components (harmonics) will begenerated and the AEC will not recognize these as reflec-tions of the original program material, and thus cannot can-cel them. The total harmonic distortion (or THD) of aloudspeaker is a measure of its linearity. THD is reported asa percentage of signal level and the lower the THD, themore linearly the speaker behaves. The distortion compo-nents of the loudspeaker will be present in the output of theAEC since the AEC is unable to cancel them.
It is possible to quantify how the distortion will impact theperformance of the AEC. For example, if the loudspeakerhas 1% THD, then the distortion components will be 40 dBlower than the signal level. If the echo canceller has an ER-LE of 30 dB, then a THD of 1% is acceptable. Now considera THD of 10%. In this case, the distortion components are20 dB below the signal level and this will swamp the AEC. A
THD of 3% will generate distortion 30 dB down and this willstill impact the AEC. We recommend a THD less than 2%so as not to impact an AEC with an ERLE of 30 dB.
It is important to measure the THD of the entire system, in-corporating the speaker and the microphones. Simply mea-suring the acoustic output of the speaker is insufficientbecause the plastic enclosures used for many voice UIproducts can conduct vibrations directly from the speaker tothe microphones. Consider the graph shown in Figure 7 onthe next page. This graph shows the THD of a loudspeakermeasured with an external reference microphone. Each linerepresents a different playback level. For each playbacklevel, we record the measured SPL and also the THD atnumerous frequencies across the entire audio spectrum.The circular bubbles on the graph indicate the measuredTHD appear only at levels where THD is above 3%. Thespeaker behaves linearly, and distorts to a significant de-gree only when played at loud levels.
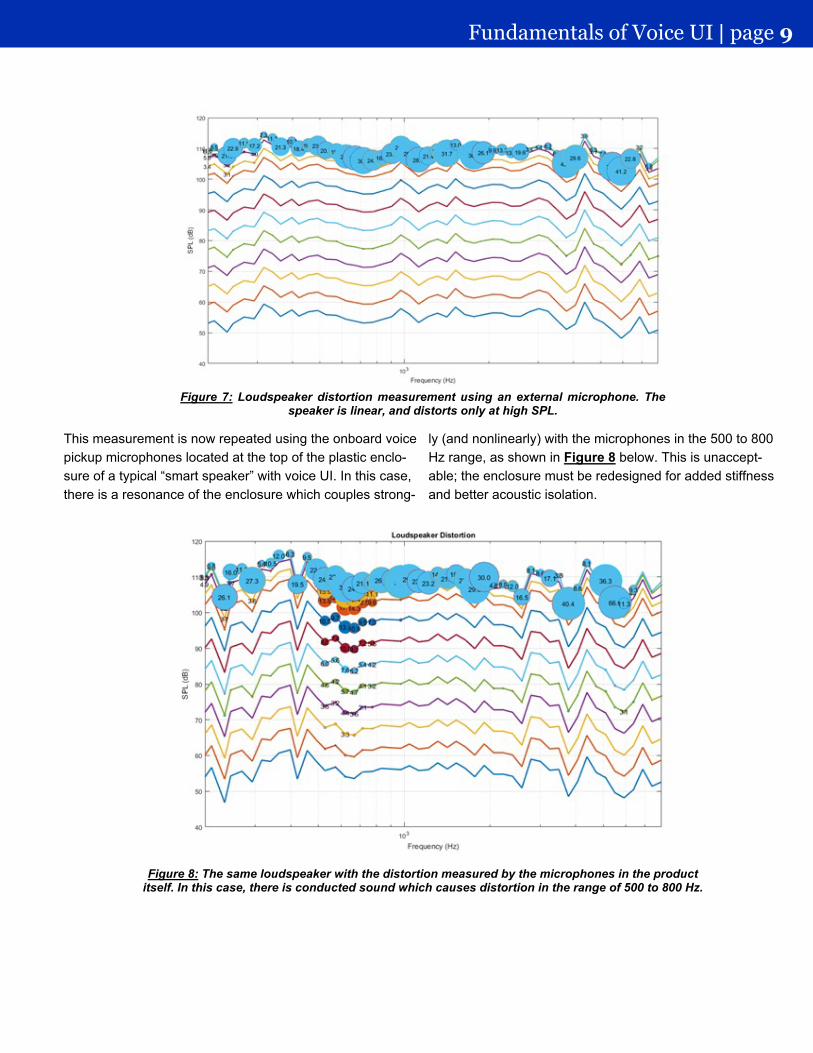
This measurement is now repeated using the onboard voicepickup microphones located at the top of the plastic enclo-sure of a typical “smart speaker” with voice UI. In this case,there is a resonance of the enclosure which couples strong-
ly (and nonlinearly) with the microphones in the 500 to 800Hz range, as shown in Figure 8 below. This is unaccept-able; the enclosure must be redesigned for added stiffnessand better acoustic isolation.
Fundamentals of Voice UI | page 9
Figure 7: Loudspeaker distortion measurement using an external microphone. Thespeaker is linear, and distorts only at high SPL.
Figure 8: The same loudspeaker with the distortion measured by the microphones in the productitself. In this case, there is conducted sound which causes distortion in the range of 500 to 800 Hz.

BeamformingThe reason multiple-microphone arrays are commonly usedin voice UI systems is that having more than one mic allowsthe array to become directional—to focus on sounds com-ing from a particular direction. This process is called beam-forming. It improves SNR because it helps isolate the user’svoice while rejecting sounds from other directions.
For example, if the user is on one side of the microphonearray and an air conditioner is on the other side, the soundfrom the air conditioner arrives first at the microphone oppo-site the user, then arrives a fraction of a second later at themicrophone closest to the user. The beamformer algorithmuses these time differences to null out the air conditionersound while preserving the user’s voice.
The more microphones in an array, the more effectivebeamforming can be. An array with two microphones has alimited ability to cancel sounds, but an array with multiplemicrophones can cancel sounds coming from more direc-tions. The fewer microphones, the more the performancewill vary as the look angle—the angle between the user’svoice and the front axis of the voice UI product—changes.
A beamforming algorithm can optimize SNR by dynamicallyadjusting its performance to suit the conditions. The beamwidth can be tightened to focus better on the user’s voiceand more effectively reject sounds from other directions, butthe voice UI system will then need to evaluate and adjustDOA more frequently to make sure the beam stays focusedon the user. This effort increases demands on the system,so most beamformers maintain a fairly wide beam. For ex-ample, a typical seven-microphone array has a beamwidthof approximately 60 degrees, or ±30 degrees relative toDOA.
The spectrograms in Figure 9 below demonstrate the abilityof beamforming to remove background noise. The top fig-ure shows the spectrogram of a single microphone. Thebottom figure is the output from a seven-microphone beam-former. The horizontal stripes are the harmonics associatedwith the speech signal and the background orange/red coloris babble noise. The ideal result would be clearly definedstripes surrounded by dark regions. In the measurementfrom the beamformer, the speech is preserved and thebackground noise is attenuated by 6 to 7 dB. This providesa noticeable improvement in speech recognition.
Fundamentals of Voice UI | page 10
Figure 9: Spectrogram showing the reduction of background noise that can be achieved by thebeamformer. Dark sections correspond to lower signal levels. The original speech is untouched.

Noise ReductionAlthough microphone array systems use directional pickuppatterns to filter out unwanted sounds (i.e., noise), some ofthese unwanted sounds can be attenuated or eliminatedwith an algorithm that recognizes the characteristics thatseparate them from the desired signal and then removesthe unwanted sounds, much as someone who dislikes lem-on flavor might ignore the yellow candies in a bowl. A noisereduction algorithm can run on a single microphone or anarray, so it can assist with trigger word recognition and alsoimprove voice UI performance after all the other algorithmshave done their jobs. Thus, noise reduction might be usedin multiple stages of a voice UI signal processing chain.
Voice commands are momentary, as opposed to steady-state, events. Any sound that is always present, or that isrepetitive, can be detected and removed from the signalcoming from the microphone array. Examples include roadnoise in automobiles, and dishwasher and HVAC systemnoise in homes. Sounds that are above or below the fre-
quency spectrum of the human voice can also be filteredout of the signal.
Noise reduction algorithms have been commonly used formany years, but most are optimized for cellphone applica-tions rather than voice UI. They tend to highlight the fre-quency spectrum most critical for human comprehension,rather than the frequency spectrum most critical for an elec-tronic system to isolate and understand voice commands.Most noise reduction algorithms that are tuned for cell-phones actually degrade voice UI performance. To put itsimply, humans listen for different things than voice UI sys-tems do.
One measure of how well a noise reduction algorithm worksis to see how many additional dB of signal reduction it pro-vides at the output of the echo canceler. Figure 10 belowshows the performance of DSP Concepts frequency do-main based noise reduction algorithm, reducing residualechoes by up to 12 dB.
Fundamentals of Voice UI | page 11
Figure 10: Effects of a noise reduction algorithm on ERL. The higher the curve, the moreattenuation and thus the better the algorithm performs.

The subjective improvement in sound quality is instantlyrecognized, but will it improve the performance of thespeech recognition algorithm? This requires additional mea-surements to quantify. Figure 11 below reproduces ones ofthe curves from Figure 2 but does it with and without noise
reduction. The noise reduction shifts the curve 2 dB to theleft as compared to the original content. This shows that thenoise reduction algorithm improves overall speech recogni-tion by 2 dB.
Figure 11: Effects of a noise reduction algorithm on ERL. The higher the curve, the moreattenuation and thus the better the algorithm performs.
Fundamentals of Voice UI | page 12
In the next paper …This concludes our discussion of the fundamentals of voiceUI systems. In our next paper, “Optimizing Performance ofMic Arrays and Voice UI Systems,” we will examine the ef-fects of different microphone array configurations and differ-
ent microphone choices. After examining these effects, wewill make specific recommendations that engineers andproduct design teams can employ to get the most reliableperformance from their voice UI product designs.