voltage harmonics measuring issues in medium voltage systems
TRANSCRIPT
3
Voltage Harmonics Measuring Issues in Medium Voltage Systems
Jarosław Łuszcz Gdańsk University of Technology
Poland
1. Introduction
Voltage harmonic distortion level is one of the significant parameters of power quality in power system. Numerous problems related to voltage and current harmonic effects for contemporary power systems are commonly observed nowadays. Levels and spectral content of voltage distortions injected into electric power grids are tending to increase despite the fact that the acceptable levels are determined by numerous regulations. Voltage distortion assessments, especially in middle and high voltage grids, are usually based on measurements in which voltage transformers are commonly used. The transfer ratio of a voltage transformer fed by distorted primary voltage with harmonic components of frequency higher than fundamental can be different for high frequency components in comparison with the fundamental frequency. During the last decades primary problems related to voltage distortions have been usually encountered in frequency range up to 40th harmonic, mostly in LV grids. Nowadays, due to the evident increase of the overall power of nonlinear power electronic loads connected to grid and higher modulation frequencies widely used, distorted voltage propagates deeply into MV grids and goes evidently beyond frequency of 2 kHz. This chapter presents problems of voltage harmonic transfer accuracy through voltage transformers which are usually used for power quality monitoring in medium and high voltage grids (Kadar at al., 1997, Seljeseth at al., 1998, Shibuya at al., 2002, Mahesh at al., 2004, Yao Xiao at al., 2004, Klatt at al., 2010). A simplified lumped parameters circuit model of the voltage transformer is proposed and verified by simulation and experimental investigations. A number voltage transformers typically used in medium voltage grid have been tested in the conducted disturbances frequency range up to 30 MHz. The obtained results prove that broadband voltage transfer function of the voltage transformer usually exhibits various irregularities, especially in high frequency range, which are primarily associated with windings’ parasitic capacitances. Frequency dependant voltage transfer characteristic of voltage transformer induces extra measurement errors which have to be taken into account in order to achieve desired final relatively high accuracy required for power quality monitoring systems.
2. Circuit modelling of voltage transformers
Classical voltage transformer (VT) is a two or three winding transformer with a relatively high transformation ratio and low rated power, intended to supply only measuring inputs
www.intechopen.com
Power Quality Harmonics Analysis and Real Measurements Data
90
of metering apparatus or protection relays extensively used in power system. VT are mostly used in medium voltage (MV) and high voltage (HV) systems for separation of the measuring and protecting circuit from high voltage hazard. Rated primary voltages of VTs, typically used in power system, have to correspond to rated
voltages of MV and HV transmission lines in particular power system. Secondary rated
voltage levels usually used in a typical measuring and protection systems are: 100 V,
100/3 V, 100/3 V what results with transformation ratios of the order from few tenth up to
few hundredths for MV VT and more than thousand for HV VT. Such a high transformation
ratio and low rated power of VT influence significantly its specific parameters, especially
related to performance in wide frequency range.
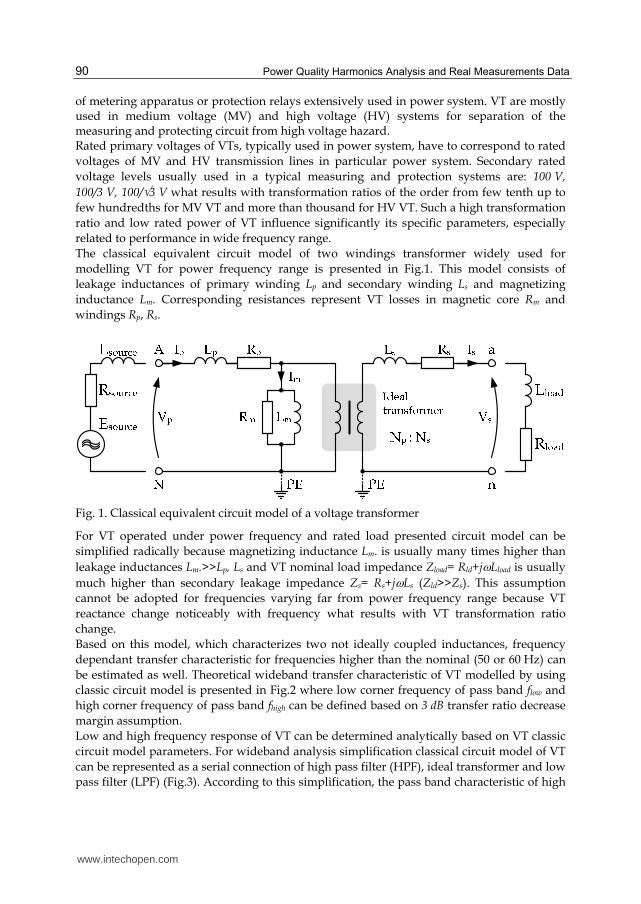
The classical equivalent circuit model of two windings transformer widely used for
modelling VT for power frequency range is presented in Fig.1. This model consists of
leakage inductances of primary winding Lp and secondary winding Ls and magnetizing
inductance Lm. Corresponding resistances represent VT losses in magnetic core Rm and
windings Rp, Rs.
Fig. 1. Classical equivalent circuit model of a voltage transformer
For VT operated under power frequency and rated load presented circuit model can be
simplified radically because magnetizing inductance Lm. is usually many times higher than
leakage inductances Lm.>>Lp, Ls and VT nominal load impedance Zload= Rld+jLload is usually
much higher than secondary leakage impedance Zs= Rs+jLs (Zld>>Zs). This assumption
cannot be adopted for frequencies varying far from power frequency range because VT
reactance change noticeably with frequency what results with VT transformation ratio
change.
Based on this model, which characterizes two not ideally coupled inductances, frequency
dependant transfer characteristic for frequencies higher than the nominal (50 or 60 Hz) can
be estimated as well. Theoretical wideband transfer characteristic of VT modelled by using
classic circuit model is presented in Fig.2 where low corner frequency of pass band flow and
high corner frequency of pass band fhigh can be defined based on 3 dB transfer ratio decrease
margin assumption.
Low and high frequency response of VT can be determined analytically based on VT classic
circuit model parameters. For wideband analysis simplification classical circuit model of VT
can be represented as a serial connection of high pass filter (HPF), ideal transformer and low
pass filter (LPF) (Fig.3). According to this simplification, the pass band characteristic of high
www.intechopen.com

Voltage Harmonics Measuring Issues in Medium Voltage Systems
91
pass LC filter is mainly correlated to VT primary side parameters (RHPF, LHPF) and the pass
band characteristic of low pass LC filter is mainly correlated to parameters of secondary side
(RLPF, LLPF).
Fig. 2. Theoretical transfer ratio wideband characteristic of VT modelled by classical circuit model
Fig. 3. High pass and low pas filter representation of VT circuit model
Based on this assumption the low corner frequency flow of VT transfer characteristic can be easily defined by formula (1) and high corner frequency fhigh by formula (2).
2
HPFlow HPF
HPF
Rf f
L (1)
2
LPFhigh LPF
LPF
Rf f
L (2)
www.intechopen.com
Power Quality Harmonics Analysis and Real Measurements Data
92
Wideband analysis of VT transfer characteristic requires taking into account also external
impedances of measured voltage source and VT load. Therefore, equivalent resistance of
high pass filter RHPF can be defined as a sum of VT primary winding resistance and primary
voltage source resistance Rsource (3). Respectively high pass filter equivalent inductance LHPF
is a sum of VT magnetizing inductance Lm, primary winding leakage inductance Lp and
primary voltage source inductance Lsource (4).
HPF p sourceR R R (3)
HPF p m sourceL L L L (4)
Analogous equivalent parameters for LPF are as follows:
2 2LPF p s loadR R R R (5)
2 2LPF p s loadL L L L (6)
For RL type low and high pass filters 3 dB pass band margin is obtained for the frequency at
which magnitudes of filter resistance R is equal to magnitude of filter reactance XL=2fL.
According to this formula, the corner frequency of low pass equivalent filter fLPF determines
the lowest signal frequency flow transformed by VT (7) and the corner frequency of high pass
equivalent filter fHPF determines the highest signal frequency fhigh transformed by VT (8),
where =NP/NS is a VT winding ratio.
2
p sourcelow
p m source
R Rf
L L L (7)
2 2
2 22
p s loadhigh
p s load
R R Rf
L L L
(8)
Assuming that magnetizing inductance Lm of a typical VT is much higher than leakage
inductance Lm of primary winding (Lm>> Lp) and also much higher than primary voltage
source inductance (Lm>> Lsource) the equation (7) can be simplified to (9). Similarly, because
resistance of secondary winding Rs is usually much lower than load resistance Rload (Rs <<
Rload) the equation (8) can be simplified to (10).
2
p sourcelow
m
R Rf
L (9)
2
2 22
loadhigh
p s load
Rf
L L L
(10)
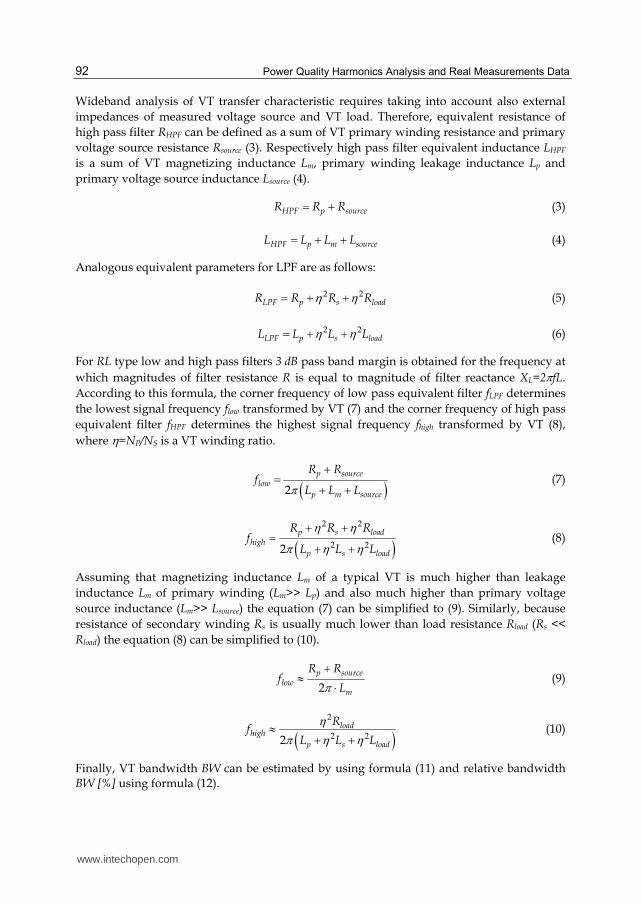
Finally, VT bandwidth BW can be estimated by using formula (11) and relative bandwidth BW [%] using formula (12).
www.intechopen.com
Voltage Harmonics Measuring Issues in Medium Voltage Systems
93
2
2 2
p sourceLoadhigh low
mp s Load
R RRBW f f
LL L L
(11)
2 2 2
2 2 2% 2 2
m load p s Load p sourcehigh low
high low m load p s Load p source
L R L L L R Rf fBW
f f L R L L L R R
(12)
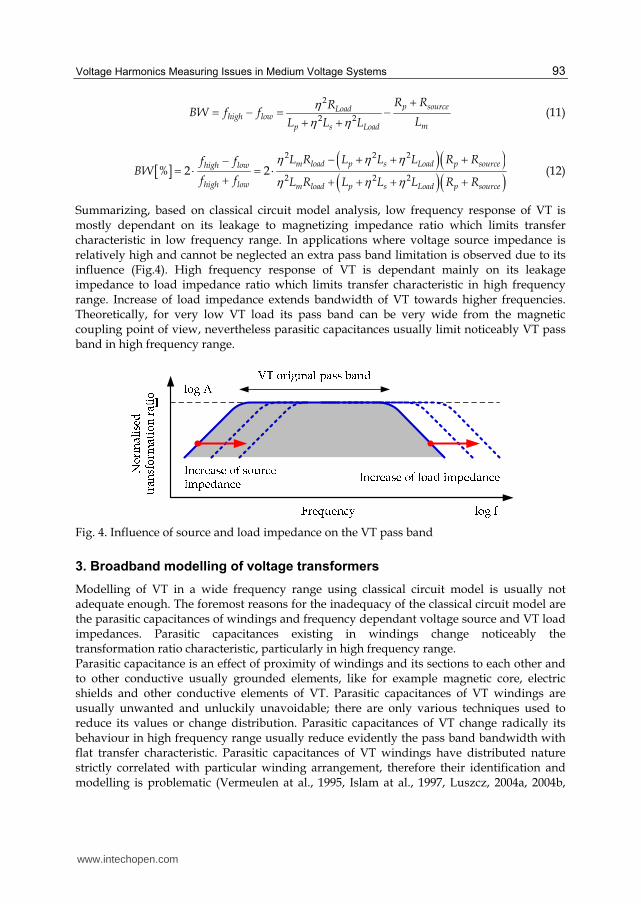
Summarizing, based on classical circuit model analysis, low frequency response of VT is mostly dependant on its leakage to magnetizing impedance ratio which limits transfer characteristic in low frequency range. In applications where voltage source impedance is relatively high and cannot be neglected an extra pass band limitation is observed due to its influence (Fig.4). High frequency response of VT is dependant mainly on its leakage impedance to load impedance ratio which limits transfer characteristic in high frequency range. Increase of load impedance extends bandwidth of VT towards higher frequencies. Theoretically, for very low VT load its pass band can be very wide from the magnetic coupling point of view, nevertheless parasitic capacitances usually limit noticeably VT pass band in high frequency range.
Fig. 4. Influence of source and load impedance on the VT pass band
3. Broadband modelling of voltage transformers
Modelling of VT in a wide frequency range using classical circuit model is usually not adequate enough. The foremost reasons for the inadequacy of the classical circuit model are the parasitic capacitances of windings and frequency dependant voltage source and VT load impedances. Parasitic capacitances existing in windings change noticeably the transformation ratio characteristic, particularly in high frequency range. Parasitic capacitance is an effect of proximity of windings and its sections to each other and to other conductive usually grounded elements, like for example magnetic core, electric shields and other conductive elements of VT. Parasitic capacitances of VT windings are usually unwanted and unluckily unavoidable; there are only various techniques used to reduce its values or change distribution. Parasitic capacitances of VT change radically its behaviour in high frequency range usually reduce evidently the pass band bandwidth with flat transfer characteristic. Parasitic capacitances of VT windings have distributed nature strictly correlated with particular winding arrangement, therefore their identification and modelling is problematic (Vermeulen at al., 1995, Islam at al., 1997, Luszcz, 2004a, 2004b,
www.intechopen.com
Power Quality Harmonics Analysis and Real Measurements Data
94
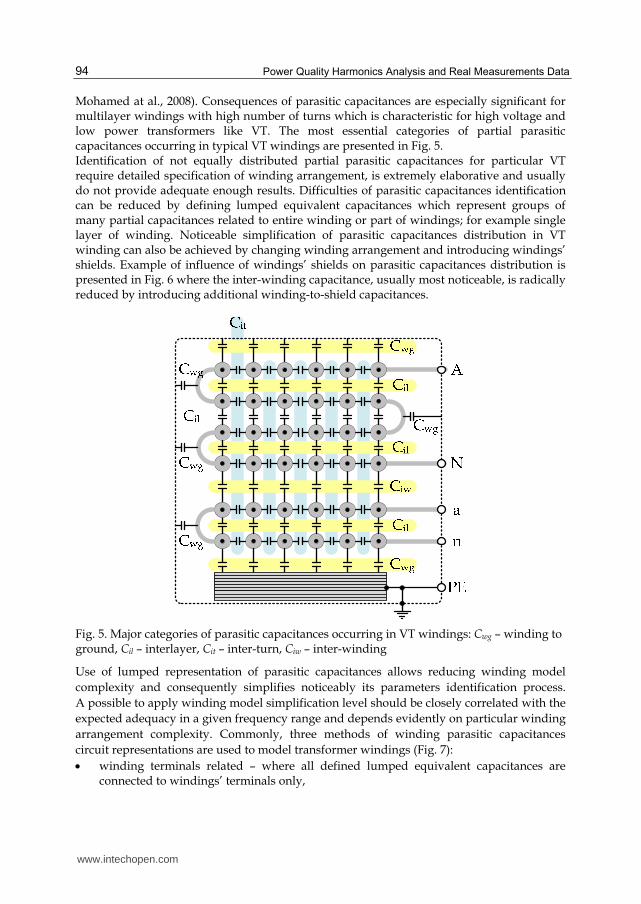
Mohamed at al., 2008). Consequences of parasitic capacitances are especially significant for multilayer windings with high number of turns which is characteristic for high voltage and low power transformers like VT. The most essential categories of partial parasitic capacitances occurring in typical VT windings are presented in Fig. 5. Identification of not equally distributed partial parasitic capacitances for particular VT require detailed specification of winding arrangement, is extremely elaborative and usually do not provide adequate enough results. Difficulties of parasitic capacitances identification can be reduced by defining lumped equivalent capacitances which represent groups of many partial capacitances related to entire winding or part of windings; for example single layer of winding. Noticeable simplification of parasitic capacitances distribution in VT winding can also be achieved by changing winding arrangement and introducing windings’ shields. Example of influence of windings’ shields on parasitic capacitances distribution is presented in Fig. 6 where the inter-winding capacitance, usually most noticeable, is radically reduced by introducing additional winding-to-shield capacitances.
Fig. 5. Major categories of parasitic capacitances occurring in VT windings: Cwg – winding to ground, Cil – interlayer, Cit – inter-turn, Ciw – inter-winding
Use of lumped representation of parasitic capacitances allows reducing winding model
complexity and consequently simplifies noticeably its parameters identification process.
A possible to apply winding model simplification level should be closely correlated with the
expected adequacy in a given frequency range and depends evidently on particular winding
arrangement complexity. Commonly, three methods of winding parasitic capacitances
circuit representations are used to model transformer windings (Fig. 7):
winding terminals related – where all defined lumped equivalent capacitances are connected to windings’ terminals only,
www.intechopen.com

Voltage Harmonics Measuring Issues in Medium Voltage Systems
95
partially distributed – lumped parasitic capacitances are specified for most representative internal parts of winding, like for example windings layers, winding shields,
fully distributed – windings are modelled as a series and parallel combination of inductances and capacitances which form ladder circuit with irregular parameter distribution.
Generally more detailed parasitic capacitances representation allows obtaining higher level
of model adequacy in wider frequency range. Nevertheless because of identification
problems the model complexity should be kept within a reasonable level to allow achieving
high usefulness.
Fig. 6. Parasitic capacitances arrangement in shielded VT windings
Fig. 7. Typical circuit representations of winding parasitic capacitances
www.intechopen.com
Power Quality Harmonics Analysis and Real Measurements Data
96
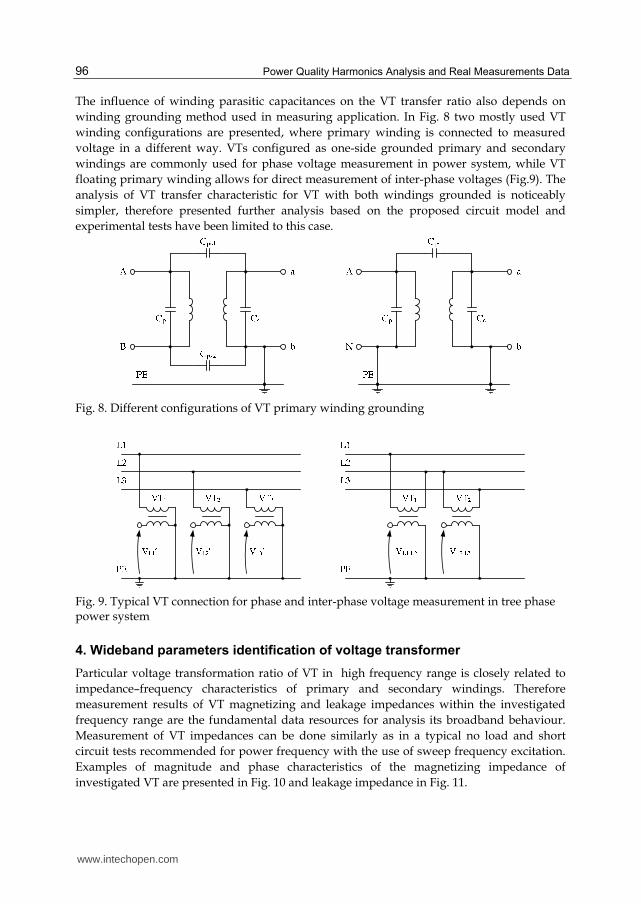
The influence of winding parasitic capacitances on the VT transfer ratio also depends on
winding grounding method used in measuring application. In Fig. 8 two mostly used VT
winding configurations are presented, where primary winding is connected to measured
voltage in a different way. VTs configured as one-side grounded primary and secondary
windings are commonly used for phase voltage measurement in power system, while VT
floating primary winding allows for direct measurement of inter-phase voltages (Fig.9). The
analysis of VT transfer characteristic for VT with both windings grounded is noticeably
simpler, therefore presented further analysis based on the proposed circuit model and
experimental tests have been limited to this case.
Fig. 8. Different configurations of VT primary winding grounding
Fig. 9. Typical VT connection for phase and inter-phase voltage measurement in tree phase power system
4. Wideband parameters identification of voltage transformer
Particular voltage transformation ratio of VT in high frequency range is closely related to
impedance–frequency characteristics of primary and secondary windings. Therefore
measurement results of VT magnetizing and leakage impedances within the investigated
frequency range are the fundamental data resources for analysis its broadband behaviour.
Measurement of VT impedances can be done similarly as in a typical no load and short
circuit tests recommended for power frequency with the use of sweep frequency excitation.
Examples of magnitude and phase characteristics of the magnetizing impedance of
investigated VT are presented in Fig. 10 and leakage impedance in Fig. 11.
www.intechopen.com

Voltage Harmonics Measuring Issues in Medium Voltage Systems
97
Concise analysis of the exemplary magnetizing and leakage impedance characteristics allow
estimating characteristic frequency ranges correlated with the VT different performance.
Firstly, measured impedances exhibit characteristic serial resonances which appear in
frequency range around fr1≈150 Hz and around fr2≈200 kHz for magnetizing and leakage
impedances respectively. On the magnetizing impedance characteristic, between these two
frequencies fr1 and fr2, serial resonance is clearly visible for the frequency range around
fr3≈2 kHz. These three particular resonance frequencies fr1, fr2, fr3 divide the frequency
spectrum into three sub-ranges closely related to VT behaviour. Secondly, in the frequency
range between around 3 kHz and 20 kHz several less meaningful resonances can be observed
which are correlated with local resonances appearing in winding internal subsections.
10 100 1k 10k 100k 1M 10M 30M-90
-45
0
45
90
100m
1
10
100
1k
10k
Imp
edan
ce (
Deg
ree)
Frequency (Hz)
Imp
edan
ce (
Ab
solu
t) ()
Fig. 10. Measured magnetizing impedance-frequency characteristics of investigated VT
10 100 1k 10k 100k 1M 10M-90
-45
0
45
100m
1
10
100
1k
10k
Imp
edan
ce (
Deg
ree)
Frequency (Hz)
Imp
edan
ce (
abso
lut)
()
Fig. 11. Measured leakage impedance-frequency characteristics of investigated VT
www.intechopen.com
Power Quality Harmonics Analysis and Real Measurements Data
98
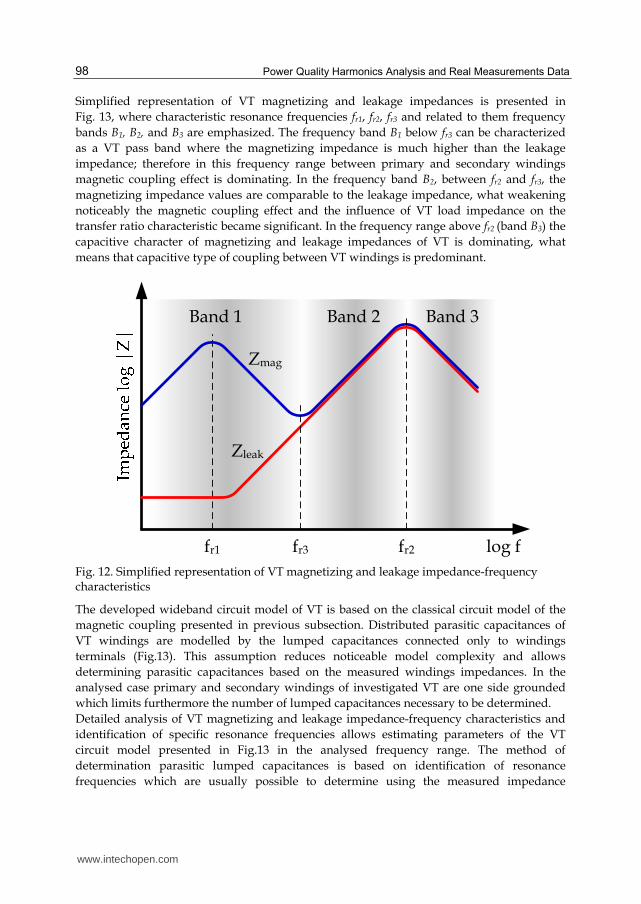
Simplified representation of VT magnetizing and leakage impedances is presented in
Fig. 13, where characteristic resonance frequencies fr1, fr2, fr3 and related to them frequency
bands B1, B2, and B3 are emphasized. The frequency band B1 below fr3 can be characterized
as a VT pass band where the magnetizing impedance is much higher than the leakage
impedance; therefore in this frequency range between primary and secondary windings
magnetic coupling effect is dominating. In the frequency band B2, between fr2 and fr3, the
magnetizing impedance values are comparable to the leakage impedance, what weakening
noticeably the magnetic coupling effect and the influence of VT load impedance on the
transfer ratio characteristic became significant. In the frequency range above fr2 (band B3) the
capacitive character of magnetizing and leakage impedances of VT is dominating, what
means that capacitive type of coupling between VT windings is predominant.
log ffr1 fr3
Band 1 Band 2 Band 3
fr2
Zleak
Zmag
Fig. 12. Simplified representation of VT magnetizing and leakage impedance-frequency characteristics
The developed wideband circuit model of VT is based on the classical circuit model of the
magnetic coupling presented in previous subsection. Distributed parasitic capacitances of
VT windings are modelled by the lumped capacitances connected only to windings
terminals (Fig.13). This assumption reduces noticeable model complexity and allows
determining parasitic capacitances based on the measured windings impedances. In the
analysed case primary and secondary windings of investigated VT are one side grounded
which limits furthermore the number of lumped capacitances necessary to be determined.
Detailed analysis of VT magnetizing and leakage impedance-frequency characteristics and
identification of specific resonance frequencies allows estimating parameters of the VT
circuit model presented in Fig.13 in the analysed frequency range. The method of
determination parasitic lumped capacitances is based on identification of resonance
frequencies which are usually possible to determine using the measured impedance
www.intechopen.com
Voltage Harmonics Measuring Issues in Medium Voltage Systems
99
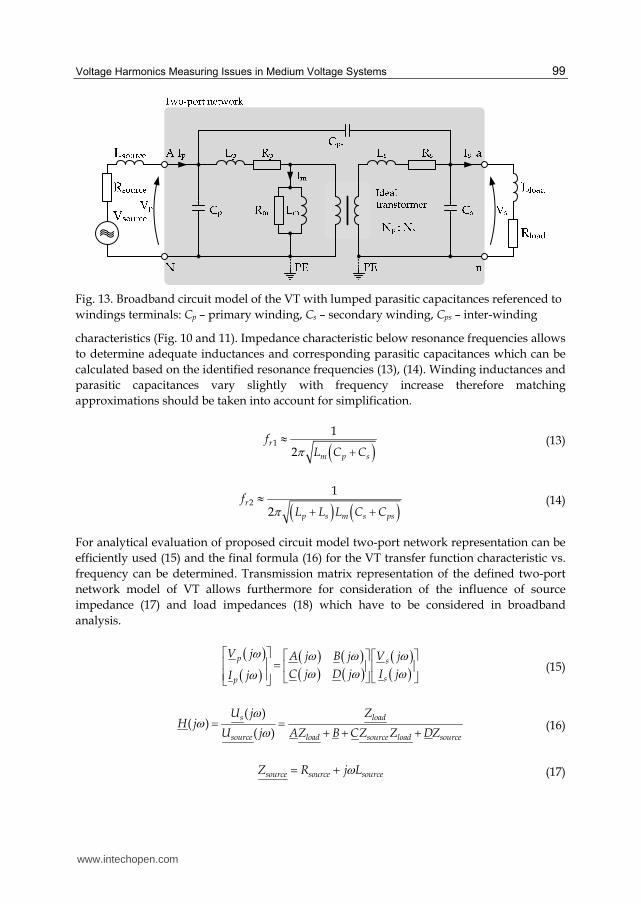
Fig. 13. Broadband circuit model of the VT with lumped parasitic capacitances referenced to
windings terminals: Cp – primary winding, Cs – secondary winding, Cps – inter-winding
characteristics (Fig. 10 and 11). Impedance characteristic below resonance frequencies allows
to determine adequate inductances and corresponding parasitic capacitances which can be
calculated based on the identified resonance frequencies (13), (14). Winding inductances and
parasitic capacitances vary slightly with frequency increase therefore matching
approximations should be taken into account for simplification.
1
1
2r
m p s
fL C C (13)
2
1
2r
p s m s ps
fL L L C C (14)
For analytical evaluation of proposed circuit model two-port network representation can be
efficiently used (15) and the final formula (16) for the VT transfer function characteristic vs.
frequency can be determined. Transmission matrix representation of the defined two-port
network model of VT allows furthermore for consideration of the influence of source
impedance (17) and load impedances (18) which have to be considered in broadband
analysis.
p s
sp
V j A j B j V j
C j D j I jI j
(15)
( )
( )( )
s load
source load source load source
U j ZH j
U j AZ B CZ Z DZ
(16)
source source sourceZ R j L (17)
www.intechopen.com

Power Quality Harmonics Analysis and Real Measurements Data
100
load load loadZ R j L (18)
The A,B, C and D coefficients of transmission matrix T (19) can be used for fully charactering
electrical performance of the VT in any external condition and its frequency characteristics
can be defined by measurement for a specific load condition. Based on the relationship
resulting from (15); A(j) is a complex voltage transfer function at no load (20), B(j) is a
complex transfer impedance with the secondary winding shorted (21), C(j) is a complex
transfer admittance at no load (22), D(j) is a complex current transfer function with the
secondary winding shorted (23).
A j B j
TC j D j
(19)
0
( )( )
( )s
p
sI
V jA j
V j
(20)
0
( )( )
( )s
p
sV
V jB j
I j
(21)
0
( )( )
( )s
p
sI
I jC j
V j
(22)
0
( )( )
( )s
p
sV
I jD j
I j
(23)
5. Simulation investigation of voltage transformer circuit model
The investigated circuit model of VT can be examined by simulation in any PSpice
compatible environment in the conducted disturbance propagation frequency range up to
30 MHz. The essential verification of VT model adequacy has been done by determining
magnetizing and leakage impedance characteristics which allows verifying model
representation adequacy of magnetic coupling between windings. Obtained impedance
characteristics are presented in Fig.14 and should be compared to the corresponding
measurement results presented in Fig.10 and Fig.11.
Obtained simulation results confirm generally broad-spectrum impedance variations within
few dB accuracy margin but many greater than few dB discrepancies can be observed
especially close to the resonance frequencies and in frequency range above a few kHz. It
should be underlined that the expected compliance level cannot be too high because of
many simplifications implemented in the model. The most significant limitation of the
evaluated circuit model is associated with lumped representation of winding parasitic
capacitances with relation to windings terminals only.
www.intechopen.com

Voltage Harmonics Measuring Issues in Medium Voltage Systems
101
10 100 1k 10k 100k 1M 10M 30M100m
1
10
100
1k
10k
Mo
du
lus
of
imp
edan
ce []
Frequency (Hz)
Z mag
Z leak
Fig. 14. Magnetizing and leakage impedances of the evaluated VT calculated using developed circuit model
Despite the relatively low accuracy, the developed VT circuit model can be used for simulation analysis of the influence of the VT parameters and its load on the voltage transfer ratio frequency characteristic. The exemplary simulation results of VT voltage transfer ratio characteristics calculated for different resistive loads are presented in Fig. 15. Based on the presented simulation results it can be noticed that the VT voltage transfer characteristic change essentially for frequencies higher than the main resonance frequency observed on the leakage impedance, which is about 100 kHz for the evaluated case. Above this frequency VT voltage transfer ratio depends mainly on winding parasitic capacitances and magnetic coupling between windings becames less meaningful. Simulation results demonstrate that in frequency range close to leakage impedance
resonance VT load has the major influence on the VT transfer characteristic. Increase of
resistive VT load reduces significantly VT voltage transfer ratio around this frequency.
Obtained simulation results confirm that according to the analytical investigation Eq. (8), VT
load rate has significant influence on VT performance in high frequency range and limits
usually its pass band. According to the presented simulated transfer characteristics it is
possible to expand the pass band width by lowering the VT load. Unfortunately, low VT
load can intensify adverse effects of any resonances which might arise in VT.
VT load character, capacitive or inductive, has also essential influence on the voltage
transfer ratio frequency characteristics. Simulation results for VT loaded with the same
impedance determined for power frequency and different power factor (1 resistive, 0.7
inductive and 0.7 capacitive) is presented in Fig. 16. The obtained results demonstrate
positive impact of inductive character of VT load on the pass band width. Inductive VT load
broadens the pass band towards the resonance frequency and causes effects of resonance to
be more sharp. In the evaluated case, the change of the VT load from purely resistive to
inductive (PF=0.7 @ 50 Hz) increases the 3 dB cut-off frequency few times.
www.intechopen.com

Power Quality Harmonics Analysis and Real Measurements Data
102
Capacitive character of VT load induces opposite effect and narrows VT pass band width significantly. Similarly, the change of VT load from purely resistive to capacitive (PF=-0.7 @ 50 Hz) decrease of VT pass band width is about tens times.
10 100 1k 10k 100k 1M 10M 30M10m
100m
1
10N
orm
aliz
ed v
olt
age
tran
sfer
rat
io []
Frequency (Hz)
Under Load (0.1)
Nominal Load (1)
Over Load (10)
Fig. 15. Simulation results of the influence of resistive load of VT on voltage transfer ratio frequency characteristic
10 100 1k 10k 100k 1M 10M 30M10m
100m
1
10
100
Mo
du
lus
of
imp
edan
ce []
Frequency (Hz)
R
RL, PF=0.7
RC, PF=0.7
Fig. 16. Influence of the character of VT load on voltage transfer ratio frequency characteristic – simulation results
www.intechopen.com

Voltage Harmonics Measuring Issues in Medium Voltage Systems
103
6. Experimental tests of voltage transformer transfer characteristic
Experimental investigations have been done for voltage transformers typically used in MV
power system with primary and secondary windings grounded. Exemplary measurement
results presented in this chapter have been obtained for VT of 50 VA rated power and
20 kV/0.1 kV nominal transformation ratio. Parameters of the proposed VT circuit model for
simulation have been identified by analysis of secondary windings impedance-frequency
characteristics measured for no load condition (magnetizing inductance – Fig.10) and short
circuit condition (leakage inductance – Fig.11). Measurements have been done in frequency
range from 10 Hz up to 30 MHz, which is a range typically used for the analysis of
conducted disturbances in power system. Particular attention has been paid to the frequency
range below 10 kHz which is obligatory for power quality analysis, especially for analysis of
power system voltage harmonics related phenomena.
The measured voltage transfer characteristics of evaluated VT for nominal load and no load
conditions are presented in Fig. 17. Based on these results the 3 dB high frequency pass band
of the evaluated VT can be estimated to be about 2 kHz. For frequencies higher than 2 kHz a
number of less meaningful resonances are clearly visible on the VT voltage transfer
characteristic which are not adequately characterized by the evaluated circuit model. This
inadequacy is associated with extra internal resonances appearing in windings which cannot
be properly represented by lumped parasitic capacitances referenced only to windings
terminals. In order to model these phenomena more complex circuit model are required
which take into account more detailed distributed representation of partial parasitic
capacitance of VT primary winding.
10Hz 100Hz 1kHz 10kHz0.0
0.5
1.0
1.5
2.0
2.5
3.0
No
rmal
ized
vo
ltag
e tr
ansf
er r
atio
[-]
Frequency [Hz]
No load
Nominal load
Fig. 17. Normalized voltage transfer ratio of the VT for no load and nominal resistive load
www.intechopen.com
Power Quality Harmonics Analysis and Real Measurements Data
104
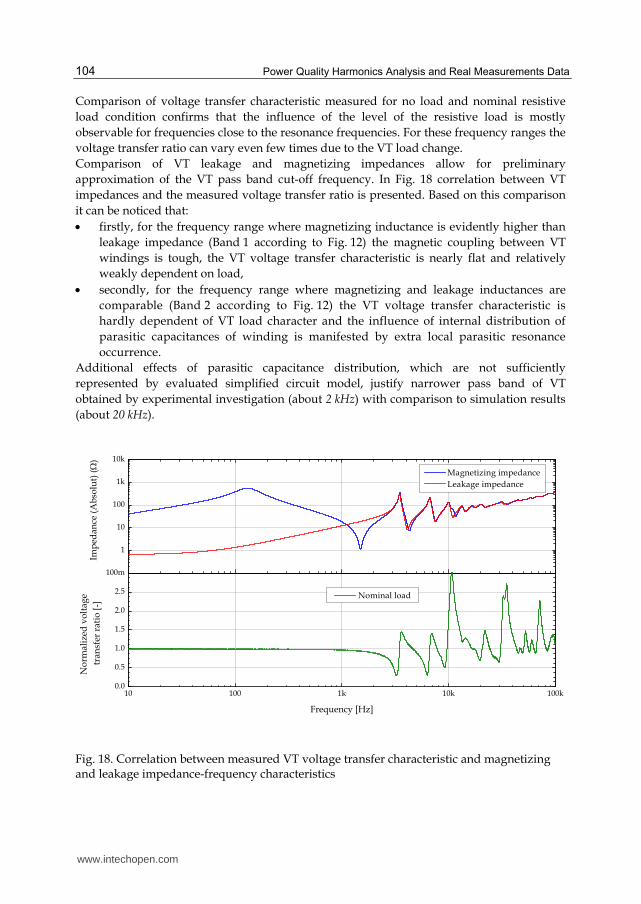
Comparison of voltage transfer characteristic measured for no load and nominal resistive
load condition confirms that the influence of the level of the resistive load is mostly
observable for frequencies close to the resonance frequencies. For these frequency ranges the
voltage transfer ratio can vary even few times due to the VT load change.
Comparison of VT leakage and magnetizing impedances allow for preliminary
approximation of the VT pass band cut-off frequency. In Fig. 18 correlation between VT
impedances and the measured voltage transfer ratio is presented. Based on this comparison
it can be noticed that:
firstly, for the frequency range where magnetizing inductance is evidently higher than
leakage impedance (Band 1 according to Fig. 12) the magnetic coupling between VT
windings is tough, the VT voltage transfer characteristic is nearly flat and relatively
weakly dependent on load,
secondly, for the frequency range where magnetizing and leakage inductances are
comparable (Band 2 according to Fig. 12) the VT voltage transfer characteristic is
hardly dependent of VT load character and the influence of internal distribution of
parasitic capacitances of winding is manifested by extra local parasitic resonance
occurrence.
Additional effects of parasitic capacitance distribution, which are not sufficiently
represented by evaluated simplified circuit model, justify narrower pass band of VT
obtained by experimental investigation (about 2 kHz) with comparison to simulation results
(about 20 kHz).
10 100 1k 10k 100k0.0
0.5
1.0
1.5
2.0
2.5
100m
1
10
100
1k
10k
Nominal load
No
rmal
ized
vo
ltag
e
tran
sfer
rat
io [
-]
Frequency [Hz]
Magnetizing impedance
Leakage impedance
Imp
edan
ce (
Ab
solu
t) ()
Fig. 18. Correlation between measured VT voltage transfer characteristic and magnetizing and leakage impedance-frequency characteristics
www.intechopen.com
Voltage Harmonics Measuring Issues in Medium Voltage Systems
105
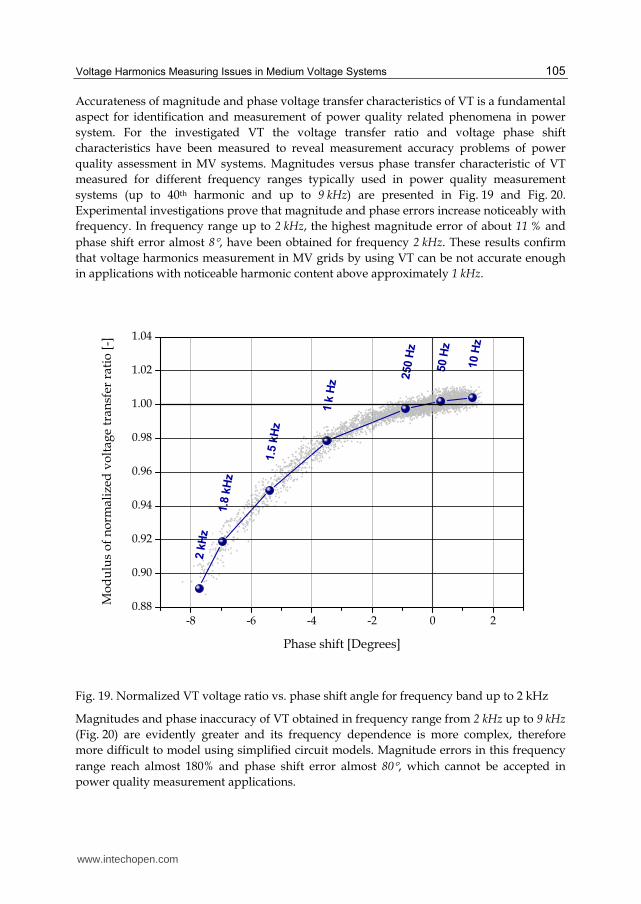
Accurateness of magnitude and phase voltage transfer characteristics of VT is a fundamental
aspect for identification and measurement of power quality related phenomena in power
system. For the investigated VT the voltage transfer ratio and voltage phase shift
characteristics have been measured to reveal measurement accuracy problems of power
quality assessment in MV systems. Magnitudes versus phase transfer characteristic of VT
measured for different frequency ranges typically used in power quality measurement
systems (up to 40th harmonic and up to 9 kHz) are presented in Fig. 19 and Fig. 20.
Experimental investigations prove that magnitude and phase errors increase noticeably with
frequency. In frequency range up to 2 kHz, the highest magnitude error of about 11 % and
phase shift error almost 8, have been obtained for frequency 2 kHz. These results confirm
that voltage harmonics measurement in MV grids by using VT can be not accurate enough
in applications with noticeable harmonic content above approximately 1 kHz.
-8 -6 -4 -2 0 20.88
0.90
0.92
0.94
0.96
0.98
1.00
1.02
1.04
10 H
z
50 H
z
250 H
z
1 k
Hz
1.5
kH
z
1.8
kH
z
2 k
Hz
Mo
du
lus
of
no
rmal
ized
vo
ltag
e tr
ansf
er r
atio
[-]
Phase shift [Degrees]
Fig. 19. Normalized VT voltage ratio vs. phase shift angle for frequency band up to 2 kHz
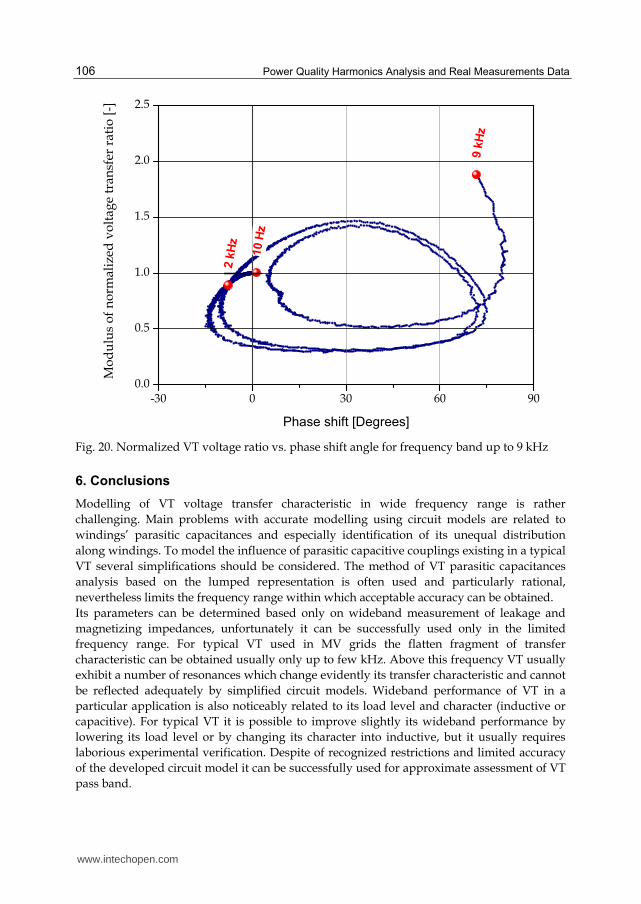
Magnitudes and phase inaccuracy of VT obtained in frequency range from 2 kHz up to 9 kHz
(Fig. 20) are evidently greater and its frequency dependence is more complex, therefore
more difficult to model using simplified circuit models. Magnitude errors in this frequency
range reach almost 180% and phase shift error almost 80, which cannot be accepted in
power quality measurement applications.
www.intechopen.com
Power Quality Harmonics Analysis and Real Measurements Data
106
-30 0 30 60 900.0
0.5
1.0
1.5
2.0
2.5
10 H
z
2 k
Hz
9 k
Hz
Mo
du
lus
of
no
rmal
ized
vo
ltag
e tr
ansf
er r
atio
[-]
Phase shift [Degrees]
Fig. 20. Normalized VT voltage ratio vs. phase shift angle for frequency band up to 9 kHz
6. Conclusions
Modelling of VT voltage transfer characteristic in wide frequency range is rather
challenging. Main problems with accurate modelling using circuit models are related to
windings’ parasitic capacitances and especially identification of its unequal distribution
along windings. To model the influence of parasitic capacitive couplings existing in a typical
VT several simplifications should be considered. The method of VT parasitic capacitances
analysis based on the lumped representation is often used and particularly rational,
nevertheless limits the frequency range within which acceptable accuracy can be obtained.
Its parameters can be determined based only on wideband measurement of leakage and
magnetizing impedances, unfortunately it can be successfully used only in the limited
frequency range. For typical VT used in MV grids the flatten fragment of transfer
characteristic can be obtained usually only up to few kHz. Above this frequency VT usually
exhibit a number of resonances which change evidently its transfer characteristic and cannot
be reflected adequately by simplified circuit models. Wideband performance of VT in a
particular application is also noticeably related to its load level and character (inductive or
capacitive). For typical VT it is possible to improve slightly its wideband performance by
lowering its load level or by changing its character into inductive, but it usually requires
laborious experimental verification. Despite of recognized restrictions and limited accuracy
of the developed circuit model it can be successfully used for approximate assessment of VT
pass band.
www.intechopen.com
Voltage Harmonics Measuring Issues in Medium Voltage Systems
107
The use of VT in power quality monitoring MV grids influence essentially finally obtained
measurement accuracy. In power quality measurement applications where dominating
harmonics emission is expected only in frequency range below 2 kHz VTs can provide
sufficient accuracy in many applications, nevertheless its voltage transfer characteristic
should be carefully verified with taking into account particular operating conditions.
Nowadays, much wider than up to 2 kHz harmonics emission spectrum can be injected into
the power system, especially by contemporary high power electronic applications. In this
frequency range from 2 kHz up to 9 kHz, which is already well specified by harmonic
emission limitation standards, typically used VT are not reliable enough. Measurement
errors in frequency range up to 9 kHz are usually not acceptable, because of resonance
effects which commonly appear and are difficult to predict.
7. References
Islam, S.M.; Coates, K.M.; Ledwich, G.; Identification of high frequency transformer
equivalent circuit using Matlab from frequency domain data. Thirty-Second IAS
Annual Meeting, IAS '97., Conference Record of the 1997 IEEE Industry
Applications Conference, 1997
Kadar, L.; Hacksel, P.; Wikston, J.; The effect of current and voltage transformers accuracy
on harmonic measurements in electric arc furnaces., IEEE Transactions on Industry
Applications, Volume 33, Issue 3, May-June 1997 Page(s):780 - 783
Klatt, M.; Meyer, J.; Elst, M.; Schegner, P.; Frequency Responses of MV voltage transformers
in the range of 50 Hz to 10 kHz. 14th International Conference on Harmonics and
Quality of Power (ICHQP), 2010
Łuszcz J.; Conducted EMI propagation modelling in the wound components. Seventeenth
International Wrocław Symposium and Exhibition on Electromagnetic
Compatibility, EMC 2004
Łuszcz J.; Iron Core Inductor High Frequency Circuit Model for EMC Application. Coil
Winding International & Electrical Insulation Magazine. Volume 28, Issue 1, 2004
Mahesh, G.; George, B.; Jayashankar, V.; Kumar, V.J.; Instrument transformer performance
under distorted-conditions. India Annual Conference, 2004. Proceedings of the
IEEE INDICON 2004. Page(s):468 – 471
Mohamed, R.; Markovsky, I.; Lewin, P.L.; Modeling and Parameter Estimation of High
Voltage Transformer Using Rational Transfer Function State Space Approach.
Annual Report Conference on Electrical Insulation and Dielectric Phenomena, 2008.
CEIDP 2008
Seljeseth, H.; Saethre, E.A.; Ohnstad, T.; Lien, I.; Voltage transformer frequency response.
Measuring harmonics in Norwegian 300 kV and 132 kV power systems., 1998.
Proceedings. 8th International Conference on Harmonics And Quality of Power.
Volume 2, 14-16 Oct. 1998 Page(s):820 - 824 vol.2
Shibuya, Y.; Fujita, S.; High frequency model and transient response of transformer
windings, Transmission and Distribution Conference 2002: 6-10 Oct. 2002
Vermeulen, H.J.; Dann, L.R.; van Rooijen, J.; Equivalent circuit modelling of a capacitive
voltage transformer for power system harmonic frequencies, IEEE Transactions on
Power Delivery, Volume 10, Issue 4, Oct. 1995
www.intechopen.com

Power Quality Harmonics Analysis and Real Measurements Data
108
Yao Xiao; Jun Fu; Bin Hu; Xiaoping Li; Chunnian Deng; Problems of voltage transducer in
harmonic measurement., IEEE Transactions on Power Delivery, Volume 19, Issue 3,
July 2004 Page(s):1483 – 1487
www.intechopen.com

Power Quality Harmonics Analysis and Real Measurements DataEdited by Prof. Gregorio Romero
ISBN 978-953-307-335-4Hard cover, 278 pagesPublisher InTechPublished online 23, November, 2011Published in print edition November, 2011
InTech EuropeUniversity Campus STeP Ri Slavka Krautzeka 83/A 51000 Rijeka, Croatia Phone: +385 (51) 770 447 Fax: +385 (51) 686 166www.intechopen.com
InTech ChinaUnit 405, Office Block, Hotel Equatorial Shanghai No.65, Yan An Road (West), Shanghai, 200040, China
Phone: +86-21-62489820 Fax: +86-21-62489821
Nowadays, the increasing use of power electronics equipment origins important distortions. The perfect ACpower systems are a pure sinusoidal wave, both voltage and current, but the ever-increasing existence of non-linear loads modify the characteristics of voltage and current from the ideal sinusoidal wave. This deviationfrom the ideal wave is reflected by the harmonics and, although its effects vary depending on the type of load,it affects the efficiency of an electrical system and can cause considerable damage to the systems andinfrastructures. Ensuring optimal power quality after a good design and devices means productivity, efficiency,competitiveness and profitability. Nevertheless, nobody can assure the optimal power quality when there is agood design if the correct testing and working process from the obtained data is not properly assured at everyinstant; this entails processing the real data correctly. In this book the reader will be introduced to theharmonics analysis from the real measurement data and to the study of different industrial environments andelectronic devices.
How to referenceIn order to correctly reference this scholarly work, feel free to copy and paste the following:
Jarosław Łuszcz (2011). Voltage Harmonics Measuring Issues in Medium Voltage Systems, Power QualityHarmonics Analysis and Real Measurements Data, Prof. Gregorio Romero (Ed.), ISBN: 978-953-307-335-4,InTech, Available from: http://www.intechopen.com/books/power-quality-harmonics-analysis-and-real-measurements-data/voltage-harmonics-measuring-issues-in-medium-voltage-systems

© 2011 The Author(s). Licensee IntechOpen. This is an open access articledistributed under the terms of the Creative Commons Attribution 3.0License, which permits unrestricted use, distribution, and reproduction inany medium, provided the original work is properly cited.