vopak report 2012 - jaarverslag.com · our mission and strategy 9 the world of vopak 10 our...
TRANSCRIPT

ANNUAL REPORT 2012
Connecting fl ows
• • • • • • • • • • • • • • • • • • • • • • • • • • • • • • • • • • • •
• • • • • • • • • • • • • • • • • • • • • • • • • • • • • • • • • • • •
• • • • • • • • • • • • • • • • • • • • • • • • • • • • • • • • • • • •
• • • • • • • • • • • • • • • • • • • • • • • • • • • • • • • • • • • •
• • • • • • • • • • • • • • • • • • • • • • • • • • • • • • • • • • • •
• • • • • • • • • • • • • • • • • • • • • • • • • • • • • • • • • • • •

At a Glance 2Overview 3Key figures 5Profile 6Our mission and strategy 9The World of Vopak 10
Our Business 11Letter from the Chairman 12Executive Board report 14
Growth journey continues in 2012 14Growth leadership, Operational excellence
and Customer leadership 15Strategic analysis 21Sustainability 22Growth perspective 30Financial performance 31Looking ahead 37Key market developments 38Netherlands 42Europe, Middle East and Africa 46Asia 51North America 56Latin America 59Global LNG 64
Our Governance 70Supervisory Board report 71Remuneration report 74Corporate Governance 81Risks and risk management 86Executive Board Declaration 94Shareholder information 95
Financial Statements 99
Consolidated Financial Statements 100Consolidated Statement of Income 100Consolidated Statement of Comprehensive Income 101Consolidated Statement of Financial Position 102Consolidated Statement of Changes in Equity 103Consolidated Statement of Cash Flows 104Segment information 105
Notes to the Consolidated Financial Statements 107Summary of significant accounting policies 107Notes to the Consolidated Statement of Income 118Notes to the Consolidated Statement of
Financial Position 124
Company Financial Statements 154Company Statement of Income 154Company Statement of Financial Position 154
Notes to the Company Financial Statements 155
Other information 160Independent auditor’s report 160Event after reporting period 162Articles of Association Provisions Governing Profit
Appropriation 162Proposed Profit Appropriation 162Stichting Vopak 163Report of the Stichting Administratiekantoor
Financieringspreferente Aandelen Vopak (‘the Foundation’) 165
Information on the Executive Board members 166Information on the Supervisory Board members 167Principal Company Officers at 28 February 2013 169Subsidiaries, Joint Ventures and Associates 171
Five-year Consolidated Summary 174
Glossary 175
Vopak | Annual Report 2012 | 1
Contents

Vopak | Annual Report 2012 | 2
At a Glance

At a Glance | Overview
Vopak | Annual Report 2012 | 3
Overview

Vopak | Annual Report 2012 | 4

At a Glance | Key figures
Vopak | Annual Report 2012 | 5
Key figures2012 2011
Sustainability dataTotal Injury Rate (TIR) per million hours worked own personnel 2.1 3.0
Lost Time Injury Rate (LTIR) per million hours worked own personnel and contractors 0.7 1.1
Number of process incidents 127 154
Results (in EUR millions)Revenues 1,313.9 1,171.9
Group operating profit before depreciation and amortization (EBITDA) -excluding exceptional items- 763.6 636.0
Group operating profit (EBIT) 535.9 585.5
Group operating profit (EBIT) -excluding exceptional items- 560.9 469.4
Net profit attributable to owners of parent 329.7 400.6
Net profit attributable to owners of parent -excluding exceptional items- 351.8 283.6
Net profit attributable to holders of ordinary shares 321.5 392.4
Net profit attributable to holders of ordinary shares -excluding exceptional items- 343.6 275.4
Cash flows from operating activities (net) 547.6 406.4
Investments (in EUR millions)Total investments 643.0 710.9
Average gross capital employed 5,010.4 4,145.2
Average capital employed 3,124.8 2,528.0
Capital and financing (in EUR millions)Equity attributable to owners of parent 1,839.6 1,729.3
Net interest-bearing debt 1,747.5 1,605.6
RatiosReturn on Capital Employed (ROCE) 17.1% 23.2%
Return on Capital Employed (ROCE) -excluding exceptional items- 18.0% 18.6%
Senior net debt : EBITDA 2.39 2.65
Total net debt : EBITDA 2.50 2.65
Interest cover (EBITDA : net finance costs) 8.7 7.9
Key figures per ordinary share (in EUR)(Diluted) earnings 2.52 3.08
(Diluted) earnings -excluding exceptional items- 2.70 2.16
(Proposed) dividend 0.88 0.80
Company dataNumber of employees at year-end of subsidiaries 3,932 3,921
Number of employees at year-end including joint ventures 6,099 5,901
Storage capacity subsidiaries at year-end (in million cbm) 20.3 19.7
Storage capacity including joint ventures at 100% at year-end (in million cbm) 29.9 27.8
Occupancy rate (average rented storage capacity in %) 91% 93%
Estimated market share global independent tank storage at year-end 10.2% 10.6%
Contracts > 3 years (in % of revenues) 52% 44%
Contracts > 1 year (in % of revenues) 82% 81%
Number of shares outstandingWeighted average 127,360,846 127,251,388
Weighted average, diluted 127,360,846 127,251,388
Total including treasury shares 127,835,430 127,835,430
Treasury shares 430,804 548,207
Financing preference shares 41,400,000 41,400,000

At a Glance | Profile
Vopak | Annual Report 2012 | 6
Profile
Royal Vopak is the world's largest independent tank storage service provider, specialized in storing and handling of oil products, liquid chemicals, gases, biofuels and vegetable oils. Headquartered in Rotterdam, the Netherlands, Vopak operates 84 terminals in 31 countries, with a combined storage capacity of nearly 30 million cbm. Our terminals are strategically located along the major shipping routes. The majority of our customers are active in the chemical and oil business; the products we store on their behalf are used in a broad range of related industries.
With almost 400 years of experience in storage and transshipment, Vopak understands the value of excellent service and our dedication to this is deeply embedded in our way of working. Our total commitment to our customers' success has resulted in long-term business relationships. We base our operations on the principles of transparency, loyalty, commitment and mutual trust.
The company’s annual turnover is EUR 1.3 billion (2012). The company is listed on the Amsterdam NYSE Euronext and is a constituent of the Amsterdam Midkap Index (AMX). Including our joint ventures, we employ an international workforce of more than 6,000 people.
Our people
Strategically located terminals coupled with state-of-the-art technologies are important, but it is our people who make the real difference. We continuously invest in the training and development of our employees worldwide; not only to improve their career possibilities and strengthen their dedication to Vopak’s strategic goals (growth leadership, operational excellence and customer leadership), but also to focus on their personal development. All over the world, our customers can count on the talent of our dedicated professionals and their commitment to service.

At a Glance | Profile
Vopak | Annual Report 2012 | 7
The organization
Vopak is organized into five regional divisions and a separate global business unit for managing and developing LNG terminals and projects:
All divisions and the global staff work closely together to share their knowledge, expertise and best practices. This enables Vopak to provide a global network solution and respond rapidly and accurately to changing customer needs and market developments.
In a number of countries we have teamed up with strong partners, often local companies, to deliver our services to customers in these markets. In order to meet customer expectations of a consistent service quality on a global basis, we apply the Vopak operational and safety standards at all our joint venture facilities as well.
What we do
Based on the global flow of products, Vopak operates terminals in key strategic ports. We operate specialized facilities including product tanks, jetties, truck loading stations and pipelines, and provide access to road and rail networks. In many instances, we store our customers’ products for extended periods at our terminals, often under strictly specified conditions such as controlled temperatures. Vopak also blends components according to customer specifications.
Vopak in the supply chain:

At a Glance | Profile
Vopak | Annual Report 2012 | 8
Vopak’s terminals play a key role in bringing products from the production plant or feedstock production via tank terminals to end-user locations respectively production plants, either by ship, tank truck, rail car or pipeline. Our independent tank terminal network is responsible for storage and transshipment in the flow of products from producer to end-user.
Vopak operates three types of terminals:
Our customers
Vopak’s terminals support our customers to improve the reliability and efficiency of their logistic processes. Our customers – including national oil companies (NOCs) and international producers, governments, utility providers and traders of oil and gas products and chemicals – are assured of high-quality and safe operations at our terminals worldwide.
We further develop our services in close collaboration with our customers and strategic partners, keeping in mind the product, market and functional requirements.
The nature of our business requires long-term investments in infrastructure at strategic locations. In line with this, Vopak invests in long-term relationships with our customers, strategic partners, governments, shareholders, financial partners, employees and other stakeholders.
Sustainability is an integral part of Vopak’s business processes and operations. This is reflected by our consistent application and enforcement of strict standards, rules, codes and procedures, such as those concerning safety, health and environment. Our standards are in keeping with the most professional oil and petro-chemical companies, which constitute a major part of Vopak’s customer base. The Vopak standards comply as a minimum with local legislation and regulations.
How we work
Vopak’s ambition is to maintain a strongly-rooted culture of safety, flawless execution and operational excellence. While we believe we can only achieve this by acting according to the Vopak Values. These seven values embody the behaviors that guide our employees in their day-to-day work, by acting with professionalism, a focus on service, integrity, improvement, agility, ownership and passion.
Our organization works closely together to share knowledge across our global network. We identify and address key developments quickly and adapt our business to changing circumstances.

At a Glance | Our mission and strategy
Vopak | Annual Report 2012 | 9
We operate with the philosophy of a global company driven by local entrepreneurship. In short, this facilitates applying a global brand, standards, systems, market knowledge and operational capabilities in the local competitive landscape. We continually seek to improve and expand our terminal network, particularly in strategically located ports.
Our mission and strategy
A growing geographic imbalance exists, both at a regional as well at a global level, between the areas of production and (industrial) consumption of oil and gas products, chemicals, biofuels and vegetable oils. As a result, there is a robust demand for the physical transportation and efficient and safe storage and handling of these products. This has led to a growing demand for solid infrastructures in order to seamlessly link up the logistics networks of producers, traders and distributors. The need for storage and handling services at critical locations is further intensified by new players in the market, the liberalization of previously closed economies and a demand that is increasingly becoming more specific for each country. Independent storage and handling facilities can reduce the pressure on logistics systems and contribute towards the reliability and efficiency of regional and global supply chains. The most important requirements for storage are the right logistic locations, a strong focus on sustainability and safety, reliable and efficient services and the ability of anticipating changes to the required efficient service in a flexible manner.
Vopak’s mission is to make a sustainable contribution to efficient logistics processes for our customers by being the leading provider of independent, optimum tank terminal infrastructure at locations that are critical to Vopak’s customers in all regions of the world.
To achieve our mission, we continue to invest in the further growth of our global network, in our customer service and in continuous operational improvements. Vopak has developed a strategy to realize that mission. This strategy rests on three pillars:• Growth leadership: Our ability to identify the right location for our terminals;• Operational excellence: Our ability to construct, operate and maintain our terminals to deliver
our service at competitive costs;• Customer leadership: Our ability to create a sustainable relationship with our customers.
Vopak’s strategy is executed through focused strategic initiatives and internal ‘excellence programs’ for the further improvement of existing operational processes. All this is supported by an ongoing evaluation process of possible changes to worldwide product flows, intensive collaboration with customers, sharing knowledge within the Vopak network at a global level, strategic collaboration with various partners and consulting experts in wide-ranging areas for improvement.

At a Glance | The World of Vopak
Vopak | Annual Report 2012 | 10
The World of Vopak

Vopak | Annual Report 2012 | 11
Our Business

Our business | Letter from the Chairman
Vopak | Annual Report 2012 | 12
Letter from the Chairman
To our customers, employees, shareholders and partners
Vopak is a global company driven by local entrepreneurship. This balance between shared global goals and local decision-making and execution is key to our success. We are driven by customers’ needs at each specific terminal and local competitive considerations. To achieve this, we invest in strong teams around the world. Balancing global with local interests does require continuous dialogue and clear communication about how we operate. We are supported in this by our remarkably open company culture; a culture we must treasure, nurture and pass on to all new colleagues.
We improved our sustainability results in 2012 compared to previous years but we fell short of our intentions. Despite improving overall personal and process safety statistics, we regrettably experienced two contractor fatalities, which we feel extremely saddened about. A year can only be complete if personal tragedies are prevented.
Vopak succesfully grew in size and earnings in 2012, and we are proud to have achieved this given the slowdown of the global economy. The year failed to bring the clarity or turnaround in the global economic climate that we all had hoped for.
Although the uncertainty of economic recovery is likely to continue to dictate the agenda for the coming year, we remain undiminished confident in the long-term outlook for our business. The development of the global economy will require additional movement of hydrocarbons, chemicals and vegetable oils. We believe we are well positioned to continue creating value by providing our services globally in the most safe, sustainable and efficient manner. At the same time, we realize we face several short-term challenges on the road towards our long-term objectives, such as the prolonged backwardated oil market and the effects of a stronger euro. We will focus our efforts on the areas we can influence to direct our own future.

Our business | Letter from the Chairman
Vopak | Annual Report 2012 | 13
In a sustainable wayOur drive to improve personal and process safety is at the heart of our sustainability efforts. Our journey to improve our process and personal safety record began more than a decade ago. If anyone is injured or the environment is harmed, we have failed in our basic obligation. To demonstrate our commitment and to earn the trust of the general public, we must consistently execute according to our Vopak standards. Recent years have seen examples in our industry of that trust being shattered by a single event. Our tireless efforts to embed the Vopak Fundamentals on Safety in our operations worldwide helped us make further progress on that front in 2012.
Global company, local entrepreneursOur network is continuously expanding across continents and industries. The size of our network is important, but is not our prime objective. We decide whether we can create value for our customers by carefully examining the choice of locations, markets and infrastructure and our ability to supply a recognized quality service. We are excited about last year’s strategic joint acquisition of the assets of the former Coryton refinery in the United Kingdom. This acquisition underlines our agility as a company. Our entry into the LNG storage and regasification business and the purchase and restructuring of the refinery assets demonstrates our project and engineering capabilities and this creates a solid foundation from which to grow.
Looking aheadVopak will mark 400 years of existence in 2016. We have set our ambitions for that year and we are working towards them. Equally crucial is how we achieve our objectives. We want to remain true to our values, our business principles and our customers; a company of which all stakeholders can be proud. Nurturing and protecting our very special culture is key to this.
We have chosen this year to distribute the 2012 annual report online only. We believe this will create greater efficiency in distribution and data accessibility. It also creates a new platform from which we can innovate and improve the accessibility of content further.
I hope you find the Vopak annual report insightful and inspiring to read.
Eelco HoekstraChairman of the Executive Board and CEO of Royal Vopak

Our business | Executive Board report | Growth journey continues in 2012
Vopak | Annual Report 2012 | 14
Executive Board report
The Vopak Executive Board, from left to right: Frits Eulderink, Eelco Hoekstra and Jack de Kreij
Growth journey continues in 2012
Vopak experienced a successful 2012, progressing further along the robust growth path we have pursued for several years. Despite a fragile macroeconomic climate, we continued to position ourselves to capitalize on structural trends that are boosting demand for storage and handling of bulk liquid products. We constantly monitor key market trends and developments to pinpoint sustainable future flows of energy products and chemicals and identify business opportunities that we seize through disciplined capital investment decisions, nimble action and careful risk management. This way, we have created a solid portfolio and growth strategy aligned with solid long-term trends - and this bore fruit again in 2012.
Our full-year Group operating profit before depreciation and amortization (EBITDA) -excluding exceptional items- grew to EUR 764 million from EUR 636 million in 2011. This meant we achieved our 2013 EBITDA outlook a year earlier, mainly due to the successful execution of profitable expansion projects, our continuous focus on operational efficiency and service improvements, while benefiting from a positive currency translation effect.
Overall demand for tank storage services at our strategically located terminals was healthy. Despite some lower occupancy rates in certain locations, demand for oil storage services was robust, while demand for chemical storage services was steady in Asia, encouraging in North America and mixed in Europe. In the biofuels market, we observed some improvements, although the market continues to be very dynamic. Occupancy rates stayed within the 90-95% bandwidth we aim for, yet declined slightly to 91% from 93% in 2011.
"Globally, we share values, beliefs, objectives, standards and an open, entrepreneurial, problem-solving culture. As well as leveraging global standards, we actively nurture the entrepreneurship of our local operations"
Our business | Executive Board report | Growth leadership, Operational excellence and Customer leadership
Vopak | Annual Report 2012 | 15
We continued to add storage capacity last year through a combination of opening new terminals, acquiring terminals and expanding at existing terminals.
The global macroeconomic backdrop remained turbulent. Recovery in Europe failed to transpire, the eurozone crisis played havoc with market confidence, and growth slowed in countries such as China and India. Some positive signs of recovery did appear in the United States, e.g. resulting from shale gas and tight oil developments.
Key to our ability to find and seize opportunities is our model as a global company driven by local entrepreneurs. Globally, we share values, beliefs, objectives, standards and an open, entrepreneurial, problem-solving culture. As well as leveraging global standards, we actively nurture the entrepreneurship of our local operations. We give them the freedom to use their unique local knowledge and expertise to make decisions and develop opportunities that will bring success in their specific country or region, both for Vopak as well as for our customers.
This interplay of global and local is integral to our mission: to be the leading provider of independent, optimal terminal infrastructure at locations critical to our customers. To achieve that mission, our strategy centers on investing in the further alignment and growth of our global network; in continual operational improvements; and in our customer service.
We made good progress in all those areas in a challenging 2012.
Growth leadership, Operational excellence and Customer leadership
Growth leadership
Our ability to identify and find the right locations for our terminals is crucial to our long-term growth. Vopak relentlessly monitors and analyzes global trends and themes to pinpoint sustainable future flows of energy products and chemicals. By proactively identifying growth opportunities and further intensifying our commercial relationships, we aim to maintain and strengthen our leading position at important logistic locations.
Most forecasts predict a continued increase in global energy and chemical use, as well as a growing geographical imbalance between production and consumption for a broader range of products. Such factors fuel demand for storage and transshipment services which we can fulfill by expanding and aligning our operations and storage capacity in strategically-located ports. To this end, we continued commissioning expansion projects, acquiring terminals and announcing new growth projects in 2012.
Our worldwide capacity increased to 29.9 million cbm at end 2012 from 27.8 million cbm a year earlier. All projects currently under construction will add 5.2 million cbm storage capacity in the period up to and including 2015.
2012 was the first full year with operations from our LNG terminals. In late 2011, LNG became a fully operational business unit of Vopak, rather than a business development department. Together with joint venture partners, we have two LNG terminals: Gate terminal in the Netherlands and Altamira (TLA) in Mexico. These terminals have a combined storage capacity of 840,000 cubic meters. We continue to explore new business opportunities in new market segments, new business models and new geographical areas.
Our business | Executive Board report | Growth leadership, Operational excellence and Customer leadership
Vopak | Annual Report 2012 | 16
We are not alone in spotting opportunities and boosting capacity. Vopak faces competition from both traditional and new players. In order to strengthen our competitive position, we will remain focused on offering reliable services to our customers based on a safety-focused culture and efficient operations. Based on the announced expansions, Vopak remains well positioned in strategic key locations.
Expanding capacityThe most important growth developments of 2012 are listed below:• In January, we commissioned a new terminal in Tianjin (China), with capacity of 95,300 cbm.
This terminal will be expanded by 240,000 cbm for the storage of LPG and is expected to be completed in 2013;
• In the same month, we announced to expand storage capacity at Vopak Terminal Europoort (the Netherlands) for middle distillates by 400,000 cbm;
• During the first quarter, we commissioned another 55,600 cbm at our terminal in Zhangjiagang (China), reaching a total capacity of 455,100 cbm;
• The second phase of Vopak Terminal Westpoort (the Netherlands) was commissioned in the first half of 2012, adding an additional 582,000 cbm capacity;
• In May, we inaugurated the sixth phase of Vopak Horizon Fujairah (United Arab Emirates), strengthening the storage capacity by an additional 611,000 cbm;
• In the second quarter, Vopak announced to replace 52,000 cbm of storage capacity at Vopak Terminal Vlaardingen (the Netherlands) with 140,000 cbm for storage of vegetable oils and biodiesel;
• In June, a consortium consisting of Vopak, Greenergy and Shell announced the acquisition of the assets of the former Coryton refinery (UK) with the aim of creating a state-of-the-art import and distribution terminal for oil products, which Vopak will manage. Initial storage capacity will be around 500,000 cbm, with potential to expand to up to 1 million cbm in later stages. The transaction was completed in September, and the terminal is expected to start first operations in the second half of 2013;
• In July, it was announced that South African petrochemicals company Reatile Group bought a 30% non-controlling interest in our Durban terminal. With Reatile, Vopak Terminal Durban (South Africa) gained a shareholder with the extensive local business experience required to enable further growth. This transaction was completed in December 2012;
• In August, Vopak and Gasunie announced that they had signed an agreement with Royal Dutch Shell as launching customer for the planned LNG Break Bulk terminal in Rotterdam (the Netherlands);
• Vopak Terminal Eemshaven (the Netherlands) started operations on 2 September. This new storage facility, which stores strategic oil reserves for European governments, is a 50:50 joint venture of Vopak and its partner NIBC European Infrastructure Fund. Vopak operates the new terminal, which has an initial storage capacity of 660,000 cbm. This capacity has been rented out for a long-term period. The total storage capacity of the terminal can be expanded up to 2.76 million cbm;
• In November, Vopak (25%) and Sabic (75%) announced to jointly invest in a new terminal in King Fahd Industrial Port at Jubail (Saudi Arabia), to serve the expansion of the petrochemical and downstream industries. The initial storage capacity will be around 250,000 cbm after completion early 2015;
• In the fourth quarter of 2012, Vopak decided to expand its storage capacity by 236,900 cbm: in Penjuru (Singapore) by 47,000 cbm for chemicals, in Caojing (China) by 52,400 cbm for chemicals, in Durban (South Africa) by 51,500 cbm for oil products, in Alemoa (Brazil) by 37,000 cbm for chemicals and at various other terminals by 49,000 cbm.

Our business | Executive Board report | Growth leadership, Operational excellence and Customer leadership
Vopak | Annual Report 2012 | 17
Development and studies for growthWe are investigating various expansion opportunities, both at existing terminals and locations new to Vopak. These include possibilities amongst others for oil storage terminals in Bahia Las Minas (Panama), on Bioko Island (Equatorial Guinea), in Perth Amboy (New Jersey, US) and LNG storage possibilities in several locations.
Funding our growthIn order to fund our ambitions, continued flexible access to the financial markets is essential. We regard banks and institutional investors as long-term business partners who can support our growth, rather than mere suppliers of financial resources.
We have established a long-term focused relationship management strategy, in which we work closely together with a group of specifically selected relationship banks and have clear objectives, including facilitating a balanced and well-spread debt maturity profile at appropriate terms and conditions that match Vopak’s solid credit quality. We combine this with flexible access to the international banking market and the various American and Asian capital markets.
We made significant progress on this in 2012. Investors faith in Vopak was reaffirmed in October, when we issued a new Notes program in the US Private Placement (USPP) market for a total of around USD 1 billion in various currencies. Consisting of a senior tranche of approximately USD 900 million and a subordinated tranche of around USD 100 million, the program further strengthens the maturity profile of Vopak’s outstanding debt with our long-term growth strategy.
The appetite for this issue, our fourth USPP program since 2001, was strong. We were delighted that no fewer than 37 institutional investors, 10 of them new investors, participated - reconfirming Vopak’s ongoing access to relevant capital markets.
In early 2011, we successfully closed a new EUR 1.2 billion revolving credit facility (RCF) with 15 international relationship banks. In February 2013, we executed the second and final extension option and reached agreement with all 15 lenders on extending the original facility by in total 2 years, taking the remaining maturity term up to 5 years. We have also decided to use the possibility to reduce the available facility. As from February 2013, the available RCF is EUR 1.0 billion, which is fully available for drawdown as per date of this report.
Our US and Asian Private Placement programs, the EUR 1.0 billion RCF and portfolio of specific project financings enable us to execute on our growth ambitions, whereas Vopak continues to explore other financing sources, including (listed) fixed yield equity, equity-like and other (debt) capital instruments.
Our business | Executive Board report | Growth leadership, Operational excellence and Customer leadership
Vopak | Annual Report 2012 | 18
Operational excellence
Operational excellence is core to Vopak’s customer service offering. We construct, operate and maintain our terminals in such a manner so that we can serve our customers safely and efficiently at competitive costs. We are continuously simplifying, improving, modifying and streamlining our operating processes in order to be the safest, most sustainable, most efficient and effective terminal operator.
We work closely with our customers long before we begin building, to ensure fit for purpose infrastructure that perfectly matches their needs. Our Vopak project management principles gives the framework for the processes to be followed from the inception of a project to the post-execution and review stage.
Developing the right organization to execute our strategy in a highly disciplined manner is vital to our success. We are a truly knowledge-sharing organization. Our local operations exchange information, expertise and experiences for the benefit of the entire company and thus of our customers, who want to do business with a terminal operator whose high-quality processes match their own, regardless of location.
We are a global company driven by local entrepreneurship. All over the world, we use a tried-and-tested repeatable process, built on our accumulated experience and knowledge, as a starting point to construct terminals. We then work closely with our customers and partners on the specific project to create fit for purpose infrastructure in the most cost-competitive way. We always strive to deliver our terminal construction projects safely, on time and within budget.
Improving processesDespite our solid track record, we realize that there are always lessons to learn. We encourage all our employees, at every level, to share their own ideas of ways to do things better, and we continuously review our performance so that we can improve our processes. Even for some state-of-the-art terminals we see possibilities for optimization.
Last year, a land permit delay at our terminal in China’s Dongguan taught us about the risk assessment of permit processes. And when a contractor at our Brazil Aratu terminal defaulted, we realized we should improve our financial screening of contractors and ward against their potential overstretch.
We continued to implement the Lean methodology of operational improvement around the globe. In Peru, for example, we used Lean to meet customer requirements in the shortest time frame and at minimal cost by streamlining the whole process and accelerating the truck turnaround time.
We rolled out a Learning Management System in Indonesia and Australia in 2012. The My Learning Operations (MLO) as it is called now, brings together all our technical training and standardizes it, and can be used to train people in skills and competencies, with staff able to access it when and where they like. It originated in Singapore and will be further implemented in the rest of the Vopak organization in 2013 - a shining example of how local innovation can ‘go global’ at Vopak.

Our business | Executive Board report | Growth leadership, Operational excellence and Customer leadership
Vopak | Annual Report 2012 | 19
Optimizing terminalsOur terminals are designed for the long term, reflecting the relationships we have with our customers, the locations and the upfront investments needed. In order to ensure the terminals are maintained in an optimal condition is not only a technical exercise - with safety, reliability and efficiency as top priorities - but also a market-focused exercise. We need to ensure our terminals can function to the satisfaction of our customers now and in the future. All these elements are translated into Terminal Master Plans, which focus on the future of the terminal.
The plans state the desired positioning for each terminal and the work required. This includes not only regular maintenance work, but also potential investments that may be needed to be able to continue meeting customer needs in the future market dynamics. In 2012, a range of terminals developed Terminal Master Plans.
In order to further optimize our Westpoort terminal in Amsterdam to adapt to new market developments, we began using an innovative process automation system in 2012 that we co-created with a supplier. Such terminal automation contributes greatly to operational success in safety, health and the environment and it also results in an effective and efficient service delivery. Furthermore, it will help us reduce project lead time, improve strategic planning and project execution and operate terminals more efficiently.
ICTOur ICT policy aims to offer solutions that contribute to the Vopak strategy. The appropriate use of ICT facilitates continuous improvement and ICT can be a driver for innovation, particularly for the core operation of the terminals.
Our investments in ICT are mostly aimed at creating safer working conditions, increasing efficiency, supporting global communication and collaboration, supporting effective decision-making and enhancing supply chain efficiency. In line with the overall strategy, we aim to make continuous improvements in these areas.
Examples are the implementations of a previously developed highly automated terminal management system and the commissioning of a new business intelligence system that delivers management information for Sales & Marketing and Operations and is ready to also support other business functions. The implementation of a cloud based communication and collaboration platform supports the improvements in global communication.
A global portfolio of ICT investments is defined and prioritized on business value and will be executed over the coming years.
Sourcing and ProcurementDuring 2012, several initiatives have started through our Sourcing and Procurement function to support Vopak’s strategy.
Standardized processesIn 2012, a new blueprint has been developed for the Purchase-To-Pay process, to guide all terminals towards one standardized way of working. This blueprint is being implemented and has started with a successful pilot run in Belgium.
Next to this process improvement, a pilot is being executed to implement a standardized process for tendering. When successful, a roll out will be scheduled to cover all regions.
Global equipment procurementWith the use of standard designs for Vopak’s terminals one can see the repetitive use for different types of equipment. For most of these types, a global supplier base does exist. Agreements have been made for

Our business | Executive Board report | Growth leadership, Operational excellence and Customer leadership
Vopak | Annual Report 2012 | 20
example with instrumentation, automation, and pump and valve suppliers during 2012 to deliver beneficial global contracts for usage at both existing and new terminals. The value under global contracts is starting to be noticeable, and is expected to grow fast as the contracts are also being used with large expansion projects.
Terminal procurement plansTo streamline the local procurement programs a global initiative started in 2011 to establish a standard terminal procurement plan. Based on a spend analysis and a maturity analysis of all procurement processes, plans have been drafted that aim at focusing the sourcing efforts at those areas that will support the overall business.
Customer leadership
To put the customer even more in the center of our day to day actions as well as of our long-term strategy we have made some small but distinct organizational changes which became fully operational during 2012.
On top of our successful decentralized sales approach we have built a global organization to be able to offer additional coordination for customers that are using our services in multiple locations and multiple divisions. Through this centralized organization, we focus particularly on enhancing our knowledge on global product developments, on professionalizing our engagement with our global customers and on building intelligence to shape our terminal network. We are able to extend our engagement with those network customers beyond the standard transactional processes into more strategy enabling services. Via specific marketing studies we are able to support them to open up new geographical or product markets offering our network customers the opportunity to grow faster and at higher standards globally.
At the same, time continuous development of our worldwide sales force, providing them with better information, tools and processes, improves the competency levels even further and increases the look and feel for those customers that use our service across the global Vopak network. Alignment of our commercial standards, like the modern terms and conditions that have been rolled out, now goes hand in hand with our standardized, high operational and technical standards throughout all our terminals. This is all focused on achieving the highest service levels in our industry in all our functional processes.

Our business | Executive Board report | Strategic analysis
Vopak | Annual Report 2012 | 21
Strategic analysis
Our business | Executive Board report | Sustainability
Vopak | Annual Report 2012 | 22
Sustainability Vopak has a long tradition of sustainable entrepreneurship. For almost 400 years, we have been an integral part of the societies in which we operate. During that long history, we have evolved into a globally active company with its roots in the Netherlands. Wherever we go, we seek to forge long-term relationships with our employees and business partners. Whenever we take the initiative to set up new business operations somewhere in the world, we enter into commitments for many decades to come. We take our responsibility for our people and our other stakeholders (customers, neighbors, partners, suppliers), and in doing so, secure the long-term continuity of our business.
As we store and handle large quantities of oil products, liquid chemicals, gases, biofuels and vegetable oils, safety comes first in everything we do. We distinguish between personal safety and process safety. For many years, we are pursuing a proactive Safety, Health and Environment (SHE) policy, supported by initiatives such as the annual global Vopak SHE Day. Our SHE policies are part of our overarching Vopak Sustainability Policy.
We aim to reduce our relative energy and water consumption and to curb emissions to soil, air and surface water. In addition, we want to minimize the negative impact and maximize the positive impact on the communities where we operate. Our pursuit of sustainability is based on the belief that it is the responsibility of each citizen and organization to do everything reasonably possible to protect the environment.
Doing business with sustainability in mind is not only a matter of balanced corporate responsibility, but is also sensible from a business perspective. We can only retain our competitive edge if we fully dedicate ourselves to our customers, our people, the environment and the local communities where we work.
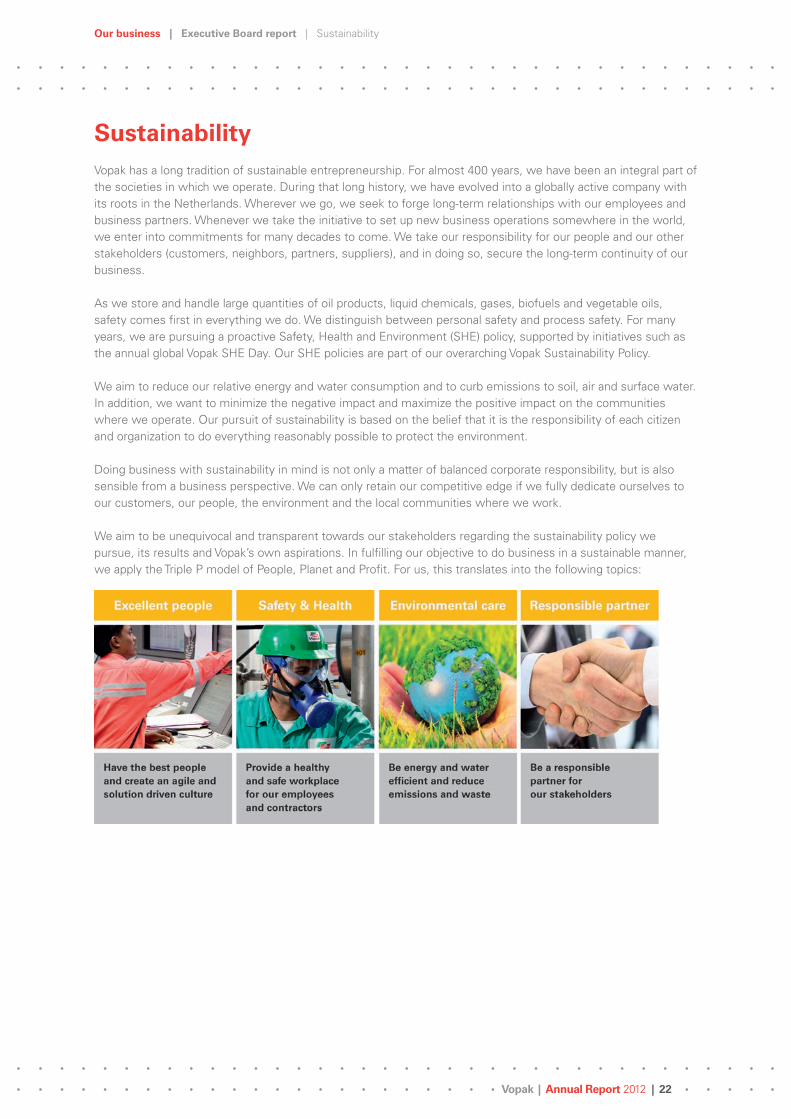
We aim to be unequivocal and transparent towards our stakeholders regarding the sustainability policy we pursue, its results and Vopak’s own aspirations. In fulfilling our objective to do business in a sustainable manner, we apply the Triple P model of People, Planet and Profit. For us, this translates into the following topics:

Our business | Executive Board report | Sustainability
Vopak | Annual Report 2012 | 23
Transparency and indicators
Vopak wishes for its sustainability policy, ambitions and results to be transparent to all stakeholders. To accomplish this ambition, our reports on our sustainability performance are aligned with the sustainability reporting guidelines of the Global Reporting Initiative (GRI).
Our interpretation of people, planet and profit, and our acknowledgement of their interdependence, is measured in 27 selected GRI Key Performance Indicators (KPIs) upon which we report. They express our performance in areas that are relevant to Vopak, and for which reliable information is available internally. The KPIs address economic, environmental and social performance areas.
Sustainability Report 2012
For more detailed information on our sustainability performance, please see Vopak’s 2012 Sustainability Report.
Excellent people
Vopak operates in 31 countries, each with its own laws, culture and customs. In this context, we apply the Vopak Values and endorse the principles of the United Nations’ International Labour Organization (ILO) and Universal Declaration of Human Rights. This ensures Vopak respects human rights and, where necessary, safeguards these when carrying out our activities. Our internal policies and Code of Conduct supplement the local rules in the countries where we operate to ensure that fundamental standards for employment and human rights are met throughout the world.
Vopak invests in long-term relationships with employees and offers them a work environment that appeals to their talents and skills. This includes giving ample attention to matters that employees find important, such as job satisfaction, personal development, competitive terms of employment and a good balance between work and private life. Our entrepreneurial culture is one of Vopak’s distinctive features. We embed the Vopak spirit, loyalty and enthusiasm into our business and across so many different nationalities by being inclusive, setting clear targets and managing performance, as well as in our informal dealings with employees. We take pride in these valuable elements of our global culture and will do everything possible to maintain and strengthen them.
People developmentOur people are our most valuable asset. Employing the best people who are passionate about Vopak will enable us to grow our business sustainably for the future. That is why developing our employees through systematic coaching and training is a crucial part of our global HR strategy. In 2012, we put a lot of emphasis on this. We developed learning programs in areas such as induction - to introduce newcomers to the company - sales and marketing and operations. All of these focus on developing behavioral competencies and skills.
Our electronic support tool 4People, which was developed in 2011, assesses staff locally and gives us a global overview of the competencies, skills and expertise needed in different parts of the world to support the business for growth. We continuously develop our staff, based on business and individual needs, providing the necessary training tools and informing them of job vacancies available within our company.
Excellent people
Have the best
people and create
an agile and solution
driven culture

Our business | Executive Board report | Sustainability
Vopak | Annual Report 2012 | 24
It is paramount we have the right people with the right competencies lined up, so we can optimize our human capital to enable sustainable growth. In 2013, we will increase our focus on active succession management, in order to be ready for the future.
In 2012 Vopak started four initiatives on people development:• My Learning Operations (MLO): An online e-learning tool to train employees’ skills and enhance
their competencies; • Refreshment training Vopak Fundamentals on Safety (theme of our Global SHE Day);• Vopak My Induction for new employees; • Enhanched Sales Capabilities, especially for our commercial employees.
To help management select the right candidates for promotion, we developed a global assessment toolbox in 2012 to assess people’s skills and competencies. We also created a job grade framework that standardizes job titles and grades for 150 generic jobs across the company. Consequently we can develop logical career paths for our employees, and provide the right training for their development.
We are proud that the overall people retention levels are very high.
Safety and health
Safety is the top priority at Vopak. We constantly introduce new initiatives to improve personal and process safety. In this process of continuous improvement, we actively involve our business partners and customers, both directly and by participating in national and international sector organizations. We see it as our responsibility to provide a safe and healthy workplace for Vopak employees and its contractors. Continuously improving working conditions and monitoring the effectiveness of controls are fundamental to our health and safety policy. Vopak’s safety policy states that we work towards our goals of zero incidents and no damage to the environment. Safety is everyone’s responsibility, we expect all employees to contribute to their own safety and that of others.
Safety incidentsWith regard to personal safety, however, the safety of own personnel, measured as the number of injuries per million hours worked (Total Injury Rate - TIR), improved to 2.1 (2011: 3.0). The Lost Time Injury Rate (LTIR) for own personnel and contractors improved to 0.7 (2011: 1.1). Achieving structural improvements in personal safety is and remains to be a top priority.
Safety & Health
Provide a healthy and
safe workplace for
our employees and
contractors

Our business | Executive Board report | Sustainability
Vopak | Annual Report 2012 | 25
Regrettably, there were two contractor fatalities in 2012: in Pengerang (Malaysia) and Hainan (China). Both incidents involved contractors who were involved in marine construction work. We have taken action to investigate these deeply regrettable incidents and to see how such incidents can be prevented in the future.
Process incidentsThe number of process incidents that occur at our tank terminals is an important measure of our safety and environmental care. Process incidents include product spills, product contaminations and fires (including smolderings). In 2012, the number of process incidents decreased to 127 (2011: 154). For 2013, Vopak will relentlessly pursue the global implementation of our standards, as well as take preventive measures aimed at further reducing process incidents. The total number of spills decreased from 79 in 2011 to 57 in 2012. The quantity of product spilled decreased significantly from around 600 cbm in 2011 to around 300 cbm in 2012. There were 30 product contaminations, unchanged from 2011. The number of fires (including smolderings) declined to 40 in 2012 from 45 in 2011.

Our business | Executive Board report | Sustainability
Vopak | Annual Report 2012 | 26
Vopak SHE dayOn 15 May 2012, Vopak organized the annual global SHE Day for the fifth consecutive year. It is mandatory for every Vopak location to organize a SHE Day program. By focusing attention on safety, health and the environment during this special day, Vopak aims for continuous improvement of the performance of both the company, its employees and contractors in these three areas. The global SHE Day is just one day, but its impact is long-lasting. The 2012 topic was the Vopak Fundamentals on Safety.
Environmental care
At present, Vopak operates storage terminals in 31 countries, involving thousands of people, directly and indirectly, and large plots of land. This creates not only responsibilities towards our neighbors and the local communities in which we have our operations, but also towards the surrounding environment of our terminals.
We have standardized our approach at a global level in our Vopak Standards, mapping the impact our operations may have on the environment. This helps us to address the issue of how to minimize our impact, including our operations’ carbon footprint. We are committed to develop a sound waste management system and minimize our energy consumption, soil contamination, air and surface water pollution and water consumption.
In 2012, excluding the LNG activities, the total energy consumption of our traditional operations (liquid bulk) was 5,266 TJ (2011: 4,843 TJ), an increase of almost 9%. The energy consumption of our LNG activities in 2012 was 1,511 TJ (of which 79% is renewable energy using warmed up cooling water of the nearby power plant at Maasvlakte 1).
Vopak generates scarcely any CO2 from its operating processes, and only generates CO2 during the production of steam for heating purposes. The direct and indirect energy used in operations do both generate CO2. Total greenhouse gas emissions (direct and indirect) are calculated in accordance with the standards set by the Carbon Disclosure Project.
Total Carbon emissions
CO2 emissions for Vopak including joint ventures
2009 2010 2011 2012
Direct carbon (kTon) 272 278 213 241
Indirect carbon (kTon) 160 165 154 228
Total (kTon) 432 443 367 469
Total relative (kg/cbm storage) 15.3 16.1 15.1 17.2
Environmental care
Be energy and water
effi cient and reduce
emissions and waste

Our business | Executive Board report | Sustainability
Vopak | Annual Report 2012 | 27
Responsible partner
Sustainability management enables Vopak to measure, manage and report on the Triple P-indicators, which relate to People (social), Planet (environment) and Profit (economic), and to set business strategies that reduce risks and increase shareholder value. Our key approach toward stakeholders is outside-in, meaning that it starts with stakeholder dialogue. Yet our responsibility is inside-out, meaning starting with those things that are directly under our control.
Daily contactsCustomers, suppliers and employees meet to share important information every day. In addition, various audits are undertaken, both by Vopak itself (Global Insurance, Global Internal Audit, Terminal Health Assessment, Project Post Implementation Reviews) and by our customers and various authorities. These audits aim to assure control for internal purposes, confirm the integrity of our terminals and processes and pre-assess implementation plans.
Regular contactsWe maintain regular contacts with investors, neighbors, local and other authorities. Organizing more than 300 individual meetings, presentations, roadshows and other events enables us to demonstrate our aim to be transparent towards all these target groups. In addition, we organize regular communications through webcasts and our website.
Annual contactsWe maintain contacts every year with a wide variety of communities, including our neighbors, non-governmental organizations, sustainability organizations and ministries in the countries in which we operate. Besides maintaining direct contacts with these stakeholders, we undertake various surveys throughout the year. The aim of these surveys is to verify the implementation of the suggestions, comments and recommendations we have received at operational and policy levels.
External benchmarksVopak was involved in a number of external benchmarks in 2012, especially: VBDO, Carbon Disclosure Project, Dow Jones Sustainability Index and Transparency Benchmark of the Dutch Ministry of Economic Affairs.
Responsible partner
Be a responsible
partner for
our stakeholdes

Vopak | Annual Report 2012 | 28Vopak | Annual Report 2012 | 28
Noted for its seals, birds and beautiful views, the Dutch Waddenzee may not seem the most obvious place for a state-of-the-art terminal for strategic oil reserves for European governments. And there is more to Vopak’s brand new Eemshaven terminal, situated close to the Netherlands’ most stunning aquatic nature reserve, than meets the eye.
Signed and sealed
By Erik Kleine

Vopak | Annual Report 2012 | 29Vopak | Annual Report 2012 | 29
Operational in September 2012, Eemshaven was built safely and securely, on time and within budget and crucially, with the full support of local wildlife groups and other Non Governmental Organizations (NGOs). The project exemplifies what tranquil and constructive dialogue and execution can achieve if all stakeholders collaborate.
Although Vopak has been involved in the storage of strategic oil reserves, the project is the first-ever terminal built for strategic oil reserves only. These are reserves of liquid oil products such as crude oil, gasoline and gasoil by European governments for strategic purposes. This is a great advantage for a location like the Waddenzee, because strategic oil reserves are by their very nature long term - so there is little coming and going of vessels through the peaceful nature reserve.
“Once the liquid oil products are there they usually stay there for the long term”, explains Erik Kleine, Vopak’s North Netherlands Managing Director. “This was one reason why the authorities of the Province of Groningen were welcoming us. As well as the fact, of course, that Vopak is a solid brand name, known for doing business in a responsible way.”
The project is also special for Vopak because it is a 50:50 joint venture between the company and the NIBC European Infrastructure Fund, where NIBC on behalf of long-term focused pension funds investsin infrastructure and renewables projects.
Ecologically soundDuring the project discussions with ecological experts, Vopak was keen to do its utmost to minimize any impact on local wildlife. For example, it appears that seals are particularly sensitive to potential light pollution and Vopak managed to introduce special green neon lighting at the terminal to minimize the impact.
“ From the very start we worked closely with all stakeholders - from wildlife groups to NGOs and the relevant authorities - to ensure that Eemshaven fits in with its beautiful location. It is a great success in every respect.”
In addition, Vopak requires vessels sailing to Eemshaven to compartmentalize their cargo so that should any leakage occur, the impact is minimized. “In addition, the terminal tanks are equipped with internal floating roofs for gasoline storage in order to minimize emissions.”
Fully operationalEemshaven has an initial storage capacity of 660,000 cubic meters, comprising 11 tanks with a storage capacity of 60,000 cubic meters each and a jetty for seagoing vessels.
The terminal can be expanded to a total storage capacity of 2.76 million cubic meters in the future. Vopak Terminal Eemshaven and Groningen Seaports have signed an agreement for the use of 55 hectares of land.
At the start of construction, during the ‘ground breaking ceremony’, Vopak received an adoptive seal as a gift from our NIBC European Infrastructure Fund partners. The seal has since been released into the pristine waters of the Waddenzee.
Our business | Executive Board report | Growth perspective
Vopak | Annual Report 2012 | 30
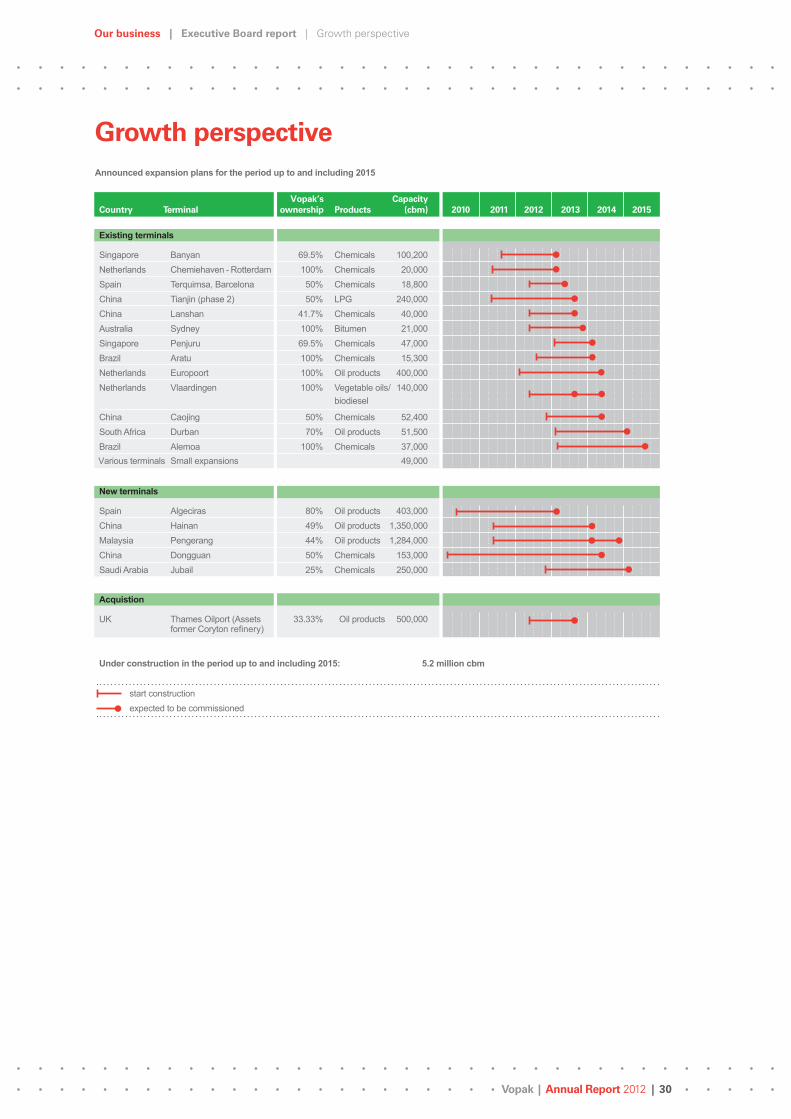
Growth perspective
Announced expansion plans for the period up to and including 2015
Country
Terminal
Vopak’s
ownership
Products
Capacity
2010
2011
2012
2013
2014
2015 (cbm)
Existing terminals
Singapore Banyan 69.5% Chemicals 100,200Netherlands Chemiehaven - Rotterdam 100% Chemicals 20,000Spain Terquimsa, Barcelona 50% Chemicals 18,800China Tianjin (phase 2) 50% LPG 240,000China Lanshan 41.7% Chemicals 40,000Australia Sydney 100% Bitumen 21,000Singapore Penjuru 69.5% Chemicals 47,000Brazil Aratu 100% Chemicals 15,300Netherlands Europoort 100% Oil products 400,000 Vegetable oils/Netherlands
Vlaardingen
100%
biodiesel 140,000
China Caojing 50% Chemicals 52,400South Africa Durban 70% Oil products 51,500Brazil Alemoa 100% Chemicals 37,000Various terminals Small expansions 49,000
New terminals
Spain Algeciras 80% Oil products 403,000China Hainan 49% Oil products 1,350,000Malaysia Pengerang 44% Oil products 1,284,000China Dongguan 50% Chemicals 153,000Saudi Arabia Jubail 25% Chemicals 250,000
Acquistion
UK Thames Oilport (Assets 33.33% Oil products 500,000 former Coryton refinery)
Under construction in the period up to and including 2015: 5.2 million cbm
start constructionexpected to be commissioned

Our business | Executive Board report | Financial performance
Vopak | Annual Report 2012 | 31
Financial performance
Revenues
In 2012, Vopak generated revenues of EUR 1,313.9 million, a 12% increase compared with 2011 (EUR 1,171.9 million), including a currency translation gain of EUR 43.8 million. The increase of revenues came primarily from capacity expansions in the Netherlands (0.6 million cbm), partly offset by lower occupancy rates. The average occupancy rate was 91% (2011: 93%). Revenues from contracts with original durations of longer than 1 year accounted for 82% of total revenues (2011: 81%).
Revenues
In EUR millions 2012 2011 Δ %
Netherlands 457.6 400.8 14%
Europe, Middle East & Africa 235.9 226.6 4%
Asia 355.4 308.7 15%
North America 158.4 137.7 15%
Latin America 100.9 93.6 8%
Non-allocated 5.7 4.5 27%
Revenues 1,313.9 1,171.9 12%
Group operating profit
Group operating profit -excluding exceptional items- rose by 19% to EUR 560.9 million (2011: EUR 469.4 million), including a currency translation gain of EUR 22.0 million.
Operating profit at 2012 exchange rates
In EUR millions 2012 2011 Δ %
Group operating profit including exceptional items 535.9 585.5 - 8%
–/– Exceptional items - 25.0 116.1
Group operating profit excluding exceptional items 560.9 469.4 19%
–/– Group operating profit of disposed activities 1.4 3.9
+ Currency translation gain 22.0
Group operating profit 1 559.5 487.5 15%
1. Pro forma group operating profit for 2011 computed at 2012 exchange rates.
Group operating profit excluding exceptional items
In EUR millions 2012 2011 Δ %
Netherlands 192.9 156.3 23%
Europe, Middle East & Africa 96.8 92.9 4%
Asia 217.0 185.3 17%
North America 37.0 33.8 9%
Latin America 27.6 28.2 - 2%
Non-allocated - 10.4 - 27.1
Group operating profit excluding exceptional items 560.9 469.4 19%
Depreciation and amortization 202.7 166.6 22%
Group operating profit before depreciation and amortization (EBITDA) 763.6 636.0 20%

Our business | Executive Board report | Financial performance
Vopak | Annual Report 2012 | 32
The growth of Group operating profit is attributed to increased results in all divisions, except from Latin America. Operating costs not allocated to the divisions adjusted for exceptional items amounted to EUR 31.0 million and were lower compared to last year (2011: EUR 31.5 million).
The reported Group operating profit includes the net result of joint ventures and associates, based on IFRS equity accounting. The net result of joint ventures and associates -excluding exceptional items- rose by 17% to EUR 107.2 million (2011: EUR 91.7 million). The growth is mainly due to the full year operation of the LNG joint ventures (results of LNG joint ventures amounted to EUR 25.3 million compared to EUR 9.9 million in 2011).
During 2012, a total exceptional loss of EUR 25.0 million was recognized due to impairments (exceptional gain 2011: EUR 116.1 million, mainly due to the sale of Vopak’s 20% equity stake in BORCO, Bahamas).
Group operating profit before depreciation and amortization (EBITDA) -excluding exceptional items- and including the net result of joint ventures and associates rose by 20% to EUR 763.6 million (2011: EUR 636.0 million).
Increased capital requirements because of investments in new storage capacity caused capital employed to increase and accordingly ROCE -excluding exceptional items- to decrease slightly to 18.0% (2011: 18.6%).
Group operating profit (EBIT) and ROCE excluding exceptional items
In EUR millions EBIT
Average capital
employed ROCE
Netherlands 192.9 901.8 21.4%
Europe, Middle East & Africa 96.8 607.0 15.9%
Asia 217.0 1,068.4 20.3%
North America 37.0 254.9 14.5%
Latin America 27.6 189.3 14.5%
Non-allocated - 10.4 103.4
Total 560.9 3,124.8 18.0%

Our business | Executive Board report | Financial performance
Vopak | Annual Report 2012 | 33
Exchange rates
USD SGD
Per EUR 1.00 2012 2011 2012 2011
Average exchange rate (translation rate income statement) 1.29 1.39 1.61 1.75
Year-end exchange rate (translation rate balance sheet) 1.32 1.29 1.61 1.68
Net finance costs
The net finance costs amounted to EUR 83.5 million (2011: EUR 78.6 million, including an exceptional loss of EUR 5.0 million as result of the sale of the Buckeye Class B units, which were received as part of the consideration for the sale of our 20% equity stake in BORCO, Bahamas). The increase -excluding exceptional items- is mainly due to lower capitalized interest on projects during construction and lower interest income, offset by somewhat lower interest expenses due to repayment of high yield interest-bearing debt in 2011.
The interest-bearing loans amounted to EUR 2,183.2 million at year-end 2012 versus EUR 1,538.6 million at year-end 2011. The average interest rate over the reporting period was 4.4% (2011: 4.7%). The fixed-to-floating ratio of the long-term interest-bearing loans, including interest rate swaps, amounted to 91% versus 9% at 31 December 2012 (31 December 2011: 84% versus 16%).
Income tax
The income tax expense for 2012 amounted to EUR 82.9 million (2011: EUR 71.3 million). The effective tax rate for 2012 was 18.3% (2011: 14.1%). In 2011, the book gain on the sale of our 20% equity stake in BORCO (Bahamas), of which EUR 108.5 million was exempted for tax purposes, had a positive impact on the effective tax rate. The effective tax rate -excluding exceptional items- for 2012 was 17.9% versus 19.5% for 2011.
Net profit attributable to holders of ordinary shares
Net profit attributable to shareholders -excluding exceptional items- rose by 24% to EUR 351.8 million (2011: EUR 283.6 million). Of this profit EUR 8.2 million is attributable to the holders of financing preference shares (2011: EUR 8.2 million). Net profit attributable to holders of ordinary shares -excluding exceptional items- rose by 25% to EUR 343.6 million (2011: EUR 275.4 million).
Earnings per ordinary share -excluding exceptional items- grew by 25% to EUR 2.70 (2011: EUR 2.16). Earnings per ordinary share -including exceptional items- decreased by 18% to EUR 2.52 (2011: EUR 3.08).
Non-current assets
Total non-current assets increased to EUR 4,222.9 million (31 December 2011: EUR 3,845.2 million). In 2012, total investments amounted to EUR 643.0 million (2011: EUR 710.9 million), of which EUR 448.8 million was invested in property, plant and equipment (2011: EUR 479.2 million). The remainder included primarily investments in joint ventures of EUR 99.3 million (2011: EUR 37.5 million), the acquisition of our 33.3% equity share in the former Coryton refinery in the UK (EUR 55.4 million) and the acquisition of an additional 2.5% equity share in Gate terminal in the Netherlands (EUR 10.3 million). The investment amount of 2011 includes the acquisition of a 60% interest (joint management control) in the Altamira LNG terminal in Mexico (EUR 55.9 million) and the 100% acquisition of the terminal in Kandla (India) of EUR 44.0 million.

Our business | Executive Board report | Financial performance
Vopak | Annual Report 2012 | 34
Of the investments in property plant and equipment EUR 194.4 million was invested in expansions at existing terminals (2011: EUR 198.6 million).
Net investments by division
In EUR millions 2012 2011
Netherlands 175.0 189.5
Europe, Middle East & Africa 194.0 148.0
Asia 175.7 116.9
North America 31.9 - 145.6
Latin America 22.4 40.5
Non-allocated 10.0 80.3
Net investments 609.0 429.6
Net investments
In EUR millions 2012 2011
Intangible assets 8.9 11.1
Property, plant and equipment 448.8 479.2
Joint ventures and associates 99.3 37.5
Loans granted 20.0 82.5
Acquisition of subsidiaries including goodwill – 44.0
Acquisition of joint ventures 65.7 55.9
Other non-current assets 0.3 0.7
Investments 643.0 710.9
Intangible assets 0.2 0.1
Property, plant and equipment 2.5 3.1
Joint ventures and associates – 214.1
Loans granted 31.3 54.5
Subsidiaries – 5.6
Assets held for sale – 3.9
Disposals 34.0 281.3
Net investments 609.0 429.6
Equity attributable to owners of parent
The equity attributable to owners of parent rose by EUR 110.3 million to EUR 1,839.6 million (31 December 2011: EUR 1,729.3 million). The increase mainly came from the addition of the net profit for the year less a dividend payment in cash of EUR 110.1 million and a distribution of EUR 33.0 million from the share premium for the financing preference shares.
Net interest-bearing debt
As result of the investment program the net interest-bearing debt rose to EUR 1,747.5 million (31 December 2011: EUR 1,605.6 million). The Senior net debt : EBITDA ratio decreased to 2.39 (2011: 2.65), the Total net debt : EBITDA ratio declined to 2.50 (2011: 2.65). Both ratios are well below the maximum agreed upon covenants with lenders.
During the fourth quarter of 2012, Vopak issued a new Notes program in the US Private Placement (USPP) market for a total amount of approximately USD 1 billion in various currencies. The new issue consists of a senior tranche of approximately USD 900 million and a subordinated tranche of approximately USD 100 million.

Our business | Executive Board report | Financial performance
Vopak | Annual Report 2012 | 35
The senior Notes program consists of various tranches with maturities ranging from 10.5 to 14.5 years and an average annual interest rate of 3.94%. The subordinated Notes program has a maturity of 7 years and an average annual interest rate of 4.99%. The majority of the Notes is denominated in USD.
The program further aligned the maturity profile of the outstanding debt with Vopak’s long-term growth strategy and will provide maximum flexibility under the EUR 1.2 billion revolving credit facility (RCF), which was fully available at 31 December 2012.
As per 31 December 2012, EUR 2,040.4 million was issued under Private Placement programs with an average remaining term of 10 years. A further EUR 124.2 million was funded by banks with an average remaining term of 1.3 years.
During 2013, regular repayments of long-term loans will amount to EUR 99.4 million.
Funding
In EUR millions 2012 2011
Cash and cash equivalents 452.0 88.7
Non-current portion of interest-bearing loans - 2,083.8 - 1,521.5
Current portion of interest-bearing loans - 99.4 - 17.1
Bank overdrafts - 16.3 - 155.7
Net interest-bearing debt - 1,747.5 - 1,605.6
Derivative financial instruments (currency) - 21.7 15.6
Credit replacement guarantees - 49.9 - 53.7
Total net debt for ratio calculation - 1,819.1 - 1,643.7
–/– Subordinated loans - 81.8 –
Senior net debt for ratio calculation - 1,737.3 - 1,643.7
Financial ratios
Senior net debt : EBITDA 2.39 2.65
Total net debt : EBITDA 2.50 2.65
Interest cover 8.7 7.9
Abridged consolidated statement of cash flows
In EUR millions 2012 2011
Cash flows from operating activities (gross) 659.3 495.8
Net finance costs paid and received - 70.0 - 61.9
Settlement of derivatives financial instruments
(interest rate swaps) 2.4 0.6
Income tax paid - 44.1 - 28.1
Cash flows from operating activities 547.6 406.4
Investments - 643.0 - 710.9
Disposals 34.0 281.3
Settlement of derivatives (net investment hedges) - 9.9 - 13.1
Cash flows from investing activities (including derivatives) - 618.9 - 442.7
Cash flows from financing activities 573.5 - 181.4
Net cash flows 502.2 - 217.7

Our business | Executive Board report | Financial performance
Vopak | Annual Report 2012 | 36
Dividend proposal
Barring exceptional circumstances, the principle underlying Vopak’s dividend policy is the intention to pay an annual cash dividend of 25% to 40% of the net profit -excluding exceptional items- attributable to holders of ordinary shares.
A dividend of EUR 0.88 per ordinary share, an increase of 10% (2011: EUR 0.80), payable in cash, will be proposed to the Annual General Meeting of Shareholders of 24 April 2013. Adjusted for exceptional items, the payout is 33% of earnings per ordinary share (2011: 37%).
Vopak consolidated including proportionate consolidation of joint ventures in tank storage activities
In EUR millions 2012 2011
Statement of incomeRevenues 1,676.9 1,452.0
Group operating profit before depreciation and amortization (EBITDA) 859.6 807.8
Group operating profit before depreciation and amortization (EBITDA) 1 888.1 701.4
Group operating profit (EBIT) 597.1 598.8
Group operating profit (EBIT) 1 625.5 492.4
Net profit attributable to owners of parent 329.7 400.6
Net profit attributable to owners of parent 1 351.8 283.6
Net profit attributable to holders of ordinary shares 321.5 392.4
Net profit attributable to holders of ordinary shares 1 343.6 275.4
Statement of financial positionNon-current assets 5,038.7 4,586.5
Current assets 986.3 515.9
Total assets 6,025.0 5,102.4
Non-current liabilities 3,314.0 2,553.8
Current liabilities 742.6 710.8
Total liabilities 4,056.6 3,264.6
Total equity 1,968.4 1,837.8
Financial ratiosInterest cover 7.5 7.6
Total net debt : EBITDA 2.56 3.11
1. Excluding exceptional items.

Our business | Executive Board report | Looking ahead
Vopak | Annual Report 2012 | 37
Looking aheadProjects under construction will add 5.2 million cbm of storage capacity in the years up to and including 2015 and result in total storage capacity of 35.1 million cbm. Some projects, such as the new terminal in Algeciras (Spain) for the storage of oil products (403,000 cbm), the expansion in Tianjin (China) for the storage of LPG (240,000 cbm) and the expansion of Banyan (Singapore) by 100,200 cbm for the storage of chemical products, will be commissioned during 2013. However, the majority of the capacity under construction will be commissioned in 2014. The total investment for Vopak and partners of the projects under construction involves capital expenditure of some EUR 2.1 billion, of which Vopak’s total remaining cash spend will be some EUR 0.6 billion.
A solid capital structure supports Vopak’s objective to create long-term shareholder value fully aligned with the requirements of its other capital providers. Vopak maintains a robust financial position through disciplined investment decisions, effective working capital management, long-term funding with diversified maturities and a balanced dividend policy. Vopak is currently reviewing additional fit for purpose equity(-like) alternatives to support the continued effective and efficient financing of the future growth we aim for. The alternatives include, amongst others, (listed) fixed yield equity, equity-like and other (debt) capital instruments. The long-term objective is to maintain a solid capital structure, while providing sufficient flexible access to the capital markets to fund the growth strategy.
Except for Europe, where we have a variety of experiences in certain product-market combinations, Vopak expects demand for oil storage services to remain robust and demand for chemical storage services to be steady. Although we experienced some improvements in the market for the storage and handling of biofuel products in 2012, the market for biofuels continues to be very dynamic. The mixed developments in the market for storage and handling of biofuels are therefore expected to continue throughout 2013. The market for storage and regasification of LNG is expected to remain solid.
Taking into account the 20% EBITDA growth in 2012, the modest planned capacity expansions in 2013, no material changes in product outlook assumptions resulting in an expected average occupancy rate of around 90%, higher pension charges and the negative foreign exchange developments year to date, Vopak expects a relatively limited EBITDA growth for 2013. The long-term financing activities completed in 2012 will weigh on EPS development due to higher net financing costs.
Vopak will mark 400 years of existence in 2016. Based on current projects under construction and potential opportunities for further expansion of Vopak’s network of terminals, it is our ambition to realize an EBITDA of EUR 1 billion in 2016. In order to achieve this ambition, the approval and successful execution of additional profitable expansion projects are required.

Our business | Executive Board report | Key market developments
1. Source: IEA (2012).
Vopak | Annual Report 2012 | 38
Key market developments
In 2012, Vopak continued to focus on the structural trends that underline the healthy demand for storage and handling of bulk liquid products. Our challenge is to proactively translate key market developments into customer-specific solutions in strategically-positioned seaports across the world. The geographic and product-related challenges and considerations can be summarized as follows:
Oil
Despite some lower occupancy rates in certain locations, overall demand for oil storage services remained robust in 2012. Developments in non-conventional resources, especially in North America, are reshaping the refining and chemical industry and trade flows. Global oil demand is expected to grow in 2013 by 1.0% to 90.7 million barrels per day, with OECD countries showing a decline of 0.7% versus growth of 2.6% in non-OECD countries 1. As demand is expected to grow, non-OECD countries will be more dependent on imports of crude oil and will seek multiple sources. The impact of US tight oil has not only strengthened US exports and trade, but also diverted crude imports from locations such as West Africa to other markets.
Changes to the global refinery landscape are expected to further drive inter-regional and intra-regional trade in crude oil and refined products. Key factors include the development of new export refineries east

Our business | Executive Board report | Key market developments
Vopak | Annual Report 2012 | 39
of the Suez Canal; unconventional oil and the subsequent strengthening of US Gulf Coast refining; and the consolidation of refinery capacity in OECD countries, with announced refinery closures in the UK, Australia, Germany and Italy.
The expected growth in trade of crude oil and refined products supports demand for storage in the long term, whereby customers face currently less favorable market conditions resulting from the prolonged backwardated market. In the key oil hubs, storage capacity is rented out at healthy rates and long-term contracts reflect the structural need of our customers. However, storage capacity in secondary locations is more challenged.
The growth of Vopak’s global network of oil terminals will continue in the next two years, with new hub terminals commissioned in Spain (Algeciras, 2013), China (Hainan, 2014) and Malaysia (Pengerang, 2014). These will provide our customers with a competitive position and flexible trade options. In addition, we continue to explore investment opportunities in new hub locations, such as Panama and West Africa, and in structural import or export areas.
Chemicals
In global and strategic ports, Vopak is a market leader. In 2012, all our hub locations worldwide operated at healthy occupancy levels and contributed to our customers’ supply chain efficiencies. Our industrial terminals performed well and although some of our plant-related customers had shutdowns during the year, all facilities operated safely and served the chemical sites at customer demand levels. During the year we experienced reduced chemical volumes at some of our European distribution terminals, especially in the first half, mainly due to lower demand in key sectors of the automotive and construction markets. Our US sites increased their volumes over the year, while our major Asian sites remained at healthy levels.
The global chemicals market is characterized by a number of major developments. In North America, the central theme is a strong drive to develop and monetize shale gas. This has prompted several chemical majors to announce the construction of world-scale crackers. These petrochemical plants will enjoy a significant competitive advantage over the rest of the world; apart from in the Middle East, feedstock costs will be the lowest in the world. In Asia, demand for chemical products is expected to increase in the long term, keeping the Asian markets as net importers. China will continue its relentless efforts to expand production capacity and narrow the import gap, but under current market conditions will remain an importer for the foreseeable future.
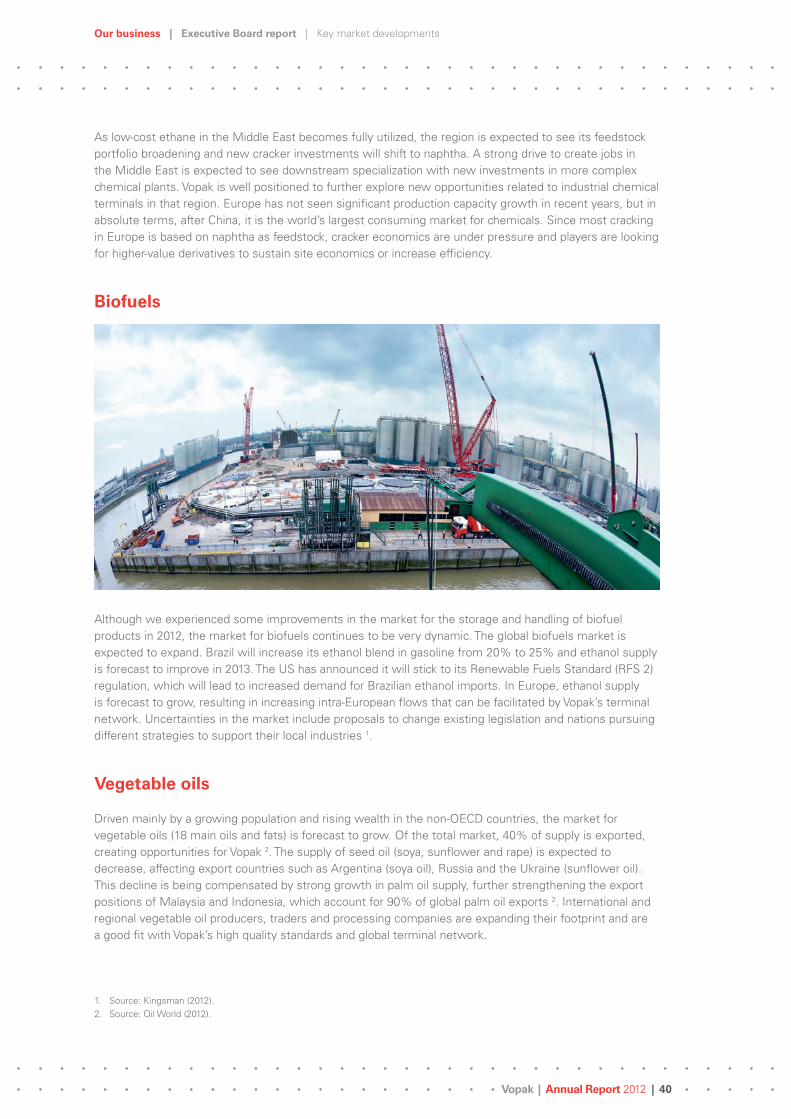
Our business | Executive Board report | Key market developments
Vopak | Annual Report 2012 | 40
As low-cost ethane in the Middle East becomes fully utilized, the region is expected to see its feedstock portfolio broadening and new cracker investments will shift to naphtha. A strong drive to create jobs in the Middle East is expected to see downstream specialization with new investments in more complex chemical plants. Vopak is well positioned to further explore new opportunities related to industrial chemical terminals in that region. Europe has not seen significant production capacity growth in recent years, but in absolute terms, after China, it is the world’s largest consuming market for chemicals. Since most cracking in Europe is based on naphtha as feedstock, cracker economics are under pressure and players are looking for higher-value derivatives to sustain site economics or increase efficiency.
Biofuels
Although we experienced some improvements in the market for the storage and handling of biofuel products in 2012, the market for biofuels continues to be very dynamic. The global biofuels market is expected to expand. Brazil will increase its ethanol blend in gasoline from 20% to 25% and ethanol supply is forecast to improve in 2013. The US has announced it will stick to its Renewable Fuels Standard (RFS 2) regulation, which will lead to increased demand for Brazilian ethanol imports. In Europe, ethanol supply is forecast to grow, resulting in increasing intra-European flows that can be facilitated by Vopak’s terminal network. Uncertainties in the market include proposals to change existing legislation and nations pursuing different strategies to support their local industries 1.
Vegetable oils
Driven mainly by a growing population and rising wealth in the non-OECD countries, the market for vegetable oils (18 main oils and fats) is forecast to grow. Of the total market, 40% of supply is exported, creating opportunities for Vopak 2. The supply of seed oil (soya, sunflower and rape) is expected to decrease, affecting export countries such as Argentina (soya oil), Russia and the Ukraine (sunflower oil). This decline is being compensated by strong growth in palm oil supply, further strengthening the export positions of Malaysia and Indonesia, which account for 90% of global palm oil exports 2. International and regional vegetable oil producers, traders and processing companies are expanding their footprint and are a good fit with Vopak’s high quality standards and global terminal network.
1. Source: Kingsman (2012).2. Source: Oil World (2012).

Our business | Executive Board report | Key market developments
Vopak | Annual Report 2012 | 41
LNG
The focus on clean, safe and reliable energy sources has led to 2.1% growth in the global consumption of natural gas - faster than any other fossil fuel 1. Moreover, the growth of unconventional sources such as shale gas has resulted in a sharp increase in availability particularly in the US, reducing gas prices in the US and increasing demand.
This rising demand and price differentials across markets have also led to increased LNG trade - the share of LNG in natural gas trade has grown by 32%. Despite the increased volatility across markets, LNG trade has been constrained by a lack of sufficient liquefaction capacity, leading to high prices in the Far East, with Europe acting as the market of last resort. The market outlook is expected to improve with the announcement of several liquefaction projects in locations including Australia (potentially 80 million tonnes per annum), in Africa (Angola and Mozambique) and in the US, which has significant export potential due to the growth of shale gas. This will help drive up demand for LNG and boost trade.
Vopak builds on these developments in two ways. We develop new, independent open-access LNG import terminals in attractive gas markets along LNG trade flows and we acquire existing LNG terminals, all operated as independent open-access terminals. Our joint venture project portfolio approach allows us to team up with the best-aligned partners, underpinned by long-term commercial contracts. Overall, our approach has positioned Vopak as a credible partner in the LNG business.
1. Source: BP Energy Outlook 2030.

Our business | Executive Board report | Key market developments
Vopak | Annual Report 2012 | 42
Netherlands

Our business | Executive Board report | Netherlands
Vopak | Annual Report 2012 | 43
Key developments
Jan Bert Schutrops, Division President Netherlands: “The Netherlands division started on 1 January 2012. This was the result of a restructuring of our former Chemicals Europe, Middle East and Africa (CEMEA) and Oil Europe, Middle East and Africa (OEMEA) divisions into Netherlands and EMEA. This was done in order to better reflect Vopak’s geographical organization structure and enhanced economies of scale benefits.
The Netherlands represents a significant percentage of Vopak’s asset base. As such, a separate division was appropriate to give it the right focus. The Netherlands plays a vital role as the gateway to Europe. The ports of Rotterdam and Amsterdam are both vital hubs in the international trade of oil, chemicals and biofuels. The need to store these liquids boosted our operating profit -excluding exceptional items- by 23% in 2012.
To cater for the growing demand, especially for oil storage, we increased our capacity to 9.5 million cbm from 8.3 million cbm in 2011. The occupancy rate decreased to 89% in 2012 (2011: 94%), due to a lower demand for crude oil and gasoil storage capacity.
In October 2012, we officially opened a new oil storage terminal at Eemshaven dedicated to strategic storage on the coast of the North Sea. We also commissioned the second phase of our Amsterdam Westpoort terminal, which opened in 2011, and are upgrading and modernizing all our Dutch terminals to better serve our customers in the future.
The Amsterdam-Rotterdam-Antwerp area - the main trading hub in Europe - is a highly competitive marketplace, with new players entering, existing rivals adding capacity and economic uncertainty continuing to dog Europe. We will therefore continue to improve our service offerings to our customers, invest in the most safe and efficient infrastructure and align our facilities with a long-term view to the key market developments.
Due to a number of safety related developments in our industry, including the stench issues around our Europoort terminal, we will focus on developing short-term and long-term solutions to enhance our operational and technical capabilities.
Vopak’s agencies business continued to thrive in the Netherlands, providing ship owners, operators and charterers with unrivalled logistics services in Dutch ports.”
Growth opportunities
“We see opportunities in practically every market: oil, biofuels, chemicals and LPG. This does not necessarily mean only adding more cubic meters, but also moving more tonnage through our existing facilities to improve our overall efficiency.
We are still expanding our capacity today. In Rotterdam for example, we are building additional middle distillates storage capacity of 400,000 cbm at Europoort and we are replacing 52,000 cbm storage capacity in Vlaardingen with 140,000 cbm for vegetable oils and biodiesel.”

Our business | Executive Board report | Netherlands
Vopak | Annual Report 2012 | 44
Customers, service and operational excellence
“The close proximity of the Dutch terminals to each other enables us to centralize activities and capture economies of scale. This helps to improve our efficiency and offer our customers better service at more competitive prices.
We encourage all our employees, at every level, to share their own ideas of ways to do things better and improve the way we work.
In 2012, our facilities were stretched to deliver the service our customers expect and there were infrastructure challenges at some of our oil terminals, which affected service levels. In order to enhance our service offering for our customers, we are, where relevant, upgrading our facilities and have launched a modernization program. Once the upgrades are complete, these will be state-of-the-art terminals ready to serve tomorrow’s customers. Notably, the improvements will allow us to load the product at higher speed.
Resulting from our expansion at Vopak Terminal Vlaardingen, the average capacity per tank will increase significantly, which will yield efficiency gains.
We were proud that a key customer named our TTR chemical terminal in Rotterdam as the best for service and safety in this region. TTR is one of our chemical terminals that is planned to be modernized. By making sure the Botlek, TTR and Chemiehaven terminals all serve specific markets, we can optimize our infrastructure and operations, leading to improved service and efficiency levels.”
Safety and sustainability
“The personal safety performance of our own employees improved, however for contractors it deteriorated during the year. Encouragingly, our process safety performance improved significantly, while storage capacity increased. The severity of our process incidents also declined. We continue to aim for zero incidents, so there is still work to do.
The biggest environmental issue we faced in 2012 was dealing with the stench coming from our Europoort terminal. We pump large quantities of fuel oil into very large crude carriers. The process releases fuel vapors, which the wind carries across residential areas. To reduce this, we are implementing various techniques. We closely monitor prevailing winds and weather conditions and stop our operations if it is unfavorable for residents. In addition, we are working on long-term solutions such as regenerative thermal oxygenation, a process that chemically decomposes gases at a high temperature.
To make our operations more environmentally friendly, we are exploring geothermal energy as an alternative source of heating, and using excess heat generated by industry to replace our steam boilers. In our TTR chemical terminal, we have installed a new vapor treatment system that reduces emissions. Our Westpoort terminal in Amsterdam has near zero emissions.
Our reputation and good name is built on safe and sustainable operations and is our license to operate. Because of local residents’ complaints about Europoort, and more stringent controls by the local authorities resulting from safety breaches by the industry in the port of Rotterdam, we have gone to great lengths to strengthen public faith in our company. We hosted open days at our terminals, a family day for employees and opened up our facilities to the public during the Rotterdam Wereld Havendagen (World Harbor Days) event in September.

Our business | Executive Board report | Netherlands
Vopak | Annual Report 2012 | 45
To increase our transparency, every incident occurring at any of our Dutch terminals will be reported on the Netherlands section of the Vopak website as from 2013. Society has zero tolerance for incidents; people expect faultless operations with no mistakes. We want to create confidence that we are sincere, professional and doing the right things.”
Employees
“Our workforce is highly engaged and employees take great pride in our company. Introducing the new Netherlands division has been an opportunity for us to improve the way we work. To this end, we redesigned our training program for operators and introduced a more professional on-boarding program for new colleagues. Positioning the new division has increased our focus on Vopak’s large operations in the Netherlands and on the potential that exists to improve our business in many areas.”

Our business | Executive Board report | Europe, Middle East and Africa
Vopak | Annual Report 2012 | 46
Europe, Middle East and Africa

Our business | Executive Board report | Europe, Middle East and Africa
Vopak | Annual Report 2012 | 47
Key developments
Frank Erkelens, Division President EMEA: “The EMEA division started in January 2012, after a restructuring of our CEMEA and OEMEA divisions into a seperate EMEA and Netherlands division. We have 21 terminals across a large and diverse geographic area, each with its own challenges and opportunities.
Our joint acquisition of the Coryton refinery (renamed Thames Oilport) on the Thames Estuary, together with Greenergy and Shell, delivers significant growth potential for Vopak and gives us a leading position in the mature UK fuels distribution market. Once operational in the second half of 2013, Thames Oilport will have an initial capacity of around 500,000 cbm. It is the first time Vopak has bought a refinery to convert into a storage facility.
Coryton’s closure as a refinery created a need for additional imports of fuel products into the UK in 2012, boosting the performance of our existing UK terminals in London and Teesside in the second half of the year.
This, along with additional imports into Germany via Hamburg, helped us realize an operating profit -excluding exeptional items- of EUR 96.8 million for 2012, despite the impact of the economic crisis on other parts of our business in Europe, notably on the throughput of chemicals in Belgium.
As a result of continued backwardation in the oil market, the occupancy was slightly lower, mainly in Sweden. In Estonia, we faced a challenging market situation due to the opening of a new Russian terminal in the Gulf of Finland.
That said, we increased our capacity to 9.0 million cbm from 8.3 million cbm in 2011. This includes 611,000 cbm at Vopak Horizon Fujairah in the United Arab Emirates, 60,000 cbm in Gothenburg (Sweden) and 7,500 cbm in Antwerp (Belgium).”
Growth opportunities
“The Middle East is fast becoming the world’s largest center for chemicals production, generating a need for storage facilities in the future. In November 2012, we signed an agreement with Sabic to jointly build a new storage terminal in Saudi Arabia with an initial capacity of around 250,000 cbm. Construction will start in the second quarter of 2013, and will take around two years to become operational.
In Turkey, we took the difficult decision to step out of a long-standing project aimed to develop a terminal on the coast of the Sea of Marmara after it became clear we could not obtain the necessary permits and licenses within a reasonable time. However, we are exploring new options to establish a position in this economic powerhouse.
In Africa, Vopak can provide the infrastructure that emerging economies need to develop their full potential, for example on Bioko Island (Equatorial Guinea). In 2012, local petrochemicals company Reatile Group bought a 30% non-controlling interest in our Durban terminal (South Africa). Reatile has the right connections and credentials to help us grow in this gateway to the continent. Furthermore, Vopak will expand storage capacity in Durban by 51,500 cbm for oil products.
Countries in southern Europe are hit hard by the economic crisis, however we see potential to establish a strong position in the Mediterranean. In Spain, we are developing an oil terminal in Algeciras, which will be ready in the first half of 2013.”

Our business | Executive Board report | Europe, Middle East and Africa
Vopak | Annual Report 2012 | 48
Customers, service and operational excellence
“We developed Terminal Master Plans for all our terminals. These set out the steps we need to take to ensure each terminal is ready for the future and can deliver the most efficient, safest and highest quality service for its customers.
When it comes to service, our customers have high expectations. Customer satisfaction in EMEA varies across our operating companies and has room for further improvement. We have monthly calls with our operating companies, teams to monitor our service levels and a network of service ambassadors promoting better service delivery to ensure we continuously improve.”
Safety and sustainability
“Improving our safety performance is a top priority for EMEA. We stepped up safety training at all our operations, with particular emphasis on complying with the Vopak Fundamentals on Safety. As a result, there were significantly fewer personal and process incidents.
In addition to stepping up safety training to minimize human error, we have developed Terminal Master Plans to improve or replace infrastructure at certain terminals, aiming to reduce safety incidents.
Vopak supports a number of local initiatives to help the communities in which we operate, such as local health care, education and environmental initiatives. In addition, we support the Water for Growth program to supply clean drinking water and sanitation in areas where there is none. In 2012, a group of Vopak employees travelled to Tanzania to help set up some of the projects we funded there as part of the Water for Growth program. We will continue to support this program in 2013.”
Employees
“The EMEA workforce is highly engaged, driven and enthusiastic, which is reflected in our low staff turnover. Our senior management plays a key role in this, taking time to personally coach young potential managers and by being visible and approachable for all staff.
Developing our people is important to us. We are especially proud of our European Leadership Program (ELP), which we created to prepare our young talents for management positions. The latest 12 participants completed the 18-month program in December 2012. Of the total 50 participants so far, most have moved into higher management positions. The next ELP is scheduled to start in summer 2013.”
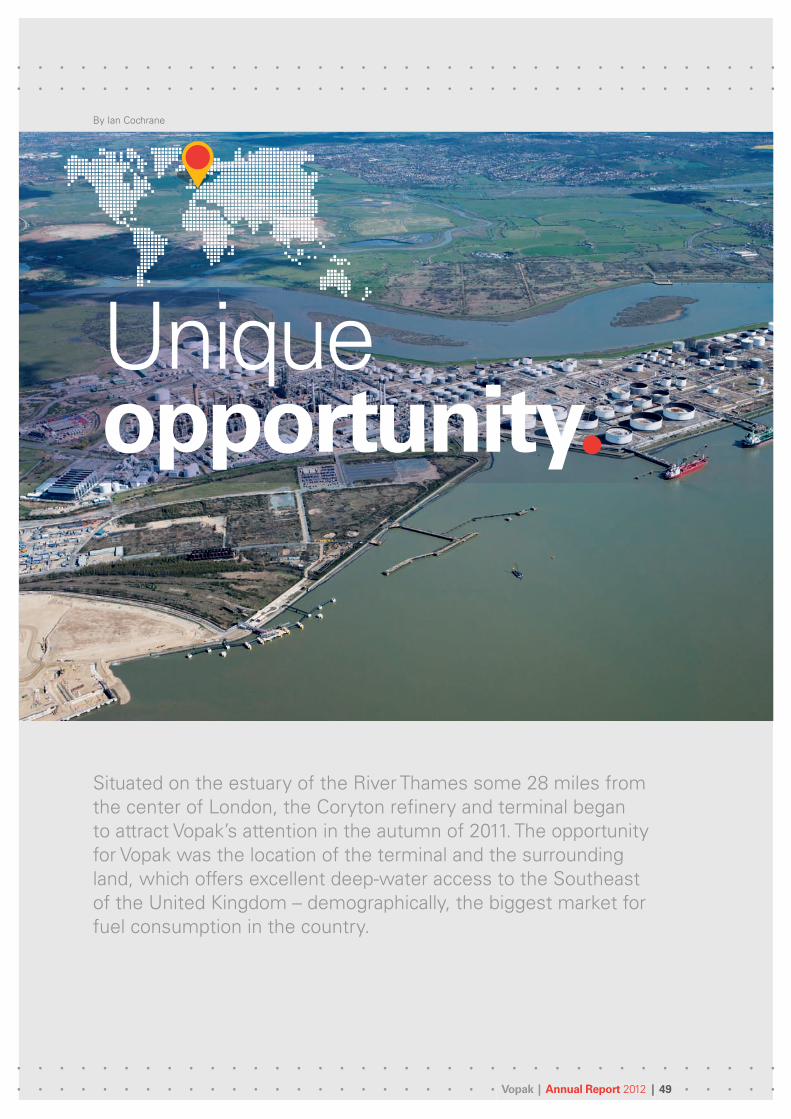
Vopak | Annual Report 2012 | 49Vopak | Annual Report 2012 | 49
Situated on the estuary of the River Thames some 28 miles from the center of London, the Coryton refinery and terminal began to attract Vopak’s attention in the autumn of 2011. The opportunity for Vopak was the location of the terminal and the surrounding land, which offers excellent deep-water access to the Southeast of the United Kingdom – demographically, the biggest market for fuel consumption in the country.
Unique opportunity
By Ian Cochrane

Vopak | Annual Report 2012 | 50Vopak | Annual Report 2012 | 50
The European refining sector is going through difficult times – and the UK has certainly not escaped unscathed. When the previous owner of Coryton filed for bankruptcy in January 2012, Vopak saw a way to help ensure fuel supplies to the Southeast – the country’s most densely populated region.
Vopak approached the administrator of the refinery as a potential buyer - the plan being to eventually convert the assets into a state-of-the-art import and distribution terminal, called Thames Oilport. Vopak teamed up with long-standing customers Greenergy and Shell in an equal three-way partnership. Vopak, on behalf of the consortium, will manage the operations.
Fast footworkDespite hurdles along the way, the most significant of them being the administrators’ initial preference to sell the refinery as a going concern, the sale to the consortium was completed in September 2012.
“It was an essential advantage that we were fully prepared for this opportunity,” says Ian Cochrane, managing director of Vopak Terminals UK. “There are just not many of these deep-access ports in this type of location offering access to the Southeast.”
“ We saw the opportunity and were fully prepared as soon as the chance came to bid for the assets. That speed and preparation gave us a critical edge.”
The administrators were happy to sell to Vopak, Greenergy and Shell because of the firm offer made by these reputable companies. They recognized that they were dealing with financially sound companies who could transact immediately after it became clear that the refinery could not be sold as a going concern.
Thames Oilport will develop a sustainable business designed to meet the fuel needs of London and the Southeast for the foreseeable future and adds security of supply for this important market during a period when European refining is being rationalized.
Solid groundworkThe striking refinery towers and structures that feature prominently in the Thames side landscape will not be dismantled for some time, but things are now moving swiftly for Thames Oilport.
In the first phase, Greenergy, Shell and Vopak are designing the Thames Oilport terminal to have a capacity of 500,000 cubic meters with the opportunity to reach 1 million cubic meters in a second phase.
Thames Oilport will initially utilize the equipment already in place, becoming operational in the second half of 2013. Longer-term, the consortium is looking to transform the historic Coryton refinery into a state-of-the-art import and distribution terminal, for which Greenergy and Shell have signed long-term contracts with the joint venture.
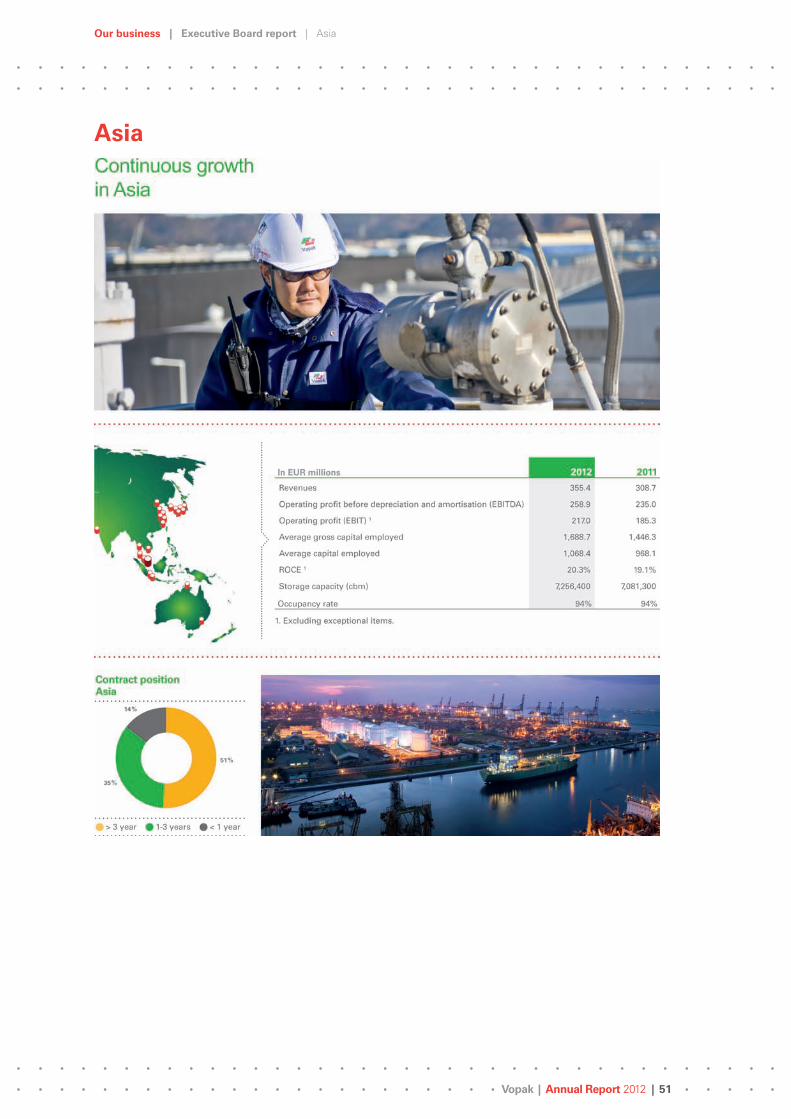
Our business | Executive Board report | Asia
Vopak | Annual Report 2012 | 51
Asia
Our business | Executive Board report | Asia
Vopak | Annual Report 2012 | 52
Key developments
Patrick van der Voort, Division President Asia and Yan Chen, President China Region: “Growing domestic demand for oil and chemical products has triggered an increase in imports of these products into Asia from other parts of the world, and additional product movements within Asia. Benefiting from this trend, Vopak achieved a positive performance in Asia in 2012.
The Asia division’s operating profit -excluding exceptional items- rose 17% to EUR 217.0 million versus EUR 185.3 million last year, despite the global economic uncertainty. This is partly attributable to a 2.5% increase in our total capacity to 7.3 million cbm, as a result of the completion of our Tianjin Lingang terminal and two other expansions in China.
Occupancy rate in the region remained stable at 94% in 2012. Demand for storage in Singapore and other key locations remained strong, while in India, we managed to improve our contract structure, moving away from spot business to longer-term contracts, resulting also in a higher occupancy rate. Although the storage business is becoming more competitive with the entry of more new players including traders, shipping operators with terminal assets and international oil companies, we are confident that our high operating standards, track record as a market-leading independent storage operator, reputation for trust and reliability and investments in strategic new locations, will keep us ahead.”
Growth opportunities
“We are taking significant steps to expand our capacity in Asia to meet future demand for storage. We see the greatest growth potential in China, Southeast Asia - Singapore, Malaysia, Indonesia and Vietnam - as well as in Korea and India.
Our projects under construction currently have a capacity of close to 3.3 million cbm. These include expansions and greenfield projects scheduled to be completed over the next two years.
Our division currently has two new large terminals under construction. The Independent Deepwater Petroleum Terminal in Pengerang, Malaysia, is a key project for Vopak in Asia. With an initial storage capacity of 1.3 million cbm for crude oil and oil products, it will become the first crude oil storage facility in Southeast Asia. In China, the Vopak SDIC Hainan terminal - with an initial storage capacity of 1.4 million cbm and potential for significant future expansion - will serve as an oil transshipment hub at the crossroads of major shipping lanes for vessels from the Middle East and Africa to the Far East.
In response to rising storage demand in the region, we have also undertaken several expansions of our existing terminals. These projects are located in Australia, China and Singapore. In India, a market we entered in 2011, we are upgrading our facility to attract more international customers who require bulk liquid storage services.
In 2012 we recognized an impairment of EUR 10.1 million for our 49% interest in PT Jakarta Tank Terminal (Indonesia). The progress of deregulation of the subsidized fuel distribution is going much slower than originally assumed. Looking at the growing fuel consumption of Indonesia this is, from a long-term perspective, considered a timing issue.”
Customers, service and operational excellence
“We aim to deliver a consistent service level across our terminals in Asia. This is done through standardized training for employees. In Asia, we continue to build on the iCare program, introducing additional modules to sharpen our employees’ sense of service excellence.
Our business | Executive Board report | Asia
Vopak | Annual Report 2012 | 53
Our customer satisfaction continued to improve in 2012. This is heartening news for the division and clearly shows that our efforts in refining our service level are paying off. Areas where we are doing well include order management and information and data management.
We recognize that there are areas where we can still do better. These include handling of complaints and operational reviews. Initiatives to improve these areas are currently underway. As part of this process, we increased the number of customer contact points in 2012, and are carrying out more frequent operational reviews with customers.
To improve the efficiency of our operations, we are currently running twelve Lean projects in Asia, which look structurally at ways to reduce inefficiencies in our day-to-day processes. We are investing in new hardware to automate some of our terminals, as well as in software to improve maintenance management and to automate training of operational staff.”
Safety and sustainability
“A continuous emphasis on safety and a desire to further improve in this area are paramount to us. While safety performance improved in general in 2012, we sadly had to report two fatal accidents in the year involving contractors working on the marine construction of new terminals at Pengerang (Malaysia) and Hainan (China). These fatalities triggered an extensive action plan to raise safety awareness and improve safety practices during construction. Moving forward in 2013, we will be stepping up our efforts in safety awareness, both for our own employees as well as for our contractors.
In the last quarter of 2012, a new campaign to ensure full understanding and field compliance to the Vopak Fundamentals on Safety was launched across Asia. This program will run also into 2013.
In the area of sustainability, we reduced our energy consumption by 2% in 2012. One change was the switch to LED lights in some of our facilities. In 2013, we aim for further energy savings. We are also looking at ways to reduce physical waste and, in particular, to lower our hydrocarbon emissions. As an example, we explore the use of geodesic rooftops for floating roof tanks and emission control systems to reduce hydrocarbon emissions.”
Employees
“Given the rapid growth in Asia, one of our challenges is to develop and retain the right people now and for the future. That is why we continue to invest in training and nurturing talent.
To this end, we have developed the Learning Management System, which consolidates and standardizes all our technical training. The system can be used to train in skills and develop competencies whereby employees can access it anywhere, anytime. Originated in Singapore and rolled out in Indonesia and Australia in 2012, this system, now called My Learning Operations (MLO), will be implemented within Vopak globally in 2013.
Also in Singapore, we initiated a junior leadership program aimed at employees in their first supervisory or people management role. This will be rolled out across Asia in 2013. In addition to these local training initiatives, we also participated in Vopak’s global leadership programs.
We feel satisfied that this continuous focus on talent management is contributing to staff engagement and keeping staff turnover aligned with our strategic objectives.”

Vopak | Annual Report 2012 | 54Vopak | Annual Report 2012 | 54
Our model as a global company driven by local entrepreneurship is perfectly illustrated by our online learning system. First developed and implemented by Vopak Singapore, this innovative training package will now be rolled out in all our terminals worldwide. But it’s not a one-size-fits-all approach; the system can be tailored to the specific requirements of each terminal.
Going global
By Chong Hock Tan

Vopak | Annual Report 2012 | 55Vopak | Annual Report 2012 | 55
Back in 2005, our Singapore business was growing fast. Employees received solid on-the-job training but there was a need to structure and professionalize the process. So Vopak Singapore developed and implemented what was then known as the Learning Management System (LMS).
As well as offering multiple learning modules, the online system also contains assessments tailored to each terminal’s needs, and enables managers to track the learning status of staff, analyze progress in detail and pinpoint particular areas of interest. LMS has appeared to be such a success that it will be adopted worldwide; the new name is My Learning Operations (MLO).
Certain modules are common to all terminals, such as the Vopak Fundamentals on Safety, protective equipment and static electricity. Others, such as trucking or pipeline inspection, are tailored to the services that the individual terminal provides. Local circumstances are also catered for.
“Every terminal is set up slightly differently, depending on its business model. The learning needs are different at every level, and MLO supports that,” explains Chong Hock Tan, Terminal Automation System Engineer at Vopak Singapore.
Coping with contrastsSingapore developed the system for terminals with different automation levels. Some terminals in Singapore use predominantly manual processes; at others, most processes are automated. In each case, the training material – developed by Vopak’s own operational experts – is tailored to the specific terminal’s situation.
“Making this a global project means training material has to be made applicable globally,” says Chong Hock. “For example, the trucking process in Singapore is influenced by the fact that this is a tropical country. Applying this globally, you have to take seasonal changes into consideration.”
“ Every terminal is set up differently, depending on its business model. The learning needs are different at every level, and the system supports that.”
Vopak Indonesia implemented MLO in 2012. The system will be extended across the whole of Vopak in multiple languages by the end of 2013.
Superior sharingA key benefit of MLO is the enhanced ability to share material and experiences. This advantage will mushroom as the system goes global, as will the opportunities it presents for analyzing data from across the organization. “Establishing a global database will make the analysis capabilities very powerful,” Chong Hock says.
Taking MLO global entailed a shared approach that demonstrates two Vopak core values: agility and professionalism. “A global team consisting of representatives from Singapore and Rotterdam worked across two very different time zones,” says Chong Hock. “Only about two hours of our working days overlap.”
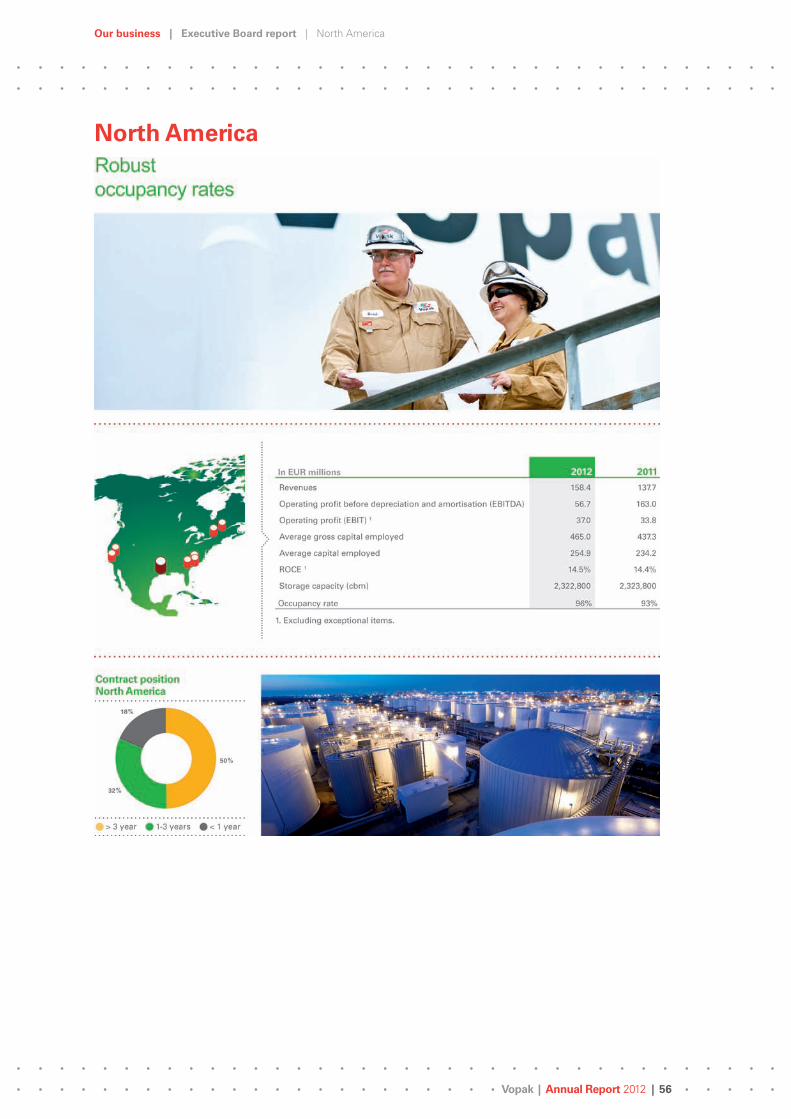
Our business | Executive Board report | North America
Vopak | Annual Report 2012 | 56
North America

Our business | Executive Board report | North America
Vopak | Annual Report 2012 | 57
Key developments
Dick Richelle, Division President North America: “Three important developments are driving our business in North America: the boom in shale gas, changes in crude supply and growing ethanol trade flows.
Shale gas is an increasingly important source of affordable, natural gas in the United States and Canada, where there is plentiful supply. Its use as a cheap feedstock in chemical production is helping the petrochemicals industry to grow. As a result of this growth in shale gas production, North America is now the second-lowest cost producer of ethylene-intensive chemicals globally after the Middle East, driving strong export demand. Liquid petrochemicals stored for export, as well as local distribution, boosted occupancy at Vopak’s North American terminals during 2012 to 96% from 93% in 2011.
The source and composition of North American crude supply is shifting. Refineries use different crudes as feedstock, making crude sourcing a global business. Furthermore, the growing availability of crude oils (oil sands, shale oil) in North America is displacing some foreign imports and requires extra investment to reach domestic and international markets. Lastly, consolidation, closures and ownership changes of refineries are driving clean product imbalances.
North America is a market with highly robust petroleum demand. The composition of this market is changing, due to economic drivers and fuel efficiency measures. The increasing importance of ethanol in the energy supply chain is expected to boost ethanol trade flows. A US government mandate requiring different qualities of biofuels to be blended to make ‘greener’ diesel is stimulating product flow, which benefits us. For example, excess ethanol produced in the US is exported, while other qualities have to be imported from countries like Brazil. All of these need to be stored.
Positive developments such as these resulted in a 9% improvement in operating profit -excluding exceptional items- compared to 2011.”
Growth opportunities
“Positive developments in shale gas, crude oil and gas liquids continue, and with them announcements of major investments in new pipelines, rail transfer facilities, refinery upgrades, gas exports and production of ethylene and petrochemicals. These developments are expected to continue driving the expansion of the US petrochemicals industry, which in turn will lead to more exports that need storage and transshipment.
We are also keeping a close eye on developments in Canada, where we expect product flows to increase as refineries expand. This will open opportunities for Vopak to offer storage on both sides of the distribution chain.
To capture these opportunities, Vopak has secured land in strategic ports for future development. This includes two plots with good marine capabilities in the port of Houston, close to our Deer Park facility, and a strategically located plot of land in the port of Perth Amboy, close to New York.”
Customers, service and operational excellence
“In Canada, a local Vopak initiative to investigate new opportunities resulted in attracting a new customer which will improve the performance of our Hamilton terminal near Toronto. We approached an existing global customer with our own market research, showing a gap in the local supply of diesel, gasoline and ethanol. The customer will be filling this gap with the use of our terminal.

Our business | Executive Board report | North America
Vopak | Annual Report 2012 | 58
During 2012, we continued to instill the Lean philosophy through training to further improve operational accuracy in areas such as energy efficiency, process safety and general service. We also improved our internal structure to ensure better control and more streamlined processes.
Better operational accuracy – doing the right things right the first time – leads to fewer mistakes, more satisfied customers and lower costs. As a result of our initiatives on this front, the number and quality of customer reviews improved in 2012, while customer complaints fell.”
Safety and sustainability
“Safety is our top priority. We put great effort into ensuring all our people continue to be safety-conscious. This continued to pay off in 2012: for the third consecutive year, we had zero lost time accidents for our own personnel in North America. Two of our terminals – in Montreal and Savannah – have operated for 17 and 18 years respectively without any time lost due to personal accidents. Six out of nine terminals remained incident-free.
Key to this are the Vopak Fundamentals on Safety, which set minimum standards for operational activities such as product transfer, managing change, working at heights and others. We made considerable progress in intensifying our focus on these in 2012, with a significant reduction on process and personal safety issues.
We continue to invest in being a better operator within our local communities. This includes investing in better equipment to treat effluent, insulating more storage tanks to save energy on heating and installing equipment to monitor and regulate our energy use.
In the aftermath of hurricane Sandy, volunteers from all our North American terminals collected and shipped key materials to New Jersey to help rebuild the devastated area.”
Employees
“Vopak is gearing up for growth in North America and we took steps to strengthen our organization in 2012, in order to have the right people with the right competencies to lead us into the future. To this end, we launched a management trainee program in North America and we continue to focus on developing our (new) employees to fill gaps in our ‘bench strength’, people that are ready to develop opportunities and take up future leadership positions.”
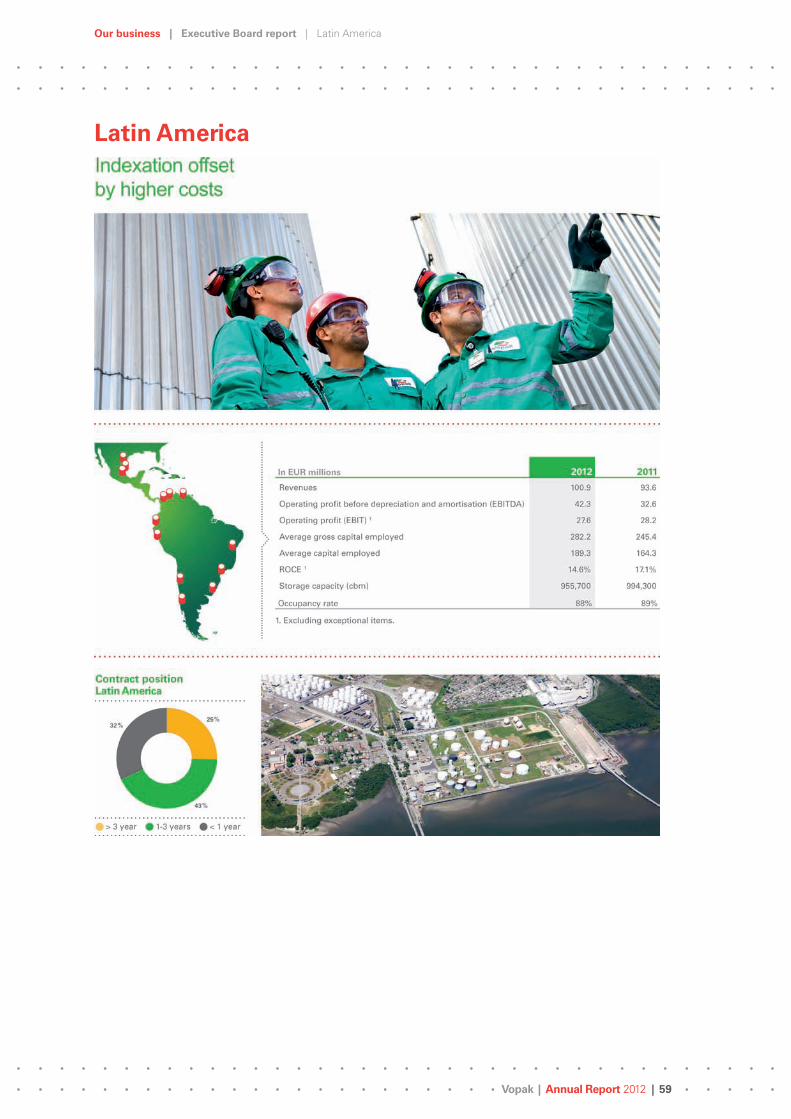
Our business | Executive Board report | Latin America
Vopak | Annual Report 2012 | 59
Latin America
Our business | Executive Board report | Latin America
Vopak | Annual Report 2012 | 60
Key developments
Jos Steeman, Division President Latin America: “The business environment in many Latin American countries is improving as populations grow, people become more affluent and manufacturing increases to meet rising consumer demand.
Rich in natural resources, the region’s economy is boosted by commodity exports: Argentina is the world’s largest producer of soya oil, and proven oil reserves are growing in Colombia, Peru and Brazil, and not to mention Venezuela’s vast oil reserves.
Sharply increasing car use, as the middle class expands, is stoking demand for fuel and lubricants across the continent. This also benefits the biofuels industry, with countries such as Brazil exporting and importing large quantities of ethanol.
Yet the global economic slowdown has not left the region unscathed. Export markets are stuttering and the region’s chemical industry is under competitive pressure as Gulf Coast production of shale gas provides cheap feedstock for US chemicals companies. High inflation, dense bureaucracy, the complexities of concession agreements and protectionist tendencies in many Latin American countries are challenges for companies, such as Vopak, which are proponents of free trade.
Despite a capacity reduction due to the expiration of the concession of the terminal Ilha Barnabé (Brazil) in August 2012, revenues improved by 8% to EUR 100.9 million, driven by indexation.”
Growth opportunities
“We continued to increase Latin American capacity in 2012, with expansion clearly focused on the chemicals and vegetable oil markets. We commissioned additional capacity of 15,800 cbm for the storage of chemical products in Altamira (Mexico) and additional capacity in San Antonio (Chile). However, these expansions were offset by the closure of our terminal in Ilha Barnabé (Brazil).
A key development was the long-term agreement with a customer to expand storage capacity for the new acrylates plant that it is being build near our Brazil Aratu terminal. We also began expanding capacity on a small scale at Cartagena and Barranquilla (Colombia) and started preparing for further small expansions in Venezuela and at our Alemoa terminal in Santos (Brazil) by 37,000 cbm for chemicals. We are exploring the possibility of an oil storage terminal in Panama, which would create new capacity at the international trade crossing near the Atlantic entrance to the Panama Canal.
We halted operations of our terminal in Ilha Barnabé in August at the request of the port authorities, pending the outcome of the tender process to renew the contract and relevant court cases.”
Customers, service and operational excellence
“Customer satisfaction remains an area of high attention for Latin America. Surveys indicate that our customers value our quality of service and attention to detail. For example, in some of our markets we ensure kosher vegetable oils can be stored and transported through our infrastructure.
In Peru, we have doubled the throughput for LPG - which is used increasingly in the Lima area, with demand outstripping supply - by streamlining the logistics process and accelerating the truck turnaround time. To achieve operational improvements such as this, we continue to use the Lean methodology to good effect.

Our business | Executive Board report | Latin America
Vopak | Annual Report 2012 | 61
In Colombia, we have begun a number of small projects to help palm oil producers meet export demand by accommodating their production volumes, which are increasing once more after disease ravaged the sector some years ago.
We are constantly reviewing our processes to ensure they are as aligned as possible to customer needs. During the year we focused on improving the truck turnaround times specifically.”
Safety and sustainability
“We maintained our strong safety record in 2012 and invested heavily both in implementing the Vopak Fundamentals on Safety and in behavioural aspects of safety, which we are committed to improving even further.
On sustainability, the chemical industry in Latin America operates the Responsible Care program, a voluntary initiative developed by the industry itself. We are involved in this program in Chile, Ecuador, Colombia and Brazil. We are keen to gain this certification - which is comparable with the ISO methodology but is more focused on sustainability - wherever we can.
In addition, we are developing processes to ensure we can measure our emissions and use of water and electricity, and reduce these in coming years. Whenever we build new capacity, we use state-of-the-art technology to minimize use of resources.”
Employees
“We continue to invest in talent management, training and development. Our employees are highly committed to helping us deliver on our promises to customers and the environment.
Although our individual country operations are closely attuned to their local environment, they share much operational, safety and commercial information across borders.
We spread knowledge both electronically and physically, with supervisors from terminals in one country periodically helping those in another, for example. This also crosses continents: safety experts from Vopak in Mexico travelled to Spain to train employees there in their own language in preparation for the start-up of the terminal in Algeciras.”

Vopak | Annual Report 2012 | 62Vopak | Annual Report 2012 | 62
Vopak Peru did all in its power to facilitate a customer request to double its throughput for Liquid Petroleum Gas (LPG) at the Callao Terminal, making it happen in less than a month and at minimal cost.
Lean and mean
By Cristhian Perez

Vopak | Annual Report 2012 | 63Vopak | Annual Report 2012 | 63
Demand for LPG in Peru is outstripping supply, particularly as an affordable cooking fuel. When a major Vopak customer decided to double its LPG business with immediate effect, the Callao Terminal was faced with the challenge of how to facilitate this.
“Timescales were tight: we only had three weeks, so we had to meet this challenge fast and without huge investment,” explains Cristhian Perez, Managing Director Peru. “We set up a project team involving staff from operations, safety, finance, the commercial and technical sides, to find ways to make the necessary infrastructure changes at minimum cost,“ says Cristhian.
Operational improvementsUsing Lean methodology, the team identified bottlenecks in the hardware and found ways to streamline the logistics process. This yielded operational improvements that accelerated the truck turnaround time and doubled the throughput. They also consulted closely with the customer to understand their exact requirements, such as the number, size and frequency of the trucks that would be coming to the terminal to load LPG.
“ We’ve added value to our operations, improved customer satisfaction and increased profitability”
“For three weekends we worked around the clock on the terminal to make the changes to the hardware,” Cristhian says. This included replacing the main piping system, increasing the diameter of the pipes, replacing hose connections and modifying vapor systems to prevent emissions.
The team in Peru shared best practice with Vopak’s LPG experts on a global level. This helped them devise innovative ways to improve the LPG processes - for example, changing the way trucks are loaded to increase speed.
Safety firstThe changes were carried out safely and without a single incident, despite the speed at which they were done and the fact that LPG is a highly flammable product. In addition, there was no service disruption to any other customers using the terminal during that period. This testified to the professionalism involved. “We are very proud of what we achieved, and how quickly we did it,” Cristhian says. “It has added value to our operations, improved customer satisfaction and increased profitability.”

Our business | Executive Board report | Global LNG
Vopak | Annual Report 2012 | 64
Global LNG
Our business | Executive Board report | Global LNG
Vopak | Annual Report 2012 | 65
Key developments
Dirk van Slooten, Global Director LNG: “LNG is a relatively new market for Vopak, one we explore since the beginning of this century. In 2011, LNG became an operational business unit of Vopak, rather than a business development department. Together with joint venture partners, we have two terminals, Gate terminal (the Netherlands) and Altamira - TLA - (Mexico), with a combined storage capacity of 840,000 cubic meters and a total throughput capacity of 19.4 billion cubic meters per annum (bcma).
Gate terminal is ideally located for access into the Northwest European market. TLA is attractively located on Mexico’s east coast, making it easy to import LNG into the country and potentially serve the nearby islands in the future. Gate terminal has an annual throughput capacity of 12 bcma - one third of the total Dutch market - and TLA of 7.4 bcma. Both terminals are occupied and contracted with long-term contracts.
Gas is of prime importance to many national governments, who want security of supply for their country via an independent energy source unconnected to their normal pipeline network. We therefore put major effort into convincing governments to see us as a credible partner. We create partnerships with local (infrastructure) companies to enter new markets. Our joint venture partners, such as Gasunie for Gate terminal in the Netherlands and Enagas in Mexico, are independent, trusted players in their markets, with the necessary knowledge and contacts with the local authorities.
Gas is abundantly available globally, accessible and affordable. For this reason, liquefaction facilities are being constructed near new gas production areas and receiving terminals are opening up worldwide. Gas is the cleanest fossil fuel and therefore environmental benefits are pushing consumers towards using natural gas, either to generate power for domestic use or as transportation fuels. Gas is also ideal for use in combination with wind and solar power, as gas generators can be switched on and off as required.
For example, the introduction of the Emissions Control Area (ECA) requires all ships in the North Sea, Baltic Sea, Gulf of Mexico and off the US East Coast to use clean fuel with very low emissions, making LNG a preferred solution. In the Netherlands, the so called Green Deal initiative aims to promote the use of natural gas in both road transportation as well as using gas as a bunker fuel for coasters and barges.
The Fukushima nuclear disaster in 2011 drove up demand for LNG in Japan, sending prices in the Far East rocketing. At the same time, the boom of the shale gas industry in the US led to a decline in imports of natural gas to the US, but triggered US exports. These developments spurred Vopak’s decision to accelerate its activities in developing LNG terminals.
Vopak’s strategy is to create hub terminals, such as Gate terminal and TLA, for the import, but also to redistribute LNG in smaller quantities to satellite terminals for distribution to local markets. This is what we call our break bulk model. In 2012, Vopak and gas infrastructure company Gasunie signed an agreement with Shell as launching customer for the LNG Break Bulk terminal we plan to build in Rotterdam. The terminal plans to facilitate small-scale LNG distribution in Northwest Europe and make LNG available for distribution to marine bunkering and truck fuelling stations.”
Growth opportunities
“Vopak is the first company to develop the break bulk concept - in Rotterdam initially - and we are working to expand this to other strategic locations. In France, we are working with our partner Shell on a feasibility study to develop the Fos Faster LNG Terminal at Fos-sur-Mer (Marseille), to serve the southern European market. It has a planned capacity of around 8 bcma, more than 15% of France’s annual gas consumption.
As an addition to our Gate terminal in Rotterdam, we are conducting feasibility studies for satellite terminals in Gothenburg (Sweden) and Tallinn (Estonia). The latter has the potential to develop into a hub

Our business | Executive Board report | Global LNG
Vopak | Annual Report 2012 | 66
terminal itself. Developing satellite terminals usually takes a minimum of two to three years before they are operational from the start of the construction.
Growing populations with increasing energy demands are fueling the need for additional energy sources such as gas. To meet this demand, we are analyzing suitable locations and initiating contact with national authorities to establish Vopak as a credible and reliable operator and partner in the LNG market. We are looking worldwide at possible locations, notably in the Far East.”
Customers, service and operational excellence
“We are using the experience we gained in 2012, our first full year of operation, to improve our standards and procedures to the benefit of future operations.
Gate terminal was named LNG Project of the Year at the 2012 European Gas Conference in Vienna. The jury said the terminal would ‘serve as an independent distribution point for European energy companies to address the rising demand for and declining production of natural gas in Northwest Europe. The terminal will both increase the security of supplies as well as enable new players to enter the European gas market’.
One of our challenges at the start of the first terminal (Gate terminal) was preparing an annual unloading schedule for multiple customers for the full year ahead, including the inevitable conflict resolutions. We now know which ships will be discharging and when for the next 12 months.
The LNG market is still developing; globally, there are only two or three players that could be considered to be independent, open-access, multi-customer terminal operators. Moreover, we lead as an initiator of the break bulk concept.
So far, informal surveys show our customers are very satisfied with the services we deliver. We will conduct our first formal measurement of customer satisfaction, via the company-wide NPS survey, in 2013.”
Safety and sustainability
“We reported two process incidents at Gate terminal to the authorities. There were no injuries and the impact on the environment and local community was minimal.
TLA achieved nine million working hours - in a period of ten years - without a single lost time incident, including construction of the terminal. Although LNG operations is a highly industrialized process being executed very safe, we will step up our safety training to ensure we maintain this exemplary record, also once our satellite terminals become operational and we start loading onto trucks and barges.
Regarding sustainability, our LNG operations are almost emission-free. For example, we use excess hot water from a nearby power plant to regasify the LNG. The LNG market itself is driven by environmental initiatives such as the Green Deal in the Netherlands, which aims to reduce emissions from trucks in cities, and on the shipping side, switching to LNG in Dutch ports and rivers. Vopak is an active participant in these Green Deal initiatives.”

Our business | Executive Board report | Global LNG
Vopak | Annual Report 2012 | 67
Employees
“With around 150 employees worldwide, Global LNG is still a small part of Vopak, but is growing, with new projects under development. Our staff is motivated and energized by the challenges of setting up our operations and by flawless execution as we strive to continuously improve our processes and capabilities. Our development of employees is linked into that of the global staff and other divisions. We intend to introduce a management development program in 2013.”

Vopak | Annual Report 2012 | 68Vopak | Annual Report 2012 | 68
LNG is a growing market with huge potential. Vopak works closely with local partners to enter new markets and develop LNG terminals in strategic locations.
LNG partnerships
By Joop Jonkers
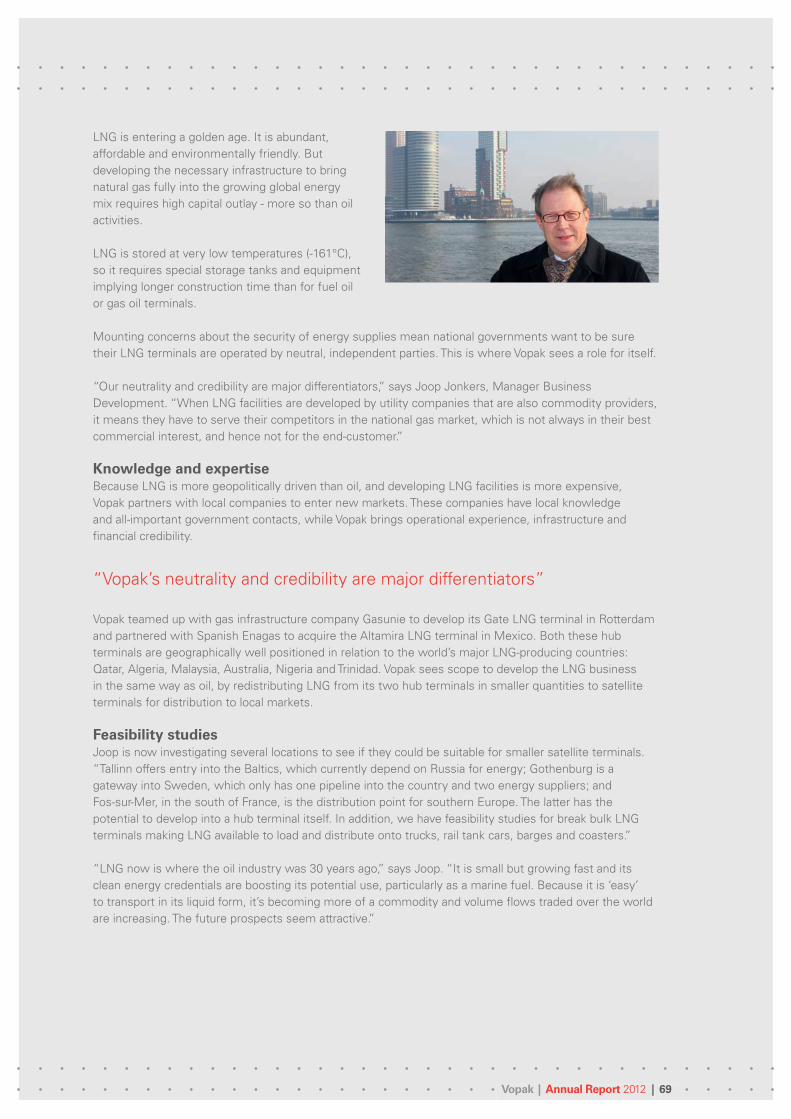
Vopak | Annual Report 2012 | 69Vopak | Annual Report 2012 | 69
LNG is entering a golden age. It is abundant, affordable and environmentally friendly. But developing the necessary infrastructure to bring natural gas fully into the growing global energy mix requires high capital outlay - more so than oil activities.
LNG is stored at very low temperatures (-161°C), so it requires special storage tanks and equipment implying longer construction time than for fuel oil or gas oil terminals.
Mounting concerns about the security of energy supplies mean national governments want to be sure their LNG terminals are operated by neutral, independent parties. This is where Vopak sees a role for itself.
“Our neutrality and credibility are major differentiators,” says Joop Jonkers, Manager Business Development. “When LNG facilities are developed by utility companies that are also commodity providers, it means they have to serve their competitors in the national gas market, which is not always in their best commercial interest, and hence not for the end-customer.”
Knowledge and expertiseBecause LNG is more geopolitically driven than oil, and developing LNG facilities is more expensive, Vopak partners with local companies to enter new markets. These companies have local knowledge and all-important government contacts, while Vopak brings operational experience, infrastructure and financial credibility.
“Vopak’s neutrality and credibility are major differentiators”
Vopak teamed up with gas infrastructure company Gasunie to develop its Gate LNG terminal in Rotterdam and partnered with Spanish Enagas to acquire the Altamira LNG terminal in Mexico. Both these hub terminals are geographically well positioned in relation to the world’s major LNG-producing countries: Qatar, Algeria, Malaysia, Australia, Nigeria and Trinidad. Vopak sees scope to develop the LNG business in the same way as oil, by redistributing LNG from its two hub terminals in smaller quantities to satellite terminals for distribution to local markets.
Feasibility studiesJoop is now investigating several locations to see if they could be suitable for smaller satellite terminals. “Tallinn offers entry into the Baltics, which currently depend on Russia for energy; Gothenburg is a gateway into Sweden, which only has one pipeline into the country and two energy suppliers; and Fos-sur-Mer, in the south of France, is the distribution point for southern Europe. The latter has the potential to develop into a hub terminal itself. In addition, we have feasibility studies for break bulk LNG terminals making LNG available to load and distribute onto trucks, rail tank cars, barges and coasters.”
“LNG now is where the oil industry was 30 years ago,” says Joop. “It is small but growing fast and its clean energy credentials are boosting its potential use, particularly as a marine fuel. Because it is ‘easy’ to transport in its liquid form, it’s becoming more of a commodity and volume flows traded over the world are increasing. The future prospects seem attractive.”

Vopak | Annual Report 2012 | 70
Our Governance

Our governance | Supervisory Board report | Supervision
Vopak | Annual Report 2012 | 71
Supervisory Board report
Supervision
The Supervisory Board met nine times during 2012. It held six regular meetings and three ad hoc conference calls regarding investment proposals. None of the Supervisory Board members was frequently absent from the Supervisory Board meetings. Attendance at regular meetings was 100% while the average attendance on the three conference calls was 89%. When a Supervisory Board member was unable to join a conference call at the scheduled time, their input was obtained beforehand.
As part of the Supervisory Board’s responsibilities it discussed Vopak's strategy during a two-day session held in Panama City (Panama). During these meetings, the Supervisory Board members discussed the feasibility status of the Panama greenfield and expansion project and paid a visit to the Panama Canal.
The Supervisory Board discussed and approved the 2013 budget, quarterly reports and various investment proposals related to global expansion and greenfield projects. These include investment proposals relating to the Vlaardingen terminal in the Netherlands; a 30% non-controlling interest divestment in Vopak Terminal Durban to our partner Reatile in South Africa; the joint venture between Vopak, Greenergy and Shell to purchase the assets of the former Coryton refinery in the United Kingdom; an investment proposal for the Alemoa terminal in Brazil; a joint investment by Vopak and Sabic in a new terminal project in Saudi Arabia; an investment proposal for the Penjuru terminal in Singapore; the Fuel II project in Durban (South Africa); and the divestment of a plot of land in Yalova (Turkey). The Supervisory Board also reviewed the progress of on-going projects and the pipeline of new projects.
The Supervisory Board discussed a number of recurring topics at each meeting. Among these were safety, health, environmental and sustainability issues; the company's other operational and financial objectives; pensions; financing of the company; financial reports; the Sustainability Report 2011; succession planning for senior management; and the company's response to the spearheads letters received from Dutch corporate governance platform Eumedion and the Vereniging van Effectenbezitters (Dutch Investors Association) regarding topics they want to put on the agenda of Vopak's 2013 AGM.
There were external auditors present at the meetings where the annual results and unaudited half-year results were discussed. The interim report and auditors’ report issued by the external auditors were also reviewed during those meetings. The minutes of all the meetings of the Audit Committee, Remuneration Committee and the Selection and Appointment Committee were also considered and shared with the Supervisory Board. The Supervisory Board discussed the design and operation of the company’s risk management and control systems. At a meeting not attended by the Executive Board members, the Supervisory Board discussed the performance of the Executive Board and the proposal by the Remuneration Committee for the remuneration of the Executive Board.
The Supervisory Board evaluated its own performance in its December 2012 meeting and that of the Board Committees. The evaluation included topics such as the composition and desired profile of the Supervisory Board, its working method and the relationship between the Executive Board and the Supervisory Board. The outcome of the evaluation of its performance, based on an extensive questionnaire completed by all Supervisory Board members, was that it meets the requirements.
Composition of the Supervisory BoardThe Supervisory Board consists of six members: Anton van Rossum (Chairman), Martijn van der Vorm (Vice-chairman), Frans Cremers, Carel van den Driest, Chun Kai Lam and Rien Zwitserloot. For more information on our Supervisory Board members, see page 167 of this report.

Our governance | Supervisory Board report | Audit Committee
Vopak | Annual Report 2012 | 72
Audit Committee
The Audit Committee met five times in 2012. External auditors attended all of these meetings. A core task of the Audit Committee was to extensively review the financial reports and the budget before their consideration by the full Supervisory Board. The committee also discussed topics related to Vopak’s financing structure, analyses of the financial ratios, pensions, status of legal claims and proceedings, fraud reports, reports on the risks associated with the company’s operational, commercial, financial and other activities and management reporting. It also discussed the Annual Report 2011, Sustainability Report 2011, IFRS developments, credit risk on financial counterparties, the dividend proposal for 2011, spearheads letters from Dutch corporate governance platform Eumedion and the Vereniging van Effectenbezitters (Dutch Investors Association) regarding topics they want to put on the agenda of Vopak’s 2013 AGM and the draft charter of the Vopak Compliance Committee.
The Audit Committee considered the 2012 plan of the external auditor and the Internal Audit department’s plan for 2013, as well as Internal Audit reports during 2012 and the progress realized in implementing recommendations from audits and the Internal Audit work plan. The committee also discussed the scope of the audits, recommendations in the management letters and the current and future relationship with the external auditors. The Audit Committee monitored auditor independence when non-audit services were provided. In compliance with the Dutch Corporate Governance Code (the Code) one meeting was held with the external auditor without the presence of the Executive Board members. Finally, the Audit Committee assessed its own performance throughout the year and its regulations, supported by an extensive questionnaire that was completed and discussed by all its members. The committee’s performance met the requirements in all areas. During 2012, Mr Cremers again acted as financial expert as intended by the relevant best practice provisions of the Code.
Selection and Appointment Committee
The Selection and Appointment Committee met twice in 2012, in April and in December. It discussed the function description of an Executive Board member and the topic of diversity. In addition, it discussed the regulations of this committee and reviewed its tasks and responsibilities.
Remuneration Committee
The Remuneration Committee met four times in 2012. All members were present at these meetings. In addition, it held regular informal consultations. The committee was assisted by an independent external advisor.
The committee developed proposals for the remuneration of the Executive Board, which it submitted to the Supervisory Board for approval. The committee discussed the realization of the pre-set short-term incentive targets for 2011 and the vesting of the long-term incentive plans that ended in December 2011. Furthermore, it prepared proposals for the short-term incentive plan and targets for 2012 and the annual base salary for 2013.
During 2012 the Committee reviewed the current Remuneration Policy focusing on the peer group and the short- and long-term incentive plans, in relation to the strategic challenges of Vopak. Based on the results of interviews held by the external advisor with all its members, the Remuneration Committee concluded that overall the features of the current incentive plans are aligned with the strategy of the company and that the composition of the peer group should be reconsidered from 2013 onwards.

Our governance | Supervisory Board report | Audit Committee
Vopak | Annual Report 2012 | 73
The committee also reviewed the remuneration of the Supervisory Board and reconfirmed its policy to review this once every two years. Since the last review was conducted in 2010, the committee developed a proposal for the remuneration of the Supervisory Board in 2013 and 2014, which takes into account the company’s significant growth, market trends as well as the increasing governance responsibilities. This proposal will be presented to shareholders at the annual general meeting of shareholders in April 2013.
The Remuneration Committee decided to make a limited evaluation of its performance in 2012, as a detailed evaluation was carried out in 2011, which did not lead to substantial changes.
For further details on the remuneration and shareholding position of the Executive Board and the Supervisory Board, please see page 74 of this report.
The Supervisory Board would like to express our sincere appreciation to the Executive Board and all the company’s employees for their efforts in 2012 and for the corresponding improvement in the results. The members of the Supervisory Board have signed the financial statements in order to comply with the statutory obligation pursuant to article 2:101 paragraph 2 of the Dutch Civil Code.
Rotterdam, 28 February 2013
The Supervisory BoardA. van Rossum (Chairman) M. van der Vorm (Vice-chairman) F.J.G.M. Cremers C.J. van den Driest Chun Kai Lam R.G.M. Zwitserloot

Our governance | Remuneration report | Remuneration principles Executive Board
Vopak | Annual Report 2012 | 74
Remuneration report
Remuneration principles Executive Board
The prime objective of Executive Board remuneration at Koninklijke Vopak N.V. (Vopak) is to attract and retain Executive Board members with the right experience and competences to achieve the company’s strategic objectives.
Within this context, the Supervisory Board has defined a total remuneration package that comprises an annual base salary, a short-term incentive, a long-term incentive and a pension plan.
The compensation package balances fixed and variable remuneration, as well as short- and long-term variable remuneration, with a relative emphasis on long-term variable remuneration. This emphasis is aligned with the company’s long-term strategy, which requires multi-year decision making on terminal investments and often longer-term contracts with customers. The variable remuneration is subject to predefined ambitious performance targets being realized.
The Remuneration Committee defines the total compensation levels of Vopak’s Executive Board members by comparing it to companies similar to Vopak in terms of international coverage, nature of the business, size (financial parameters), business development and capital intensity. The committee uses the ‘median’ of the peer group as its reference point. It also uses compensation surveys of remuneration consultancy firms as secondary reference.
In addition to the external consistency of the remuneration package, the Supervisory Board considers the internal consistency to be important, recognizing that this is the responsibility of the Executive Board. The structure of the total remuneration package for the Executive Board members is aligned with the total remuneration packages in the organization’s next layers of management.
The Supervisory Board encourages Executive Board members to build and hold a portfolio of shares in the company to align their interests with those of Vopak’s shareholders.
The recommendations in the Code are taken into account when deciding on the remuneration of the Executive Board. Specifically, the fullest possible transparency of the total remuneration package is ensured by a clear explanation of the remuneration policy in the company’s annual report and the fact that the variable (short and long-term) remuneration, to the extent it relates to financial performance, is based on data audited by the company’s auditor and published in the annual report.
To safeguard shareholders’ interests, the Supervisory Board regularly undertakes risk assessments based on various scenarios of several parameters of the remuneration policy. Furthermore, all performance-based incentives are subject to a claw back provision that applies should the company be obliged to make a financial restatement. The claw back provision covers a three-year period following the date of reward. During this period the Supervisory Board may decide to adjust the variable remuneration upwards or downwards. In addition, the Supervisory Board has the discretionary power to decide, in exceptional situations, to adjust individual variable remuneration upwards or downwards, taking into account this should be done in a fair and reasonable way. During 2012, the Supervisory Board did not use its discretion to deviate from the established policy with regard to both the short and long-term incentives.
A last remuneration principle is that Executive Board members will not receive any personal loan, advance or guarantee from the company.

Our governance | Remuneration report | Remuneration policy Executive Board
Vopak | Annual Report 2012 | 75
Remuneration policy Executive Board
In 2012, the Supervisory Board decided to continue the remuneration policy established in 2010 for the Executive Board. The Supervisory Board does not anticipate any adjustment to the policy for 2013 with regard to the structure of the package and defined minimum, target and maximum incentive opportunities.
The table below shows a summary of the structure of the policy:
Component Type of remuneration
Term Performancecriterion
Remuneration as % of annual base salary
Annual base salary Cash Monthly
Short-term incentive Cash Annually 50%: EBITDA growth 1
50%: non-fi nancials Min Target Max
Chairman: 0% 50% 75%Member: 0% 45% 67.5%
Long-term incentive Shares and cash One-off grant for period 2010 - 2013
EPS growth Min Target Max 2
Chairman: 0% 70% 100%Member: 0% 55% 82.5%
Pension Cash Annually 18.3% - 26.6% of pensionablesalary (age related)
1. Distribution at target level.2. Annualized values of an award over the four-year period at the date of award, not including the effect of the share price developments
during the performance period.
Peer groupThe peer group that was established in 2011 also applied during 2012. It is the intention to review it for 2013 as Vopak has grown substantially in enterprise value and EBIT over the past several years. The peer group comprised of the following companies:
Peer group 2011 & 2012
Arcadis Corio DSM Nutreco
Boskalis CSM Fugro Randstad
BAM Dockwise Imtech SBM Offshore
Total remuneration packageThe total remuneration package consists of the annual base salary, the short- and long-term incentive and a pension plan.
Annual base salaryThe fixed component of the remuneration package is determined by taking into account comparable levels in peer group companies as well as data from remuneration surveys.
Short-term incentiveThe short-term incentive is paid if ambitious predefined financial and non-financial objectives are met. These objectives have an equal weight at the ‘at target’ level. The financial target is related to the realized earnings before interest and tax, depreciation and amortization (EBITDA); excluding exceptional items. The target, minimum and maximum levels are defined and set out in a performance-incentive matrix. In addition, the Supervisory Board has a plus/minus 10% discretion on the calculated financial incentive result to reflect the quality of the company’s financial result.
The non-financial targets cover personal and process safety (one third), employee engagement (one third) - this alternates every year with customer satisfaction - and the overall effectiveness of the Executive Board

Our governance | Remuneration report | Remuneration policy Executive Board
Vopak | Annual Report 2012 | 76
as assessed by the Supervisory Board (one third). This reflects the cooperation between the Executive Board members, and between the Executive Board and the next management layers to ensure the effective implementation and realization of the strategic objectives.
The financial and non-financial targets are defined by the Supervisory Board at the beginning of each financial year. For commercial and competitive reasons, the specific targets are not disclosed. However, the realized percentages per element are shown in the table of the short-term incentive in the next section of this report.
Long-term incentiveThe long-term incentive rewards the Executive Board for sustained value growth of the company over a multi-year period. The Long-Term Share Plan (LTSP), conditionally awarded in 2010 as a one-off award for a four-year period, encourages the Executive Board to pursue a strategy that focuses on long-term profitable growth measured by earnings per share (EPS) growth during the performance period (2010-2013). In addition to EPS improvement, the actual value of the long-term incentive will also be based on the development of the Vopak share price during the plan period. After the end of the performance period, 50% of the incentive is settled in Vopak shares and 50% in cash.
The LTSP 2010-2013 succeeds the long-term share plans that were awarded on an annual basis since 2007. These plans comprise the Performance Share Plans 2008 and 2009 and the Share Matching Plans 2007, 2008 and 2009.
With the introduction of the LTSP in 2010, it was agreed to vest the 2007, 2008 and 2009 plans at the end of the respective plan periods in accordance with the plan conditions as stated at the beginning of the plan period. As a result, these plans will phase out over the next few years. The table below illustrates the performance periods for the various share plans and the year of actual award marked with x. The first actual award of performance shares took place in 2011 and the final actual award of matching shares will take place in 2014.
Long-term incentive plan Start Plan period and year of actual award (x)
2007 2008 2009 2010 2011 2012 2013 2014
Performance Share Plan 2008 X
Performance Share Plan 2009 X
Share Matching Plan 2007 X
Share Matching Plan 2008 X
Share Matching Plan 2009 X
Long Term Share Plan 2010 X
The LTSP 2010-2013 will also vest in 2014. The actual award of performance shares under this plan must be held in a deposit for a period of two years after which they will become freely available. Note 26 to the Consolidated Financial Statements provides further financial details of the vested and outstanding long-term incentive plans.
From a risk management perspective, a ‘change in control’ provision is incorporated in the long-term incentive plan. In the event of a significant change in the structure of all or part of the company, resulting from a merger, take-over, sale, divesture or similar transaction, the outstanding long-term incentive plans will be settled on a pro-rata basis, subject to the discretion of the Supervisory Board. To ensure independent management decisions and avoid undue value inflation in such a situation, the average share price over the quarter preceding the date of the press release announcing the intended transaction will be used to calculate the long-term incentive.
Pension The pension plan for Vopak’s Executive Board members is a defined contribution plan, with board members annually receiving a cash amount for the purpose of accruing an old-age pension and insuring

Our governance | Remuneration report | Actual remuneration 2012 (audited)
Vopak | Annual Report 2012 | 77
death and occupational disability risks. Depending on their age, the pension contribution to be granted to board members ranges between 18.3% and 26.6% of their pensionable earnings. These percentages are aligned with the maximum percentages provided by the Dutch tax authority for defined contribution pension plans.
Under the pension plan, the retirement age has been set at 65. In accordance with previous contractual arrangements made with Mr J.P. de Kreij in 2003, his employment contract provides for retirement at the age of 60. The implications of recent changes to Dutch retirement age legislation will be reviewed during 2013.
ShareholdingTo ensure alignment between Vopak shareholders and the Executive Board, board members are encouraged to build up and maintain a portfolio of Vopak shares equal to one gross annual base salary. This share portfolio can be build up by shares acquired as long-term variable remuneration and/or by purchasing shares at the board member’s own expense.
Employment contractExecutive Board employment contracts are governed by Dutch employment law and aligned with the current Dutch Corporate Governance Code, except for the provisions made in the employment contract of Mr De Kreij. Executive Board members are appointed for a term of four years. The contract ends by notice given by either party (six months for the employee and twelve months for the employer) or automatically at retirement. The employment contract provides for a compensation for the loss of income resulting from a non-voluntary termination of employment limited to one annual base salary, unless this termination is due to misconduct or resignation of an Executive Board member.
If an Executive Board member leaves the company at its own initiative or is discharged by the Supervisory Board, all rights to ongoing short and long-term incentive plans will expire.
Actual remuneration 2012 (audited)
The table below shows the actual remuneration of the Executive Board members in 2012.
The total remuneration for the Executive Board members in 2012 was EUR 4.6 million (2011: EUR 2.9 million). The increase as compared to 2011 primarily relates to the actual award of performance shares and matching shares after the vesting of the long-term incentive plans 2009 (performance shares) and 2007 (matching shares) in 2012.
Annual base salary
Short-term incentive
Long-term incentive 1 Pension Total
In EUR thousands 2012 2011 2012 2011 2012 2011 2012 2011 2012 2011
E.M. Hoekstra 525 450 350 241 343 162 102 75 1,320 928
J.P. de Kreij 470 450 282 217 1,583 426 136 133 2,471 1,226
F. Eulderink 435 410 261 197 n.a n.a. 118 96 814 703
Total 1,430 1,310 893 655 1,926 588 356 304 4,605 2,857
1. The value of actual awards based on the closing share price at the day of the AGM 2012. The related cost of the long-term incentive per Executive Board member, for the financial year, are disclosed in note 26 to the Consolidated Financial Statements.

Our governance | Remuneration report | Actual remuneration 2012 (audited)
Vopak | Annual Report 2012 | 78
Annual base salaryThe 2012 base salary for Mr Hoekstra was increased to EUR 525,000 following a three-year growth model that started at his appointment. The increases for Mr De Kreij and Mr Eulderink followed the development of the peer group reference level.
Short-term incentiveThe table below shows the realization of the short-term incentive for the financial year.
Opportunity 1 Result as % of base salary 1
Total in EUR
Target Max Financial Safety Engagement Effectiveness Total
E.M. Hoekstra 50% 75.0% 50% 0% 8.33% 8.33% 66.66% 349,965
J.P. de Kreij 45% 67.5% 45% 0% 7.50% 7.50% 60.00% 282,000
F. Eulderink 45% 67.5% 45% 0% 7.50% 7.50% 60.00% 261,000
1. % of annual base salary 2012.
The 2012 financial targets of the short-term incentive plan and the non-financial targets relating to employee engagement and overall Executive Board effectiveness were all maximally achieved. The EBITDA -excluding exeptional items- significantly improved with 20% from EUR 636 million to EUR 764 million. The employee engagement survey amongst all Vopak employees (response rate 89%) showed an improved result compared to the achievement in 2010, which was already a very good result compared to the external benchmark. Specifically, the leadership criterion, which was selected a special target for 2012, showed a significant improvement. Furthermore the assessment by the Supervisory Board of the team effectiveness of the Executive Board was very good. A fatal accident in Malaysia in June and a second in China in December, reduced the safety element of the short-term incentive to zero, even though the safety targets were met in terms of personal and process safety.
Long-term incentiveAfter the approval of the Financial Statement 2011 by the AGM in April 2012, actual performance shares were awarded to the Executive Board members participating in the Performance Share Plan 2009-2011 and the Share Matching Plan 2007-2011.
Performance shares for the Performance Share Plan 2009-2011 were actually awarded, resulting from an EPS -excluding exceptional items- growth during the three year plan period from EUR 1.62 to EUR 2.16. According to the performance incentive matrix as defined at the start of the plan, this increase resulted in a vesting percentage of 137% (max 150%) of the conditionally awarded performance shares at the start of the plan. The following table shows the performance shares, awarded conditionally and actually in both number and value of shares.

Our governance | Remuneration report | Actual remuneration 2012 (audited)
Vopak | Annual Report 2012 | 79
Performance Share Plan 2009-2011
Number of conditionally awarded performance
shares
Number of actually awarded performance
shares
Value of actually awarded performance
shares in EUR 1
Current Executive Board membersE.M. Hoekstra 2 5,154 7,061 343,447
J.P. de Kreij 14,722 20,169 981,020
Former Executive Board memberF.D. de Koning 3 13,856 8,437 410,376
1. Value based on the closing share price (EUR 48.64) at the day of the AGM 2012. 2. Mr Hoekstra received performance shares in his previous capacity as Division President Asia. Since Mr Eulderink was not employed
by Vopak at the start of the plan period he was not eligible to receive any reward under this plan. 3. Mr De Koning received as former Executive Board member a pro-rata amount of performance shares related to the plan participation
period until his retirement in April 2010.
The actually awarded matching shares for the Share Matching Plan 2007-2011 resulted from an EPS – excluding exeptional items – growth during the five-year plan period from EUR 0.98 to EUR 2.16 resulting in a vesting percentage of 183% (max 200%) of the personally invested and retained shares. The table below shows the invested shares and actually awarded matching shares in both number and value of shares.
Share Matching Plan 2007-2011
Number of invested shares
Number of actually awarded matching shares
Value of actually awarded matching
shares in EUR 1
J.P. de Kreij 6,760 12,371 601,725
1. Value based on the closing share price (EUR 48.64) at the day of the AGM 2012.
Since Mr Hoekstra and Mr Eulderink were not board members at the start of the plan period, they were not eligible to receive any matching shares under this plan. Since the Share Matching Plans for Mr De Koning were settled in 2011, he did not receive any award under this plan during 2012.
Share ownershipThe current share portfolios of the Executive Board members are shown in the next table. This overview includes both unrestricted shares (actually awarded and personally invested) and restricted shares: personally invested shares restricted under the Share Matching Plan 2008 and 2009. The overview does not include the conditionally awarded shares for which the performance period has not ended.
All transactions were performed at the own account and risk of the Executive Board members concerned.

Our governance | Remuneration report | Remuneration Supervisory Board (audited)
Vopak | Annual Report 2012 | 80
Number of shares
2012 2011
Unrestricted shares
Restricted shares
Total shares year-end 1
Total shares year-end
E.M. Hoekstra 2 11,532 4,306 15,838 11,683
J.P. de Kreij 304,764 25,958 330,722 312,990
F. Eulderink 3 750 – 750 750
1. The market value of the Vopak share at year-end 2012 is EUR 53.31 per share.2. The restricted shares are personally invested shares for the Share Matching Plan before Mr Hoekstra’s Executive Board appointment.3. The unrestricted shares are personally invested shares to build the requested portfolio of Vopak shares after Mr Eulderink’s
appointment in 2010 and are not related to any long-term incentive plan.
Remuneration Supervisory Board (audited)
The remuneration payable to the Supervisory Board for the calendar years 2011 and 2012 was approved by the shareholders at the AGM in 2011. The table below shows the amounts each member received individually in 2012.
The total remuneration to Supervisory Board members in 2012 was EUR 0.36 million (2011: EUR 0.34 million).
In EUR thousandsSupervisory
BoardAudit
CommitteeNomination Committee
Remuneration Committee Total 2012 Total 2011
A. van Rossum 66.0 – 6.0 6.0 78.0 78.0
M. van der Vorm 47.0 7.5 4.0 – 58.5 58.5
F.J.G.M. Cremers 47.0 13.0 – – 60.0 60.0
C.J. van den Driest 47.0 – – 9.0 56.0 56.0
Chun Kai Lam 1 47.0 – – 6.0 53.0 35.3
R.G.M. Zwitserloot 47.0 7.5 – – 54.5 54.5
Total 301.0 28.0 10.0 21.0 360.0 342.3
1. Remuneration for 2011 relates to period from 27 April 2011, the day of appointment.
Supervisory Board members do not receive any fixed allowance or performance-related incentives. The company reimburses travel cost for Supervisory Board members living outside the Netherlands.
No Supervisory Board member held any shares in Koninklijke Vopak N.V. at year-end 2012, nor at year-end 2011, with the exception of Mr Van den Driest who sold 8,000 Vopak shares during 2012.
No personal loans, advances or guarantees from the company were provided to Supervisory Board members.

Our governance | Corporate Governance | Introduction
Vopak | Annual Report 2012 | 81
Corporate Governance
Introduction
Vopak complies with the vast majority of the principles and best practices laid down in the Dutch Corporate Governance Code, as amended on 10 December 2008 (the Code). The limited number of exceptions to the best practice provisions in 2012, as set out in the chapters below, has increased by one compared to 2011. The exceptions are explained in the next chapters. For our stakeholders, and in accordance with prior recommendations of the Monitoring Committee Corporate Governance Code (the Monitoring Committee), this section includes the various risks and way in which Vopak manages these in our external accountability and reporting on risks and risk management.
Setup and Policy
Vopak aims to strike a sound balance between the interests of the company’s various stakeholders. Integrity, openness, supervision, transparent reporting and accountability are the cornerstones of our corporate governance policy. We have also developed a clear policy towards sustainability. A copy can be downloaded from the Vopak website.
Vopak confirms that the principles reflected in the Code are in line with those applied by Vopak.
Vopak has a two-tier governance structure, consisting of an Executive Board and a Supervisory Board.
The Executive Board is responsible for the management of the company and for the realization of its strategic and other objectives. These include those for health, safety, the environment (part of sustainability), quality, strategy and policy, as well as the related development of results.
The Supervisory Board reviews Vopak’s overall performance, including the policies pursued and results achieved by the Executive Board, the company’s financial situation, as well as its financial statements. The Supervisory Board also reviews the strategy of Vopak, as proposed by the Executive Board. Similarly, it approves important proposals for capital expenditure, acquisitions and divestments, changes in financial and other corporate policies and the annual budget. The Supervisory Board also evaluates the performance of the Executive Board as a whole and of its individual members, and proposes to the AGM any changes to the composition of the Executive Board. Similarly, the Supervisory Board annually reviews its own performance and proposes new appointments and the departure of existing Supervisory Board members to the AGM. Finally, the Supervisory Board ensures the company’s policies are formulated and pursued in the interest of all its stakeholders, including shareholders and employees, and that these policies are sustainable and meet the highest ethical standards.
As Vopak is defined as an international holding company within the context of the Dutch Large Companies Act, it is exempt from the provisions of this Act.
The Supervisory Board is carefully selected to include members with diverse backgrounds and experience in areas relevant to Vopak’s core business and the foreign markets in which it operates. Their experience ranges from economic, financial, technical, operational and social areas, to political and business-related ones. The Supervisory Board, in performing its duties, focuses on the realization of the objectives of the company, the strategy and its implementation. The Supervisory Board appoints an Audit Committee, a Remuneration Committee and a Selection and Appointment Committee from among its members. In accordance with the provisions of the Code, Vopak has further specified the role and powers of these committees in specific regulations for them.

Our governance | Corporate Governance | The Dutch Corporate Governance Code
Vopak | Annual Report 2012 | 82
In addition to the power to appoint, suspend and dismiss members of the Executive Board and Supervisory Board, the AGM has other authorities such as passing resolutions for legal mergers and split-offs, and adopting financial statements and profit appropriation. Furthermore, the AGM determines the remuneration policy for the Executive Board, and has to approve any significant amendments to the policy. The AGM also sets the remuneration of the members of the Supervisory Board. The remuneration of the members of the Executive Board is set by the Supervisory Board on the basis of a proposal from the Remuneration Committee, in accordance with the remuneration policy adopted by the 2010 AGM. Several amendments to the remuneration policy for the Executive Board and the remuneration of the Supervisory Board for 2013 and 2014 will be proposed at the 2013 AGM. Vopak will continue to facilitate proxy voting. As of 1 July 2010, Dutch law provides for a mandatory registration date to exercise voting and attendance rights 28 days before the day of the AGM.
The Dutch Corporate Governance Code
Vopak has evaluated its corporate governance setup against the Dutch Corporate Governance Code (the Code) and concluded that it satisfies the principles and best practice provisions of the Code applied in 2012, with six exceptions – one additional to 2011 - listed below.
1. Best practice provision II.1.1 (appointment of Executive Board members for four years)The term of Mr De Kreij’s contract of employment is not in accordance with this provision. The contract was concluded for an indefinite period of time and before the Code came into effect.
2. Best practice provision III.2.1 (independence of Supervisory Board members)Two members of the Supervisory Board, Mr Van der Vorm and Mr Van den Driest, do not currently satisfy all the independence criteria of the Code, which is not in accordance with this best-practice provision. The Supervisory Board and the Executive Board are of the opinion that both members offer considerable added value to the Supervisory Board.
The added value of Mr Van der Vorm relates to his capabilities, knowledge and experience of managing and investing in internationally-operating companies. Mr Van den Driest has knowledge of logistic services, tank storage activities, the port of Rotterdam and is familiar with the company, having served for many years in different capacities, including as Chairman of the Executive Board up to 1 January 2006, which adds considerable value to the Supervisory Board.
3. Best practice provision II.2.8 (maximum severance pay)The contract of employment between Vopak and Mr De Kreij is not in accordance with this provision. In the event of his dismissal, Mr De Kreij will be contractually entitled to at least two years’ salary. Such severance pay may also become due if Mr De Kreij cannot reasonably be asked to fulfill his duties as a result of changes in circumstances, for example if a public bid is made. The contract was concluded before the Code came into effect and rights acquired may not be impaired.
4. Principle III.3 and best practice provision III.3.1 (expertise and composition Supervisory Board)
These provisions relate to diversity and state that the Supervisory Board should strive for a diverse composition as to gender and age and should formulate concrete targets to achieve this. The Supervisory Board of Vopak strives to achieve a diverse composition of its members and has formulated key elements of its membership profile. These elements are available in the Corporate Governance section of the Vopak website.
Vopak does not strictly follow the recommendation to put an explicit target on diversity in terms of gender or age and has not formulated concrete targets in this respect. The overriding principle for Vopak is that the Supervisory Board has a diverse composition of members with a valuable contribution in terms of

Our governance | Corporate Governance | The Dutch Corporate Governance Code
Vopak | Annual Report 2012 | 83
experience and knowledge of the oil, petrochemical or LNG industries in the regions in which Vopak is active, or other business knowledge. The appointment of Mr Chun Kai Lam from Singapore during the annual general meeting of 27 April 2011, is an example of our strive towards diversity within the Supervisory Board. Vopak has noted the new Law on Management and Supervision, which is effective from 1 January 2013. Diversity in the broad sense continues to be a topic on the Supervisory Board agenda, and one we will further address in the Annual Report 2013.
5. Best practice provision III.3.5. (composition)With respect to this best practice provision, it should be noted that Mr Van der Vorm was reappointed as a member of the Supervisory Board for a fourth and maximum term of four years at the AGM of 25 April 2012. Section III.3.5 of the Code limits the number of four-year terms to a maximum of three. However, the regulations of the Supervisory Board provide that the Supervisory Board may decide otherwise, which it did in the case of Mr van der Vorm, based on his outstanding performance as a member of the Supervisory Board and his valuable knowledge and experience.
6. Best practice provision III.5.11 (Remuneration Committee)With respect to this best practice provision, it should be noted that Mr Van den Driest, as a non-independent member of the Supervisory Board, has been appointed Chairman of the Remuneration Committee.
The Supervisory Board believes that Mr Van den Driest is fully qualified to perform the role of Chairman of the Remuneration Committee given his background and experience.
Vopak has various regulations in place governing the performance of its various bodies and ensuring implementation of the rules applicable within Vopak. These regulations have been amended in line with the Code, recent legislative amendments and decisions made by the Supervisory Board. The regulations can be found in the Corporate Governance section of the Vopak website. The regulations are:• Regulations of the Executive Board;• Regulations of the Supervisory Board;• Regulations of the Audit Committee of the Supervisory Board;• Regulations of the Remuneration Committee of the Supervisory Board;• Regulations of the Selection and Appointment Committee of the Supervisory Board;• Regulations in respect of the ownership of and transactions in Vopak shares and certain other financial
instruments as amended on the basis of the Act on Financial Supervision. Vopak also maintains the Insider Lists specified by this Act;
• Regulations on suspected irregularities (‘whistleblower regulation’).
The following items also appear on the website:• Articles of Association;• Information on the members of the Executive Board and Supervisory Board and the composition of the
core committees;• Profile of the Supervisory Board;• Retirement schedule for the Supervisory Board members;• Retirement schedule for the Executive Board members;• Policy related to bilateral contacts with shareholders;• Code of Conduct;• Corporate Governance Compliance Manual;• Remuneration report, containing the main points of the remuneration policy;• Report of Stichting Administratiekantoor Financieringspreferente Aandelen Vopak (‘the Foundation’);• Management Authorization Policy;• Corporate Governance Statement (the content of which forms part of this Annual Report and is deemed
incorporated here by reference).

Our governance | Corporate Governance | Anti-takeover measures
Vopak | Annual Report 2012 | 84
Anti-takeover measures
Vopak’s principal defense against a hostile takeover is the company’s ability to issue cumulative preference shares (‘protective preference shares’) to Stichting Vopak. Such defensive preference shares will be issued, should Stichting Vopak exercise its option right. On 18 October 1999, the AGM decided to grant Stichting Vopak the right to take up protective preference shares up to a maximum nominal amount equal to 100% of the share capital issued at that time to third parties in the form of ordinary and financing preference shares, less one ordinary share. Vopak and Stichting Vopak further formalized their relationship with regard to the option right in an option agreement of 1 November 1999. This agreement was amended on 5 May 2004, whereby the original put option granted to Vopak was cancelled. The granting of the call option to Stichting Vopak has been entered in the Company Registry and is disclosed in this Annual Report. The objective of Stichting Vopak is to promote the interests of Vopak and companies affiliated to the Vopak group, in such a way that safeguards the interests of Vopak and all stakeholders to the greatest possible extent and, to the best of its ability, to resist influences which, opposing those interests, could impair the independence and/or continuity and/or the identity of Vopak and to undertake all actions relating to or conducive to the above objectives. The board of Stichting Vopak therefore determines whether and when it is necessary to issue the protective preference shares.
These measures can be taken in the event of a takeover, for example, if it is in the interest of Vopak to establish its position in respect of the hostile party and its plans, and to create opportunities to seek scenarios. Vopak reviews its anti-takeover measures as necessary against implementation acts enacted from time to time pursuant to EU directives.
Information referred to in Section 1 of the Takeover Directive (Article 10) Decree
Capital structureA description of Vopak’s capital structure, the various classes of shares and the rights and obligations attached to them can be found in note 20 to the Consolidated Financial Statements. At 31 December 2012, a total of 127,835,430 ordinary shares had been issued, as well as 41,400,000 financing preference shares, all with a nominal value of EUR 0.50 each. At 31 December 2012, the ordinary shares represented 75.54% of the issued share capital, with the financing preference shares representing 24.46%.
Restrictions on the transfer of shares and depositary receipts for sharesVopak’s Articles of Association do not provide for a restriction on the transfer of ordinary shares. They do, however, provide for a restriction on the transfer of financing preference shares. Financing preference shares may only be transferred to natural persons, subject to specific exceptions involving Stichting Vopak and other parties pursuant to Article 10A, paragraph 7 of the Articles of Association. No restrictions apply to the transfer of depositary receipts for financing preference shares issued by the Stichting Administratiekantoor Financieringspreferente Aandelen Vopak. With regard to the protective preference shares, the Articles of Association provide that any transfer requires approval from the Executive Board.
Major holdings subject to mandatory disclosureMore information on major shareholdings that are subject to mandatory disclosure pursuant to Sections 5:34, 5:35 and 5:43 of the Decree can be found in the section ‘Royal Vopak shareholders’.
System of control over employee share plansInformation on share plans can be found in note 26 to the Consolidated Financial Statements of this Annual Report.

Our governance | Corporate Governance | Takeover Directive
Vopak | Annual Report 2012 | 85
Restrictions on voting rights attaching to financing preference shares A description of the depositary receipts for financing preference shares and a restriction on the voting rights attaching to those shares can be found in the section Stichting Administratiekantoor Financieringspreferente Aandelen Vopak (‘the Foundation’).
Rules governing the appointment and dismissal of members of the Executive Board and Supervisory Board and the amendment of the Articles of AssociationUnder Vopak’s Articles of Association, members of the Executive Board and Supervisory Board are appointed and dismissed by the general meeting of shareholders. For the appointment of members of the Executive Board, the Supervisory Board makes a non-binding nomination. Upon the appointment of members of the Supervisory Board, the Supervisory Board may make a non-binding or binding nomination.
The general meeting of shareholders may only resolve to amend the Articles of Association following a proposal from the Executive Board that is subject to approval from the Supervisory Board. Such a resolution of the general meeting of shareholders requires a majority of at least two-thirds of the number of votes validly cast.
Share issuance and repurchaseThe general meeting of shareholders or the Executive Board, if so designated by the general meeting of shareholders, resolves or decides on the issuance of shares. Any share issuance is subject to approval from the Supervisory Board. At 31 December 2012, no authorization to issue shares had been granted to the Executive Board. The Executive Board is authorized until 26 October 2013, however, to repurchase fully paid-up shares in Vopak’s capital, subject to approval from the Supervisory Board. Any repurchase must be limited to the maximum number held by virtue of the law and the Articles of Association (10% at 31 December 2012). Their purchase price must be between the nominal value of the ordinary shares and 110% of the average share price listed on the five most recent trading days prior to the date of the purchase. During 2012 this authorization has not been exercised.
Key agreements containing change-of-control provisionsAn agreement entered into with the holders of financing preference shares on 8 July 2009 provides that, in the event that a public bid for the shares in Vopak’s capital is made that may result in a change of control over the shares carrying the right to cast more than 50% of the votes attached to all issued shares in its capital, Vopak will be obliged, subject to approval from the holders of a majority of the depositary receipts for financing preference shares, to convene a general meeting of shareholders before the period set for offering shares under the public bid has expired, in which a resolution to cancel all outstanding financing preference shares will be placed on the agenda for discussion.
Please also refer to the change-of-control provision on loans in note 29 to the Consolidated Financial Statements.
With respect to agreements entered into with members of the Executive Board and employees that provide for payment upon termination of their employment following a public bid, please refer to the description of change of control of the LTIP and the Corporate Governance section, particularly the explanation of the departure from best practice provision II.2.8 of the Code.

Our governance | Corporate Governance | Risks and risk management
Vopak | Annual Report 2012 | 86
Risks and risk managementOver the past years, Vopak’s focused strategy has proven to enable our worldwide growth, supporting our position as the largest independent storage provider. The strategy captures entrepreneurial opportunities while effectively managing risks, which is vital for doing business successfully in a sustainable way. Although it is complicated to assess the probability, impact and timing of risks and opportunities properly, it remains a core responsibility of the Executive Board to make balanced decisions based on thorough analyses, and to clearly communicate to all stakeholders the significance of potential risks affecting the strategy. Consequently, balanced evaluation and communication on both opportunities and risks is essential. At Vopak, this is embedded at every level of the organization, making risk management an integral part of our day-to-day operations, which is considered fundamental to realize our global strategic objectives and ambition.
The Vopak business model is characterized by a balanced global portfolio, with a geographical spread of terminals (in OECD and non-OECD countries), different type of terminals (distribution, hub, industrial), handling a wide range of products (oil, fuels, chemicals, natural gas, biofuels, LPG and vegetable oils), different contract types (industrial, long-, medium- and short-term), and various types of customers (international and national producers, traders, end-users and governments). Any changes or fine-tuning to our balanced business model are subject to clear management decisions, in line with Vopak’s risk-reward appetite.
Defining Vopak’s risk-reward appetite is a core responsibility of the Executive Board, as it is intimately linked to defining the overall strategy. In this balancing act, the Board takes into account the expectations of all stakeholders, including customers, shareholders, employees and regulators. In doing so, risk responses are balanced with business opportunities to fully align Vopak’s growth ambitions with our risk appetite.
Risk category (COSO) Strategic pillars Vopak Vopak’s risk-reward appetite
Strategic risks Growth leadershipCustomer leadership
Moderate to high: right balance between risk and long-term reward
Operational risks Operational excellence Low: on safety issuesModerate: on other areas/topics with alignment of targets and related cost, and a clear focus on sustainable EBIT growth
Compliance risks Operational excellence Low: full compliance with legal, regulatory and political environments
Financial reporting risks Low: full compliance with fi nancial reporting rules and regulations
Main risks
This section explains the principal risks, set out in order of the three strategic pillars: growth leadership, operational excellence and customer leadership. The principle risks described below follow the strategic analysis in the report of the Executive Board.
GROWTH LEADERSHIP
Increasing competition and expansion of capacityIn a dynamic global marketplace, existing competitors and new players could negatively impact Vopak’s market position. In recent years, we have faced increasing competition and an expansion of storage capacity by existing providers, as well as various new players. Vopak recognizes there is a growing risk
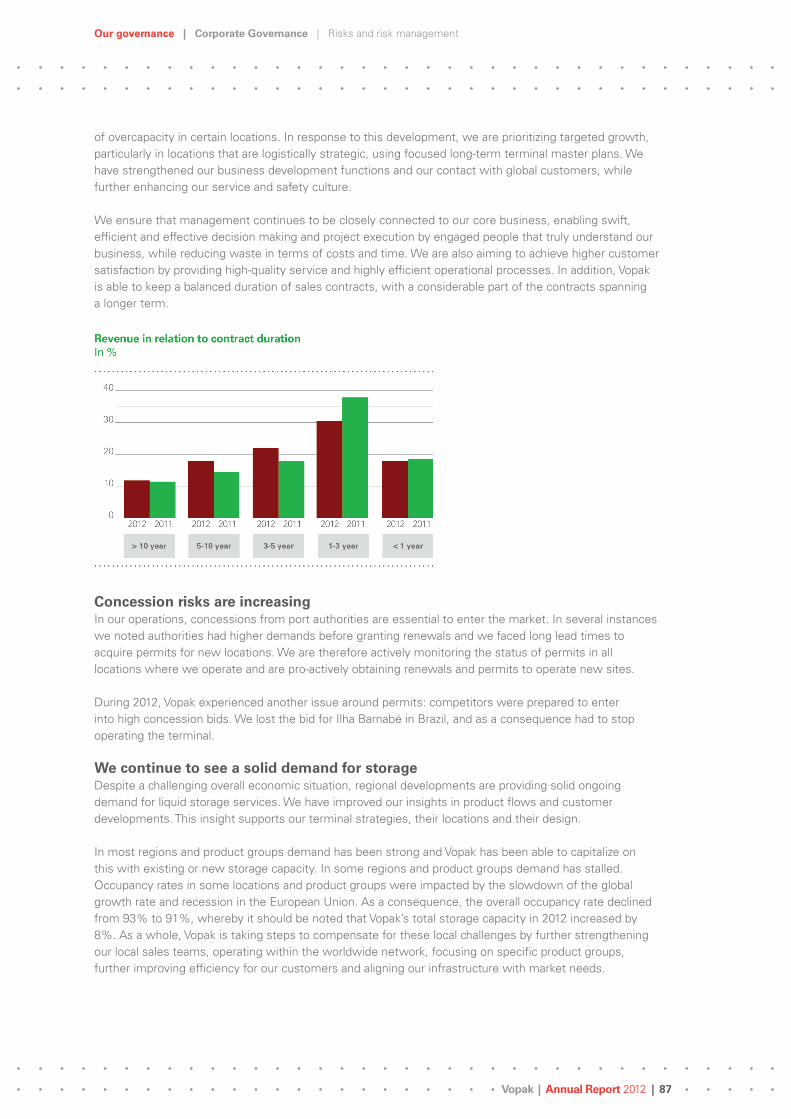
Our governance | Corporate Governance | Risks and risk management
Vopak | Annual Report 2012 | 87
of overcapacity in certain locations. In response to this development, we are prioritizing targeted growth, particularly in locations that are logistically strategic, using focused long-term terminal master plans. We have strengthened our business development functions and our contact with global customers, while further enhancing our service and safety culture.
We ensure that management continues to be closely connected to our core business, enabling swift, efficient and effective decision making and project execution by engaged people that truly understand our business, while reducing waste in terms of costs and time. We are also aiming to achieve higher customer satisfaction by providing high-quality service and highly efficient operational processes. In addition, Vopak is able to keep a balanced duration of sales contracts, with a considerable part of the contracts spanning a longer term.
Concession risks are increasingIn our operations, concessions from port authorities are essential to enter the market. In several instances we noted authorities had higher demands before granting renewals and we faced long lead times to acquire permits for new locations. We are therefore actively monitoring the status of permits in all locations where we operate and are pro-actively obtaining renewals and permits to operate new sites.
During 2012, Vopak experienced another issue around permits: competitors were prepared to enter into high concession bids. We lost the bid for Ilha Barnabé in Brazil, and as a consequence had to stop operating the terminal.
We continue to see a solid demand for storage Despite a challenging overall economic situation, regional developments are providing solid ongoing demand for liquid storage services. We have improved our insights in product flows and customer developments. This insight supports our terminal strategies, their locations and their design.
In most regions and product groups demand has been strong and Vopak has been able to capitalize on this with existing or new storage capacity. In some regions and product groups demand has stalled. Occupancy rates in some locations and product groups were impacted by the slowdown of the global growth rate and recession in the European Union. As a consequence, the overall occupancy rate declined from 93% to 91%, whereby it should be noted that Vopak’s total storage capacity in 2012 increased by 8%. As a whole, Vopak is taking steps to compensate for these local challenges by further strengthening our local sales teams, operating within the worldwide network, focusing on specific product groups, further improving efficiency for our customers and aligning our infrastructure with market needs.

Our governance | Corporate Governance | Risks and risk management
Vopak | Annual Report 2012 | 88
Expansion brings additional challengesNew projects under construction frequently represent sizeable investments and their complexity can increase due to business, financing, environmental and political circumstances and alignment with interests of new joint venture partners. Building and operating new terminals requires access to a skilled workforce and obtaining the required permits in good time. These risks are mitigated through Vopak’s standard global project methodology, repeatable formula with standard design criteria, hiring specific experts, knowledge management, peer reviews, strong relationship management and country studies. In addition, structured succession planning and using the strength of Vopak’s network have enabled us to bring in sufficient resources for the projects. Also the investment proposals as well as the diversified experience of our Global Treasury team to investigate alternative sources of finance and/or secure sufficient funds to finance the projects in good time, support our continued success in executing projects at new and existing locations.
OPERATIONAL EXCELLENCE
Safety and environmental risks continue to be a key focus areaSafety is non-negotiable. Vopak continues to give safety the highest priority. We care about people and the environment and incidents can affect our license to operate and are our highest reputation risk. We progressed our safety attitude in 2012 through various programs focusing on leadership, safety awareness, safety behaviour and improvements from the bottom up. Governmental bodies are tightening their efforts to check safety in our industry, which emphasizes the need for strict compliance in this area. Our structured approach to maintenance, and continuous intensive sustaining capex programs to upgrade infrastructure where necessary or considered effective, prove adequate to demonstrate our asset integrity and will also further reduce safety and environmental risks. Our ambition and targets are aimed at realizing further enhancements in the near future. Accordingly, we continue to emphasize the importance of safety, health and the environment through internal communications, training courses on visible leadership, sharing best practices and by conducting assessments and reviews in order to continuously improve. It is the cornerstone of our business and something that we also require from our contractors.
Our safety performance in 2012 was overshadowed by two off-shore contractor fatalities, one at the construction site in Pengerang (Malaysia) in June and one in Hainan (China) in December. Apart from these regrettable fatalities, our personal and process safety performance in 2012 showed encouraging improvement compared to 2011, exceeding our safety performance objectives. Our progress is recognized by many stakeholders.
In addition to our focus on growth, commercial excellence and safety, we are increasing our efforts to optimize costs, by simplifying our organizational structure wherever possible, optimizing sustaining capex (based on structured maintenance planning), ensuring efficient terminal operations and providing high service levels so we can offer competitive prices.
Vopak is aligning its sustainability vision and targets to the latest developmentsDuring 2012, we further aligned our strategy and goals on sustainability with the overall Vopak strategy. We have already achieved more management commitment, improved standards for personal and process safety, energy savings and attention on further developing our people. The sustainability section on our website provides more detail about our sustainability strategy.
We note both our customers and the local communities near our terminals have ever-increasing expectations of our industry. During 2012, developments in the Amsterdam-Rotterdam-Antwerp region emphasized the need to control odor emissions, for which we installed various technical solutions and started a long-term journey to improvement.
Our governance | Corporate Governance | Risks and risk management
Vopak | Annual Report 2012 | 89
In the Sustainability Report 2012, Vopak will expand the number of key performance indicators (KPIs) we report on, in line with our step-by-step approach to achieve a higher GRI level for our reporting. This indicates Vopak’s commitment to be truly focused on people, planet and profit.
Risk of insufficient number of people with the right skillsVopak is a rapidly growing company, meaning that in the coming years we could be short of sufficient and capable people in key positions. As a company with worldwide operations, and as a leader in the independent tank storage market, we face the possibility that our people will be approached and recruited by competitors or customers. We aim to take on enough people to cover both the expansion of our business activities as well as the expected outflow, while offering a balanced remuneration package and an environment in which new employees can develop quickly in the organization. We have training plans to help staff reach and maintain adequate levels of knowledge and competencies.
Our HR strategy is executed in line with our three strategic pillars. We continue to focus on competency and skills management, performance management based on a worldwide talent management strategy, leadership and management development, and further improvements to the HR organization. Succession planning for senior management positions is coordinated centrally.
Our employee engagement surveys show our employees are prepared to make every effort to support our key factors for success. Employee satisfaction is high, as is pride in the company and staff retention. People want to stay and develop themselves at Vopak. Our challenge is to balance continuous improvement and growth projects with the inspiring but also potentially high work pressure resulting from that. By setting clear priorities and supporting the personal development of our employees, we aim to realize a balanced match with our high performance ambition.
CUSTOMER LEADERSHIP
Improving customer satisfaction creates opportunitiesHigh-quality service is fundamental to our commercial strategy. We therefore continue to give our full attention to our customers when doing business and performing operational activities. We measure, monitor and evaluate our service KPIs and use an annual customer satisfaction survey to track changes in the perception of our service level. We aim to provide even better service through training courses and competence management, standardizing processes and further improving our information systems. Our intensive sustaining capex programs - to upgrade our infrastructure where necessary or considered effective - also help us to reduce delays and complaints. Due to our large customer base, the risk of customer concentration and the associated credit risk is very limited.
We measure the Net Promotor Score (NPS) and the Vopak Service Quality Index (VSQI). This enables us to continuously identify improvement areas for our customers. In those cases, we initiate efforts to improve the trend and align with our customers on the service levels they need. To truly embed a customer focused service culture, customer satisfaction is a key target for employees in short-term incentive plans. We will continue our efforts in this area in 2013. The quality of our service is a distinctive factor for customers to choose Vopak.
LEGAL, COMPLIANCE AND OTHER RISKS
Legal and complianceVopak may be held liable for any non-compliance with laws and regulations, e.g. in a number of countries there is specific legislation relating to the administration and tracking of ‘controlled products’ (the United Nations lists these products). We mitigate this risk through monitoring and by adapting to significant and rapid changes in the legal systems, regulatory controls and customs and practices in the countries where we operate. Some stocks we store and handle for customers, such as ethanol, are subject to import duties. As more products with import duties are handled, Vopak’s financial risk exposure rises,

Our governance | Corporate Governance | Risks and risk management
Vopak | Annual Report 2012 | 90
requiring continuous attention for adequate procedures, processes and controls. Adequate working capital, inventory management and supportive processes are preconditions that we safeguard through a key control framework and a global diagnostic instrument. Where necessary, control mechanisms are tightened. The effects of stricter environmental regulation are covered as far as possible by making specific and sustainable investments and by sharing risks with customers.
Legislation to prevent bribery is being introduced around the world, and the UK Bribery Act in particular causes many companies to redefine their policies. Vopak has responded by issuing new policies and emphasizing adherence to the Code of Conduct to all employees.
IT/Information security Information technology is a significant driver for improvement and innovation in our business, and stakeholders continue to expect more proactive digital exchange of business transactions. We have defined a long-term IT strategy and investment portfolio to keep up with this trend, replacing applications in good time and fulfilling the demands of our customers, supply chain partners, employees and shareholders.
An effect of our expanding IT landscape is that Vopak is more dependent on its information systems and the rise of cyber threats make us more vulnerable to damage resulting from IT security incidents. Our information security policy mandates that we implement and maintain controls, processes and tools that ensure continuity of information systems and the confidentiality, privacy and integrity of confidential and sensitive information. Compliance with our policy and with the various legal and regulatory requirements is continuously managed and monitored. By updating our security policies and the implementation of ISO 27001 we will continue to be protected and ready to resolve most issues in good time. We also perform terminal security risk assessments and have defined a way to mitigate the risk related to the impact of social media.
Insurable risksVopak’s enterprise risk management (ERM) approach offers insight into the potential exposure the company could face. Our insurance policy aims to strike the right balance between arranging insurance cover for the Group’s risks and financing adverse implications ourselves, or transferring such risks to external insurance companies. The principal factors underlying our insurance policy are risk tolerance and risk transfer costs. On this basis, Vopak has purchased worldwide insurance cover for such risks as product and third-party liability, property damage and business interruption.
Vopak’s insured risks are partly covered by a Vopak captive reinsurance company and by transferring risks to the insurance market. The financial credit ratings of the insurance companies involved are reviewed on a regular basis and, where appropriate, risks are spread across multiple insurance companies.
FINANCIAL RISKSOur financial risks are considered in detail in note 29 to the Consolidated Financial Statements. Here we explain the main risk subjects regarding currency and exchange rate risks, interest rate risks and credit risks, including the risk responses.
Risks in the euro zoneThe euro zone economy experienced ongoing unrest in 2012, especially in southern countries. Vopak has a limited presence in those countries most affected by the euro crisis. Nevertheless, the risks resulting from a fragmentation or dissolution of the euro have been analyzed and where considered appropriate measures have been taken to limit exposure. The measures taken mainly apply to the terminals that are operated or are being built in Spain. There are two operational terminals located in Barcelona and Tarragona. The terminal under construction is located in Algeciras. Vopak currently has no operations in Greece, Portugal, Italy or Ireland.

Our governance | Corporate Governance | Risk management
Vopak | Annual Report 2012 | 91
Refinancing and liquidity risksVopak is a capital-intensive company. Our strategic finance funding policy aims to ensure flexible access to various capital markets and funding sources to support our growth strategy, facilitating a continuous balanced and well-spread debt maturity profile at appropriate terms and conditions, matching Vopak’s solid credit quality. Following various long-term funding transactions (US and Asian Private Placements, revolving credit facility) the remaining duration of the outstanding long-term debt is approximately 10 years and the repayment profile is well-spread over an even longer period.
The development of our Senior net debt : EBITDA ratio is frequently monitored and discussed by the Strategic Finance Committee, the Executive Board, the Audit Committee and the Supervisory Board. Vopak’s funding strategy is focused on ensuring continuous access to the capital markets so funding capital is always available at a time of our choice and at acceptable cost.
Accordingly, we have a proactive financing policy so that we can act flexibly, irrespective of the prevailing financing climate. In October 2012, Vopak secured a new USD 1 billion private placement, in addition to the recently extended revolving credit facility of EUR 1 billion.
Subsidiaries are funded centrally by the Global Treasury department, which acts as a type of in-house bank. Where possible, joint ventures are funded by debt on a non-recourse project financing basis.
Liquidity requirements are monitored continuously. Long-term liquidity risks are reviewed each quarter and ahead of every significant investment. Active cash management is a daily responsibility.
FINANCIAL REPORTINGVopak prepares its financial reports using reliable systems with clear procedures, solid internal controls and proven integrity in reporting. The various duties are segregated, performed by knowledgeable and experienced professionals and tested in specific audits.
The results of internal and external audits are discussed with terminal and divisional managers each quarter. Vopak gives a great deal of attention to these procedures. We use a finance excellence framework to help terminals and divisions develop their finance function.
Reports are prepared using a clearly defined, mandatory process with regular consultations across the management layers involved. The reports and related discussions are not limited to the financial results but also cover key operational, human resources and commercial performance indicators. Joint ventures are included in this process and there is at least one Vopak representative in a supervisory role in the organization who pays particular attention to these points.
Vopak has an effective internal control structure. A number of controls are automated to reduce the risk of variations and errors. A specific group of representatives from the Global Control & Business Analysis department and from all divisions is responsible for the ongoing application and enhancement of internal control procedures. Staff at the terminals are instructed about IFRS standards and kept up to date about amendments. The potential impact is assessed promptly. External advisors are engaged to value acquisitions (purchase accounting method). The external auditor examines compliance with IFRS at the main terminals, using standards set in IFRS and Vopak’s accounting manual.
Risk management
Risk management is strongly embedded in all layers of the organization. Divisional managers assess risks and set and check the effect of the strategy for fit for purpose risk mitigating actions and monitor effective implementation. Risk reports are prepared and topics are analyzed at a corporate level. Enterprise risk management (ERM) is on the agenda of the Strategy Committee (Stratcom). The Stratcom comprises

Our governance | Risks and Risk Management | Risk management framework
Vopak | Annual Report 2012 | 92
members of the Executive Board, the commercial president and the division presidents who meet frequently. The Stratcom selects risk themes and appoints functional directors at a global level to develop the right approach to these themes.
Our risk appetite remains unchangedAt year-end 2012, Vopak had 84 terminals in 31 countries. This extensive network adds value to our internationally-operating customers and enables us to spread the risks of political and economic instability in an entrepreneurial manner. Every Vopak location pays considerable attention to environmental risks and attempts to keep safety risks to the absolute minimum. Many products we store and transport are potentially harmful to public health and the environment. Our focus on safety is reflected in the design of our terminals, the behaviour of our employees and in our policy and standards, which meet or exceed local legislation and regulations. Our employees undergo regular training to keep know-how, skills and conduct up to standard. Key performance indicators are monitored monthly and there are also internal and external audits.
We are prepared to take different risks in some areas than in others. Taking calculated risks to benefit from exceptional opportunities is part of our growth strategy. To ensure that risks and the potential loss of opportunities are sufficiently under control, each business decision is supported by a balanced system of selection, prioritization, internal financial and operational reviews and authorization profiles. Our standards and values are set out in the Vopak Values, which guide our actions. There are no concessions to this. Where it involves our business, we ensure proper funding and have adequate cash and cash equivalents available on time to execute growth, improvement or maintenance projects.
Risk management framework
Risk management and the internal control structureThe aim of our risk management and internal control structure is to achieve a balance between an effective, professional enterprise, and the risk profile that we are aiming for as a business. Our risk management and internal controls, based on the COSO Enterprise Risk Management Framework, make a significant contribution to the prompt identification and adequate management of strategic and market risks. They also support us in achieving our operational and financial targets and complying with legislation and regulations.
Risk management approachThe Executive Board, under supervision of the Supervisory Board, has ultimate responsibility for Vopak’s risk management and internal control structure. The divisional management teams are responsible for implementing the strategy, achieving results, identifying underlying opportunities and risks and ensuring effective operations. They have to act in accordance with the policy and standards set by the Executive Board, in which they are supported by global functional departments.
Division management teams have risk management integrated into their strategic, tactical and operational business activities. Opportunities and risks are assessed and follow-up actions to mitigate risks are discussed as part of our standard management review cycles. The quality of these activities is regularly assessed. The ERM process is coordinated at a global level and the ERM information is analyzed, consolidated and reported to the Executive Board, to the division management teams and to global functional directors.
The Executive Board approves the annual budget and two-year plans for each division. These budgets contain clear objectives for each of the three strategic pillars, risks and opportunities, activities and performance indicators. It also designates the managers with ultimate responsibility. To avoid execution risk, the Executive Board discusses the conditions (enablers) with the divisions.
Our governance | Risks and Risk Management | Risk management framework
Vopak | Annual Report 2012 | 93
Each quarter, the Executive Board and the division management teams discuss progress on implementing the company’s strategy, business plans, key performance indicators, quarterly results, key risks, opportunities and progress on mitigating measures.
At the end of the year, terminal and divisional managers use the Control Risk Self-Assessment to determine how effective the risk management and internal control structures were. The results and trend analyses are discussed with the Executive Board.
The Executive Board, which bears ultimate responsibility for the proper functioning of risk management and the internal control structure, discusses the company’s results, key performance indicators and strategy (and adjustments to it), the outcomes and effectiveness of risk management and the internal control structure with the Audit Committee and the Supervisory Board. Global Internal Audit provides further assurance on the functioning of risk management and the internal control framework. The external auditor also offers assurance on the internal control framework and the adequacy of the financial reporting systems. The results are discussed with the Audit Committee.
Management of our terminals, divisions, global functional directors and the Executive Board sign Letters of Representation at the end of the half year and the full year.
With all the challenges associated with operating in an entrepreneurial manner in a complex, dynamic world, Vopak is well positioned to capture the opportunities while mitigating the risks through a focused core business, supported by a fit for purpose business model and management teams with the right competences, skills and experiences.
Our in-control statement is included in the next chapter.

Our governance | Executive Board Declaration | In-control statement
Vopak | Annual Report 2012 | 94
Executive Board Declaration
In-control statement
In the Risks and Risk Management section we set out in detail our risks and risk management framework, as well as the responsibilities of the Executive Board.
In compliance with the best practice principle II.1.5 laid down in the Dutch Corporate Governance Code, and taking into account the limitations outlined below (and based on our evaluation), we confirm that our internal risk management and control systems relating to financial reporting risks worked properly in 2012 and provide a reasonable assurance that the financial reporting does not contain any errors of material importance.
Our internal risk management and control systems are, however, unable to offer absolute assurance that the strategic, operational and financial objectives will be fully achieved, or that laws and regulations are always complied with. Furthermore, the systems cannot prevent all human errors of judgments and mistakes. It is also inherent that in business, cost-benefit assessments must be made for the acceptance of risks and the implementation of controls. We continue to further improve and optimize our internal risk management and control procedures.
Executive Board declaration
Pursuant to the Financial Supervision Act, Section 5:25c, paragraph 2, sub-paragraph c, we declare that, to the best of our knowledge:a. the financial statements give a true and fair view of the Group’s assets, liabilities, financial position and
profit or loss; and b. the Report of the Executive Board gives a true and fair view of the situation on the balance sheet date,
of developments during the financial year of the company and entities affiliated with it; andc. the Report of the Executive Board includes a description of the principal risks the company faces.
Rotterdam, 28 February 2013
The Executive Board
Eelco Hoekstra (Chairman and CEO)Jack de Kreij (Vice-chairman and CFO)Frits Eulderink (COO)

Our governance | Shareholder information | Share price developments
Vopak | Annual Report 2012 | 95
Shareholder information
Share price developments
In EUR 2012 2011
Share price at 1 January 40.83 35.35
Highest share price 57.94 40.95
Average closing share price 49.00 34.96
Lowest share price 40.32 27.43
Share price at 31 December 53.31 40.83
Free float 46.6% 46.6%
Average number of shares traded per day 213,900 305,385
Market capitalization at year-end 6,814,906,773 5,219,520,607
Information per ordinary share of EUR 0.50
In EUR 2012 2011
Earnings 2.52 3.08
Earnings excluding exceptional items 2.70 2.16
Equity attributable to owners of parent 13.84 12.73
Dividend (proposal 2012) 0.88 0.80
Pay-out ratio 35% 26%
Pay-out ratio excluding exceptional items 33% 37%

Our governance | Shareholder information | Investor Relations
Vopak | Annual Report 2012 | 96
Investor Relations
Vopak has an open and active information policy for investors and other parties interested in the company’s financial and non-financial status. Our objective is to provide quality information to stakeholders about developments at Vopak, ensuring this information is equally and simultaneously accessible to all interested parties. Such information is made available through annual and semi-annual reports, trading updates, press releases, presentations to investors and the Vopak website. In addition, Vopak organizes analyst conferences and regular roadshows to meet investors.
Members of the Executive Board and the Investor Relations department held more than 300 meetings with current or potential investors during 2012 and organized a Capital Markets Day in December. Vopak holds press conferences which coincide with the publication of its (half-)year results, and organizes a meeting with financial analysts following publication of the (half-)year results. The publication of first and third quarter results is followed by a telephone conference with analysts. These sessions can be followed via the company’s website in either a video or audio webcast, and information presented at these meetings is also published in good time on the company’s website. Vopak complies with the rules and regulations of the Authority Financial Markets (AFM) and International Financial Reporting Standards (IFRS) in all its publications.
ListingVopak ordinary shares are listed on the NYSE Euronext stock exchange in Amsterdam, the Netherlands, and are part of the Midkap Index (ticker symbol VPK; ISIN NL0009432491). Options on Vopak shares are also traded on NYSE Euronext Amsterdam.
Closed periodsClosed periods are the periods prior to the publication of financial results. During this time, in principle, no meetings are held with and no presentations are given to financial analysts and investors. In addition, during closed periods no other communication with analysts and investors will take place, unless it relates to factual clarification of previously disclosed information. Usually the length of the closed period is eight weeks prior to full-year results (and publication of the annual report); four weeks prior to half-year results; and two weeks before Q1 and Q3 statements (‘trading updates’).
Bilateral contactsVopak may engage in bilateral contacts with existing and potential shareholders. The main objective would be to explain Vopak’s strategy and operational performance and answer any questions. Vopak takes the Dutch Corporate Governance Code (December 2008) into account when engaging in bilateral contacts with shareholders.
Therefore the following guidelines have been established:• A dialogue with shareholders outside the context of a formal shareholder meeting can be useful for
both investors and Vopak;• Vopak reserves the right to determine, at its sole discretion, whether it will accept invitations from
shareholders, or parties representing shareholders, to engage in such a dialogue. Vopak may ask for further clarification on the views, aims and investment objectives of such shareholders before accepting or rejecting any invitation to engage in dialogue outside the context of a formal shareholder meeting;
• Vopak communicates as openly as possible to maximize transparency; • Response to third party publications, such as analyst reports or draft reports, is only given by referring
to public information and published guidance. Comment on these reports is given only with regards to incorrect factual information;
• Vopak’s contact with investors and sell-side analysts will at all times comply with the applicable rules and regulations, in particular those concerning selective disclosure, price sensitive information and equal treatment.

Our governance | Shareholder information | Dividend policy
Vopak | Annual Report 2012 | 97
Dividend policy
Barring exceptional circumstances, the principle underlying Vopak’s dividend policy is our intention to pay an annual cash dividend of 25% to 40% of the net profit -excluding exceptional items- attributable to holders of ordinary shares.
The net profit -excluding exceptional items- that forms the basis for dividend payments may be adjusted for the financial effects of one-off events such as changes in accounting policies, acquisitions, reorganizations, etc.
In setting the dividend amount, Vopak takes into account desirable capital ratios and financing structure, as well as the flexibility it requires to successfully pursue its growth strategy. At the same time, Vopak wants to assure its shareholders of a stable trend in dividends.
Investors and their advisors can put their questions directly to Tom Smeenk, Manager Investor Relations, tel. +31 10 2002776. E-mail: [email protected]
Royal Vopak shareholders
Pursuant to the Financial Supervision Act, a shareholding of 5% or more in a Dutch company must be disclosed. Vopak has received the following notifications concerning such holdings of ordinary shares and financing preference shares.
Ordinary share holdings 1
Total share holdings 2 Voting right 3
Date of notification
HAL Holding N.V. 4 48.15% 39.70% 46.90% 11-01-06
ING Groep N.V. 5.37% 11.84% 6.33% 21-05-08
Aviva Plc (Delta Lloyd) < 5% 8.07% < 5% 01-11-06
ASR Nederland N.V. < 5% 7.45% < 5% 06-10-08
Stichting Administratiekantoor Financieringspreferente Aandelen Vopak ('the Foundation') 5 3.62% 31-08-09
1. Number of ordinary shares divided by total number of ordinary shares.2. Number of ordinary and financing preference shares divided by total number of ordinary and financing preference shares.3. Number of ordinary shares divided by total number of votes of ordinary and financing preference shares.4. Percentages have been amended upon verification with HAL Holding N.V. after the mentioned date of notification.5. AFM reporting indicates 24.46% voting rights. The variance is due to an incorporated limit of 116 votes for every 1,000 financing
preference shares.

Our governance | Shareholder information | Shares outstanding
Vopak | Annual Report 2012 | 98
Shares outstanding
2012 2011
Weighted average number of ordinary shares 127,360,846 127,251,388
Weighted average number of ordinary shares, diluted 127,360,846 127,251,388
Number of ordinary shares at year-end 127,835,430 127,835,430
Financing preference shares 41,400,000 41,400,000
Total number of shares outstanding 169,235,430 169,235,430
Ordinary shares 1 127,404,626 127,287,223
Financing preference shares 2 4,802,400 4,802,400
Total voting rights at year-end 132,207,026 132,089,623
1. Excluding treasury shares in 2012: 430,804 and in 2011: 548,207.2. On financing preference shares will be voted in accordance with a limit of 116 votes for every 1,000 financing preference shares.
Financial calendar
201301 March 2013 Publication of 2012 annual results
13 March 2013 Formal announcement Annual General Meeting of Shareholders
27 March 2013 Record date Annual General Meeting of Shareholders
24 April 2013 Publication of 2013 first-quarter results in the form of a trading update
24 April 2013 Annual General Meeting of Shareholders
26 April 2013 Ex-dividend quotation
30 April 2013 Dividend record date
02 May 2013 Dividend payment date
23 Augustus 2013 Publication of 2013 half-year results
08 November 2013 Publication of 2013 third-quarter results in the form of a trading update
201428 February 2014 Publication of 2013 annual results
12 March 2014 Formal announcement Annual General Meeting of Shareholders
26 March 2014 Record date Annual General Meeting of Shareholders
23 April 2014 Publication of 2014 first-quarter results in the form of a trading update
23 April 2014 Annual General Meeting of Shareholders
25 April 2014 Ex-dividend quotation
29 April 2014 Dividend record date
05 May 2014 Dividend payment date
22 Augustus 2014 Publication of 2014 half-year results
10 November 2014 Publication of 2014 third-quarter results in the form of a trading update

Vopak | Annual Report 2012 | 99
Financial Statements 99
Consolidated Financial Statements 100Consolidated Statement of Income 100Consolidated Statement of Comprehensive Income 101Consolidated Statement of Financial Position 102Consolidated Statement of Changes in Equity 103Consolidated Statement of Cash Flows 104Segment information 105
Notes to the Consolidated Financial Statements 107Summary of significant accounting policies 107Notes to the Consolidated Statement of Income 118Notes to the Consolidated Statement of
Financial Position 124
Company Financial Statements 154Company Statement of Income 154Company Statement of Financial Position 154
Notes to the Company Financial Statements 155
Other information 160Independent auditor’s report 160Event after reporting period 162Articles of Association Provisions Governing Profit
Appropriation 162Proposed Profit Appropriation 162Stichting Vopak 163Report of the Stichting Administratiekantoor
Financieringspreferente Aandelen Vopak (‘the Foundation’) 165
Information on the Executive Board members 166Information on the Supervisory Board members 167Principal Company Officers at 28 February 2013 169Subsidiaries, Joint Ventures and Associates 171
Five-year Consolidated Summary 174
Glossary 175
Financial Statements

Financial Statements | Consolidated Financial Statements | Consolidated Statement of Income
Vopak | Annual Report 2012 | 100
Consolidated Financial Statements
Consolidated Statement of Income In EUR millions Note 2012 2011
Revenues 1,313.9 1,171.9
Other operating income 2 12.2 13.2
Total operating income 1,326.1 1,185.1
Personnel expenses 3 329.0 319.2
Depreciation, amortization and impairment 4 217.6 178.0
Other operating expenses 5 340.7 322.8
Total operating expenses 887.3 820.0
Operating profit 438.8 365.1Result of joint ventures and associates using the equity method 6 97.1 220.4
Group operating profit 535.9 585.5
Interest and dividend income 7 3.8 7.3
Finance costs 8 - 87.3 - 85.9
Net finance costs - 83.5 - 78.6
Profit before income tax 452.4 506.9
Income tax 9 - 82.9 - 71.3
Net profit 369.5 435.6
Non-controlling interests 23 - 39.8 - 35.0
Net profit owners of parent 329.7 400.6
Net profit holders of financing preference shares - 8.2 - 8.2
Net profit holders of ordinary shares 321.5 392.4
Basic earnings per ordinary share (in EUR) 10 2.52 3.08
Diluted earnings per ordinary share (in EUR) 10 2.52 3.08

Financial Statements | Consolidated Financial Statements | Consolidated Statement of Comprehensive Income
Vopak | Annual Report 2012 | 101
Consolidated Statement of Comprehensive Income
In EUR millions Note 2012 2011
Net profit 369.5 435.6Exchange differences and effective portion of hedges on net investments in foreign activities - 8.1 19.6
Use of exchange differences and effective portion of hedges on net investments in foreign activities 21 – 0.6
Effective portion of changes in fair value of cash flow hedges 21, 23 - 45.9 - 22.2
Use of effective portion of cash flow hedges to statement of income 21 0.2 - 1.0
Effective portion of changes in fair value of cash flow hedges joint ventures 21 - 19.5 - 25.2
Use of effective portion of cash flow hedges joint ventures 21 – 2.6
Other comprehensive income, net of tax - 73.3 - 25.6
Total comprehensive income 296.2 410.0
Attributable to:
Holders of ordinary shares 244.3 362.6
Holders of financing preference shares 8.2 8.2
Attributable to owners of parent 252.5 370.8
Non-controlling interests 43.7 39.2
Total comprehensive income 296.2 410.0
Items are disclosed net of tax. The income tax relating to each component of other comprehensive income is disclosed
in note 9.
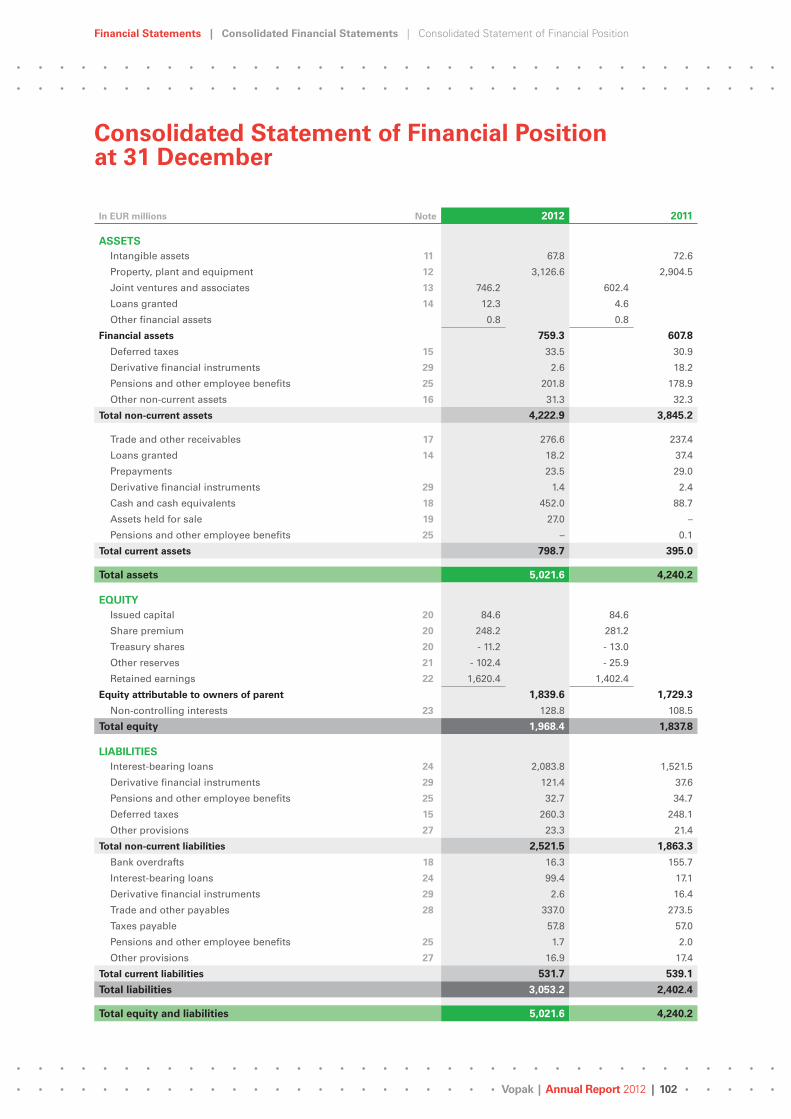
Financial Statements | Consolidated Financial Statements | Consolidated Statement of Financial Position
Vopak | Annual Report 2012 | 102
Consolidated Statement of Financial Position at 31 December
In EUR millions Note 2012 2011
ASSETSIntangible assets 11 67.8 72.6
Property, plant and equipment 12 3,126.6 2,904.5
Joint ventures and associates 13 746.2 602.4
Loans granted 14 12.3 4.6
Other financial assets 0.8 0.8
Financial assets 759.3 607.8
Deferred taxes 15 33.5 30.9
Derivative financial instruments 29 2.6 18.2
Pensions and other employee benefits 25 201.8 178.9
Other non-current assets 16 31.3 32.3
Total non-current assets 4,222.9 3,845.2
Trade and other receivables 17 276.6 237.4
Loans granted 14 18.2 37.4
Prepayments 23.5 29.0
Derivative financial instruments 29 1.4 2.4
Cash and cash equivalents 18 452.0 88.7
Assets held for sale 19 27.0 –
Pensions and other employee benefits 25 – 0.1
Total current assets 798.7 395.0
Total assets 5,021.6 4,240.2
EQUITYIssued capital 20 84.6 84.6
Share premium 20 248.2 281.2
Treasury shares 20 - 11.2 - 13.0
Other reserves 21 - 102.4 - 25.9
Retained earnings 22 1,620.4 1,402.4
Equity attributable to owners of parent 1,839.6 1,729.3
Non-controlling interests 23 128.8 108.5
Total equity 1,968.4 1,837.8
LIABILITIESInterest-bearing loans 24 2,083.8 1,521.5
Derivative financial instruments 29 121.4 37.6
Pensions and other employee benefits 25 32.7 34.7
Deferred taxes 15 260.3 248.1
Other provisions 27 23.3 21.4
Total non-current liabilities 2,521.5 1,863.3
Bank overdrafts 18 16.3 155.7
Interest-bearing loans 24 99.4 17.1
Derivative financial instruments 29 2.6 16.4
Trade and other payables 28 337.0 273.5
Taxes payable 57.8 57.0
Pensions and other employee benefits 25 1.7 2.0
Other provisions 27 16.9 17.4
Total current liabilities 531.7 539.1
Total liabilities 3,053.2 2,402.4
Total equity and liabilities 5,021.6 4,240.2

Financial Statements | Consolidated Financial Statements | Consolidated Statement of Changes in Equity
Vopak | Annual Report 2012 | 103
Consolidated Statement of Changes in Equity
Equity attributable to owners of parent
In EUR millions NoteIssued capital
Share premium
Treasury shares
Other reserves
Retained earnings Total
Non-con-trolling
interestsTotal
equity
Balance at 1 January 2011 84.6 281.2 - 14.9 4.1 1,098.4 1,453.4 96.7 1,550.1
Net profit – – – – 400.6 400.6 35.0 435.6
Other comprehensive income, net of tax – – – - 30.0 0.2 - 29.8 4.2 - 25.6
Total comprehensive income – – – - 30.0 400.8 370.8 39.2 410.0
Dividend paid in cash 22, 23 – – – – - 97.3 - 97.3 - 27.4 - 124.7
Measurement of equity-settled share-based payment arrangements 22 – – – – 2.4 2.4 – 2.4
Vested shares under equity-settled share-based payment arrangements 20, 22 – – 1.9 – - 1.9 – – –
Total transactions with owners – – 1.9 – - 96.8 - 94.9 - 27.4 - 122.3
Balance at 31 December 2011 84.6 281.2 - 13.0 - 25.9 1,402.4 1,729.3 108.5 1,837.8
Net profit – – – – 329.7 329.7 39.8 369.5
Other comprehensive income, net of tax – – – - 77.8 0.6 - 77.2 3.9 - 73.3
Total comprehensive income – – – - 77.8 330.3 252.5 43.7 296.2
Dividend paid in cash 22, 23 – – – – - 110.1 - 110.1 - 25.9 - 136.0
Result sale of non-controlling interest subsidiary 21, 23 – – – 1.3 – 1.3 2.5 3.8
Capital reduction 20 – - 33.0 – – – - 33.0 – - 33.0
Measurement of equity-settled share-based payment arrangements 22 – – – – - 0.4 - 0.4 – - 0.4
Vested shares under equity-settled share-based payment arrangements 20, 22 – – 1.8 – - 1.8 – – –
Total transactions with owners – - 33.0 1.8 1.3 - 112.3 - 142.2 - 23.4 - 165.6
Balance at 31 December 2012 84.6 248.2 - 11.2 - 102.4 1,620.4 1,839.6 128.8 1,968.4

Financial Statements | Consolidated Financial Statements | Consolidated Statement of Cash Flows
Vopak | Annual Report 2012 | 104
Consolidated Statement of Cash Flows
In EUR millions Note 2012 2011
Cash flows from operating activities (gross) 30 659.3 495.8
Interest received 7 3.6 6.6
Dividend received 7 0.2 0.7
Finance costs paid - 73.8 - 69.2
Settlement of derivative financial instruments (interest rate swaps) 2.4 0.6
Income tax paid - 44.1 - 28.1
Cash flows from operating activities (net) 547.6 406.4
Investments:
Intangible assets 11 - 8.9 - 11.1
Property, plant and equipment 12 - 448.8 - 479.2
Joint ventures and associates 13 - 99.3 - 37.5
Loans granted 14 - 20.0 - 82.5
Other non-current assets - 0.3 - 0.7
Acquisition of subsidiaries including goodwill – - 44.0
Acquisition of joint ventures 13 - 65.7 - 55.9
Total investments - 643.0 - 710.9
Disposals:
Intangible assets 11 0.2 0.1
Property, plant and equipment 12 2.5 3.1
Joint ventures and associates 13 – 214.1
Loans granted 14 31.3 54.5
Subsidiaries – 5.6
Assets held for sale – 3.9
Total disposals 34.0 281.3Cash flows from investing activities (excluding derivatives) - 609.0 - 429.6
Settlement of derivatives (net investments hedges) - 9.9 - 13.1Cash flows from investing activities (including derivatives) - 618.9 - 442.7
Financing:
Repayment of interest-bearing loans 24 - 377.1 –
Proceeds from interest-bearing loans 24 1,073.6 95.4
Disposal non-controlling interests 23 3.8 –
Dividend paid in cash 22 - 101.9 - 89.1
Dividend paid on financing preference shares 22 - 8.2 - 8.2
Proceeds and repayments in short-term financing 24 - 16.7 - 179.5
Cash flows from financing activities 573.5 - 181.4
Net cash flows 502.2 - 217.7
Exchange differences 0.5 - 3.0
Net change in cash and cash equivalents due to (de)consolidation – 5.9
Net change in cash and cash equivalents (including bank overdrafts) 502.7 - 214.8
Net cash and cash equivalents (including bank overdrafts) at 1 January - 67.0 147.8
Net cash and cash equivalents (including bank overdrafts) at 31 December 18 435.7 - 67.0

Financial Statements | Consolidated Financial Statements | Segment information
Vopak | Annual Report 2012 | 105
Segment information
General
Operating segments are reported in a manner consistent with the internal reporting provided to the Executive Board, which is the chief operating decision maker, and are based on geographical markets. Business activities that cannot be allocated to any other segment are reported under Non-allocated. These include primarily the global LNG activities, headquarter costs and expenses related to other interests like real estate interests in Rotterdam (the Netherlands). The global LNG activities are shown separately under Non-allocated.
Statement of income
Revenues 1
Depreciation and amortization 2
Result of joint ventures andassociates 3
Group operating profit
In EUR millions 2012 2011 2012 2011 2012 2011 2012 2011
Netherlands 457.6 400.8 72.0 54.5 1.9 1.5 189.4 157.4
Europe, Middle East & Africa 235.9 226.6 35.4 30.1 46.6 69.5 91.2 109.1
Asia 355.4 308.7 56.1 49.7 22.9 29.6 202.8 185.3
of which Singapore 244.8 217.6 32.2 29.4 – – 151.7 133.8
North America 158.4 137.7 21.4 17.7 – 112.7 35.3 145.3
of which Bahamas – – – – – 112.7 – 112.7
Latin America 100.9 93.6 14.7 12.4 0.8 - 1.6 27.6 20.2
Non-allocated 5.7 4.5 3.1 2.2 24.9 8.7 - 10.4 - 31.8
of which global LNG activities 3.4 2.1 – – 25.3 9.9 20.6 4.4
Total 1,313.9 1,171.9 202.7 166.6 97.1 220.4 535.9 585.5
Reconciliation consolidated net profit 4
Group operating profit 535.9 585.5
Net finance costs -83.5 -78.6
Profit before income tax 452.4 506.9
Income tax -82.9 -71.3
Net profit 369.5 435.6
1. There are no single external customers with 10 per cent or more of the Group's total revenues.2. Excluding impairments recognized in 2012 and 2011. For further details we refer to note 4.3. For impairments recognized in 2012 and 2011 we refer to note 6.4. As the Group neither allocates interest expenses to segments, nor accounts for taxes in them, there is no segmented disclosure of
the net profit.
Statement of financial position
Assets of subsidiaries
Joint ventures and associates Total assets Total liabilities
In EUR millions 2012 2011 2012 2011 2012 2011 2012 2011
Netherlands 1,175.9 1,080.9 4.8 3.7 1,180.7 1,084.6 82.4 84.5
Europe, Middle East & Africa 816.8 669.6 270.9 219.2 1,087.7 888.8 201.5 176.2
Asia 1,063.1 971.2 355.0 275.4 1,418.1 1,246.6 314.7 290.2
of which Singapore 619.3 539.1 – – 619.3 539.1 263.9 246.7
North America 356.2 367.7 – – 356.2 367.7 97.7 97.3
Latin America 239.8 247.5 3.3 3.4 243.1 250.9 39.6 38.3
Non-allocated 623.6 300.9 112.2 100.7 735.8 401.6 2,317.3 1,715.9
of which global LNG activities 13.6 18.9 105.7 88.1 119.3 107.0 5.7 5.8
Total 4,275.4 3,637.8 746.2 602.4 5,021.6 4,240.2 3,053.2 2,402.4

Financial Statements | Consolidated Financial Statements | Segment information
Vopak | Annual Report 2012 | 106
Investments 1
Intangible assets
Property, plant and equipment
Other non-current assets
Joint ventures and associates Total
In EUR millions 2012 2011 2012 2011 2012 2011 2012 2011 2012 2011
Netherlands 1.2 3.0 170.2 192.0 – – 3.7 2.1 175.1 197.1
Europe, Middle East & Africa 0.6 1.0 143.1 132.0 0.1 0.1 3.9 - 2.9 147.7 130.2
Asia 0.4 0.2 80.7 45.7 0.1 0.3 91.3 26.7 172.5 72.9
of which Singapore 0.1 0.1 – 22.6 0.1 0.3 – – 0.2 23.0
North America 0.4 0.7 31.5 67.8 – – – – 31.9 68.5
Latin America 0.1 0.9 21.2 39.6 0.1 0.3 – – 21.4 40.8
Non-allocated 6.2 5.3 2.1 2.1 – – 0.4 11.6 8.7 19.0of which global LNG activities – – 1.2 0.9 – – 0.4 11.5 1.6 12.4
Total 8.9 11.1 448.8 479.2 0.3 0.7 99.3 37.5 557.3 528.5
1. Excluding loans granted and acquisition of subsidiaries, joint ventures and associates.

Financial Statements | Consolidated Financial Statements | Summary of significant accounting policies
Vopak | Annual Report 2012 | 107
Notes to the Consolidated Financial Statements
Summary of significant accounting policies
General
Royal Vopak, with its registered office in Rotterdam (the Netherlands), is the world’s largest independent tank terminal operator specialized in the storage and transfer of liquid energy products and chemicals. Upon request, Vopak provides additional services to customers at the terminal.
The consolidated financial statements of the company for the year ended at 31 December 2012 contain the figures of the company and its subsidiaries (jointly referred to as the ‘Group’), as well as the interests of the Group in joint ventures and associates (to which the equity method is applied). The financial statements were approved by the Executive Board and the Supervisory Board on 28 February 2013 and are subject to adoption by the shareholders during the Annual General Meeting.
Basis of preparation
The consolidated financial statements are presented in euros and are based on the historical cost principle unless stated otherwise in the accounting policies stated below.
The consolidated financial statements have been prepared in accordance with the International Financial Reporting Standards (IFRSs) as adopted by the European Union (EU). The accounting policies based on IFRS, as described below, have been applied consistently for the years 2012 and 2011 by all entities. There were no material changes to those accounting policies during the year.
Accounting standards and interpretations not yet adopted
Revised IAS 19, Employee benefits, has been endorsed by the European Union (EU) and is required to be adopted, with retrospective effect (effectively at 1 January 2012), by 2013. The revision eliminates the 10% corridor smoothing mechanism of accounting for actuarial gains and losses arising in connection with defined benefit plans. Furthermore, the amendment introduces significant changes to the recognition and measurement of defined benefit plan expenses and their presentation in the income statement. The revised standard requires expected returns on plan assets, recognized in profit or loss, to be calculated based on the rate used to discount the defined benefit obligation, which generally is a lower rate than used under the current IAS 19. The remeasured actuarial gains and losses are recognized in Other comprehensive income and will increase net pension liabilities. Other changes are related to the recognition of administration costs (other than costs of managing plan assets) and any taxes payable by the plan. The administration costs are to be recognized when the administration services are provided, therefore the currently permitted treatment of making actuarial assumption about such costs and including them within the measurement of the defined benefit obligation is no longer allowed. Any taxes payable by the plan when an employer makes contributions to the plan should be included in the defined benefit obligation and service costs. The application of the amendment in 2013 will have the following effect on the comparative figures for 2012:

Financial Statements | Consolidated Financial Statements | Summary of significant accounting policies
Vopak | Annual Report 2012 | 108
In EUR millions Equity
Actuarial gains and losses at 1 January 2012 - 107.4
Adjustment administration costs and taxes payable by the plan 10.3
Income tax 26.9
First time adoption - 70.2
Actuarial gains and losses 2012 - 199.5
Income tax 50.5
Effect 2012 - 149.0
Total recognized directly in equity through Other comprehensive income - 219.2
Lower pension charges defined benefit plans 4.8
Income tax - 1.4
Net result recognized through statement of income 2012 3.4
Total effect on Equity attributable to owners of parent at 31 December 2012 - 215.8
IFRS 10 (Consolidated financial statements), IFRS 11 (Joint Arrangements), IFRS 12 (Disclosures of Interests in Other Entities), revised standards IAS 27 (Separate Financial Statements) and IAS 28 (Investments in Associates and Joint Ventures) were issued during 2011. The standards reinforce the principles for determining when an investor controls another entity, amend in certain cases the accounting for joint arrangements and introduce changes to certain disclosures. The standards and amendments are endorsed by the EU and have to be applied, at the latest, as from the commencement date of a company’s first financial year starting on or after 1 January 2014. Vopak will adopt these standards and amendments no later than the accounting period beginning on or after 2014.
IFRS 10 builds on existing principles by identifying the concept of control as the determining factor whether an entity should be included within the consolidated financial statement of the holding entity. The standard provides additional guidance to assist in the determination of the consolidation requirements where this is difficult to assess. This standard has no significant effect on the Group’s consolidated statements. Vopak has been informed by HAL Holding N.V. (‘HAL’) that, based on current facts and circumstances, it may be technically required for HAL to consolidate Vopak in its consolidated financial statements as from January 1, 2014. Accordingly HAL has requested Vopak to provide detailed historical accounting information with respect to the consolidated financial statements in order for HAL to be able to assess the (pro-forma) implications of IFRS 10. To facilitate HAL complying with its obligations under IFRS, a Memorandum of Understanding has been signed between Vopak and HAL with respect to confidentiality and the process of exchanging information.
According to IFRS 11 (Joint Arrangements) an arrangement over which two or more parties have joint control is either a joint operation or a joint venture. In a joint operation, the parties with joint control have rights to the assets and obligations for the liabilities of the arrangement resulting into that the parties have to recognize their relative share of the joint operation’s assets, liabilities, revenues and expenses. In a joint venture, the parties with joint control have rights to the net assets of the arrangement and the parties have to use the equity method. Vopak is in the process of finalizing the impact analysis. It is expected that the standard does not materially affect Vopak as (nearly) all of the joint arrangements will classify as joint ventures and the Group is already applying the equity method.
IFRS 12 increases the disclosure requirements and has no effect on the equity and profit or loss of the Group.
IFRS 13 (Fair value measurement), is required to be adopted, with prospective effect, by 2013. The standard aims to improve consistency and reduce complexity by providing a precise definition of fair value and a single source of fair value measurement and disclosure requirements for use across IFRSs. The requirements do not extend the use of fair value accounting but provide guidance on how it should be applied where its use is already required or permitted by other standards within IFRSs. The impact of the changes is not expected to be material for the Group.

Financial Statements | Consolidated Financial Statements | Summary of significant accounting policies
Vopak | Annual Report 2012 | 109
There are no other amendments to existing standards or new IFRIC interpretations that are not yet effective that are expected to have a material impact on the Group.
Key accounting estimates and judgements
Preparing the consolidated financial statements in accordance with IFRS means that the Group must use insights, estimations and assumptions that could affect the reported assets and liabilities and the information provided on contingent assets and liabilities as at the statement of financial position date as well as the reported income and expenses. The actual results ultimately may differ from these estimations. The estimations and the underlying assumptions are continuously reviewed. Adjustments are made in the period in which the estimations were reviewed if the adjustment affects that period, or in the relevant period and the future periods if the adjustment affects both the current and future periods.
Management insights that have a major impact on the financial statements and estimations with a significant risk of a material adjustment in a subsequent year are:
Useful life and residual value of property, plant and equipmentProperty, plant and equipment form a substantial part of the total assets of the company, while period depreciation charges form a substantial part of the annual operating expenses. The useful life and residual value determined by the Board based on its estimations and assumptions have a major impact on the measurement and determination of results of the property, plant and equipment. The useful life of property, plant and equipment is partly estimated based on their useful productive lives, experiences related to such assets, the maintenance history and the period during which economic benefits from utilization of the asset accrued to the company. Periodic reviews show whether changes have occurred in estimations and assumptions as a result of which the useful life and/or residual value need to be adjusted. Such an adjustment will be made prospectively.
Estimated impairmentsThe Group annually reviews goodwill for impairment. This also applies to other assets if there is reason to do so. The principles explained under Impairments of assets (see Impairment of assets) are applied.
Pensions and other employee benefitsThe pension charges for defined benefit pension plans depend on future assumptions, using the advice of an independent qualified actuary. The principal assumptions in connection with the Group’s defined benefit plans are set out in note 25, including a sensitivity analysis.
TaxesDeferred tax assets, including those arising from carry-forward losses, are recognized if it is likely that taxable profit is available against which losses can be set off. In determining this, Vopak uses estimations and assumptions that also affect the measurement of the deferred tax assets. A maturity schedule of the unrecognized carry-forward losses is included in note 15.
Environmental provisionsIn accordance with the policies stated under Other provisions, environmental provisions are formed based on current legislation and the best estimate of future expenses (see also note 27 and note 33).
Derivative financial instrumentsThe fair value of a derivative financial instrument not traded on active markets is measured as the present value of the expected future cash flows under the contract. In determining this value, a valuation model is used that is based on the interest rates and the exchange rates as at the end of the reporting period. For a sensitivity analysis we refer to note 29.

Financial Statements | Consolidated Financial Statements | Summary of significant accounting policies
Vopak | Annual Report 2012 | 110
Consolidation
The consolidated financial statements include the financial statements of Royal Vopak and its subsidiaries, being those companies over which the Group, either directly or indirectly, has control through a majority of the voting rights or the right to exercise control or to obtain the majority of the benefits and to be exposed to the majority of the risks. Potential voting rights that are currently exercisable or convertible are taken into account.
Subsidiaries are consolidated from the date that control commences until the date that control ends, using consistent accounting policies. Non-controlling interests in equity and in results are presented separately. Transactions with non-controlling interests that do not result in loss of control are accounted for as transactions with equity owners of the Group. For purchases from non-controlling interests, the difference between any consideration paid and the relevant share acquired of the carrying value of the net asset of the subsidiary is recorded in equity. Gains or losses on disposals to non-controlling interests are also recorded in equity.
For a list of the principal subsidiaries, please refer to chapter Subsidiaries, Joint Ventures and Associates of this report.
All inter-company balances and transactions, including unrealized gains and losses on transactions, are eliminated on consolidation. Unrealized gains arising from transactions with joint ventures and associates are eliminated to the extent of the interest of the Group in the equity. Unrealized losses are eliminated in the same manner as unrealized gains, but only to the extent that there is no evidence of impairment.
Business combinations
The acquisitions of subsidiaries are accounted for using the acquisition method. The cost of an acquisition is measured as the fair values of the assets given and liabilities incurred or assumed. Identifiable assets acquired, liabilities and contingent liabilities assumed in a business combination are recognized initially at their fair values at the acquisition date. The excess of the cost of acquisition over the fair value of the Group’s share of the identifiable net assets acquired is recorded as goodwill. The Group recognizes any non-controlling interests in the acquiree, on an acquisition-by-acquisition basis, either at fair value or at the non-controlling interest’s proportionate share of the recognized amounts of acquiree’s identifiable net assets. Acquisition-related costs are expensed as incurred.
Joint ventures and associates (Notes 6, 13)
A joint venture is a contractual agreement under which two or more parties conduct an economic activity and unanimous approval is required for the financial and operating policies. Associates are all entities over which the Group has significant influence but not control, generally accompanying a shareholding between 20% and 50% of the voting rights.
Joint ventures and associates are accounted for using the equity method, which involves recognition in the consolidated income statement of Vopak’s share of the net result of the joint ventures and associates for the year. Accounting policies of joint ventures and associates have been changed where necessary to ensure consistency with the policies adopted by the Group. Vopak’s interest in a joint venture or associate is carried in the statement of financial position at its share in the net assets of the joint venture or associate together with goodwill paid on acquisition, less any impairment loss. When the share in the losses exceeds the carrying amount of an equity-accounted company (including any other receivables

Financial Statements | Consolidated Financial Statements | Summary of significant accounting policies
Vopak | Annual Report 2012 | 111
forming part of the net investment in the company), the carrying amount is written down to nil and recognition of further losses is discontinued, unless we have incurred legal or constructive obligations relating to the company in question. For a list of the principal joint ventures and associates, please refer to chapter Subsidiaries, Joint ventures and Associates of this report.
Foreign currency translation
Items included in the financial statements of each of the Group’s entities are measured in the currency that applies to the primary economic environment in which the entity operates (the functional currency). The consolidated figures are presented in euros, the company’s functional and presentation currency.
Foreign currency transactions are translated into euro using the exchange rate at the dates of the transactions or valuation where items are remeasured. Foreign exchange gains and losses resulting from the settlement of such transactions and from the translation at year-end exchange rates of monetary assets and liabilities denominated in foreign currencies are recognized in the statement of income, except when deferred in other comprehensive income as qualifying cash flow hedges and net investment hedges.
On consolidation the assets and liabilities of non-euro entities, including goodwill and fair value adjustments at the time of the acquisition, are translated into euro at the year-end rates of exchange (closing exchange rates). The items of the statement of income of foreign activities, excluding foreign operations in hyperinflationary economies, are translated at the average exchange rates for the reporting period. The resulting translation differences of the net investments in foreign activities are recognized as foreign currency translation reserve (translation reserve) within other comprehensive income. The same applies to exchange differences arising from loans drawn and other financial instruments to the extent that these hedge the currency risk related to the net investment. Upon disposal of all or part of an interest in, or upon liquidation of, an entity, cumulative currency translation differences related to that entity are generally recognized in income. When the Group disposes of only part of its interest in a subsidiary with a foreign operation, while retaining control, the relevant portion of the cumulative amount is not transferred to profit or loss but reattributed to non-controlling interests. On disposal of a foreign activity with a non-controlling interest the cumulative amount relating to the non-controlling interests shall be derecognized, but shall not be reclassified to profit or loss. A share capital or share premium distribution by an entity is not considered to be a partial disposal when the Group retains its relative share in the entity.
The following main exchange rates are used in the financial statements:
Closing exchange rate Average exchange rate
EUR 1.00 is equivalent to 2012 2011 2012 2011
US dollar 1.32 1.29 1.29 1.39
Singapore dollar 1.61 1.68 1.61 1.75
Chinese yuan 8.22 8.14 8.11 9.00
Brazilian real 2.70 2.41 2.51 2.33
Exceptional items (Note 1)
The items in the statement of income include items that are exceptional by nature. These exceptional items include impairments, reversed impairments, additions to and releases from provisions for restructuring, results on assets sold, gains on the sale of subsidiaries, joint ventures and associates, and any other provisions being formed or released. To increase transparency, these exceptional items from management perspective are disclosed separately in the notes.

Financial Statements | Consolidated Financial Statements | Summary of significant accounting policies
Vopak | Annual Report 2012 | 112
Revenues
Revenue represents the fair value of the consideration received or receivable for services provided in the normal course of business, stated net of discounts, returns and value added taxes. The recognition in the statement of income is in proportion to the stage of the rendered performance as at the end of the reporting period. Tank rentals, including minimum guaranteed throughputs, are recognized on a straight-line basis over the contractual period. Revenues from excess throughputs and other services are recognized on completion of the services. If the revenue cannot be reliably measured, only the income up to the level of the expenses to be claimed will be recognized. Modifications of property, plant and equipment upfront paid by customers are accounted for as prepaid revenues and recognized in the statement of income over the contractual period on a straight-line basis.
Other operating income (Note 2)
Gains on the sale of assets are deemed realized at the time the benefits and the risks of the assets are entirely borne by the buyer and there is no uncertainty as to whether the agreed payment is received. Gains on the sale of subsidiaries are realized at the time control is no longer exercised.
Other operating expenses (Note 5)
Losses on the sale of assets are presented under Other operating expenses and are recognized as soon as they are foreseen. Research costs relating to new storage capacity to be built are recognized in the statement of income in the year in which the costs are incurred.
Leased assets, of which the benefits and risks remain substantially with the lease provider, are regarded as operating leases. Payments made for operating leases are charged to the statement of income on a straight-line basis over the lease term. If an operating lease is terminated early, any financial obligation or penalty owed to the owner will be taken to the statement of income in the period in which the lease was terminated.
Interest and dividend income (Note 7)
Interest income from granted loans and dividends from other financial assets (over whose financial and operating policies the Group has no significant influence) are presented under Interest and dividend income, using the effective interest method.
Dividend income is recognized when the right to receive payment is established.
Finance costs (Note 8)
Finance costs consist of interest and exchange differences on loans drawn and of results on hedging instruments recognized in the statement of income. Interest expense is recognized in the period to which it relates, taking into account the effective interest rate.
Taxes (Notes 9, 15)
Taxes on profit or loss for the financial year comprise current and deferred taxes. Taxes are recognized in the statement of income unless they relate to items directly recognized in equity through other comprehensive income.

Financial Statements | Consolidated Financial Statements | Summary of significant accounting policies
Vopak | Annual Report 2012 | 113
Current tax is the expected tax payable on the taxable income for the year, using tax rates enacted at the end of the reporting period, plus any adjustments to prior-year tax payable.
Deferred taxes are provided for, using the liability method, whereby provisions are made for all taxable temporary differences between the carrying amounts of assets and liabilities for financial reporting purposes and their tax base. No deferred taxes are provided for the following temporary differences: goodwill not deductible for tax purposes; the initial recognition of assets and liabilities that neither affect accounting nor taxable profit; and differences relating to investments in subsidiaries to the extent that they will not reverse in the foreseeable future. The calculation is based on tax rates enacted or substantively enacted, as at the end of the reporting period.
Deferred tax assets, including assets arising from losses carried forward, are recognized to the extent that it is probable that future taxable profits will be available against which these temporary differences or unused tax losses can be utilized. Deferred tax assets and liabilities are stated at nominal value.
A provision is formed for tax, principally regarding withholding tax, for which a liability might arise in connection with the distribution of retained earnings if a decision has been made to distribute such earnings.
Intangible assets and Property, plant and equipment (Note 11 and 12)
Intangible assets include goodwill, capitalized software costs, contractual relationships, concessions and favourable leases ensuing from business combinations. Goodwill represents the difference between the purchase price and Vopak’s share in the fair value of the acquired identifiable assets, liabilities and contingent liabilities of the company acquired at the time Vopak obtains control (acquisition method). Goodwill is carried at cost less accumulated impairments and is allocated to cash-generating units, i.e. individual terminals or a group of terminals. Software is carried at historical cost, net of straight-line amortization based on its expected useful life and any potential impairment. The expected useful life of software is subject to a maximum of seven years.
Other intangible assets are carried at their initial market value at the time of the acquisition, net of straight-line amortization and impairments. Amortization is based on a period of five to thirty years, which is the term of the contract or the term of validity.
Other items are mainly licenses that are carried at historical cost, net of straight-line amortization. Amortization is based on a period of five years, which is the term of validity.
Property, plant and equipment are broken down into their components and carried at historical cost, net of accumulated straight-line depreciation and less any impairment losses. Interest during construction is capitalized. Historical cost includes the initial acquisition cost plus other direct acquisition costs (such as unrecoverable taxes or transport) and construction costs that can be allocated directly (such as hours of own employees and advisory fees). To the extent that dismantling obligations exist at the end of the useful life, these and any amendments thereto are included in the cost of the assets.
Subsequent costs are included in the asset’s carrying amount or recognized as a separate asset, as appropriate, only when it is probable that future economic benefits associated with the item will flow to the Group and the cost of the item can be measured reliably. The carrying amount of the replaced part is derecognized. Costs of repairs and maintenance that do not increase the future economic benefits are regarded as expenses.
Depreciation is computed from the date the asset is available for use, using the straight-line method over the expected useful life and taking the estimated residual value into account. The useful life of the main

Financial Statements | Consolidated Financial Statements | Summary of significant accounting policies
Vopak | Annual Report 2012 | 114
assets is as follows: for buildings 10-40 years, for main components of tank storage terminals 10-40 years, for IT hardware 3-5 years, for machinery, equipment and fixtures 3-10 years. Land is not depreciated.
The residual value and useful life of intangible assets and property, plant and equipment are reviewed annually and adjusted if necessary.
Impairment of assets
The carrying amount of goodwill is tested for impairment annually (unless there is reason to do so more frequently), while all assets are tested for impairment whenever events or changes in circumstances indicate that the carrying amounts for those assets are not recoverable. If assets are to be determined to be impaired, the carrying amounts of those assets are written down to their recoverable amount, which is the higher of fair value less costs to sell and value-in-use.
Value-in-use is determined as the amount of estimated discounted future cash flows. For this purpose, assets are grouped into cash-generating units based on separately identifiable and largely independent cash flows. The cash flow projections are based on group operating profits and sustaining capital expenditures of the budget for the coming year and the two subsequent planning years. Cash flows beyond the previously mentioned period of three years are extrapolated, using a stable or decreasing growth rate, unless an increasing rate can be substantiated. Given that the cash flows are estimated before taxes, the discount rates used to calculate the present value of the cash flows are pre-tax rates based on the risk-free rates for 15-year bonds issued by the government in the relevant market, adjusted for a risk premium and specific risks relating to the countries and risks specific to the assets.
Impairments of a cash-generating unit are initially allocated to goodwill and subsequently allocated to the other assets of the cash-generating unit on a proportionate basis. Impairments of intangible assets and property, plant and equipment are presented in the statement of income under Depreciation, amortization and impairment. Impairments, except those related to goodwill, are reversed as applicable to the extent that the events or circumstances that triggered the original impairment have changed.
All financial assets are reviewed for impairment. If there is objective evidence of impairment as a result of one or more events after initial recognition, an impairment loss is recognized in the statement of income. The impairments for joint ventures and associates and loans granted are presented under Result of joint ventures and associates using the equity method and Finance costs respectively.
Determination of fair value for financial instruments
A number of the Group’s accounting policies and disclosures require the determination of fair value for the financial instruments. Fair value measurements are estimates of the amounts for which assets or liabilities (generally financial instruments) could be exchanged at the measurement date, based on the assumption that such exchanges take place between knowledgeable, unrelated parties in unforced transactions. Where available, fair value measurements are derived from quoted prices (unadjusted) in active markets for identical assets or liabilities (level 1). In the absence of such information, other observable inputs, either directly (i.e. as prices) or indirectly (i.e. derived from prices), are used to estimate fair values (level 2). Inputs derived from external sources are corroborated or otherwise verified, as appropriate.
The fair values of the Private Placements, revolving credit facility and other long-term bank loans are measured by discounting the future cash flows using observable market interest information (level 2) as no similar instrument is available due to the specific profiles of the instruments.

Financial Statements | Consolidated Financial Statements | Summary of significant accounting policies
Vopak | Annual Report 2012 | 115
The fair values of interest rate swaps, cross currency interest rate swaps and forward foreign exchange contracts are determined by discounting the future cash flows using the applicable period-end yield curve. None of the change in fair value of interest rate swaps and cross currency interest rate swaps is attributable to changes in the Group’s credit risk.
The Group considers that the fair value of loans granted, trade and other receivables, cash and cash equivalents, bank overdrafts, credit facilities, other long-term loans and trade creditors are not materially different to their carrying value.
The initial measurement at trade date of all financial instruments is the fair value. Except for derivatives, the initial measurement of financial instruments is adjusted for directly attributable transaction costs.
Derivative financial instruments (Note 29)
Derivative financial instruments are used in the management of interest rate risk, foreign currency risk and in the management of foreign currency cash balance. Derivative financial instruments are recognized at fair value on the balance sheet. Changes in fair value are recognized in the statement of income unless hedge accounting is applied. With respect to hedge accounting, Vopak makes a distinction between fair value hedges, cash flow hedges and hedges of net investments in foreign companies.
The group only applies fair value hedge accounting for hedging fixed interest risk on loans drawn. If a fair value hedge is used, the hedging instrument is carried at fair value and the changes in fair value are taken to the statement of income. The hedged position is recognized at fair value to the extent that the movements in the fair value are caused by the hedged risk. These movements in value are likewise recognized directly in the statement of income.
A cash flow hedge is applicable for those derivatives qualifying and designated as hedge of the change in cash flows to be received or paid relating to a recognized asset or liability or a highly probable forecasted transaction. The effective parts of changes in the fair value of derivative financial instruments are recognized in other comprehensive income.
Vopak’s own credit risk on hedged financial instruments is not part of the hedge relationship. The profit or loss as a result of ineffectiveness is recognized directly in the statement of income. This also applies to the credit risks on derivatives counterparties and the interest component that is a result of the time value of money in the valuation of the derivative financial instrument.
Amounts accumulated in equity are reclassified to profit or loss at the same time as the hedged transaction affects profit or loss or if the hedged transaction is no longer probable. The effects are shown under Finance costs. If the established agreement or the foreseeable transaction that is hedged results in the recognition of a non-financial asset, the accumulated gains or losses previously deferred in equity are removed from equity and recognized in the initial recognition of the asset or liability.
If a hedging instrument or the hedge relationship is terminated but the hedged transaction is still expected to take place, the accumulated gains or losses will remain in equity at that time and will subsequently be recognized in the income statement when the transaction takes place.
Net investments in foreign activities can be hedged by qualifying and designated derivative financial instruments, which are considered as cash flow hedges (see above). If a debt denominated in foreign currency hedges a net investment in a foreign operation in the same currency, the exchange differences due to translation of the net investment and the debt into euros are recognized in other comprehensive income, to the extent that the hedge is effective. The ineffective part is recognized in the statement of
Financial Statements | Consolidated Financial Statements | Summary of significant accounting policies
Vopak | Annual Report 2012 | 116
income under Finance costs. Accumulated exchange losses and gains in equity are reclassified at the time foreign activities are (partially) disposed of.
Loans granted and drawn (Notes 14, 24)
Interest-bearing loans are measured at amortised cost, applying the effective interest method unless the interest rate has been converted in a hedge relation from fixed to floating by means of a fair value hedge. In that case the carrying amount is adjusted for the fair value changes caused by the hedged risk.
Fees paid on the establishment of loan facilities are recognized as transaction costs of the loan to the extent that it is probable that some or all of the facility will be drawn down. In this case, the fee is deferred until the drawdown occurs. To the extent there is no evidence that it is probable that some or all of the facility will be drawn down, the fee is capitalized as pre-payment for liquidity services and amortized over the period of the facility to which it relates.
Assets held for sale (Note 19)
Non-current assets and disposal groups are classified as held for sale when their carrying amount is to be recovered principally through a sale transaction and a sale is considered highly probable. They are stated at the lower value of the carrying amount and the fair value less expected selling costs. When specific criteria for the held for sale have been met the non-current assets subject to depreciation or amortization are no longer depreciated or amortized. The assets and liabilities are presented separately under Total current assets and Total current liabilities respectively. In addition, equity accounting for joint ventures and associates ceases once classified as held for sale.
Employee benefits
Pensions and other employee benefits (Note 25)Most of our defined benefit plans are administered by separate company pension funds and partly insured with insurance companies. Valuations of the defined benefit plans are carried out by independent actuaries, using the projected unit credit method. Under this method pension expense principally represents the movement in the actuarial present value of the obligations for pension benefits based on employee service during the year and the interest on this obligation in respect of employee service in previous years, net of the expected return on plan assets. The discount rate used in determining the present value of the obligations is the yield on high-quality corporate bonds with durations approximating the terms of our obligations.
Actuarial gains and losses are accounted for using the corridor method. Under this method, to the extent that any cumulative unrecognized actuarial gain or loss exceeds 10% of the greater of the defined benefit obligation and the fair value of the plan assets, that excess is recognized in the statement of income over the expected average remaining service years of employees participating in the plan.
Contributions to defined contribution schemes are recognized in the statement of income as incurred. Multi-employer plans that include defined benefit pension plans but for which insufficient information is available for the Group to make IAS 19 calculations are treated as if they were defined contribution.
Share-based compensation (Note 26)The Group operates a number of equity-settled share-based compensation plans (LTIPs 2008, 2009 and 50% of the LTSP 2010) and a cash-settled share-based compensation plan (50% of the LTSP 2010) under which the Group receives services from employees as consideration for respectively ordinary shares of the Group and for cash equivalents to the value of the underlying ordinary shares.
Financial Statements | Consolidated Financial Statements | Summary of significant accounting policies
Vopak | Annual Report 2012 | 117
For equity-settled share-based compensation plans, the fair value is determined at the date of grant and expensed in the statement of income based on the Group’s estimate of the shares that eventually vest, with a corresponding adjustment directly in equity. For cash-settled share-based compensation plans, the fair value is determined at the date of grant and is remeasured at each reporting date until the liability is settled and is recognized over the vesting period as an expense to the extent to which participants have rendered services to date.
Generally, the compensation cost is recognized on a straight-line basis over the vesting period. The amounts expensed are adjusted over the vesting period for changes in the estimate of the number of shares and the equivalent in cash that will eventually vest. Adjustments are made at the end of each reporting period to reflect expected and actual forfeitures during the vesting period due to the failure to satisfy service conditions or non-market performance conditions (like profitability growth targets and remaining an employee of the Group over a specified time period).
Other types of remuneration (Note 26)Long-term remuneration settled in cash that depends on the development of the earnings per ordinary share during a period of three years is allocated to these years based on the latest estimates. Liabilities are recognized via provisions and remeasured at the end of each reporting period.
Other provisions (Note 27)
Provisions are recognized for legal or constructive obligations that arose in the past, the amount of which, though uncertain, can be reliably estimated and where it is probable that the settlement of the obligations will entail a cash outflow. If the time horizon is significant, the size of the provision is based on the expected future cash flows discounted at a pre-tax rate that reflects the current market rate of interest as well as the specific risks associated with the liabilities.
In accordance with current legislation, environmental plans and other measures to be adopted are agreed with local, regional and national authorities as appropriate. As soon as such plans are approved or other statutory obligations arise, a provision is formed based on the most reliable estimate possible of the future expenses.
A provision for reorganization is formed when Vopak has approved a detailed and formalized reorganization plan and when the reorganization has either commenced or made public.
Provisions for deferred remuneration other than pensions and other employee benefits, for example, redundancy benefits, anniversary bonuses and long-term remuneration settled in cash, are calculated using the method for defined benefit plans. Any actuarial results arising are recognized immediately as profits or losses. The same applies to any changes relating to past service.
Cash flow policies
The cash flow statement is drawn up based on the indirect method. Cash flows denominated in foreign currencies are translated at average exchange rates. Exchange and translation gains and losses on cash and cash equivalents (including current liabilities arising from credit facilities) are presented separately.
Company statement of income
An abridged company statement of income is presented in accordance with Section 402 of Book 2 of the Dutch Civil Code.

Financial Statements | Consolidated Financial Statements | Notes to the Consolidated Statement of Income
Vopak | Annual Report 2012 | 118
Notes to the Consolidated Statement of Income
Note 1. Exceptional items
In EUR millions Note 2012 2011
Impairments 4 - 14.9 - 11.4
Gains on deconsolidations of subsidiaries 2 – 4.3
Reorganization costs – - 5.5
Operating profit - 14.9 - 12.6
Impairments joint ventures and associates 6 - 10.1 - 3.6
Gains on sale of joint ventures and associates 6 – 111.5
Result joint ventures and associates 6 – 20.8
Group operating profit - 25.0 116.1
Finance costs 8 – - 5.0
Profit before income tax - 25.0 111.1
Tax on above-mentioned items 9 2.6 5.9
Total effect on net profit - 22.4 117.0
In EUR millions 2012 2011
Consolidated Statement of Income excluding exceptional items
Operating profit 453.7 377.7
Result of joint ventures and associates using the equity method 107.2 91.7
Group operating profit 560.9 469.4
Net finance costs - 83.5 - 73.6
Profit before income tax 477.4 395.8
Income tax - 85.5 - 77.2
Net profit 391.9 318.6
Non-controlling interests - 40.1 - 35.0
Net profit owners of parent 351.8 283.6
Net profit holders of financing preference shares - 8.2 - 8.2
Net profit holders of ordinary shares 343.6 275.4
Basic earnings per ordinary share (in EUR) 2.70 2.16
Diluted earnings per ordinary share (in EUR) 2.70 2.16
Note 2. Other operating income
In EUR millions 2012 2011
Management fee joint ventures and associates 5.8 5.8
Gains on sale of property, plant and equipment 2.4 2.1
Gains on deconsolidations of subsidiaries – 4.3
Other 4.0 1.0
Total 12.2 13.2

Financial Statements | Consolidated Financial Statements | Notes to the Consolidated Statement of Income
Vopak | Annual Report 2012 | 119
Note 3. Personnel expenses
In EUR millions Note 2012 2011
Wages and salaries 258.4 236.3
Social security charges 30.4 28.0
Contribution to pension schemes (defined contribution) 25 10.5 9.6
Pension charges (defined benefit plans) 25 13.3 15.9
Long-term incentive plans 26 - 0.6 4.8
Early retirement 2.5 1.4
Other personnel expenses 38.4 40.7
Capitalized personnel expenses - 23.9 - 17.5
Total 329.0 319.2
Other personnel expenses include the recognition of the Dutch crisis tax of 16% for remunerations above EUR 150,000. The total amounts to EUR 1.5 million, of which EUR 0.4 million relates to the members of the Executive Board.
Average number of employees (in FTEs)During the year under review, the Group employed an average of 4,314 employees and temporary staff (2011: 4,276). The movements in the number of own employees (in FTEs) were as follows:
In FTEs 2012 2011
Number at 1 January 3,921 3,763
Entered/left service 11 90
Acquisitions – 68
Number at 31 December 3,932 3,921
Note 4. Depreciation, amortization and impairment
In EUR millions Note 2012 2011
Intangible assets 11 8.7 7.7
Property, plant and equipment 12 194.0 158.9
Impairments 11, 12 14.9 11.4
Total 217.6 178.0
Note 5. Other operating expenses In EUR millions 2012 2011
Maintenance 56.5 55.3
Energy and utilities 52.5 48.1
Operating lease 47.0 43.5
Environmental, safety and cleaning 37.6 29.0
Advisory fees 27.1 29.8
Insurance 20.5 20.9
Rents and rates 18.2 16.2
Third party logistics 14.9 15.7
IT 14.6 13.7
Other 51.8 50.6
Total 340.7 322.8

Financial Statements | Consolidated Financial Statements | Notes to the Consolidated Statement of Income
Vopak | Annual Report 2012 | 120
The fees listed in the table below relate to the procedures applied to the company and its consolidated group entities by PricewaterhouseCoopers Accountants N.V., the Netherlands, the external auditor as referred to in Section 1(1) of the Dutch Accounting Firms Oversight Act (Dutch acronym: Wta), as well as by other Dutch and foreign-based PricewaterhouseCoopers individual partnerships and legal entities, including their tax services and advisory groups.
In EUR millions 2012 2011
Financial statements audit fees 1.2 1.3
Other assurance fees 0.1 0.1
Tax fees 0.3 0.2
Total 1.6 1.6
The total fees of PricewaterhouseCoopers Accountants N.V., the Netherlands, charged to the company and its consolidated group entities amounted to EUR 0.6 million in 2012 (2011: EUR 0.6 million).
The financial statements audit fees include the aggregate fees in each of 2012 and 2011 for professional services rendered for the audit of Vopak’s annual financial statements and annual statutory financial statements of subsidiaries or services that are normally provided by the auditor in connection with the audits. The other assurance fees include the aggregate fees billed for assurance and related services including due diligence and assurance services related to potential acquisitions. The tax category includes tax advisory and compliance services.
Note 6: Result of joint ventures and associates using the equity method
In EUR millions Note 2012 2011
Result of joint ventures and associates 13 107.2 112.5
Impairments joint ventures and associates 13 - 10.1 - 3.6
Gains on sale of joint ventures and associates – 111.5
Total 97.1 220.4
The result of joint ventures and associates of 2011 included the release of tax provisions of EUR 20.8 million. Excluding this effect the result for 2012 showed an increase of EUR 15.5 million, primarily due to the full year operation of the LNG joint ventures.
In 2012, the division Asia recognized an impairment of EUR 10.1 million for its 49% interest in PT Jakarta Tank Terminal (Indonesia). The progress of deregulation of the subsidized fuel distribution is going much slower than originally assumed. Looking at the growing fuel consumption of Indonesia this is, from a long-term perspective, considered as a timing issue.
In 2011, impairments were recognized at the division Latin America for the joint venture Terminal Maritimo Vopak-Oxiquim Mejillones S.A. in Chile of EUR 2.4 million due to intensified competition as result of overcapacity in Mejillones, and under Non-allocated an impairment of EUR 1.2 million was taken for the 50% interest in a new office building in the Netherlands due to weak market demand for rental of office buildings.

Financial Statements | Consolidated Financial Statements | Notes to the Consolidated Statement of Income
Vopak | Annual Report 2012 | 121
The gains on sale of joint ventures and associates for 2011 relate to the sale of our 20% equity stake in BORCO (Bahamas).
With respect to joint ventures, to the extent that tank storage activities are concerned, the effects of the proportionate consolidation method, based on the principles that apply to the Group’s consolidated financial statements, on the statement of income and the statement of financial position are shown below.
Statement of income
In EUR millions 2012 2011
Revenues 363.0 280.1
Group operating profit 156.9 135.3
Net profit of tank storage activities 95.7 108.4
Net profit of other activities 1.4 0.5
Total net profit 1 97.1 108.9
1. Excluding Gains on sale of joint ventures and associates in 2011.
Statement of financial position
In EUR millions Note 2012 2011
Non-current assets 1,553.9 1,326.5
Current assets 202.5 156.6
Total assets 1,756.4 1,483.1
Non-current liabilities -798.2 -690.5
Current liabilities -225.8 -207.4
Total liabilities -1,024.0 -897.9
Joint ventures in tank storage activities 732.4 585.2
Joint ventures in other activities and associates 13.8 17.2
Joint ventures and associates 13 746.2 602.4
The effects of the proportionate consolidation method on the statement of financial position and statement of income of the Group are shown in the section Financial performance of the Executive Board Report.
Note 7. Interest and dividend income
In EUR millions 2012 2011
Interest income 3.6 6.6
Dividends on other financial assets 0.2 0.7
Total 3.8 7.3
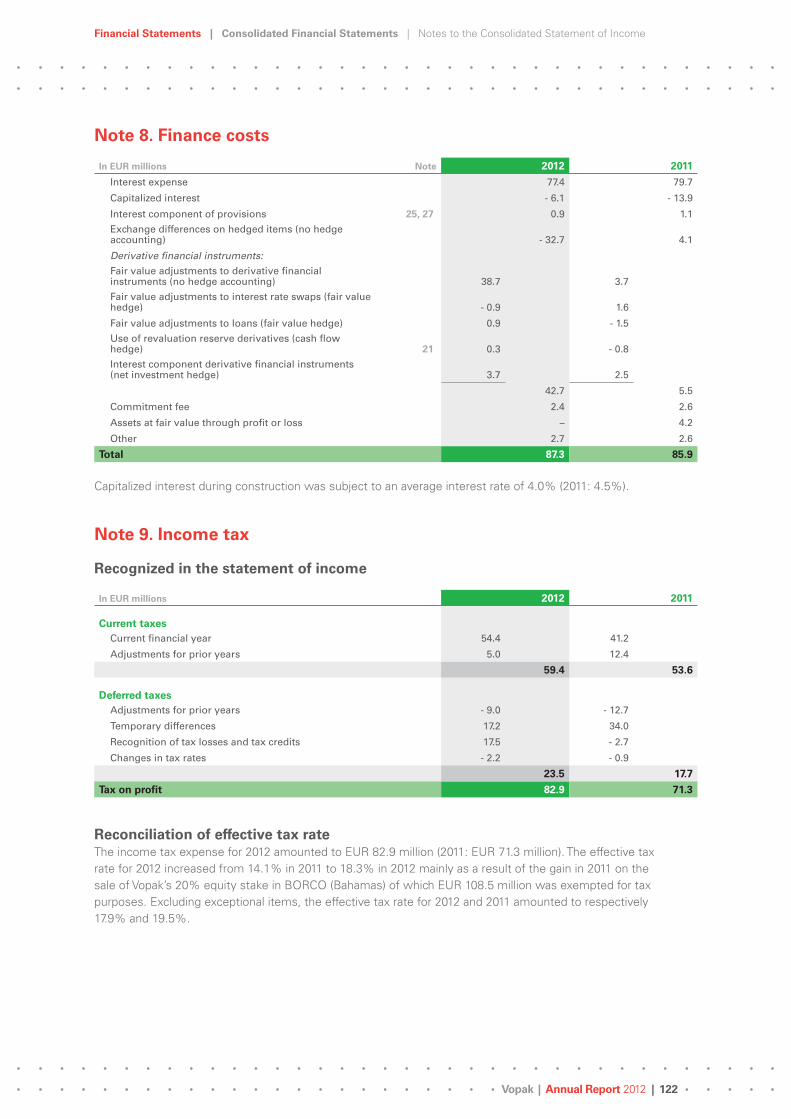
Financial Statements | Consolidated Financial Statements | Notes to the Consolidated Statement of Income
Vopak | Annual Report 2012 | 122
Note 8. Finance costs
In EUR millions Note 2012 2011
Interest expense 77.4 79.7
Capitalized interest - 6.1 - 13.9
Interest component of provisions 25, 27 0.9 1.1
Exchange differences on hedged items (no hedge accounting) - 32.7 4.1
Derivative financial instruments:Fair value adjustments to derivative financial instruments (no hedge accounting) 38.7 3.7
Fair value adjustments to interest rate swaps (fair value hedge) - 0.9 1.6
Fair value adjustments to loans (fair value hedge) 0.9 - 1.5
Use of revaluation reserve derivatives (cash flow hedge) 21 0.3 - 0.8
Interest component derivative financial instruments (net investment hedge) 3.7 2.5
42.7 5.5
Commitment fee 2.4 2.6
Assets at fair value through profit or loss – 4.2
Other 2.7 2.6
Total 87.3 85.9
Capitalized interest during construction was subject to an average interest rate of 4.0% (2011: 4.5%).
Note 9. Income tax
Recognized in the statement of income
In EUR millions 2012 2011
Current taxesCurrent financial year 54.4 41.2
Adjustments for prior years 5.0 12.4
59.4 53.6
Deferred taxesAdjustments for prior years - 9.0 - 12.7
Temporary differences 17.2 34.0
Recognition of tax losses and tax credits 17.5 - 2.7
Changes in tax rates - 2.2 - 0.9
23.5 17.7
Tax on profit 82.9 71.3
Reconciliation of effective tax rate The income tax expense for 2012 amounted to EUR 82.9 million (2011: EUR 71.3 million). The effective tax rate for 2012 increased from 14.1% in 2011 to 18.3% in 2012 mainly as a result of the gain in 2011 on the sale of Vopak’s 20% equity stake in BORCO (Bahamas) of which EUR 108.5 million was exempted for tax purposes. Excluding exceptional items, the effective tax rate for 2012 and 2011 amounted to respectively 17.9% and 19.5%.

Financial Statements | Consolidated Financial Statements | Notes to the Consolidated Statement of Income
Vopak | Annual Report 2012 | 123
In EUR millions 2012 2011
Profit before income tax 452.4 506.9
Tax on profit 82.9 71.3
Effective tax rate 18.3% 14.1%
Composition: Amount % Amount %
Weighted average statutory tax rates 106.5 23.5 121.8 24.0
Participation exemption - 24.2 - 5.3 - 55.0 - 10.8
Non-deductible expenses 6.7 1.5 7.5 1.5
Changes in tax rates - 2.2 - 0.5 - 0.8 - 0.2
Recognition of tax losses and tax credits 0.1 – 2.1 0.4
Tax facilities - 1.1 - 0.2 - 0.9 - 0.2
Movements in prior-year taxes - 4.0 - 0.9 - 0.2 –
Other effects 1.1 0.2 - 3.2 - 0.6
Effective tax (rate) 82.9 18.3 71.3 14.1
Taxes recognized in other comprehensive income
In EUR millions Note 2012 2011
On changes in the value of cash flow hedges 21 - 15.5 - 7.4
On exchange differences and hedges 21 - 0.5 - 15.7
On use of cash flow hedges 21 0.1 - 0.2
On use of exchange differences and hedges 21 – 4.0
Total - 15.9 - 19.3
Note 10. Earnings per ordinary share
Basic earnings per ordinary share are calculated by dividing the net profit attributable to holders of ordinary shares by the time-weighted average number of outstanding ordinary shares (excluding the average number of treasury shares). The weighted average number of outstanding shares was 127,360,846 in 2012 (2011: 127,251,388).
In calculating the diluted earnings per ordinary share, the weighted average number of outstanding shares is adjusted for the dilutive effects of all dilutive potential ordinary shares, like share option schemes. Both at 31 December 2012 and 31 December 2011 no options were outstanding, there was no dilutive effect.
The composition of the weighted average number of outstanding shares and of the diluted weighted average number of outstanding shares is as follows:
In thousands Note 2012 2011
Issued ordinary shares at 1 January 20 127,287 127,175
Vested shares under equity-settled share-based payment arrangements 26 74 76
Weighted average number of ordinary shares at 31 December 127,361 127,251
Dilutive effect – –
Diluted weighted average number of ordinary shares at 31 December 127,361 127,251
During 2012 and 2011 Vopak did not repurchase own shares for the equity-settled share-based long-term incentive plan. When the vesting conditions are met then the equity settlement will result in an increase of the number of outstanding shares. During 2012 117,403 shares were vested (2011: 111,793 shares).

Financial Statements | Consolidated Financial Statements | Notes to the Consolidated Statement of Financial Position
Vopak | Annual Report 2012 | 124
Notes to the Consolidated Statement of Financial Position
Note 11. Intangible assets
Movements in intangible assets were as follows:
In EUR millions Note Goodwill Software Other Total
Purchase price of operating assets 17.4 67.0 19.4 103.8
Accumulated amortization and impairment – - 51.0 - 6.9 - 57.9
Carrying amount in use 17.4 16.0 12.5 45.9
Purchase price under construction – 8.0 – 8.0
Carrying amount at 1 January 2011 17.4 24.0 12.5 53.9
Movements:
Acquisitions 16.0 – 2.7 18.7
Additions – 10.1 1.0 11.1
Disposals – - 0.1 – - 0.1
Amortization 4 – - 6.4 - 1.3 - 7.7
Impairment 4 – - 2.5 - 1.9 - 4.4
Exchange differences 1.8 - 0.5 - 0.2 1.1
Carrying amount at 31 December 2011 35.2 24.6 12.8 72.6
Purchase price of operating assets 35.2 77.4 23.1 135.7
Accumulated amortization and impairment – - 58.5 - 10.3 - 68.8
Carrying amount in use 35.2 18.9 12.8 66.9
Purchase price under construction – 5.7 – 5.7
Carrying amount at 31 December 2011 35.2 24.6 12.8 72.6
Movements:
Additions – 8.3 0.6 8.9
Disposals – - 0.2 – - 0.2
Amortization 4 – - 7.3 - 1.4 - 8.7
Impairment 4 - 5.6 – – - 5.6
Exchange differences 1.0 - 0.2 – 0.8
Carrying amount at 31 December 2012 30.6 25.2 12.0 67.8
Purchase price of operating assets 36.2 78.6 21.3 136.1
Accumulated amortization and impairment - 5.6 - 63.4 - 9.3 - 78.3
Carrying amount in use 30.6 15.2 12.0 57.8
Purchase price under construction – 10.0 – 10.0
Carrying amount at 31 December 2012 30.6 25.2 12.0 67.8
Goodwill is tested for impairment per cash-generating unit (CGU) in the fourth quarter or whenever an impairment trigger exists. A summary of the carrying amount of goodwill by operating segment is presented below.
In EUR millions 2012 2011
Europe, Middle East & Africa 4.3 9.5
Asia 22.7 22.1
Latin America 0.7 0.7
Global LNG 2.9 2.9
Carrying amount at 31 December 30.6 35.2

Financial Statements | Consolidated Financial Statements | Notes to the Consolidated Statement of Financial Position
Vopak | Annual Report 2012 | 125
ImpairmentsIn 2012, an impairment was recognized by the division Europe, Middle East & Africa for the goodwill related to a project in Turkey. During the process to get the license to operate, the land area appears to be more suitable for industrial use than for tank storage activities.
In 2011, impairments were recognized for obsolescence of software (EUR 2.5 million) and for other intangible assets (EUR 1.9 million). No impairments were recognized in 2011 for goodwill.
Determination of value in useThe Group estimates the recoverable amount of a CGU using a value in use model by projecting cash flows for the next five years. The model uses pre-tax cash flow projections which extend forward to perpetuity using a terminal value calculation and which take account of the approved budget for the coming year and the following two-year approved strategy. The strategy takes into account the past performance and its expectation of market developments. Cash flows for year four and five rely on estimates of growth factors, which are applied conservatively and do not exceed the expected growth in local economy after the fifth year. All pre-tax cash flows are discounted at a pre-tax rate depending on the risk profile of the region.
SensitivityIn the tests the growth factor for year four and five were based on a conservative rate of two per cent. The valuations indicated sufficient headroom, such that a reasonably possible change to key assumptions would not result in a material impairment of the related goodwill.

Financial Statements | Consolidated Financial Statements | Notes to the Consolidated Statement of Financial Position
Vopak | Annual Report 2012 | 126
Note 12. Property, plant and equipment
Movements in property, plant and equipment were as follows:
In EUR millions Note Land BuildingsTank storage
terminalsMachinery
and equipment Total
Purchase price of operating assets 48.1 196.4 3,224.8 173.9 3,643.2
Accumulated depreciation and impairment – - 97.8 - 1,418.9 - 104.3 - 1,621.0
Carrying amount in use 48.1 98.6 1,805.9 69.6 2,022.2
Purchase price under construction 42.7 8.9 459.8 12.5 523.9
Carrying amount at 1 January 2011 90.8 107.5 2,265.7 82.1 2,546.1
Movements:
Acquisitions – 0.6 24.6 0.2 25.4
Additions 34.4 19.2 402.4 23.2 479.2
Disposals – 0.5 - 1.8 - 0.1 - 1.4
Deconsolidation – – - 3.1 – - 3.1
Depreciation 4 – - 6.7 - 139.4 - 12.8 - 158.9
Impairment 4 – – - 7.0 – - 7.0
Exchange differences - 5.8 1.1 28.4 0.5 24.2
Carrying amount at 31 December 2011 119.4 122.2 2,569.8 93.1 2,904.5
Purchase price of operating assets 47.8 214.0 3,777.8 196.1 4,235.7
Accumulated depreciation and impairment – - 100.9 - 1,555.4 - 113.0 - 1,769.3
Carrying amount in use 47.8 113.1 2,222.4 83.1 2,466.4
Purchase price under construction 71.6 9.1 347.4 10.0 438.1
Carrying amount at 31 December 2011 119.4 122.2 2,569.8 93.1 2,904.5
Movements:
Additions 1.4 15.5 416.6 15.3 448.8
Disposals – – - 0.5 - 0.1 - 0.6
Reclassification to assets held for sale - 27.0 – – – - 27.0
Reclassification 4.9 - 1.2 - 3.7 – –
Depreciation 4 – - 8.0 - 171.3 - 14.7 - 194.0
Impairment 4 – - 0.1 - 8.5 - 0.7 - 9.3
Exchange differences - 3.6 0.2 8.2 - 0.6 4.2
Carrying amount at 31 December 2012 95.1 128.6 2,810.6 92.3 3,126.6
Purchase price of operating assets 45.4 226.0 4,117.2 204.8 4,593.4
Accumulated depreciation and impairment – - 108.6 - 1,713.6 - 123.6 - 1,945.8
Carrying amount in use 45.4 117.4 2,403.6 81.2 2,647.6
Purchase price under construction 49.7 11.2 407.0 11.1 479.0
Carrying amount at 31 December 2012 95.1 128.6 2,810.6 92.3 3,126.6
In 2012, impairments of in total EUR 9.3 million were recognized. The divisions Asia (EUR 4.1 million) and Netherlands (EUR 3.5 million) recognized impairments for obsolescense of property, plant and equipment and the division North America recognized an impairment due to demolition of assets (EUR 1.7 million).
In 2011, a total amount of EUR 7.0 million was recognized for impairments due to capacity taken out of use by the divisions Netherlands (EUR 1.7 million) and EMEA (EUR 1.6 million). In Latin America an impairment was recognized for the Ilha Barnabé terminal in Brazil (EUR 3.7 million), of which the concession agreement ended in 2012.
A jetty leased from the Harbour Authorities in Hamburg (Germany) is considered as a finance lease at 31 December 2012 (EUR 14.0 million), the finance lease obligation (EUR 14.0 million) is recognized under other long-term loans (see note 24). No property, plant and equipment was leased on finance lease at 31 December 2011.

Financial Statements | Consolidated Financial Statements | Notes to the Consolidated Statement of Financial Position
Vopak | Annual Report 2012 | 127
Note 13. Joint ventures and associates
Movements in joint ventures and associates including goodwill, were as follows:
Joint ventures Associates Total
In EUR millions Note 2012 2011 2012 2011 2012 2011
Carrying amount at 1 January 602.4 607.0 – – 602.4 607.0
Share in profit 6 107.2 112.5 – – 107.2 112.5
Dividends received 30 - 87.7 - 104.1 – – - 87.7 - 104.1
Investments 96.8 37.5 2.5 – 99.3 37.5
Acquisitions 65.7 55.9 – – 65.7 55.9
Divestments – - 102.6 – – – - 102.6
Impairments 6 - 10.1 - 3.6 – – - 10.1 - 3.6
Fair value changes of derivative financial instruments 21 - 19.5 - 22.6 – – - 19.5 - 22.6
Deconsolidation of subsidiary – 1.7 – – – 1.7
Exchange differences - 10.9 20.7 - 0.2 – - 11.1 20.7
Carrying amount at 31 December 743.9 602.4 2.3 – 746.2 602.4
The fair value changes of derivatives are related to the effective portion of changes in the fair value of cash flow hedges within the joint ventures, which are recognized through the consolidated statement of comprehensive income.
None of the joint ventures and associates are listed on the stock exchange.
Acquisitions On 30 June 2012, Vopak increased its equity stake in Gate terminal by 2.5% to 45%.
On 28 September 2012 Vopak, Greenergy and Shell UK Limited acquired the assets of the former Coryton refinery from the administrator of Petroplus Refining & Marketing Limited. The three companies are equal shareholders and will develop and invest in this facility - to be named Thames Oilport - to create a state-of-the-art import and distribution terminal for oil products to be managed by Vopak. The initial storage capacity will be around 500,000 cubic meters (cbm), with potential to expand up to 1 million cbm in later stages.
Note 14. Loans granted
Loans to joint ventures and associates Other loans Total
In EUR millions 2012 2011 2012 2011 2012 2011
Carrying amount at 1 January 37.7 5.6 4.3 7.6 42.0 13.2
Movements:
Loans granted 15.0 81.9 5.0 0.6 20.0 82.5
Repayments - 30.0 - 50.7 - 1.3 - 3.8 - 31.3 - 54.5
Effective interest – – - 0.1 - 0.2 - 0.1 - 0.2
Exchange differences - 0.1 0.9 – 0.1 - 0.1 1.0
Carrying amount at 31 December 22.6 37.7 7.9 4.3 30.5 42.0
Non-current receivables 7.7 2.0 4.6 2.6 12.3 4.6
Current receivables 14.9 35.7 3.3 1.7 18.2 37.4
Carrying amount at 31 December 22.6 37.7 7.9 4.3 30.5 42.0
Loans granted include no subordinated loans.

Financial Statements | Consolidated Financial Statements | Notes to the Consolidated Statement of Financial Position
Vopak | Annual Report 2012 | 128
Please see note 29 for the fair value and for information on the effective interest rates and the periods in which they are reviewed. With respect to the loans granted that are neither impaired nor past due, there are no indications as of the reporting date that the debtors will not meet their payment obligations. As of 31 December 2012, the expected maturities are as follows:
2013 2014 2015 2016 2017 > 2017 Total
Loans to joint ventures and associates 14.9 – – 0.4 5.3 2.0 22.6
Other loans 3.3 – 2.5 – – 2.1 7.9
Total 18.2 – 2.5 0.4 5.3 4.1 30.5
Note 15. Deferred taxes
The deferred tax assets and liabilities were allocated as follows:
Temporary differences
In EUR millions
Carry forward
losses
Property, plant &
equipmentLoans
grantedEmployee
benefits Other Other
Offset assets
and liabilities
State-ment of
financial position
Assets 19.7 12.4 – 3.9 7.5 1.3 - 38.4 6.4
Liabilities – - 181.4 - 7.7 - 28.5 - 24.8 – 38.4 - 204.0
Balance 1 January 2011 19.7 - 169.0 - 7.7 - 24.6 - 17.3 1.3 – - 197.6
Movements:
– Acquisitions/divestments – - 7.1 – – – – - 7.1
– Other comprehensive income – - 2.4 0.6 - 0.1 7.2 0.1 5.4
– Other - 0.2 – – – – – - 0.2
– Statement of income 20.7 - 20.1 – - 16.1 - 2.2 – - 17.7
Balance 31 December 2011 40.2 - 198.6 - 7.1 - 40.8 - 12.3 1.4 - 217.2
Assets 40.2 15.2 0.1 4.2 17.7 1.4 - 47.9 30.9
Liabilities – - 213.8 - 7.2 - 45.0 - 30.0 – 47.9 - 248.1
Balance 31 December 2011 40.2 - 198.6 - 7.1 - 40.8 - 12.3 1.4 – - 217.2
Movements:
– Other comprehensive income – - 0.9 0.7 – 14.5 – 14.3
– Other - 0.2 – – – – - 0.2 - 0.4
– Statement of income - 16.5 - 18.5 0.2 - 5.5 16.2 0.6 - 23.5
Balance 31 December 2012 23.5 - 218.0 - 6.2 - 46.3 18.4 1.8 - 226.8
Assets 23.5 9.2 0.1 4.3 33.7 1.8 - 39.1 33.5
Liabilities – - 227.2 - 6.3 - 50.6 - 15.3 – 39.1 - 260.3
Balance 31 December 2012 23.5 - 218.0 - 6.2 - 46.3 18.4 1.8 – - 226.8
Deferred tax assets and liabilities are offset against each other to the extent that this is a legally enforceable right and the deferrals belong to the same fiscal unit. The decision to account for deferred tax assets is taken annually per each fiscal unit after critically assessing whether conditions are sufficient to realize these deferred tax assets, based on the strategic plans and related tax plans.
Carry-forward losses for which deferred tax assets have not fully been recognized amounted to EUR 30.2 million at 31 December 2012 (2011: EUR 29.2 million). The maturity schedule is as follows:
In EUR millions 2013 2014 2015 2016 2017+ unlimited Total
Offsettable carry-forward losses 2.5 1.8 3.7 4.1 3.5 14.6 30.2

Financial Statements | Consolidated Financial Statements | Notes to the Consolidated Statement of Financial Position
Vopak | Annual Report 2012 | 129
Deferred tax assets regarding carry-forward losses have not been recognized because it is not probable that sufficient taxable profit will be available to utilize the deferred tax asset in time.
In determining the deferred tax liabilities, withholding tax and any other tax due for unremitted earnings of subsidiaries were not recognized. These earnings have been permanently reinvested.
Note 16. Other non-current assets
The prepaid land use rights are allocated to the period to which they relate. The terms remaining at 31 December 2012 vary between 9 to 47 years.
Note 17. Trade and other receivables
In EUR millions 2012 2011
Trade debtors gross 85.0 84.5
Provision for impairment of trade debtors - 0.7 - 0.7
Trade debtors net 84.3 83.8
Taxes receivable 49.9 55.2
Other receivables 142.4 98.4
Total 276.6 237.4
Trade and other receivables are measured at amortized cost, using the effective interest method, less any provision for impairment. There was no indication as at the statement of financial position date that these receivables will not be recovered, other than as already provided for.
At 31 December 2012, trade receivables of EUR 28.4 million (2011: EUR 28.7 million) were past due but not impaired. Exposure to bad debts is mostly related to rendering services to international manufacturers. The value of the products stored for these clients usually exceeds the value of the receivables and Vopak generally has the right of retention. The ageing analysis of these trade receivables is as follows:
2012 2011
In EUR millions Gross Provision Net Gross Provision Net
Not past due 55.9 – 55.9 55.1 – 55.1
Past due up to 3 months 24.5 0.1 24.4 26.1 0.1 26.0
Past due 3 to 6 months 3.0 – 3.0 1.6 0.2 1.4
Past due more than 6 months 1.6 0.6 1.0 1.7 0.4 1.3
Total 85.0 0.7 84.3 84.5 0.7 83.8
Movements on the provision for impairment of trade receivables are as follows:
In EUR millions 2012 2011
Balance at 1 January 0.7 1.7
Impairments 0.7 0.3
Reversal of impairments - 0.2 - 0.3
Receivables written off during the year as uncollectible - 0.5 - 1.0
Balance at 31 December 0.7 0.7
The creation and release of provision for impaired trade receivables were recognized under Other operating expenses.

Financial Statements | Consolidated Financial Statements | Notes to the Consolidated Statement of Financial Position
Vopak | Annual Report 2012 | 130
Other receivables include the dividend receivables from joint ventures for which the decision about dividend distribution was taken at the end of 2012 and payment was done in January 2013. The total dividend receivable amounted to EUR 53.7 million at the end of 2012 (2011: EUR 12.2 million). Also for the other items of Other receivables there are no amounts overdue nor impaired and there have been no defaults in the past.
Note 18. Cash and cash equivalents
In EUR millions 2012 2011
Cash and bank 70.1 48.5
Short-term deposits 381.9 40.2
Total 452.0 88.7
Cash and cash equivalents include all cash balances and short-term deposits, which are immediately redeemable. The effective interest rate on short-term deposits at year-end 2012 was 0.3% (2011: 2.8%); these deposits have an average term of 60 days (2011: 73 days) and are subject to limited value changes.
Reconciliation with the consolidated cash flow statement is as follows:
In EUR millions 2012 2011
Cash and cash equivalents 452.0 88.7
Bank overdrafts - 16.3 - 155.7
Total 435.7 - 67.0
The cash and cash equivalents were at free disposal of the Group as at 31 December 2012 as well as at 31 December 2011.
Note 19. Assets held for sale
The assets held for sale consist of a plot of land in Yalova (Turkey). Due to the decision at the end of 2012 to stop with the development of the project, the land has been put for sale. There is no indication that the recoverable amount will be lower than the carrying amount at 31 December 2012.
Note 20. Issued capital, share premium and treasury shares
The company’s authorized share capital amounts at 31 December 2012 to EUR 190,800,000, divided into 140,000,000 ordinary shares, 190,800,000 protective preference shares and 50,800,000 financing preference shares, all with a nominal value of EUR 0.50 each.
The issued share capital at 31 December 2012 consists of 127,835,430 ordinary shares and 41,400,000 financing preference shares. Of the issued ordinary shares, 430,804 are held in the treasury stock in connection with existing commitments under the long-term incentive plans.

Financial Statements | Consolidated Financial Statements | Notes to the Consolidated Statement of Financial Position
Vopak | Annual Report 2012 | 131
Movements in the number of shares, the issued capital and the share premium were as follows:
Numbers Amounts in EUR millions
Issued ordi-nary shares
Financing preference
shares Total sharesTreasury
sharesIssued capital
Share premium
Treasury shares
Balance at 1 January 2011 127,835,430 41,400,000 169,235,430 - 660,000 84.6 281.2 - 14.9Vested shares under equity-settled share-based payment arrangements – – – 111,793 – – 1.9
Balance at 31 December 2011 127,835,430 41,400,000 169,235,430 - 548,207 84.6 281.2 - 13.0
Capital reduction – – – – – - 33.0 –
Vested shares under equity-settled share-based payment arrangements – – – 117,403 – – 1.8
Balance at 31 December 2012 127,835,430 41,400,000 169,235,430 - 430,804 84.6 248.2 - 11.2
The dividend percentage on the outstanding financing preference shares (nominal value plus share premium) has been 7.45%. The percentage will be set again every five years, for the first time on 1 January 2015. The dividend for 2012 will amount to EUR 8.2 million (2011: EUR 8.2 million).
Under the Articles of Association, a dividend can only be distributed on financing preference shares following a decision by the Executive Board, subject to the approval of the Supervisory Board, to transfer all or part of the profit to equity. If the transfer to equity results in the remaining profit being insufficient to distribute a dividend on the financing preference shares, an amount equal to the shortfall will be deducted from the amount to be transferred to equity and added to the dividend reserve for the financing preference shares. The dividend reserve will have primary dividend rights in subsequent financial years, any dividend either being added to the dividend reserve or distributed on the financing preference shares, as far as possible and at the discretion of the Executive Board, subject to the approval of the Supervisory Board.
The Articles of Association also stipulate that only the Executive Board, subject to the approval of the Supervisory Board, is authorized to make decisions to distribute dividends from the share premium and the dividend reserve for the financing preference shares.
As from January 2011, the Company has the right to repurchase the financing preference shares in five annual payments. If the company decides to repurchase them, only share premium will be repaid in the first four years. The annual repayment of the share premium will be limited to a maximum of 20% of the outstanding share capital of the financing preference shares of EUR 110 million at 31 December 2009. If the Company did not make use of this right in the previous year the Company can make a 30% distribution in the subsequent year, as 50% of the backlog in distribution of the previous year may be taken into account. On 18 December 2012, the Supervisory Board approved the proposal of the Executive Board to make a payment of EUR 33 million (30%) from the share premium to the financing preference shareholders at 2 January 2013. The outstanding share capital consequently reduced from EUR 110 million to EUR 77 million and the annual dividend potentially distributable to the holders of financing shares decreased to EUR 5.7 million. As a result of this distribution, the balance of the share premium for the outstanding 41,400,000 financing preference shares dropped to EUR 55.6 million at 31 December 2012.
Dividend will only be distributed on ordinary shares after the dividend on the financing preference shares has been distributed, on the understanding that no dividend will be distributed on the ordinary shares if, at the time of the intended distribution, the balance of the dividend reserve for the financing preference shares is positive.

Financial Statements | Consolidated Financial Statements | Notes to the Consolidated Statement of Financial Position
Vopak | Annual Report 2012 | 132
After adoption of the financial statements 2011 by the Annual General Meeting, the Company delivered 117,403 shares from treasury stock, for the purposes of fulfilling the Company’s obligation of the vested conditional shares under the long-term incentive plans.
Note 21. Other reserves
Movements in other reserves were as follows:
In EUR millionsTranslation
reserve
Revaluationreserve
derivatives
Revaluation reserveassets
Transaction reserve NCI
Total other reserves
Balance at 1 January 2011 31.6 - 33.6 6.1 – 4.1
Exchange differences on net investments 34.7 – – – 34.7
Effective part of hedges of net investments - 34.9 – – – - 34.9
Tax effect on exchange differences and hedges 15.7 – – – 15.7
Use of exchange differences on net investments joint ventures (to statement of income) 4.6 – – – 4.6
Tax on release exchange differences and hedges - 4.0 – – – - 4.0
Movements in effective part of cash flow hedges – - 29.7 – – - 29.7
Tax effect on movements in cash flow hedges – 7.4 – – 7.4
Use of effective part of cash flow hedges (to statement of income) – - 1.2 – – - 1.2
Tax effect on use of cash flow hedges – 0.2 – – 0.2
Movements in effective part of cash flow hedges joint ventures – - 25.2 – – - 25.2
Use of effective part of cash flow hedges joint ventures (to statement of income) – 2.6 – – 2.6
Depreciaton on revaluation of assets – – - 0.2 – - 0.2
Balance at 31 December 2011 47.7 - 79.5 5.9 – - 25.9
Exchange differences on net investments - 8.8 – – – - 8.8
Effective part of hedges of net investments - 3.2 – – – - 3.2
Tax effect on exchange differences and hedges 0.5 – – – 0.5
Movements in effective part of cash flow hedges – - 61.9 – – - 61.9
Tax effect on movements in cash flow hedges – 15.5 – – 15.5
Use of effective part of cash flow hedges (to statement of income) – 0.3 – – 0.3
Tax effect on use of cash flow hedges – - 0.1 – – - 0.1
Movements in effective part of cash flow hedges joint ventures – - 19.5 – – - 19.5
Depreciaton on revaluation of assets – – - 0.7 – - 0.7
Tax effect on depreciation on revaluation of assets – – 0.1 – 0.1
Result sale non-controlling interest of subsidiary – – – 1.3 1.3
Balance at 31 December 2012 36.2 - 145.2 5.3 1.3 - 102.4
The translation reserve includes all exchange differences resulting from the translation of the financial statements of foreign entities. It also includes the exchange differences on liabilities and the effective currency component of fair value changes of derivative financial instruments (net of tax), to the extent that they hedge the net investments of the Group in foreign entities and hedge accounting is applied.
The revaluation reserve derivatives contains the effective part of the accumulated change in the fair value of the cash flow hedges, net of tax, in respect of which the hedged future transaction has not yet taken place. The schedule for use is as follows:
In EUR millions 2013 2014 2015 2016 2017 > 2017 Total
Use of revaluation reserve derivatives 13.5 15.7 10.9 7.8 10.7 86.6 145.2

Financial Statements | Consolidated Financial Statements | Notes to the Consolidated Statement of Financial Position
Vopak | Annual Report 2012 | 133
Note 22. Retained earnings
Movements in retained earnings were as follows:
In EUR millions 2012 2011
Balance at 1 January 1,402.4 1,098.4
Dividend paid in cash - 110.1 - 97.3
Vested shares under equity-settled share-based payment arrangements - 1.8 - 1.9
Measurement of equity-settled share-based payment arrangements - 0.4 2.4
Release of revaluation reserve due to depreciation 0.6 0.2
Net profit attributable to owners of parent 329.7 400.6
Balance at 31 December 1,620.4 1,402.4
Of the retained earnings, EUR 1,259.5 million can be distributed freely (see note 4 to Company Financial Statements). The dividend paid in cash consists of a dividend on the financing preference shares of EUR 8.2 million and a dividend in cash of EUR 0.80 per ordinary share.
Note 23. Non-controlling interests
Statement of changes in non-controlling interests:
In EUR millions 2012 2011
Balance at 1 January 108.5 96.7
Net profit 39.8 35.0
Dividend - 25.9 - 27.4
Carrying amount of non-controlling interest sold 2.5 –
Movements in effective part of cash flow hedges 0.5 0.1
Exchange differences 3.4 4.1
Balance at 31 December 128.8 108.5
The non-controlling interests mainly consist of the non-controlling interest of the activities in Singapore. The profit for the financial year 2012 includes an exceptional loss of EUR 0.3 million due to the impairment of assets at Perth Amboy in North America (2011: no exceptional items).
Vopak’s controlling interest in the subsidiary Vopak Terminal Perth Amboy LLC increased from 82.17% at year-end 2011 to 86.44% at year-end 2012 due to capital contribution. This contribution differed from its original pro rata share.
In December 2012 Vopak sold a 30% non-controlling interest in Vopak Terminal Durban to Reatile Chemicals (Pty) Limited. With Reatile Vopak Terminal Durban gains a shareholder contributing extensive local business experience required to enable further growth. The transaction did not result in a loss of control and the gain of EUR 1.3 million is accounted for as an equity transaction, specified as follows:
In EUR millions 2012
Balance at 1 January –
Carrying amount non-controlling interest of subsidiary disposed of - 2.5
Consideration received from non-controlling interest 3.8
Balance at 31 December 1.3

Financial Statements | Consolidated Financial Statements | Notes to the Consolidated Statement of Financial Position
Vopak | Annual Report 2012 | 134
Note 24. Interest-bearing loans
A break-down is set out below:
In EUR millions 2012 2011
Non-current interest-bearing loansUS Private Placements 1 1,571.6 840.2
SGD Private Placements 271.0 260.8
JPY Private Placements 174.7 200.9
Bank loans 52.2 119.2
Credit facilities - 3.7 95.1
Other long-term loans 18.0 5.3
Total 2,083.8 1,521.5
Current interest-bearing loansUS Private Placements 26.8 16.5
Bank loans 72.0 –
Other long-term loans 0.6 0.6
Total 99.4 17.1
Total interest-bearing loans 2,183.2 1,538.6
1. Including subordinated debt of EUR 81.8 million.
Breakdown of loans by currency:
Local currency Euro
In millions 2012 2011 2012 2011
Euro (EUR) 91.9 151.5 91.9 151.5
US dollar (USD) 1,934.7 1,008.1 1,459.2 776.2
Pound sterling (GBP) 35.0 25.0 43.1 30.0
Canadian dollar (CAD 25.0 – 19.1 –
Singapore dollar (SGD) 635.0 635.0 395.2 380.0
Japanese yen (JPY) 20,000.0 20,000.0 174.7 200.9
Total 2,183.2 1,538.6
The interest-bearing loans mainly consist of unsecured Private Placements (PPs) in the US and Asian market. The US PPs consist of various financing programs entered into in 2001, 2007, 2009 and 2012. The Revolving Credit Facility (RCF) of EUR 1.2 billion was fully available at year-end 2012. The amounts drawn, the average remaining maturities and the main covenant ratios are shown in the table below. For further details on the fair value and possible currency and interest rate risks, please see note 29.
US PPs 2001
US PPs 2007
Other PPs and RCF Total
Amount drawn at 31 December 2012 (in EUR millions) 33.3 282.7 1,642.6 1,958.6
Average remaining terms (in years) 1 6 11 10
Required ratios Actual ratios
Senior net debt : EBITDA (maximum) 1 3.75 3.75 3.75 2.39
Total net debt : EBITDA (maximum) 1 3.75 4.25 Unlimited 2.50
Interest cover (minimum) 2 4.00 3.50 3.50 8.70
1. For a breakdown of the calculation of the Senior and Total net debt, please see the Funding table under Financial performance in this report.
2. Interest cover is the ratio of the EBITDA and the net finance costs.

Financial Statements | Consolidated Financial Statements | Notes to the Consolidated Statement of Financial Position
Vopak | Annual Report 2012 | 135
At 31 December 2012, Vopak comfortably met the applicable financial ratios.
Besides the loans mentioned in the table above a bank loan of SGD 200 million was drawn by Vopak Terminals Singapore Pte Ltd. (VTS) on the basis of VTS’s credit standing and is subject to a Debt : Equity ratio, which may not exceed 1.5 : 1; the ratio between EBITDA and the net finance costs should be at least 4 : 1; and shareholders’ equity must be at least SGD 150.0 million. These ratios were also comfortably met.
Note 25. Pensions and other employee benefits
Movements in the provision for pensions and other employee benefits were as follows:
In EUR millions 2012 2011
Balance at 1 January - 142.3 - 74.1
Movements:
Net periodic pension charges 23.8 25.5
Interest accrual employer's contribution for years of past service 0.5 0.6
Employer's contribution - 48.5 - 94.3
Exchange differences - 0.2 –
Other - 0.7 –
Balance at 31 December - 167.4 - 142.3
Current assets – - 0.1
Non-current assets - 201.8 - 178.9
Current liabilities 1.7 2.0
Non-current liabilities 32.7 34.7
Balance at 31 December - 167.4 - 142.3
The majority of employees are covered by defined benefit plans, defined contribution plans or mandatory external pension plans. The defined benefit plans are plans in the Netherlands, the United States, the United Kingdom, Germany and Belgium. In the Netherlands, most plans are average pay pension plans, while the other countries mostly operate final pay pension plans. The measurement of obligations under defined benefit plans takes future salary increases into account and uses a discount rate equal to the interest rate on high-quality corporate bonds for calculating their net present value. The effect of the difference between projected and actual salary increases and that of the difference between projected and actual returns on plan assets are both part of the actuarial results. The actuarial result does not entail a funding obligation. It arises from a calculation method to allocate the plan liabilities to individual years.
To the extent that unrecognized net actuarial results exceed the margin of 10% of the greater of plan assets and defined benefit obligations, they are allocated to the results over a period of about 12 years, equal to the average years of future services.
Where applicable the asset ceiling test was performed in accordance with IAS 19.58 and IFRIC 14.
The ITP2 plan in Sweden is financed through insurance with the Alecta insurance company and is classified as a multi-employer defined benefit plan. The contribution to this multi-employer plan is treated as defined contribution because it is not possible to receive information to enable to account for it as defined benefit plan.
Due to legislative changes in the Netherlands, the early retirement schemes for employees born on or after 1 January 1950 were curtailed as per 1 January 2006. These employees were offered defined

Financial Statements | Consolidated Financial Statements | Notes to the Consolidated Statement of Financial Position
Vopak | Annual Report 2012 | 136
contribution plans and a contribution to the life-cycle scheme instead. A provision was formed in 2006 for future contributions that correspond to the years of past service. The employer’s contribution to these defined contribution plans amounted to EUR 4.2 million in 2012 (2011: EUR 4.7 million), of which EUR 1.6 million (2011: EUR 2.6 million) is compensated for by the release from the provision for defined contribution plans for years of past service.
The following tables summarize the effects on the statement of financial position, the statement of income and assumptions underlying the actuarial calculations relating to the average or final pay plans and the other benefit plans.

Financial Statements | Consolidated Financial Statements | Notes to the Consolidated Statement of Financial Position
Vopak | Annual Report 2012 | 137
The Netherlands Foreign Total
in EUR millions Note 2012 2011 2012 2011 2012 2011
Movements in pension obligationsObligations at 1 January 621.0 648.2 158.4 135.9 779.4 784.1
Movements:
– Costs of rights accrued in the financial year 7.7 8.2 4.5 3.7 12.2 11.9
– Interest expenses 33.2 33.1 7.3 6.9 40.5 40.0
– Actuarial gains (–) and losses 275.1 - 33.5 18.5 13.1 293.6 - 20.4
– Benefits paid from the pension fund - 37.8 - 35.9 - 4.2 - 4.2 - 42.0 - 40.1
– Benefits paid directly by the employer – – - 1.8 - 1.7 - 1.8 - 1.7
– Employees' contributions 1.3 0.9 0.3 0.3 1.6 1.2
– Exchange differences – – 0.3 4.4 0.3 4.4
Obligations at 31 December 900.5 621.0 183.3 158.4 1,083.8 779.4
Movements in plan assetsFair value of plan assets at 1 January 728.0 655.2 98.6 93.1 826.6 748.3
Movements:
– Expected return on assets 36.1 34.4 6.8 5.9 42.9 40.3
– Actuarial gains and losses (–) 84.6 0.1 6.3 - 6.4 90.9 - 6.3
– Employer's contributions 22.6 73.3 13.8 8.8 36.4 82.1
– Employees' contributions 1.3 0.9 0.3 0.3 1.6 1.2
– Benefits paid - 37.8 - 35.9 - 5.9 - 5.9 - 43.7 - 41.8
– Exchange differences – – 0.6 2.8 0.6 2.8
Fair value of plan assets at 31 December 834.8 728.0 120.5 98.6 955.3 826.6
Obligations less fair value of plan assets at 31 December 65.7 - 107.0 62.8 59.8 128.5 - 47.2
Net actuarial gains and losses (–) not yet recognized - 256.9 - 66.3 - 49.5 - 41.1 - 306.4 - 107.4
Net pension assets (–) and obligations under defined benefit plans recognized at 31 December - 191.2 - 173.3 13.3 18.7 - 177.9 - 154.6
Net pension obligations under defined contribution plans 9.5 10.6 1.0 1.7 10.5 12.3
Net pension obligations recognized at 31 December - 181.7 - 162.7 14.3 20.4 - 167.4 - 142.3
Components of net periodic pension chargesCurrent service costs 7.7 8.2 4.5 3.7 12.2 11.9
Interest expense 33.1 33.1 7.4 6.9 40.5 40.0
Expected return on assets - 36.1 - 34.4 - 6.8 - 5.9 - 42.9 - 40.3
Amortization of actuarial gains and losses – 2.8 3.5 1.5 3.5 4.3
Pension charges defined benefit plans 3 4.7 9.7 8.6 6.2 13.3 15.9Employer's contribution to defined contribution plans 7.2 6.6 4.9 5.6 12.1 12.2
Release of provision for employer's contribution corresponding to years of past service - 1.6 - 2.6 – – - 1.6 - 2.6
Pension charges defined contribution plans 3 5.6 4.0 4.9 5.6 10.5 9.6
Net periodic pension charges 10.3 13.7 13.5 11.8 23.8 25.5
Assumptions based on weighted average at 31 December
Discount rate 3.25% 5.50% 3.96% 4.68% 3.37% 5.33%
Expected return on plan assets 3.25% 5.00% 3.96% 6.65% 3.37% 5.20%
Expected general salary increase 3.00% 3.00% 3.79% 3.91% 3.13% 3.18%
Expected price index increase 2.00% 2.00% 2.79% 2.90% 2.13% 2.18%

Financial Statements | Consolidated Financial Statements | Notes to the Consolidated Statement of Financial Position
Vopak | Annual Report 2012 | 138
The discount rates used in the determination of defined benefit obligations and pension charges are based on high quality corporate bonds (AA) with a duration matching the duration of the pension liabilities. The expected return on plan assets for 2012 is based on the 10 year median (real) returns as determined in a global asset model from our asset consultant. Under revised IAS 19 the expected return on plan asets is based on the discount rate, which is reflected in the assumptions at 31 December 2012.
In addition to the assumptions reflected in the table, the calculations were also based on recent mortality tables, taking the developments in mortality rates into account through projections or surpluses. These led to the following average life expectancy in years:
The Netherlands Foreign
In years 2012 2011 2012 2011
Age 45
Men 42.5 41.8 41.1 40.1
Women 43.6 43.6 43.6 42.8
Age 65
Men 21.9 21.5 20.9 20.7
Women 23.7 24.0 23.3 23.4
Local historical data was used for the purposes of turnover and disability assumptions.
Composition plan assetsPlan assets are comprised as follows:
The Netherlands Foreign
In EUR millions 2012 2011 2012 2011
Bonds 595.4 71% 505.2 69% 54.4 45% 41.5 42%
Equity instruments 220.4 27% 203.9 28% 62.5 52% 53.8 55%
Real estate 19.0 2% 18.9 3% 3.6 3% 3.3 3%
Total 834.8 100% 728.0 100% 120.5 100% 98.6 100%
Investments are well diversified, such that the failure of any single investment would not have a material impact on the overall level of assets. The value of the equity instruments are based on quoted prices (unadjusted) in active markets.
The German pension plans are not funded; the defined benefit obligations for these plans total EUR 18.5 million (2011: EUR 15.0 million). The pension funds have not invested directly in shares in Koninklijke Vopak N.V., parts of the Group or in real-estate of the Group.
Expected contribution and impact on resultThe total employer’s contribution for defined benefit plans declined from EUR 82.1 million in 2011 to EUR 36.4 million in 2012. This is mainly due to additional contributions. In 2012 an additional contribution of EUR 5.2 million was made to the UK pension fund, whilst in 2011 the Dutch pension fund received an additional contribution of EUR 50 million. The total employer’s contribution is expected to decrease with approximately EUR 5.6 million in 2013.
The pension charge from defined benefit plans for 2013 and the comparative figures for 2012 will be based on Revised IAS 19. The pension charge from defined benefit plans is expected to increase from EUR 13.3 million (revised EUR 8.5 million) in 2012 to approximately EUR 24.7 million in 2013, mainly due to lower discount rates.

Financial Statements | Consolidated Financial Statements | Notes to the Consolidated Statement of Financial Position
Vopak | Annual Report 2012 | 139
Historical figuresThe amounts in respect of defined benefit plans are as follows at 31 December of the current year under review and previous years under review:
In EUR millions 2012 2011 2010 2009 2008
Obligations 1,083.8 779.4 784.1 727.8 711.0
Fair value of plan assets 955.3 826.6 748.3 673.3 624.1
Obligations minus fair value at 31 December 128.5 - 47.2 35.8 54.5 86.9
Actuarial gains (–) and losses pension obligations 293.6 - 20.4 44.3 21.7 - 4.8
Actual return on plan assets 133.8 34.0 82.8 64.2 - 110.5
Expected return on plan assets 42.9 40.3 42.8 35.3 44.1
Actuarial gains and losses (–) plan assets 90.9 - 6.3 40.0 28.9 - 154.6
Sensitivity analysisThe table below shows the estimated impact on the plan assets, defined benefit obligations and pension charges for defined benefit plans for each risk variable under the revised standard IAS 19.
Risk assumptions
Assets Liabilities Pension charges
In EUR millions Change Increase Decrease Increase Decrease Increase Decrease
Price inflation 1.0% – – 49.0 - 45.6 4.1 - 4.2
Salary growth 0.25% – – 2.0 - 1.9 1.4 - 0.2
Discount rates 1.0% – – - 154.2 199.7 - 10.9 11.3
Equity prices 20.0% 56.6 - 56.6 – – – –
Life expectation 1 year – – 38.3 – 2.0 –
Given the IFRS methodology differences compared with the assumption do not affect the net pension charges for 2013.
Management of pension risk Vopak operates a number of pension schemes including defined benefit schemes. The Dutch pension scheme represents 83% of the total defined benefit obligation, whilst the pension schemes in the United Stated (6%) and United Kingdom (7%) also represent a significant part of the total defined benefit obligation.
The liabilities and pension charges related to the defined benefit schemes are subject to risks regarding changes in discount rates, plan asset values and returns derived from these assets, future salary increases, inflation and life expectancy. Such changes can negatively or positively influence the liabilities and necessitate additional future pension charges under IAS 19. For a sensitivity analysis with respect to the impact on pension charges of changes in the major assumptions we refer to the above table.
The risks of market related fluctuations in the value of plan assets are managed through prudent investment strategies and by close monitoring. The investment strategies are set in line with liabilities and local practice and usually derive from asset liability studies executed in consultation with external advisors. In order to match liabilities, interest rate hedging and currency hedging strategies have been implemented and in order to stabilize returns, diversification is pursued. The monitoring covers for example risks related to interest rates, equities, currencies, credit and insurance. The investment strategies are set within the relevant directions of regulatory authorities (for the Netherlands: ‘De Nederlandsche Bank’).
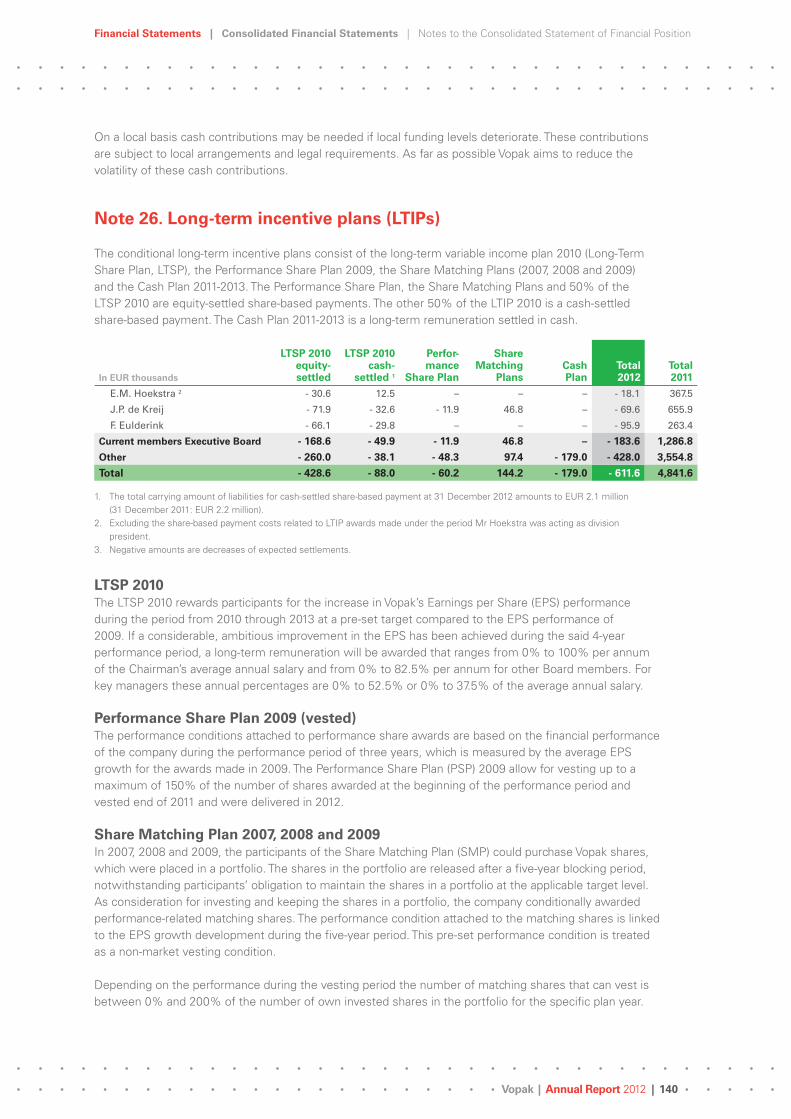
Financial Statements | Consolidated Financial Statements | Notes to the Consolidated Statement of Financial Position
Vopak | Annual Report 2012 | 140
On a local basis cash contributions may be needed if local funding levels deteriorate. These contributions are subject to local arrangements and legal requirements. As far as possible Vopak aims to reduce the volatility of these cash contributions.
Note 26. Long-term incentive plans (LTIPs)
The conditional long-term incentive plans consist of the long-term variable income plan 2010 (Long-Term Share Plan, LTSP), the Performance Share Plan 2009, the Share Matching Plans (2007, 2008 and 2009) and the Cash Plan 2011-2013. The Performance Share Plan, the Share Matching Plans and 50% of the LTSP 2010 are equity-settled share-based payments. The other 50% of the LTIP 2010 is a cash-settled share-based payment. The Cash Plan 2011-2013 is a long-term remuneration settled in cash.
In EUR thousands
LTSP 2010 equity-settled
LTSP 2010 cash-
settled 1
Perfor-mance
Share Plan
Share Matching
PlansCashPlan
Total 2012
Total 2011
E.M. Hoekstra 2 - 30.6 12.5 – – – - 18.1 367.5
J.P. de Kreij - 71.9 - 32.6 - 11.9 46.8 – - 69.6 655.9
F. Eulderink - 66.1 - 29.8 – – – - 95.9 263.4
Current members Executive Board - 168.6 - 49.9 - 11.9 46.8 – - 183.6 1,286.8
Other - 260.0 - 38.1 - 48.3 97.4 - 179.0 - 428.0 3,554.8
Total - 428.6 - 88.0 - 60.2 144.2 - 179.0 - 611.6 4,841.6
1. The total carrying amount of liabilities for cash-settled share-based payment at 31 December 2012 amounts to EUR 2.1 million (31 December 2011: EUR 2.2 million).
2. Excluding the share-based payment costs related to LTIP awards made under the period Mr Hoekstra was acting as division president.
3. Negative amounts are decreases of expected settlements.
LTSP 2010The LTSP 2010 rewards participants for the increase in Vopak’s Earnings per Share (EPS) performance during the period from 2010 through 2013 at a pre-set target compared to the EPS performance of 2009. If a considerable, ambitious improvement in the EPS has been achieved during the said 4-year performance period, a long-term remuneration will be awarded that ranges from 0% to 100% per annum of the Chairman’s average annual salary and from 0% to 82.5% per annum for other Board members. For key managers these annual percentages are 0% to 52.5% or 0% to 37.5% of the average annual salary.
Performance Share Plan 2009 (vested)The performance conditions attached to performance share awards are based on the financial performance of the company during the performance period of three years, which is measured by the average EPS growth for the awards made in 2009. The Performance Share Plan (PSP) 2009 allow for vesting up to a maximum of 150% of the number of shares awarded at the beginning of the performance period and vested end of 2011 and were delivered in 2012.
Share Matching Plan 2007, 2008 and 2009In 2007, 2008 and 2009, the participants of the Share Matching Plan (SMP) could purchase Vopak shares, which were placed in a portfolio. The shares in the portfolio are released after a five-year blocking period, notwithstanding participants’ obligation to maintain the shares in a portfolio at the applicable target level. As consideration for investing and keeping the shares in a portfolio, the company conditionally awarded performance-related matching shares. The performance condition attached to the matching shares is linked to the EPS growth development during the five-year period. This pre-set performance condition is treated as a non-market vesting condition.
Depending on the performance during the vesting period the number of matching shares that can vest is between 0% and 200% of the number of own invested shares in the portfolio for the specific plan year.

Financial Statements | Consolidated Financial Statements | Notes to the Consolidated Statement of Financial Position
Vopak | Annual Report 2012 | 141
Movement in the number of conditional awards in 2012
In numbers E.M. Hoekstra J.P. de Kreij F. Eulderink Other Total
Outstanding at 1 January 2011 27,266 74,412 17,136 314,744 433,558
Vested – - 8,660 – - 52,602 - 61,262
Settled – – – - 29,184 - 29,184
Forfeited – – – - 4,590 - 4,590
Newly awarded – – – 28,004 28,004
Change in expected average salary 2 – 36 - 314 7,020 6,742
Outstanding at 31 December 2011 27,266 65,788 16,822 263,392 373,268
Vested - 5,154 - 21,482 – - 63,412 - 90,048
Newly awarded 1 – – – 12,104 12,104
Settled – – – - 5,694 - 5,694
Forfeited – – – - 2,352 - 2,352
Change in expected average salary 2 248 - 50 92 840 1,130
Outstanding at 31 December 2012 22,360 44,256 16,914 204,878 288,408
1. Awards under the LTSP 2010 can be made to (new) participants in special circumstances (e.g. new hires and promotions) on a pro rata basis for the remaining period starting from 1 January 2012. The fair value at grant date for the new equity-settled awards discounted to EUR 50.15 per award at an average share price of EUR 50.94. Unvested awards are forfeited upon voluntary termination of employment prior to vesting. No expected forfeitures of awards made to key executives are currently assumed apart from the actual forfeitures due to termination of employment.
2. The conditional awards under the LTSP 2010 are based on an estimated average salary over the 4-year performance period. The estimated average salaries are updated annually, which could result in an increase or decrease of the number of conditional awards at target level.

Financial Statements | Consolidated Financial Statements | Notes to the Consolidated Statement of Financial Position
Vopak | Annual Report 2012 | 142
Valuation and cost allocation
Conditional awards 1 Number of expected shares 2 Allocated cost to 3
Participants NumberValue at
grant NumberValue at vesting
Value for cost
allocation 2012 2011
E.M. Hoekstra LTSP 2010, equity-settled (conditional) 4 8,199 243,838 7,274 NA 216,329 - 30,568 150,248
LTSP 2010, cash-settled (conditional) 4 8,199 243,838 7,274 NA 381,740 12,532 217,314
LTSP 2010, equity-settled (conditional) 5 828 25,271 390 NA 11,903 - 14,390 839
LTSP 2010, cash-settled (conditional) 5 828 25,271 390 NA 20,467 - 10,528 3,196
PSP 2009 (vested and transferred) 5 5,154 83,160 7,061 343,447 113,929 - 4,147 65,411
SMP 2008 (conditional) 5 1,468 23,136 2,041 NA 32,166 10,506 6,389
SMP 2009 (conditional) 5 2,838 42,471 2,838 NA 42,471 341 13,588
27,514 686,985 27,268 343,447 819,005 - 36,254 456,985
J.P. de KreijLTSP 2010, equity-settled (conditional) 9,149 268,157 6,678 NA 195,732 - 71,861 113,170
LTSP 2010, cash-settled (conditional) 9,149 268,157 6,678 NA 350,461 - 32,598 175,342
PSP 2009 (vested and transferred) 14,722 237,539 20,169 981,020 325,427 - 11,875 186,859
SMP 2007 (vested and transferred) 6,760 97,851 12,371 601,725 179,070 - 5,863 62,277
SMP 2008 (conditional) 7,674 111,081 10,666 NA 154,390 50,425 30,655
SMP 2009 (conditional) 18,284 273,620 18,284 NA 273,620 2,188 87,560
65,738 1,256,405 74,846 1,582,745 1,478,700 - 69,584 655,863
F. EulderinkLTSP 2010, equity-settled (conditional) 8,457 247,875 6,172 NA 180,901 - 66,121 103,084
LTSP 2010, cash-settled (conditional) 8,457 247,875 6,172 NA 323,907 - 29,760 160,303
16,914 495,750 12,344 – 504,808 - 95,881 263,387
Current members Executive Board 110,166 2,439,140 114,458 1,926,192 2,802,513 - 201,719 1,376,235
Other senior executivesLTSP 2010, equity-settled (conditional) 84,813 2,720,120 33,702 NA 1,071,610 - 224,506 612,079
LTSP 2010, equity-settled (settled and transferred) 1,243 37,091 211 10,263 6,296 - 21,157 - 809
LTSP 2010, cash-settled (conditional) 84,813 2,720,120 33,702 NA 1,768,681 - 1,763 869,707
LTSP 2010, cash-settled (settled) 1,243 37,091 211 10,263 10,263 - 25,893 6,206
PSP 2009 (vested and transferred) 63,412 1,023,153 74,355 3,616,628 1,199,718 - 44,166 656,798
SMPs (settled and transferred in 2011) 29,184 426,556 22,565 740,254 326,933 – 105,585
SMP 2008 (conditional) 9,302 146,599 12,931 NA 203,793 66,555 40,465
SMP 2008 (settled) 6 2,742 43,214 2,863 139,256 45,121 16,592 –
SMP 2009 (conditional) 25,950 388,341 25,546 NA 382,296 1,184 124,269
SMP 2009 (settled and transferred) 6 466 6,974 373 18,143 5,582 2,293 –
Others 303,168 7,549,259 206,459 4,534,807 5,020,293 - 230,861 2,414,300
Total LTIPs 413,334 9,988,399 320,917 6,460,999 7,822,806 - 432,580 3,790,535
Of which settled and transferred in 2011 - 29,184 - 426,556 - 22,565 - 740,254 - 326,933 – - 105,585
Of which vested and/or settled and transferred in 2012 - 95,742 - 1,566,073 - 117,614 - 5,720,745 - 1,885,406 94,216 - 976,742
Outstanding LTIPs 31 December 2012 288,408 7,995,770 180,738 NA 5,610,467 - 338,364 2,708,208
1. On a target level of 100%. For the LTSP 2010 based on the average expected salary over 2010-2013 since date of appointment, the value at grant is the conditional number of shares multiplied by the average share price at grant date.
2. The value for cost allocation for the equity-settled LTSP 2010 and SMPs 2008 and 2009 are based on the number of expected shares and multiplied by the fair value per share award at grant date, which has been reduced with the expected discounted future dividends payable during the respective vesting period since the holders of shares are not entitled to receive dividends during the vesting period. The value for cost allocation for the cash-settled LTSP 2010 is based on the number of expected shares and multiplied by the fair value per award at reporting date (EUR 53.31 per 31 December 2012) minus discounted expected future dividend payments.

Financial Statements | Consolidated Financial Statements | Notes to the Consolidated Statement of Financial Position
Vopak | Annual Report 2012 | 143
Expected dividends have been applied in accordance with the dividend policy of the company. All valuations are made by an independent qualified appraiser, the estimated vesting percentages are based on scenario analysis and are as follows: LTSP 2010 Chairman/Other Executive Board members 2012: 90%/73% (2011: 200%/164%), LTSP 2010 Senior executives 2012: 73% or 47% (2011: 105% or 75%), SMP 2009/SMP 2008 2012: 100%/139% (2011: 132%/117%).
3. The fair value of the employee services received in exchange for the awards is recognized rateably over the vesting period of the plan.4. Expected shares for Mr Hoekstra are based on the expected vesting percentage applicable to a member of the Executive Board
for the period 1 September 2010 until 31 December 2010 and the expected vesting percentage applicable to the Chairman of the Executive Board starting from 1 January 2011 until the end of the vesting period.
5. Expected shares for Mr Hoekstra are based on the expected vesting percentage applicable to the period before becoming member of the Executive Board.
6. The Share Matching Plans for one senior executive were settled in April 2012 in accordance with the regulations of the plans.
Cash PlanFor senior managers who are not eligible to participate under the LTIP but who contribute significantly to the company’s shareholder value, a three-year Cash Plan is granted. The Cash Plan 2011-2013 provides for additional pay in the form of deferred compensation under the terms and conditions of the plan after a three year vesting period. The financial performance is measured by the EPS growth during the three year period, the incentive can rise from 0% to a maximum of 67.5% or 45% of the average salary over the vesting period. The estimated vesting percentages at year-end 2012 were respectively 18% and 12% (2011: 45% and 30%), resulting in a release of the provision through the statement of income of EUR 0.2 million (2011: cost of EUR 1.1 million).
Note 27. Other provisions
Movements in other provisions were as follows:
In EUR millionsEnvironmental
liabilities Other Total
Non-current liabilities 6.5 14.9 21.4
Current liabilities 4.1 13.3 17.4
Balance at 1 January 2012 10.6 28.2 38.8
Movements:
Additions 5.7 6.5 12.2
Withdrawals - 2.5 - 6.9 - 9.4
Releases - 1.3 - 0.3 - 1.6
Interest accrual 0.2 0.2 0.4
Exchange differences - 0.1 - 0.1 - 0.2
Balance at 31 December 2012 12.6 27.6 40.2
Non-current liabilities 7.6 15.7 23.3
Current liabilities 5.0 11.9 16.9
Balance at 31 December 2012 12.6 27.6 40.2
Expected withdrawals
< 1 year 5.0 11.9 16.9
2nd year 1.7 7.7 9.4
3rd year 1.1 1.1 2.2
4th year 0.9 – 0.9
5th year 0.7 – 0.7
> 5th year 3.2 6.9 10.1
Total 12.6 27.6 40.2

Financial Statements | Consolidated Financial Statements | Notes to the Consolidated Statement of Financial Position
Vopak | Annual Report 2012 | 144
Vopak is obliged to clean up the soil at different locations. An accurate estimate of the provision for this environmental risk can only be made reliably after conducting a thorough survey and drawing up a management plan for the site, on the basis of which the governmental authorities issues an order. In 2012, this has led to an addition to the provision for environmental risks of EUR 5.7 million and a release of EUR 1.3 million. These movements were recognized in the statement of income under Other operating expenses.
Other provisions include an amount of EUR 0.9 million for the 2011 Cash Plan (see note 26), EUR 2.1 million for the cash-settled share-based payment of the LTSP 2010 (see note 1 to the first table of note 26) and EUR 9.7 million relating to claims and damages related to insurances. In 2012 on balance EUR 5.6 million was added for expected claims.
Note 28. Trade and other payables
Trade and other payables are measured at amortized cost, using the effective interest method, and specified as follows:
In EUR millions 2012 2011
Trade payables 43.0 41.9
Wage tax and social security charges 7.1 5.8
Prepaid government grants 3.5 7.0
Other creditors, accruals and deferred income 283.4 218.8
Total 337.0 273.5
Note 29. Financial risk management
The Group is exposed to a number of financial risks inherent in its day-to-day operations. These risks are connected with the effects of movements in exchange rates and interest rates. The Group is also exposed to credit risk and liquidity risk.
Risks are identified by Global Treasury, the central treasury department. The Executive Board provides written principles for overall risk management as well as written policies covering specific areas such as foreign exchange risk, interest risk, credit risk, use of derivative financial instruments and non-derivative financial instruments, and investment of excess liquidity. Reports on risk and risk management are submitted on a regular basis.
Hedging alternatives are discussed by the Operational Finance Committee, a body comprising representatives from the various financial disciplines at head office, prior to approval for the transactions being requested from the Executive Board.
In order to control the risks attached to fluctuations in foreign currencies and interest rates, Vopak uses derivative financial instruments in accordance with a financial policy approved by the Executive Board. This financial policy is designed to control the effects of such risks on cash flows, equity and results. No speculative positions are adopted.
The main derivative financial instruments used by the Group are forward exchange contracts, interest rate swaps and cross currency interest rate swaps.

Financial Statements | Consolidated Financial Statements | Notes to the Consolidated Statement of Financial Position
Vopak | Annual Report 2012 | 145
Market risks and risk managementCurrency risks and risk managementThe Group is exposed to foreign currency exchange risks arising mainly from US dollar (USD), Singapore dollar (SGD), Chinese yuan (CNY), Brazilian real (BRL) and Japanese yen (JPY). Foreign currency exchange risk arises from future commercial transactions, recognized assets and liabilities and net investments in foreign operations.
The primary objective of the currency risk policy is to protect the value of Vopak’s cash flows. Account is taken of future cash flows from investments and disposals as well as cash flows from operating and financing activities. Each quarter, currency risks are identified and the hedging strategy is reviewed and subsequently presented to the Executive Board for approval.
The risks associated with commercial transaction positions arising from operating activities are limited for Vopak, since operating income and operating expenses are, as a rule, largely denominated in the same currency. However, in some countries (in particular, in Latin America), a substantial portion of the income flow is in US dollar whereas the operating expenses are denominated in local currencies. In these countries, the aim is to hedge the transaction risk naturally. Any material net transaction position can be hedged in full by means of forward exchange contracts.
The main foreign currency risk results from investments in foreign operations whose net assets are exposed to foreign currency translation risk. The group result is also impacted by translating the result of foreign currency operations.
Translation risk arising from the investments in foreign operations
Net investments in foreign activities are, in principle, hedged by loans in the same currency and forward exchange contracts, while applying hedge accounting. The amount of the hedge is determined mainly by the expected net financing position : EBITDA ratio of subsidiaries for the next three years and hedging costs. In certain situations, such as in the event of new investments, the decision may be made to hedge more than would be possible based on the optimal net financing position : EBITDA ratio. In such situations, the nominal value of the hedge might exceed the carrying amount of the underlying net investment. As was the case in 2011, there were no hedges that exceeded the carrying amount of the underlying assets in the 2012 financial year.
Due to the Private Placements in foreign currency the Group is exposed to currency risk. It is the Group’s policy to hedge this exposure to leave the Group with no material risks by making use of foreign currency contracts and cross currency swaps.
When applying hedge accounting, the effective part of the movement in fair value of the forward exchange contracts is recognized in the translation reserve (equity component) to the extent that they relate to the hedging of net investments in foreign activities. Reversal through the statement of income takes place proportionately if all or part of the underlying position is sold. Both the ineffective part and the interest component are recognized directly in the statement of income. All currency hedges for 2012 and 2011 were effective (between 80% and 125%).
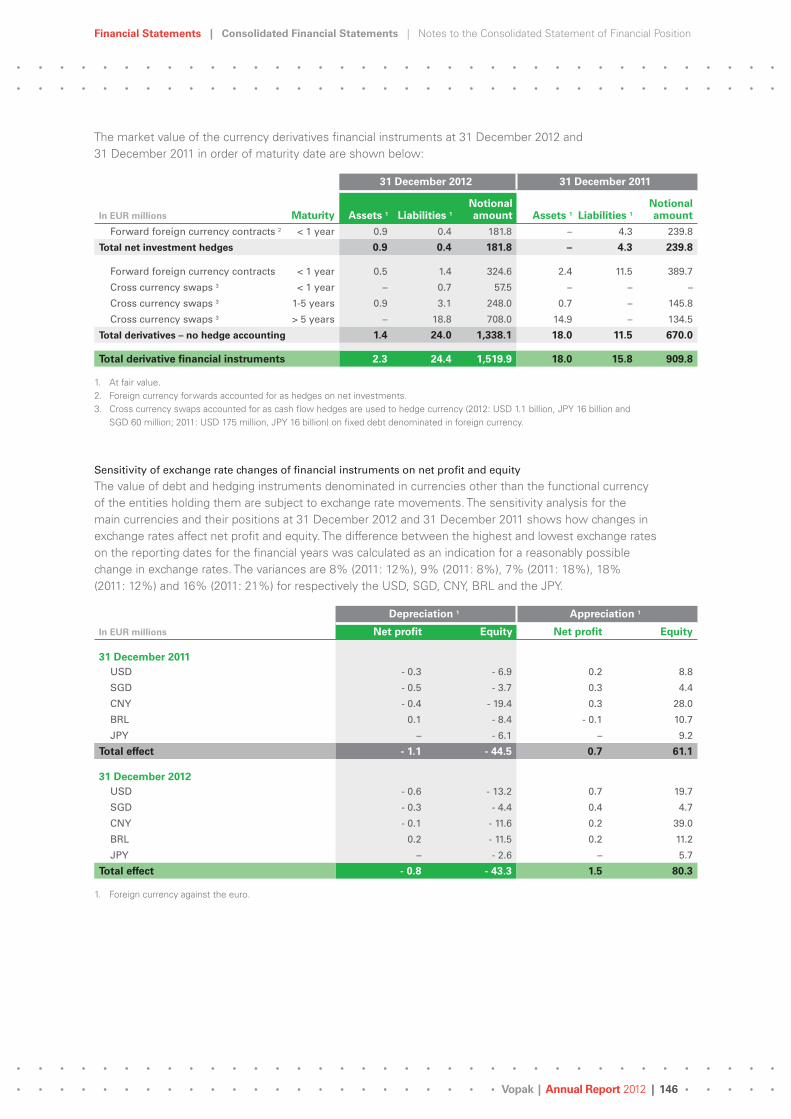
Financial Statements | Consolidated Financial Statements | Notes to the Consolidated Statement of Financial Position
Vopak | Annual Report 2012 | 146
The market value of the currency derivatives financial instruments at 31 December 2012 and 31 December 2011 in order of maturity date are shown below:
31 December 2012 31 December 2011
In EUR millions Maturity Assets 1 Liabilities 1
Notional amount Assets 1 Liabilities 1
Notional amount
Forward foreign currency contracts 2 < 1 year 0.9 0.4 181.8 – 4.3 239.8
Total net investment hedges 0.9 0.4 181.8 – 4.3 239.8
Forward foreign currency contracts < 1 year 0.5 1.4 324.6 2.4 11.5 389.7
Cross currency swaps 3 < 1 year – 0.7 57.5 – – –
Cross currency swaps 3 1-5 years 0.9 3.1 248.0 0.7 – 145.8
Cross currency swaps 3 > 5 years – 18.8 708.0 14.9 – 134.5
Total derivatives – no hedge accounting 1.4 24.0 1,338.1 18.0 11.5 670.0
Total derivative financial instruments 2.3 24.4 1,519.9 18.0 15.8 909.8
1. At fair value.2. Foreign currency forwards accounted for as hedges on net investments.3. Cross currency swaps accounted for as cash flow hedges are used to hedge currency (2012: USD 1.1 billion, JPY 16 billion and
SGD 60 million; 2011: USD 175 million, JPY 16 billion) on fixed debt denominated in foreign currency.
Sensitivity of exchange rate changes of financial instruments on net profit and equity
The value of debt and hedging instruments denominated in currencies other than the functional currency of the entities holding them are subject to exchange rate movements. The sensitivity analysis for the main currencies and their positions at 31 December 2012 and 31 December 2011 shows how changes in exchange rates affect net profit and equity. The difference between the highest and lowest exchange rates on the reporting dates for the financial years was calculated as an indication for a reasonably possible change in exchange rates. The variances are 8% (2011: 12%), 9% (2011: 8%), 7% (2011: 18%), 18% (2011: 12%) and 16% (2011: 21%) for respectively the USD, SGD, CNY, BRL and the JPY.
Depreciation 1 Appreciation 1
In EUR millions Net profit Equity Net profit Equity
31 December 2011USD - 0.3 - 6.9 0.2 8.8
SGD - 0.5 - 3.7 0.3 4.4
CNY - 0.4 - 19.4 0.3 28.0
BRL 0.1 - 8.4 - 0.1 10.7
JPY – - 6.1 – 9.2
Total effect - 1.1 - 44.5 0.7 61.1
31 December 2012USD - 0.6 - 13.2 0.7 19.7
SGD - 0.3 - 4.4 0.4 4.7
CNY - 0.1 - 11.6 0.2 39.0
BRL 0.2 - 11.5 0.2 11.2
JPY – - 2.6 – 5.7
Total effect - 0.8 - 43.3 1.5 80.3
1. Foreign currency against the euro.

Financial Statements | Consolidated Financial Statements | Notes to the Consolidated Statement of Financial Position
Vopak | Annual Report 2012 | 147
Sensitivity of exchange rate changes arising from the translation of the results of foreign currency operations
The group result is also impacted by translating the result of foreign currency operations.
The translation risk of converting the net result of foreign entities into euros mainly concerns the Singapore dollar and the US dollar. The sensitivity to these currencies is as follows.
A 10 dollar cent change in the EUR/USD exchange rate approximately affects Vopak’s figures as follows (based on figures for 2012):• Revenues would differ by EUR 16.2 million (2011: EUR 12.9 million).• Group operating profit (EBIT) would differ by EUR 4.4 million (2011: EUR 3.7 million).• Net profit would differ by EUR 2.9 million (2011 EUR 2.5 million).
A 10 dollar cent change in the EUR/SGD exchange rate approximately affects Vopak’s figures as follows (based on figures for 2012):• Revenues would differ by EUR 15.3 million (2011: EUR 12.5 million).• Group operating profit (EBIT) would differ by EUR 9.5 million (2011: EUR 7.7 million).• Net profit would differ by EUR 5.4 million (2011: EUR 4.3 million).
Interest rate risk and interest rate risk managementVopak’s policy on interest rate risks aims to control the net finance costs resulting from fluctuations in market interest rates, taking into account the long-term profile of the company. Fixed rate debt results in fair value interest rate risk. Floating rate debt results in cash flow interest rate risk. The specification of the total interest-bearing loans is disclosed in note 24. It is Vopak’s long-term policy to manage its interest exposure to a level of fixed/floating within the bandwidth of the interest coverage ratio, which aims to optimize net finance expense and reduce volatility on net result.
Interest rate swaps are used aiming at minimizing the interest rate risks associated with the financing of the Group and at the same time optimizing the net interest costs. Interest rate risks are identified and possible hedges considered when obtaining or providing new financing.
At 31 December 2012, taking account of interest rate swaps, 91% (2011: 84%) of the total interest-bearing loans of EUR 2,183.2 million (2011: EUR 1,538.6 million) was financed at a fixed interest rate with remaining terms of up to twenty-eight years. The following interest rate swaps were used:
The CCIRS as described earlier under currency risks and risk management are also part of the interest rate risk policy. The objective of these hedges is to restrict fluctuations in interest charges as a result from changes in the currency exchange rates. The fair value changes relating to the fixed interest flows are recognized in equity under the revaluation reserve derivatives by means of hedge accounting (cash flow hedges). A loss of EUR 145.2 million, net of tax had been recognized in equity up to 31 December 2012 (see note 21).
Vopak Terminal Singapore Pte. Ltd. converted various floating-interest loans totalling SGD 67 million (EUR 41.6 million) into fixed-interest loans by means of different interest rate swaps. The terms of these interest rate swaps are until 17 August 2015 and are classified as cash flow hedges.
By means of an interest rate swap, the Group converted in 2011 fixed-interest loans (Singapore PPs) totalling SGD 100 million (EUR 62.1 million) to floating-interest loans. The maturity date of the swap is 5 September 2014. This interest rate swap was designated as being a fair value hedge. The part of the value adjustment of the instrument regarded as effective is in principle also recognized in the underlying loan.
All interest rate swaps were effective in 2012 and 2011 (between 80% and 125%).

Financial Statements | Consolidated Financial Statements | Notes to the Consolidated Statement of Financial Position
Vopak | Annual Report 2012 | 148
The average fixed interest and the average floating interest on the interest-bearing loans at 31 December 2012 were respectively 4.8% (2011: 5.1%) and 1.9% (2011: 2.3%). The following statement will provide insight into the interest repricing calendar for the interest-bearing loans at the statement of the financial position.
31 December 2012 31 December 2011
In EUR millions Floating Fixed Total Floating Fixed Total
< 1 year - 197.8 - 25.4 - 223.2 - 184.6 - 64.8 - 249.4
1-2 years – - 71.8 - 71.8 – - 87.9 - 87.9
2-3 years – - 45.1 - 45.1 - 59.6 - 146.3 - 205.9
3-4 years – - 8.7 - 8.7 – - 42.1 - 42.1
4-5 years – - 134.2 - 134.2 – - 2.2 - 2.2
> 5 years – - 1,721.9 - 1,721.9 – - 935.5 - 935.5
Total 1 - 197.8 - 2,007.1 - 2,204.9 - 244.2 - 1,278.8 - 1,523.0
1. Of which currency component derivatives amounts to EUR - 21.7 million (2011: EUR 15.6 million).
The market value of the interest rate derivatives financial instruments at 31 December 2012 and 31 December 2011 in order of maturity date are shown below:
31 December 2012 31 December 2011
In EUR millions Maturity Assets 1 Liabilities 1
Notional amount Assets 1 Liabilities 1
Notional amount
Cross currency interest rate swaps 2 < 1 year – 0.1 57.6 – –
Cross currency interest rate swaps 2 1-5 years 0.1 2.8 211.6 – 0.9 134.5
Cross currency interest rate swaps 2 > 5 years – 93.9 562.2 – 33.6 145.8
Interest rate swaps 3 < 1 year – – – – 0.6 47.7
Interest rate swaps 3 1-5 years – 2.8 41.6 – 3.1 39.9
Total cash flow hedges 0.1 99.6 873.0 – 38.2 367.9
Interest rate swaps 4 1-5 years 1.6 – 62.1 2.6 – 59.6
Total fair value hedge 1.6 – 62.1 2.6 – 59.6
Total derivative financial instruments 1.7 99.6 935.1 2.6 38.2 427.5
1. At fair value.2. Cross currency swaps accounted are used to hedge future cash flow interest rate risks (2012: USD 1.1 billion,
JPY 16 billion and SGD 60 million; 2011: USD 175 million, JPY 16 billion) on fixed debt denominated in foreign currency.3. Interest rate swaps accounted for as cash flow hedges are used to hedge cash flow interest rate risk on floating debt
(2012: SGD 67 million; 2011: SGD 147 million). 4. Interest rate swaps accounted for as fair value hedges are used to convert fixed debt to floating debt
(2012 and 2011: SGD 100 million).
Sensitivity of changes in market interest rates
The sensitivity analysis shows how changes in market interest rates affect net profit and equity, assuming that all other variables remain constant. Due to the volatility of the market interest rates Vopak has used a fixed percentage of 25% as a reasonable change at year-end 2012 and year-end 2011. Interest financial instruments of the Group as these, are all recognized at amortized cost.
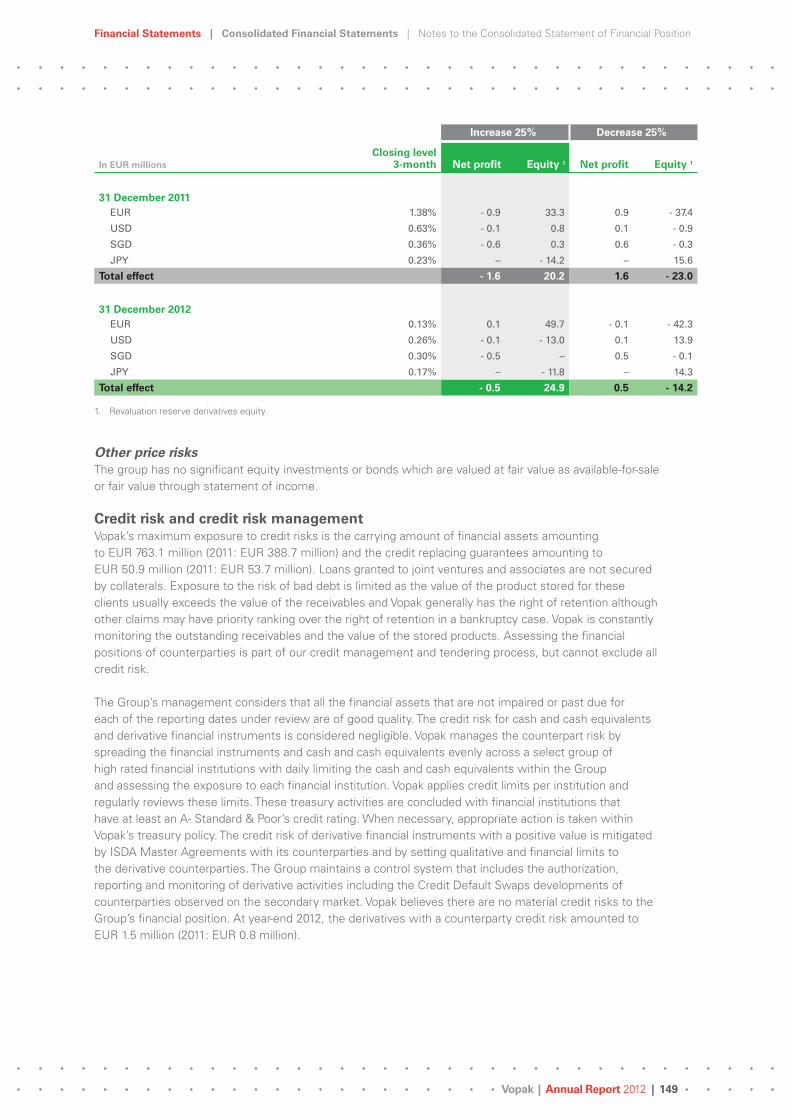
Financial Statements | Consolidated Financial Statements | Notes to the Consolidated Statement of Financial Position
Vopak | Annual Report 2012 | 149
Increase 25% Decrease 25%
In EUR millionsClosing level
3-month Net profit Equity 1 Net profit Equity 1
31 December 2011EUR 1.38% - 0.9 33.3 0.9 - 37.4
USD 0.63% - 0.1 0.8 0.1 - 0.9
SGD 0.36% - 0.6 0.3 0.6 - 0.3
JPY 0.23% – - 14.2 – 15.6
Total effect - 1.6 20.2 1.6 - 23.0
31 December 2012EUR 0.13% 0.1 49.7 - 0.1 - 42.3
USD 0.26% - 0.1 - 13.0 0.1 13.9
SGD 0.30% - 0.5 – 0.5 - 0.1
JPY 0.17% – - 11.8 – 14.3
Total effect - 0.5 24.9 0.5 - 14.2
1. Revaluation reserve derivatives equity.
Other price risksThe group has no significant equity investments or bonds which are valued at fair value as available-for-sale or fair value through statement of income.
Credit risk and credit risk management Vopak’s maximum exposure to credit risks is the carrying amount of financial assets amounting to EUR 763.1 million (2011: EUR 388.7 million) and the credit replacing guarantees amounting to EUR 50.9 million (2011: EUR 53.7 million). Loans granted to joint ventures and associates are not secured by collaterals. Exposure to the risk of bad debt is limited as the value of the product stored for these clients usually exceeds the value of the receivables and Vopak generally has the right of retention although other claims may have priority ranking over the right of retention in a bankruptcy case. Vopak is constantly monitoring the outstanding receivables and the value of the stored products. Assessing the financial positions of counterparties is part of our credit management and tendering process, but cannot exclude all credit risk.
The Group’s management considers that all the financial assets that are not impaired or past due for each of the reporting dates under review are of good quality. The credit risk for cash and cash equivalents and derivative financial instruments is considered negligible. Vopak manages the counterpart risk by spreading the financial instruments and cash and cash equivalents evenly across a select group of high rated financial institutions with daily limiting the cash and cash equivalents within the Group and assessing the exposure to each financial institution. Vopak applies credit limits per institution and regularly reviews these limits. These treasury activities are concluded with financial institutions that have at least an A- Standard & Poor’s credit rating. When necessary, appropriate action is taken within Vopak’s treasury policy. The credit risk of derivative financial instruments with a positive value is mitigated by ISDA Master Agreements with its counterparties and by setting qualitative and financial limits to the derivative counterparties. The Group maintains a control system that includes the authorization, reporting and monitoring of derivative activities including the Credit Default Swaps developments of counterparties observed on the secondary market. Vopak believes there are no material credit risks to the Group’s financial position. At year-end 2012, the derivatives with a counterparty credit risk amounted to EUR 1.5 million (2011: EUR 0.8 million).

Financial Statements | Consolidated Financial Statements | Notes to the Consolidated Statement of Financial Position
Vopak | Annual Report 2012 | 150
Capital management, liquidity risks and liquidity risk management A solid capital structure supports Vopak’s objective to create long-term shareholder value while meeting the requirements of its other capital providers. Vopak maintains a healthy financial position through disciplined investment decisions, effective working capital management, long-term funding and a balanced dividend policy and is continuously reviewing its capital structure options - including but not limited to equity(-linked) or other (debt) capital instruments - to effectively finance the future growth aimed for.
The primary objective of liquidity management is providing sufficient cash and cash equivalents at all times to enable Vopak to meet its payment obligation.
Vopak is a capital-intensive company. The financing policy is directed at establishing and maintaining an optimal financing structure that takes due account of the current asset base and the investment program. Vopak seeks access to the capital markets and flexibility at acceptable finance costs. The liquidity requirements are continuously monitored and funding is planned in such a way as to avoid excessive short-term financing needs. The long-term liquidity risk is assessed prior to every major investment obligation and the current financing policy is reviewed on the basis of this assessment and adjusted where necessary. The Group works actively to maintain and further develop the diversified funding base it already has, with regard to the number of markets and the number of investors.
Global Treasury acts as an in-house bank that internally allocates funds which are raised centrally. Surplus cash held by the operating entities over and above balance required for working capital management is transferred to Global Treasury and operating companies are funded by a combination of equity and inter-company loans. An exception to this is the bank loan of Vopak Terminals Singapore Pte. Ltd. (SGD 200 million), which was raised locally. Joint ventures and associates, where possible, are funded optimally with debt on a non-recourse basis for Vopak, with account being taken of local circumstances and contractual obligations. Active cash management is a daily responsibility and each quarter the liquidity requirements are identified based on thorough scenario planning. Global Treasury invests surplus cash in interest-bearing current accounts and deposit accounts.
In 2012, Vopak issued a new Notes Program in the US Private Placement (USPP) market for a total amount of approximately USD 1 billion, consisting of a senior tranche of approximately USD 900 million and a subordinated tranche of approximately USD 100 million, and all with long-term maturities. This new program further aligns the maturity profile of the outstanding debt with Vopak’s long-term growth strategy and provides maximum flexibility under the current EUR 1.2 billion revolving credit facility (RCF). At the beginning of this year, the maturity of the RCF has been successfully extended with one additional year to up to 2017 for EUR 1.1 billion. The RCF was fully available at year-end 2012. At 31 December 2012, the Group also has unused lines of credit of EUR 200 million that are available to meet short-term liquidity needs. There are no significant restrictions on the use of these facilities.
The next table analyses the group’s non-derivative financial liabilities and net-settled derivative financial liabilities into relevant maturity groupings based on the remaining period at the end of the reporting period to the contractual maturity date. Derivative financial instruments are included in the analysis if their contractual maturities are essential for an understanding of the timing of the cash flows. The table also analyses the maturity profile of financial assets in order to provide a complete view of the contractual commitments and liquidity. The amounts disclosed in the table are the contractual undiscounted cash flows. The financial guarantees and securities are contingent liabilities.

Financial Statements | Consolidated Financial Statements | Notes to the Consolidated Statement of Financial Position
Vopak | Annual Report 2012 | 151
< 1 year 1-2 years 2-5 years > 5 years
In EUR millions 2012 2011 2012 2011 2012 2011 2012 2011
Cash and cash equivalents 452.0 88.7 – – – – – –
Trade and other receivables 276.6 237.4 – – – – – –Total undiscounted financial assets (excluding gross settled derivatives) 728.6 326.1 – – – – – –
Redemption of interest-bearing loans 99.4 17.1 131.0 99.5 247.0 336.2 1,705.8 1,085.8
Interest payments 94.0 65.8 91.2 62.9 250.3 179.3 490.6 347.5
Interest rate swaps - 2.1 - 24.2 - 2.4 - 29.0 - 8.3 - 66.2 - 86.7 - 130.4
Trade and other creditors (excluding non-cash items) 192.4 132.4 – – – – – –
Cash-settled equity-based liability – – 2.1 – – 2.2 – –
Financial guarantees and securities 83.4 86.2 – – – – – –Total undiscounted financial liabilities (excluding gross settled derivatives) 467.1 277.3 221.9 133.4 489.0 451.5 2,109.7 1,302.9
Derivative financial instruments outflow 276.4 492.4 – – – – – –
Derivative financial instruments inflow - 238.6 - 512.1 – – – – – –Total undiscounted gross settled derivatives 37.8 - 19.7 – – – – – –
Liquidity movement 223.7 68.5 - 221.9 - 133.4 - 489.0 - 451.5 - 2,109.7 - 1,302.9
The lenders have the right to demand complete repayment of the outstanding amounts in case any person or any group of persons acting together, except for the shareholders with a shareholding of more than 5 per cent as per end of 2010, acquires control of more than 50% of the voting rights of Koninklijke Vopak N.V. (Change of Control clause).
Financial instruments by category
Carrying amount Fair value
In EUR millions Note 2012 2011 2012 2011
Other financial assets 0.8 0.8 0.8 0.8
Currency derivatives - 22.1 2.2 - 22.1 2.2
Interest rate derivatives - 97.9 - 35.6 - 97.9 - 35.6
Financial instruments at fair value - 119.2 - 32.6 - 119.2 - 32.6
Loans granted 14 30.5 42.0 30.5 42.0
Trade and other receivables 17 276.6 237.4 276.6 237.4
Cash and cash equivalents 18 452.0 88.7 452.0 88.7
Loans and receivables 759.1 368.1 759.1 368.1
Bank overdrafts 18 - 16.3 - 155.7 - 16.3 - 155.7
US Private Placements 24 - 1,598.4 - 856.7 - 2,019.6 - 1,006.9
SGD Private Placements 24 - 271.0 - 260.8 - 305.9 - 296.1
JPY Private Placement 24 - 174.7 - 200.9 - 212.2 - 246.3
Bank loans 24 - 124.2 - 119.2 - 125.1 - 120.5
Credit facility and other long-term loans 24 - 14.9 - 101.0 - 14.9 - 102.5
Trade payables 28 - 43.0 - 41.9 - 43.0 - 41.9
Other financial liabilities - 2,242.5 - 1,736.2 - 2,737.0 - 1,969.9
Net at amortized cost - 1,483.4 - 1,368.1 - 1,977.9 - 1,601.8
Standby credit facility 24 1,200.0 1,100.0
Standby bank loans 200.0 55.0
Unrecognized financial instruments 1,400.0 1,155.0
The methods and valuation techniques used for measuring fair value of the derivative financial instruments are unchanged compared to the previous year.

Financial Statements | Consolidated Financial Statements | Notes to the Consolidated Statement of Financial Position
Vopak | Annual Report 2012 | 152
Note 30. Cash flows from operating activities (gross)
Note 2012 2011
Net profit 369.5 435.6
Adjustments for:
– Depreciation, amortization and impairment 4 217.6 178.0
– Net finance costs 7, 8 83.5 78.6
– Income tax 9 82.9 71.3
– Movements in other non-current assets - 21.8 - 63.6
– Movements in provisions excluding deferred taxes - 0.3 - 2.7
– Movements in non-controlling interests 23 - 25.9 - 27.4
– Dividend received from joint ventures and associates 13 87.7 104.1
– Result joint ventures and associates 6 - 97.1 - 108.9
– Measurement of equity-settled share-based payment arrangements 22 - 0.4 2.4
– Result on sale property, plant and equipment 2 - 1.9 - 1.7
– Result on sale of joint ventures and associates 6 – - 111.5
– Result on sale of subsidiaries 2 – - 4.3
Total adjustments 324.3 114.3
Realized value adjustments of derivative financial instruments - 16.0 - 13.8
Movements in other current assets (excluding cash and cash equivalents) - 43.9 - 23.7
Movements in other current liabilities (excluding bank overdrafts and dividends) 25.3 - 32.2
Effect of changes in exchange rates on other current current assets and liabilities 0.1 15.6
Cash flows from operating activities (gross) 659.3 495.8
Note 31. Operating lease
The amounts due in respect of non-cancellable operating leases are payable as follows:
In EUR millions 2012 2011
Less than 1 year 47.8 48.6
Between 1 and 5 years 170.1 192.2
More than 5 years 380.3 383.2
Total 598.2 624.0
The lease amounts due are mainly in respect of the leasehold on land and the lease of buildings.
In 2012, EUR 57.6 million was recognized as expenses in the statement of income relating to operating leases (2011: EUR 53.5 million).
Note 32. Investment commitments undertaken
The investment commitments undertaken amount to EUR 262.0 million as at 31 December 2012 (2011: EUR 214.7 million).

Financial Statements | Consolidated Financial Statements | Notes to the Consolidated Statement of Financial Position
Vopak | Annual Report 2012 | 153
Note 33. Contingent assets and contingent liabilities
Guarantees and securities provided for joint ventures, associates and third parties amounted to EUR 83.4 million (2011: EUR 86.2 million). This includes the Vopak guarantee for the project financing (USD 52 million) of the joint venture PT Jakarta Tank Terminal. The amounts of these guarantees and securities can be called within one year. The fair value of guarantees and securities provided are insignificant.
The Group is exposed to risks regarding environmental obligations arising from past activities. For example, a number of sites have to be decontaminated before being handed back at the end of the contractual period. Under current legislation, environmental plans and any other measures to be adopted have to be agreed with local, regional and national authorities as appropriate. As soon as such plans are approved or other legal obligations arise, a provision is formed based on the most reliable estimate possible of future expenses. The Executive Board is of the opinion that, based on information currently available, the provisions are adequate. However, given the degree of difficulty in making estimates, this does not guarantee that no additional costs will arise.
As a result of its day-to-day activities, the Group is involved in a number of legal proceedings. No provisions have been formed, where the Executive Board is of the opinion that the final outcome will not create a cash outflow.
Note 34. Related parties
Transactions with Supervisory Board members and Executive Board membersFor the remuneration of Supervisory Board members and Executive Board members, please refer to the sections Remuneration Supervisory Board (audited) and Actual remuneration 2012 (audited) of the remuneration report, which are deemed part of these financial statements.
No loans, advances or guarantees have been provided to current or former members of the Supervisory Board and/or Executive Board.
In 2012, the Group did not conduct any transactions with companies in which Executive Board members and/or persons closely related to them have a significant financial interest.
Transactions with subsidiaries, joint ventures and associates Royal Vopak has a business relationship with its subsidiaries, joint ventures and associates (see Subsidiaries, Joint Ventures and Associates).
Related party transactions can arise with the Group’s joint ventures and associates comprise fees for the use of Vopak’s services. Except as disclosed below, no related party transactions have been entered into during the year which might reasonably affect any decisions made by the users of these consolidated financial statements.
In EUR millions 2012 2011
Other operating income 5.8 5.8
Interest income on borrowings to joint ventures and associates 0.4 0.2
Amounts owed by or owed to (–) joint ventures and associates 22.5 37.7
Transactions with pension funds Related party transactions with Vopak’s pension funds are presented in note 25.

Financial Statements | Company Financial Statements | Company Statement of Income
Vopak | Annual Report 2012 | 154
Company Financial Statements
Company Statement of Income
In EUR millions 2012 2011
Profit of participating interests after tax 392.8 475.7
Other results after tax - 63.1 - 75.1
Net Profit 329.7 400.6
Company Statement of Financial Position at 31 December before Profit Appropriation
In EUR millions Note 2012 2011
Participating interests in group companies 2 2,188.0 1,878.4
Loans granted 3 1,412.3 1,244.9
Deferred taxes 1.4 1.4
Derivative financial instruments 6 2.6 18.2
Pension and other employee benefits 167.5 156.2
Total non-current assets 3,771.8 3,299.1
Trade and other receivables 2.6 3.7
Taxes receivable 2.4 2.5
Prepayments 1.3 2.8
Derivative financial instruments 6 1.1 1.9
Cash and cash equivalents 284.6 1.1
Total current assets 292.0 12.0
Bank overdrafts 5.1 104.2
Interest-bearing loans 5 27.2 16.9
Derivative financial instruments 6 1.5 6.5
Taxes payable – 0.1
Trade and other payables 53.4 17.1
Provisions 7 – 0.1
Total current liabilities 87.2 144.9
Current assets less current liabilities 204.8 - 132.9
Total assets less current liabilities 3,976.6 3,166.2
Interest-bearing loans 5 2,014.2 1,397.9
Derivative financial instruments 6 118.5 34.5
Non-current liabilities 2,132.7 1,432.4
Provisions 7 4.3 4.5
Share capital 84.6 84.6
Share premium 248.2 281.2
Statutory reserve for participating interests 4 204.5 175.9
Translation reserve 36.2 47.7
Revaluation reserve derivatives - 145.2 - 79.5
Revaluation reserve assets 5.3 5.9
Transaction reserve non-controlling interest 1.3 –
Other reserves 4 1,075.0 812.9
Unappropriated profit 4 329.7 400.6
Shareholders' equity 1,839.6 1,729.3
Total 3,976.6 3,166.2

Financial Statements | Company Financial Statements | Notes to the Company Financial statements
Vopak | Annual Report 2012 | 155
Notes to the Company Financial StatementsAn abridged company statement of income is presented in accordance with Section 402 of Book 2 of the Dutch Civil Code.
All amounts are in EUR millions, unless stated otherwise.
Note 1. General
Accounting policies The company financial statements have been drawn up in accordance with Dutch law (Part 9 of Book 2 of the Dutch Civil Code). In doing so, the company made use of the possibility to apply the accounting policies (including the policies for the presentation of financial instruments as equity or loan capital) used in the consolidated financial statements to the company financial statements, as provided in Section 362 (8) of Book 2 of the Dutch Civil Code.
The accounting policies applied in the company financial statements are the same as those applied in the consolidated financial statements. The policies stated in the consolidated financial statements are applied, unless stated otherwise.
Participating interests in group companiesInterests in group companies and other companies over which Vopak exercises control or which it manages are carried at net asset value. The net asset value is determined by measuring the assets, provisions and debts and calculating the result according to the accounting policies applied in the consolidated financial statements.
Note 2. Participating interests in group companies
In EUR millions 2012 2011
Carrying amount at 1 January 1,878.4 1,680.8
Disposal - 0.2 –
Dividend - 68.0 - 290.9
Exchange differences - 12.6 23.3
Hedging - 3.7 - 10.5
Result sale non-controlling interest of subsidiary 1.3 –
Profit 392.8 475.7
Carrying amount at 31 December 2,188.0 1,878.4
Note 3. Loans granted
In EUR millions 2012 2011
Carrying amount at 1 January 1,244.9 1,123.0
Loans granted 840.4 665.0
Repayments - 672.7 - 543.7
Exchange differences - 0.3 0.6
Carrying amount at 31 December 1,412.3 1,244.9
At 31 December 2012, loans granted did not include any subordinated loans (2011: nil).

Financial Statements | Company Financial Statements | Notes to the Company Financial statements
Vopak | Annual Report 2012 | 156
Note 4. Shareholders’ equity
Please see note 20 to the Consolidated Financial Statements for movements in the number of shares, share capital, share premium.
The share premium can be distributed in full, free of tax.
For the translation reserve, the revaluation reserve derivatives, the revaluation reserve assets and the transaction reserve of non-controlling interests (NCI) we refer to note 21 to the Consolidated Financial Statements.
Movements in the remaining components of shareholders’ equity for 2012 and 2011 are shown in the following tables.
Statutory reserve participating interests
In EUR millions 2012 2011
Carrying amount at 1 January 175.9 184.2
Donation from Other reserves 28.6 –
Release to Other reserves – - 8.3
Carrying amount at 31 December 204.5 175.9
Other reserves
In EUR millions 2012 2011
Carrying amount at 1 January 812.9 629.2
Profit appropriation from Unappropriated profit 290.5 172.8
Release revaluation reserve assets 0.6 0.2
Measurement of equity-settled share-based payment arrangements - 0.4 2.4
Donation from Statutory reserves – 8.3
Release to Statutory reserves - 28.6 –
Carrying amount at 31 December 1,075.0 812.9
Unappropriated profit
In EUR millions 2012 2011
Carrying amount at 1 January 400.6 270.1
Profit appropriation to Other reserves - 290.5 - 172.8
Dividend in cash - 110.1 - 97.3
Profit for the year 329.7 400.6
Carrying amount at 31 December 329.7 400.6
After adjustment for the negative revaluation reserve derivatives (EUR 145.2 million) at 31 December 2012, a total of EUR 1,259.5 million (2011: EUR 1,134.0 million) is distributable from other reserves and unappropriated profit for 2012.
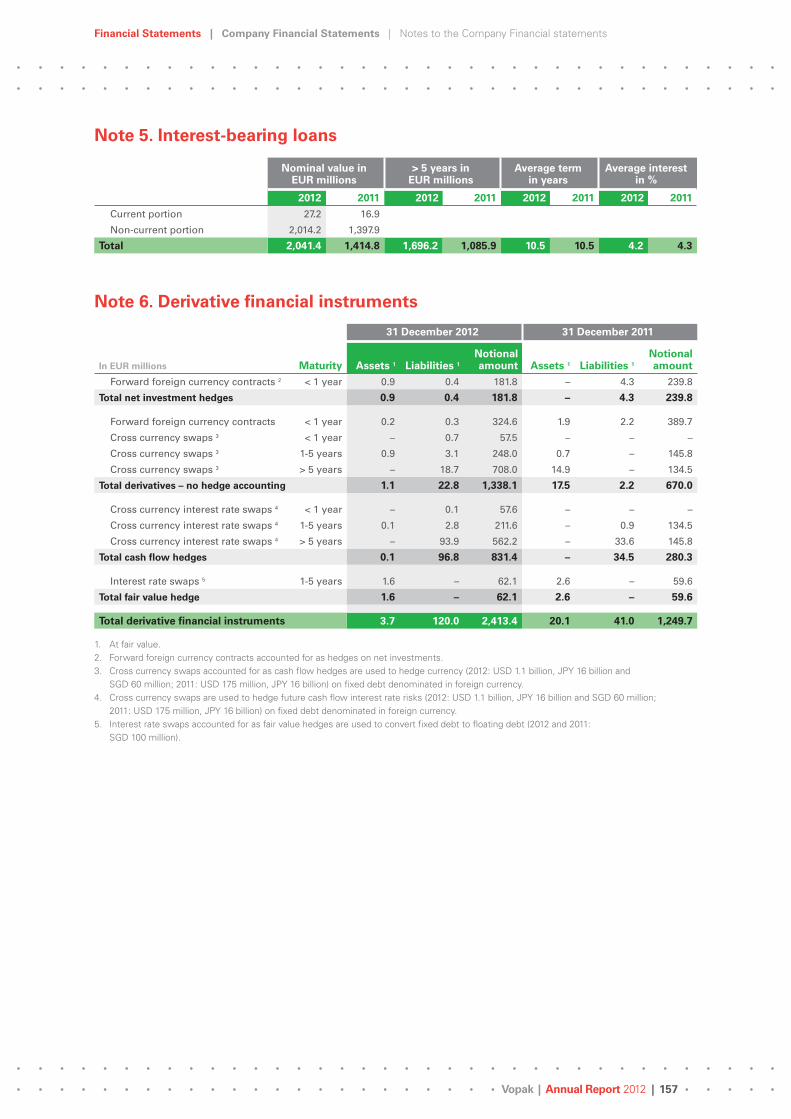
Financial Statements | Company Financial Statements | Notes to the Company Financial statements
Vopak | Annual Report 2012 | 157
Note 5. Interest-bearing loans
Nominal value in EUR millions
> 5 years in EUR millions
Average term in years
Average interest in %
2012 2011 2012 2011 2012 2011 2012 2011
Current portion 27.2 16.9
Non-current portion 2,014.2 1,397.9
Total 2,041.4 1,414.8 1,696.2 1,085.9 10.5 10.5 4.2 4.3
Note 6. Derivative financial instruments
31 December 2012 31 December 2011
In EUR millions Maturity Assets 1 Liabilities 1
Notional amount Assets 1 Liabilities 1
Notional amount
Forward foreign currency contracts 2 < 1 year 0.9 0.4 181.8 – 4.3 239.8
Total net investment hedges 0.9 0.4 181.8 – 4.3 239.8
Forward foreign currency contracts < 1 year 0.2 0.3 324.6 1.9 2.2 389.7
Cross currency swaps 3 < 1 year – 0.7 57.5 – – –
Cross currency swaps 3 1-5 years 0.9 3.1 248.0 0.7 – 145.8
Cross currency swaps 3 > 5 years – 18.7 708.0 14.9 – 134.5
Total derivatives – no hedge accounting 1.1 22.8 1,338.1 17.5 2.2 670.0
Cross currency interest rate swaps 4 < 1 year – 0.1 57.6 – – –
Cross currency interest rate swaps 4 1-5 years 0.1 2.8 211.6 – 0.9 134.5
Cross currency interest rate swaps 4 > 5 years – 93.9 562.2 – 33.6 145.8
Total cash flow hedges 0.1 96.8 831.4 – 34.5 280.3
Interest rate swaps 5 1-5 years 1.6 – 62.1 2.6 – 59.6
Total fair value hedge 1.6 – 62.1 2.6 – 59.6
Total derivative financial instruments 3.7 120.0 2,413.4 20.1 41.0 1,249.7
1. At fair value.2. Forward foreign currency contracts accounted for as hedges on net investments.3. Cross currency swaps accounted for as cash flow hedges are used to hedge currency (2012: USD 1.1 billion, JPY 16 billion and
SGD 60 million; 2011: USD 175 million, JPY 16 billion) on fixed debt denominated in foreign currency.4. Cross currency swaps are used to hedge future cash flow interest rate risks (2012: USD 1.1 billion, JPY 16 billion and SGD 60 million;
2011: USD 175 million, JPY 16 billion) on fixed debt denominated in foreign currency.5. Interest rate swaps accounted for as fair value hedges are used to convert fixed debt to floating debt (2012 and 2011:
SGD 100 million).

Financial Statements | Company Financial Statements | Notes to the Company Financial statements
Vopak | Annual Report 2012 | 158
Note 7. Provisions
Movements in provisions were as follows:
In EUR millions
Pension and other employee
benefits Other Total
Balance at 1 January 2011 4.5 0.9 5.4
Movements:
– Additions 2.5 0.4 2.9
– Withdrawals - 3.4 - 0.3 - 3.7
Balance at 31 December 2011 3.6 1.0 4.6
Non-current liabilities 3.6 0.9 4.5
Current liabilities – 0.1 0.1
Balance at 31 December 2011 3.6 1.0 4.6
Movements:
– Withdrawals - 0.2 - 0.1 - 0.3
Balance at 31 December 2012 3.4 0.9 4.3
Non-current liabilities 3.4 0.9 4.3
Current liabilities – – –
Balance at 31 December 2012 3.4 0.9 4.3
Note 8. Remuneration of Supervisory Board members and Executive Board members
For the remuneration of the Supervisory Board members and the Executive Board members we refer to the section of the remuneration report marked with ‘audited’.

Financial Statements | Company Financial Statements | Notes to the Company Financial statements
Vopak | Annual Report 2012 | 159
Note 9. Contingent liabilities
Royal Vopak is the head of a tax entity including almost all Dutch wholly-owned group companies. The company is therefore jointly and severally liable for the tax liabilities of the tax entity as a whole.
Guarantees and security provided on behalf of participating interests and third parties amounted to EUR 83.4 million (2011: EUR 86.2 million). Guarantees and security provided on behalf of group companies amounted to EUR 78.7 million (2011: EUR 52.5 million).
Joint and several liability undertakings for an amount of EUR 130.0 million (2011: EUR 130.0 million) were issued for bank credits granted to Royal Vopak. Furthermore joint and several liability undertakings for an amount of EUR 66.4 million (2011: EUR 60.5 million) were issued for bank credits granted to subsidiaries.
The company has filed joint and several liability undertakings for a number of its Dutch group companies at the office of the Company Registry in whose area of jurisdiction the group company concerned has its registered office. The list of interests filed at the office of the Company Registry for inspection states for which group companies Royal Vopak has issued joint and several liability undertakings.
The members of the Executive Board have signed the financial statements in order to comply with the statutory obligation pursuant to article 2:101 paragraph 2 Dutch Civil Code and article 5:25c sub c of the Act on Financial Supervision (Wft).
Rotterdam, 28 February 2013
The Executive Board The Supervisory BoardE.M. Hoekstra (Chairman and CEO) A. van Rossum (Chairman)J.P. de Kreij (Vice-chairman and CFO) M. van der Vorm (Vice-chairman)F. Eulderink (COO) F.J.G.M. Cremers C.J. van den Driest Chun Kai Lam R.G.M. Zwitserloot

Financial Statements | Other information | Independent auditor’s report
Vopak | Annual Report 2012 | 160
Other information
Independent auditor’s report
To the Annual General Meeting of Shareholders of Koninklijke Vopak N.V.
Report on the financial statements
We have audited the financial statements 2012 of Koninklijke Vopak N.V., Rotterdam. These financial statements consist of the consolidated financial statements and the company financial statements. The consolidated financial statements comprise the consolidated statement of income, the consolidated statement of comprehensive income, the consolidated statement of financial position as at 31 December 2012, the consolidated statement of changes in equity and the consolidated statement of cash flows for the year then ended and the notes, comprising a summary of significant accounting policies and other explanatory information. The company financial statements comprise the company statement of income for the year then ended, the company statement of financial position as at 31 December 2012 and the notes, comprising a summary of significant accounting policies and other explanatory information.
Executive Board’s responsibility The Executive Board of Koninklijke Vopak N.V. is responsible for the preparation and fair presentation of the financial statements in accordance with International Financial Reporting Standards as adopted by the European Union and with Part 9 of Book 2 of the Dutch Civil Code, and for the preparation of the Executive Board report in accordance with Part 9 of Book 2 of the Dutch Civil Code. Furthermore, the Executive Board is responsible for such internal control it determines is necessary to enable the preparation of the financial statements that are free from material misstatement, whether due to fraud or error.
Auditor’s responsibility Our responsibility is to express an opinion on the financial statements based on our audit. We conducted our audit in accordance with Dutch law, including the Dutch Standards on Auditing. This requires that we comply with ethical requirements and plan and perform the audit to obtain reasonable assurance about whether the financial statements are free from material misstatement.
An audit involves performing procedures to obtain audit evidence about the amounts and disclosures in the financial statements. The procedures selected depend on the auditor’s judgment, including the assessment of the risks of material misstatement of the financial statements, whether due to fraud or error. In making those risk assessments, the auditor considers internal control relevant to the company’s preparation and fair presentation of the financial statements in order to design audit procedures that are appropriate in the circumstances, but not for the purpose of expressing an opinion on the effectiveness of the company’s internal control. An audit also includes evaluating the appropriateness of accounting policies used and the reasonableness of accounting estimates made by the Executive Board, as well as evaluating the overall presentation of the financial statements.
We believe that the audit evidence we have obtained is sufficient and appropriate to provide a basis for our audit opinion.

Financial Statements | Other information | Independent auditor’s report
Vopak | Annual Report 2012 | 161
Opinion with respect to the consolidated financial statements In our opinion, the consolidated financial statements give a true and fair view of the financial position of Koninklijke Vopak N.V. as at 31 December 2012, and of its results and its cash flows for the year then ended in accordance with International Financial Reporting Standards as adopted by the European Union and with Part 9 of Book 2 of the Dutch Civil Code.
Opinion with respect to the company financial statements In our opinion, the company financial statements give a true and fair view of the financial position of Koninklijke Vopak N.V. as at 31 December 2012, and of its results for the year then ended in accordance with Part 9 of Book 2 of the Dutch Civil Code.
Report on other legal and regulatory requirements
Pursuant to the legal requirement under Section 2:393 sub 5 at e and f of the Dutch Civil Code, we have no deficiencies to report as a result of our examination whether the Executive Board report, to the extent we can assess, has been prepared in accordance with Part 9 of Book 2 of this Code, and whether the information as required under Section 2:392 sub 1 at b-h has been annexed. Furthermore we report, to the extent we can assess, that the Executive Board report, is consistent with the financial statements as required by Section 2:391 sub 4 of the Dutch Civil Code.
Rotterdam, 28 February 2013
PricewaterhouseCoopers Accountants N.V. Originally signed by M. de Ridder RA

Financial Statements | Other information | Event after reporting period
Vopak | Annual Report 2012 | 162
Event after reporting period
Revolving credit facility
On 1 February 2013, Vopak reached agreement with all lenders of the EUR 1.2 billion senior unsecured multicurrency revolving credit facility about the extension of the facility. With this agreement the amount of the facility has been reduced to EUR 1.0 billion and the maturity date has been prolonged until 2 February 2018. At year-end 2012, the facility was fully available.
Articles of Association Provisions Governing Profit Appropriation
The Articles of Association provisions governing profit appropriation are contained in Articles 19 and 27.
The relevant paragraphs of these articles are as follows:
19.2. In the annual general meeting of shareholders:b. the annual accounts as prepared by the management board will be presented to the general meeting for adoption and the allocation of profits will – with due observance of the provisions of article 27 – be determined.
27.12. The profits remaining after application of the previous paragraphs shall be at the free disposal of the general meeting, with due observance of the fact that no dividend can be distributed when, at the time of the distribution, the dividend reserve finance preference shares has a positive balance and furthermore provided that no further distributions shall be made on the anti take-over preference shares and the finance preference shares and no profits shall be (further) reserved for the account of the finance preference shares.
Proposed Profit AppropriationThe proposal to the Annual General Meeting will be to distribute a dividend on the financing preference shares of EUR 8.2 million (2011: EUR 8.2 million) and a dividend in cash of EUR 0.88 (2011: EUR 0.80 in cash) per ordinary share, with a nominal value of EUR 0.50 each. Provided that the Annual General Meeting adopts the statement of income, statement of financial position and dividend proposal, the dividend for the 2012 financial year will be made payable on 2 May 2013.

Financial Statements | Other information | Stichting Vopak
Vopak | Annual Report 2012 | 163
Stichting VopakThe objects of Stichting Vopak, established in Rotterdam, are to promote the interests of Koninklijke Vopak N.V. (Royal Vopak) and of all those involved with this company and any of its affiliated companies in order to safeguard, among other things, Royal Vopak’s and these companies’ continuity and/or identity and/or independence.
During the year under review, the Board of Stichting Vopak convened twice. At these meetings, the protection of Vopak and its effectiveness were discussed. Furthermore, the Board was extensively briefed by the Chairman of the Executive Board of Royal Vopak on the developments in the company. The Chairman of the Supervisory Board attended these meetings as an observer.
In addition the financing of Stichting Vopak was discussed.
With regret we were informed of the unexpected passing away of our fellow board member Mr R.E. Selman. His valuable contributions to the board of the Stichting Vopak will be missed dearly.
As a consequence the composition of the Board was discussed. It was decided not to fill the vacancy at this time and to continue with three board members of the Stichting Vopak. The topic composition of the board will be regularly discussed during future meetings.
During the meeting held on 17 April 2012, Mr A. Schaberg was reappointed as a member and chairman of the Board.
The current members of the Board of Stichting Vopak are:• A. Schaberg, Chairman• G. Izeboud• J.H.M. Lindenbergh
No cumulative protective preference shares in Royal Vopak had been issued at the statement of financial position date.
Protective preference shares will be issued if Stichting Vopak exercises its option right. On 18 October 1999, the Annual General Meeting decided to grant the right to Stichting Vopak to acquire protective preference shares to a maximum amount of the full nominal value of the share capital issued to third parties in the form of ordinary and financing preference shares, less the nominal value of one ordinary share. Royal Vopak and Stichting Vopak have specified their mutual relationship with regard to the option in an option agreement dated 1 November 1999, which was amended on 5 May 2004 such that the original put option granted to Royal Vopak was cancelled.
The Board of Stichting Vopak decides independently whether and when there is a need to exercise its option right for the issue of protective preference shares to Stichting Vopak.
Rotterdam, 28 February 2013
Stichting Vopak

Financial Statements | Other information | Stichting Vopak
Vopak | Annual Report 2012 | 164
Declaration of independence
In the opinion of the Board of Stichting Vopak and the Executive Board of Royal Vopak, Stichting Vopak is independent as meant by Section 5:71(1c) of the Financial Supervision Act.
Rotterdam, 28 February 2013
Stichting Vopak Koninklijke Vopak N.V. (Royal Vopak)

Financial Statements | Other information | Report of the Stichting Administratiekantoor
Vopak | Annual Report 2012 | 165
Report of the Stichting Administratiekantoor Financieringspreferente Aandelen Vopak (‘the Foundation’)As at 31 December 2012, the Foundation administered 41,400,000 registered financing preference shares with a nominal value of EUR 0.50 each in Royal Vopak, for which an equal number of depositary receipts for shares had been issued.
During the year under review, the Board of the Foundation convened twice. During one of these meetings, items on the agenda included the manner in which the Foundation would vote at the AGM to be held on 25 April 2012.
In addition, due to the retirement of Mr Ubas at the end of 2012 on account of attaining the statutory age of 73 years, a binding recommendation was made for the Meeting of depositary receipt holders to appoint Mr J.L. van der Giessen as officer A for a period of 4 years. During the Meeting of depositary receipt holders held on 31 May 2012, Mr J.L. van der Giessen was appointed as per 1 January 2013 as officer A for a period of 4 years.
Holders of depositary receipts did not request any proxies for the AGM. One holder of depositary receipts provided a voting instruction to the Foundation to approve all proposals made to the AGM.
For the AGM, the Foundation provided a proxy with voting instructions to an independent third party, which is Tamminga Notariaat B.V., instructing it to approve all proposals made to the AGM on the Foundation’s behalf.
During the year under review, the Board of the Foundation was composed of two Officers A, Mr J.H. Ubas and Mr H.J. Baeten, appointed by the meeting of depositary receipt holders, and an Officer B, Mr L.P.E.M. van den Boom, appointed by the Board, who is also the Chairman. Prior to taking up their duties, the Officers of the Foundation held senior management positions at various financial institutions. All Officers satisfy the independence conditions as stipulated by article 6.6 of the by-laws of the Foundation. They receive annual compensation of EUR 6,353 each.
The Board of the Foundation will grant proxies to the holders of depositary receipts at their request. The Board of the Foundation will also comply with all voting instructions from the holders of depositary receipts. The granting of proxies and the acceptance of voting instructions will always be in accordance with a limit of one-hundred-and-sixteen votes for every thousand financing preference shares.
Rotterdam, 28 February 2013
Stichting Administratiekantoor Financieringspreferente Aandelen VopakWesterlaan 10 3016 CK Rotterdam

Financial Statements | Other information | Information on the Executive Board members
Vopak | Annual Report 2012 | 166
Information on the Executive Board members
Personal details
Mr Eelco Hoekstra (Chairman and CEO)Nationality: DutchYear of birth: 1971Previous important position held: President of Vopak Asia Supervisory board memberships: None Number of Vopak shares held: 15,838 1 Date of first appointment: 12 November 2010 Current period: 2010 - 2014
Mr Jack de Kreij (Vice-chairman and CFO)Nationality: Dutch Year of birth: 1959 Previous important position held: Senior Partner PricewaterhouseCoopers N.V., Managing Partner Transaction Services Supervisory board memberships: Evides N.V., CSM N.V.Number of Vopak shares held: 330,722 1 Date of first appointment: 1 January 2003 Current period: Indefinitely
Mr Frits Eulderink (COO)Nationality: Dutch Year of birth: 1961 Previous important position held: Vice-president Unconventional Oil at Shell in North America Supervisory board memberships: None Number of Vopak shares held: 750 1
Date of first appointment: 28 April 2010 Current period: 2010 - 2014
1. All transactions were performed at the own expense and risk of the Executive Board member concerned.
Financial Statements | Other information | Information on the Supervisory Board members
Vopak | Annual Report 2012 | 167
Information on the Supervisory Board members
Personal details
Mr Anton van Rossum (Chairman)Chairman of the Selection and Appointment Committee Member of the Remuneration Committee
Mr Anton van Rossum (Dutch, born 12 May 1945). Other positions held were Chairman of the Executive Committee (CEO) of Fortis NV/SA until the end of 2004 and Senior Partner McKinsey and Company Inc. Mr van Rossum was first appointed to the Supervisory Board on 27 September 2007. His current term ends in 2015. He is a member of the Board of Directors of Credit Suisse Group A.G. and Solvay S.A. and also a member of the Supervisory Boards of Münchener Rückversicherungs-Gesellschaft, Erasmus University Rotterdam (Chairman) and Netherlands Economic Institute (Chairman). He does not own Vopak shares.
Mr Martijn van der Vorm (Vice-chairman)Member of the Audit Committee Member of the Selection and Appointment Committee
Mr Martijn van der Vorm (Dutch, born 20 August 1958) is Chairman of the Executive Board of HAL Holding N.V. Mr Van der Vorm was first appointed to the Supervisory Board on 3 November 2000. His current term ends in 2016. He is a member of the Supervisory Board of Anthony Veder Group N.V. He does not own Vopak shares.
Mr Frans Cremers (Member)Chairman of the Audit Committee
Mr Frans Cremers (Dutch, born 7 February 1952). A previous position held was member of the Executive Board and CFO of VNU N.V. Mr Cremers was first appointed to the Supervisory Board on 1 October 2004. His current term ends in 2016. He is a member of the Board of Directors of Stichting Preferente Aandelen Philips and Stichting Preferente Aandelen Heijmans and also a member of the Supervisory Boards of N.V. Nederlandse Spoorwegen (Vice-chairman), N.V. Luchthaven Schiphol, Unibail-Rodamco S.E., Parcom Capital Management B.V. and SBM Offshore N.V. Mr Cremers is also a member of the Capital Market Committee of AFM. He does not own Vopak shares.
Mr Carel van den Driest (Member)Chairman of the Remuneration Committee
Mr Carel van den Driest (Dutch, born 22 November 1947) is Director of Carelshaven B.V. Mr Van den Driest previous held the position of Chairman of the Executive Board of Royal Vopak and he was for the first time appointed to the Supervisory Board on 27 April 2006. His current term ends in 2014. He is a member of the Supervisory Boards of Anthony Veder Group N.V. (Chairman), Van Oord N.V. (Chairman), Stork Technical Services B.V., Teslin Capital Management B.V. and NS Groep N.V. He does not own Vopak shares.

Financial Statements | Other information | Information on the Supervisory Board members
Vopak | Annual Report 2012 | 168
Mr Chun Kai Lam (Member)Member of the Remuneration Committee
Mr Chun Kai Lam (Singapore, born 12 May 1947). Other positions held were Venture Director of the Shell Eastern Petrochemical complex, Singapore (2007-2010) and CEO of CNOOC-SHELL Petrochem Company, China (2000-2007). Mr Lam was first appointed to the Supervisory Board on 27 April 2011. His current term ends in 2015. He is a member of the Board of Directors of Energy Market Authority, Singapore and Jurong Aromatics Corp, Singapore (interim CEO) and member of the Supervisory Boards of SinoChem International, China (independent director and chairman of the remuneration committee) and Hertel Holding B.V. Mr Lam is also executive advisor to the CEO of Yokogawa Electric, Japan. He does not own Vopak shares.
Mr Rien Zwitserloot (Member)Member of the Audit Committee
Mr Rien Zwitserloot (Dutch, born 25 August 1949) previously held the position of Chairman of the Executive Board of Wintershall Holding A.G. Mr Zwitserloot was first appointed to the Supervisory Board on 1 October 2009. His current term ends in 2013. He is a member of the Supervisory Boards of TenneT Holding B.V. and Amsterdam Capital Trading Group B.V. He does not own Vopak shares.

Financial Statements | Other information | Principal Company Officers
Vopak | Annual Report 2012 | 169
Principal Company Officers at 28 February 2013
NetherlandsDivision ManagementJan Bert Schutrops - Division President Walter Moone – Commercial Niek Verbree - Operations & Technology Ferry Lupescu - Finance & Control Nico Vermeulen - Human Resources
Business UnitsPaul Cox 1 - Rotterdam Botlek Boudewijn Siemons 1 - Rotterdam Europoort Age Reijenga 1 - Vlaardingen Erik Kleine 1 - North Netherlands Piet Hoogerwaard - Agencies Joris Meerbach - Vlissingen
Joint venturesPeter den Breejen - Cross-Ocean, the Netherlands
Europe, Middle East & Africa Division ManagementFrank Erkelens - Division President Michiel Gilsing - Commercial Michiel van Cortenberghe - Business Development Dave Mercer - Operations & Technology Maarten van Akkerveeken - Finance & Control Edwin Taal - Human Resouces
Business UnitsMichiel van Ravenstein - Belgium Ramon Ernst - Finland Janhein van den Eijnden - Germany Jarmo Stoopman - Middle East, Dubai Marcel van de Kar - South Africa Ard Huisman - Sweden Ian Cochrane - United Kingdom Augustin Silva - Algeciras, Spain
Joint venturesArnout Lugtmeijer - Vopak E.O.S., Estonia Andrew North – SabTank, Saudi Arabia Cees de Greve - Vopak Horizon Fujairah, UAE Ignacio Casajus - Terquimsa, Spain Imran-ul Haque - Engro Vopak, Pakistan
Asia Division ManagementPatrick van der Voort - Division President Ian ter Haar - Commercial Soo Koong Tan - Business Development Randy Cheong - Operations & Technology K.P. Aldridge - Finance & Control Vijaya Nair - Human Resources
ChinaYan Chen – Division President James Shih - Commercial Chen Peng - Business DevelopmentRon Oomkes – Operations & Technology Wayne Wang - Finance & Control Whitney Wu - Human Resources
Business UnitsRon Dickinson - Lanshan, China Leo Brons - Australia Law Say Huat – Malaysia Teo Seow Ling - Singapore Anthony Zhou - Zhangjiagang, China Parag Gupta - India Mark Noordhoek Hegt - Indonesia Le Quan - Vietnam
Joint venturesChris Badenhorst - Hainan, China Gang Wu - Dongguan, China Teng Bo - Dongjiakou, China Liu Xiaomei - Tianjin, China Biwei Yan - Tianjin Lingang, China Somkiat Khunlerkit - Thai Tank Terminal, Thailand Buu Dinh - Caojing Shanghai, China Jeremy Pei - Xiamen, China Edwin Hui - Ningbo, China J.I. Lee - Ulsan, KoreaSakae Uematsu - Nippon Vopak, Japan
1. Also member of Division Management.

Financial Statements | Other information | Principal Company Officers
Vopak | Annual Report 2012 | 170
North AmericaDivision Management Dick Richelle - Division President Len Daly - Commercial Ralf van der Ven - Business Development Jeffrey Tan - Operations & Technology Clinton Roeder - Finance & Control John McCrory - Legal Affairs
Business UnitsColin Scott - Gulf Coast Mike LaCavera - West Coast Charles Bradley - East Coast Chris Robblee - Canada
Latin America Division Management Jos Steeman – Division President Dick Oskam - Commercial Esteban Kepcija - Operations & TechnologyMark Ramondt - Finance & Control Hernán Rein - Human Resources Diana Salguero - ICT & Process Improvement
Business UnitsDavid Lozano – Mexico Coenraad Meijer - Chile Sjoerd Bazen - Venezuela Marcelo Villaca - Colombia Cristhian Pérez - Peru Daniel Lisak - Brazil Ignacio González - Panama
Joint venturesCarlos Pineda - Ecuador
Global StaffWim Bloks - Sourcing & Procurement Ton van Dijk – Information Services Ans Knape - Human Resources Anne-Marie Kroon - Tax Wilfred Lim - Operations & Technology Wim Samlal - Control & Business Analysis Kees van Seventer - Sales & Marketing (Commercial President) Dirk van Slooten - Global LNG René van Tatenhove - Internal Audit Cees Vletter - Treasury Tjeerd Wassenaar - Legal Affairs & Corporate SecretaryRené Wiezer - Insurance Hans de Willigen - Communication & Investor Relations
Joint venturesDick Meurs - Gate terminal, the NetherlandsCarlos Barajas - Altamira LNG Terminal, Mexico

Financial Statements | Other information | Subsidiaries, Joint Ventures and Associates
Vopak | Annual Report 2012 | 171
Subsidiaries, Joint Ventures and Associates
PRINCIPAL SUBSIDIARIES
Europe, Middle East & Africa
BelgiumVopak Agencies Antwerpen NVVopak Terminal Eurotank NV Vopak Chemical Terminals Belgium NV
GermanyVopak DUPEG Terminal Hamburg GmbHVopak Agency Germany GmbH
FinlandVopak Chemicals Logistics Finland Oy
FranceFos Faster LNG Terminal SAS (90%)
The NetherlandsVopak Nederland B.V. Vopak Finance B.V. Vopak Terminal Vlissingen B.V. Vopak Terminal Amsterdam Petroleumhaven B.V. Vopak Terminal Amsterdam Westpoort B.V. Vopak Agencies Amsterdam B.V. Vopak Agencies Rotterdam B.V. Vopak Agencies Terneuzen B.V. Vopak Chemicals Logistics Netherlands B.V. Vopak LNG Holding B.V. Vopak Logistic Services OSV B.V. Vopak EMEA B.V. Vopak Global Information Services B.V. Vopak Global Procurement Services B.V. Vopak Terminal Botlek B.V. Vopak Terminal Botlek-Noord B.V. Vopak Terminal Chemiehaven B.V. Vopak Terminal Europoort B.V. Vopak Terminal Laurenshaven B.V. Vopak Terminals North Netherlands B.V. Vopak Terminal TTR B.V. Vopak Terminal Vlaardingen B.V.
RussiaRepresentative office of Vopak Chemicals Logistics Finland Oy, Moscow
South AfricaVopak Terminal Durban (Pty) Ltd. (70%)
SpainVopak Terminal Algeciras S.A. (80%)
SwedenVopak Sweden AB
SwitzerlandMonros AG
TurkeyVopak Terminal Marmara DepolamaHizmetleri AS
United KingdomVopak Terminal London Limited B.V.Vopak Terminal Purfleet Ltd. Vopak Terminal Teesside Ltd. Vopak Terminal Windmill Ltd.
Asia/Australia
AustraliaVopak Terminals Australia Pty Ltd.Vopak Terminals Sydney Pty Ltd.Vopak Terminal Darwin Pty Ltd.
ChinaVopak China Management Company Ltd.Vopak Terminal Zhangjiagang Ltd.Vopak Terminal Shandong Lanshan (60%) 1
IndiaVopak Terminals Kandla (CRL Terminals Pvt, Ltd.)
IndonesiaPT Vopak Terminal Merak (95%)
MalaysiaVopak Terminals Pasir Gudang Sdn. Bhd.
SingaporeVopak Asia Pte. Ltd. Vopak Terminals Singapore Pte. Ltd. (69.5%) 2
Vopak Terminal Penjuru Pte. Ltd. (69.5%) 3
1. Vopak Terminal Penjuru Pte. Ltd. 60% ownership in Vopak Terminals Shandong Lanshan2. Vopak Holding Singapore Pte. Ltd. 69.5% ownership in Vopak Terminals Singapore Pte. Ltd. 3. Vopak Terminals Singapore Pte Ltd. 100% ownership in Vopak Terminal Penjuru Pte. Ltd.

Financial Statements | Other information | Subsidiaries, Joint Ventures and Associates
Vopak | Annual Report 2012 | 172
VietnamVopak Vietnam Co. Ltd.
North America
CanadaVopak Terminals of Canada Inc.
United StatesVopak North America Inc.Vopak Terminals North America Inc. Vopak Terminal Deer Park Inc. Vopak Terminal Galena Park Inc. Vopak Terminal Savannah Inc. Vopak Terminal Wilmington Inc. Vopak Terminal Los Angeles Inc. Vopak Terminal Long Beach Inc. Vopak Terminal Perth Amboy LLC (86.44%)
Latin America
ArgentinaVopak Argentina S.R.L.
BrazilVopak Brasil S.A.VPK Partiçipacões e Serviçoes Portuários Ltda.
ChileVopak Chile Limitada
ColombiaVopak Colombia S.A.
MexicoVopak Mexico SA de CV
PanamaVopak Panama Atlantic Inc.
PeruVopak Peru S.A.
VenezuelaVopak Venezuela S.A.
JOINT VENTURES
Europe, Middle East & Africa
BahrainVopak Zamil Holding W.L.L. (50%)
EstoniaAS Vopak E.O.S. (50%)
The NetherlandsAltamira LNG CV (60%)Altamira LNG Management B.V. (60%)Calandstraat C.V. (50%)Cross-Ocean C.V. (50%)Cosco Container Lines (Netherlands) B.V. (50%)Gate terminal B.V. (45%)Gate terminal Management B.V. (50%)MultiCore CV (25%)Vopak Terminal Eemshaven B.V. (50%)Westerlaan C.V. (50%)Westerpark C.V. (50%)
PakistanEngro Vopak Terminal Ltd. (50%)
SpainTerminals Quimicos SA (Terquimsa) (50%)
United Arab EmiratesVopak Horizon Fujairah Ltd. (33.33%)
United KingdomMorzine Limited (Thames Oilport) (33.33%)

Financial Statements | Other information | Subsidiaries, Joint Ventures and Associates
Vopak | Annual Report 2012 | 173
Asia
ChinaXiamen Paktank Company Ltd. (40%)Vopak Terminal Ningbo Co. Ltd. (37.5%) Vopak Shanghai Logistics Company Ltd. (50%) Vopak Nanjiang Petrochemicals Terminal Tianjin Company Ltd. (50%)Vopak Ethylene Terminal Tianjin Co. Ltd. (50%) Vopak Bohai Petrochemicals (Tianjin) Terminal Co. Ltd. (50%) Tianjin Lingang Vopak Jetty Co. Ltd. (30%) Vopak Terminal SDIC Yangpu Co. Ltd. (49%) Vopak Sealink Terminal (Dongguan) Co. Ltd. (50%) Dongguan Sealink Jetty Co. Ltd. (50%)
IndonesiaPT Jakarta Tank Terminal (49%)
JapanNippon Vopak Co. Ltd. (40%)
KoreaVopak Terminals Korea Ltd. (51%)
MalaysiaKertih Terminals Sdn. Bhd. (30%) 1 Pengerang Terminals Sdn. Bhd. (49%) 2
Pengerang Independent Terminals Sdn. Bhd. (89.8%) 3
ThailandThai Tank Terminal Ltd. (49%)
Latin America
BrazilUniao-Vopak Armazens Gerais Limitada (50%)
ChileTerminal Maritimo Vopak-Oxiquim Mejillones S.A. (50%)
Ecuador Vopak Ecuador S.A. (50%)
MexicoTerminal de Altamira de S. de R.L. de C.V. (60%)TLA Servicios de R.L. de C.V. (60%)
PanamaPayerdi Terminal Company S. de R.L. (50%)
ASSOCIATES
Europe, Middle East & Africa
The NetherlandsMaasvlakte Olie Terminal N.V. (16.67%)Rotterdamse Cintra Maatschappij B.V. (25%)
Saudi ArabiaJubail Chemicals Storage & Services Company LLC (25%)
1. Vopak Terminal Penjuru Pte. Ltd. 30% ownership in Kertih Terminals Sdn. Bhd. 2. Vopak Terminal Pengerang B.V. 49% ownership in Pengerang Terminals Sdn. Bhd.3. Pengerang Terminals Sdn Bhd. 89.8% ownership in Pengerang Independent Terminals Sdn. Bhd.

Financial Statements | Five-year Consolidated Summary
Vopak | Annual Report 2012 | 174
Five-year Consolidated Summary In EUR millions 2012 2011 2010 2009 2008
Consolidated abridged statement of incomeRevenues 1,314 1,172 1,106 1,001 924
Other operating income 12 13 9 21 16
Total operating income 1,326 1,185 1,115 1,022 940
Operating expenses - 669 - 642 - 604 - 560 - 546
Depreciation, amortization and impairment - 218 - 178 - 152 - 131 - 110
Total operating expenses - 887 - 820 - 756 - 691 - 656
Operating profit 439 365 359 331 284Result of joint ventures and associates using the equity method 97 221 83 60 38
Group operating profit 536 586 442 391 322
Net finance costs - 84 - 79 - 68 - 46 - 37
Profit before income tax 452 507 374 345 285
Income tax - 83 - 71 - 73 - 69 - 55
Net profit 369 436 301 276 230
Non-controlling interests - 40 - 35 - 31 - 25 - 17
Net profit owners of parent 329 401 270 251 213
Net profit holders of financing preference shares - 8 - 8 - 8 - 4 - 1
Net profit holders of ordinary shares 321 393 262 247 212
Consolidated abridged statement of income excluding exceptional itemsOperating profit 454 378 360 319 274
Result of joint ventures and associates using the equity method 107 92 85 66 46
Group operating profit 561 470 445 385 320
Net finance costs - 84 - 74 - 68 - 45 - 37
Profit before income tax 477 396 377 340 283
Income tax - 85 - 77 - 73 - 68 - 63
Net profit 392 319 304 272 220
Non-controlling interests - 40 - 35 - 31 - 25 - 17
Net profit owners of parent 352 284 273 247 203
Net profit holders of financing preference shares - 8 - 8 - 8 - 4 - 1
Net profit holders of ordinary shares 344 276 265 243 202
Consolidated abridged statement of financial positionIntangible assets 68 73 54 41 39
Property, plant and equipment 3,127 2,904 2,546 2,051 1,693
Financial assets 759 608 616 497 433
Deferred tax 33 31 6 5 7
Other 236 229 148 136 107
Total non-current assets 4,223 3,845 3,370 2,730 2,279
Total current assets 799 395 461 406 355
Total assets 5,022 4,240 3,831 3,136 2,634
Total equity 1,968 1,838 1,550 1,333 1,009
Total non-current liabilities 2,522 1,863 1,662 1,412 1,141
Total current liabilities 532 539 619 391 484
Total liabilities 3,054 2,402 2,281 1,803 1,625
Total equity and liabilities 5,022 4,240 3,831 3,136 2,634

Other information | Glossary
Vopak | Annual Report 2012 | 175
GlossaryAGMAnnual General Meeting of Shareholders
Audit CommitteeCommittee within the Supervisory Board that assists the Executive Board in performing the supervisory tasks relating to, among other things, the integrity of the financial statements, the financial reporting, the internal audit procedures and the relationship with and the independence of the external auditors
BcmaBillion cubic meters per annum
Biofuels/BiodieselProducts of vegetable origin or from animal fats that are added to gasoline or diesel
BrownfieldA project describing the expansion of storage capacity at an existing terminal
CapexCapital expenditure
Capital employed Total assets less current liabilities, excluding assets and current liabilities not related to operational activities
Cbm Cubic meter
CEOChief Executive Officer, the highest ranking executive with the overall responsibility of the organization
CFOChief Financial Officer, member of the Executive Board, specifically charged with Finance
COOChief Operating Officer, member of the Executive Board, specifically charged with Operations
Corporate GovernanceThe manner in which the company is managed and the supervision of management is structured
COSOCommittee of Sponsoring Organizations of the Treadway Commission, an international organization whose aim is to create a model for information on and management of business risks
EBITEarnings Before Interest and Tax
EBITDAEarnings Before Interest, Tax, Depreciation and Amortization
EMEAVopak division Europe, Middle East & Africa
EPSEarnings per share
ERMEnterprise Risk Management
GreenfieldBuilding a new terminal on undeveloped land
GRIGlobal Reporting Initiative (for more information visit www.globalreporting.org)
HRHuman Resources
HubRegional storage and transport centre
IASInternational Accounting Standards
ICTInformation and Communication Technology
IFRSInternational Financial Reporting Standard
ISDAInternational Swaps and Derivates Association
LeanQuality improvement method and philosophy
LNGLiquefied Natural Gas

Other information | Glossary
Vopak | Annual Report 2012 | 176
LPGLiquefied Petroleum Gas
LTIPLong-term incentive plan
LTIRLost Time Injury Rate; number of accidents entailing absence from work per million hours worked (of own personnel and contractors at subsidiaries, joint ventures and associates)
LTSP Long-term share plan
NCINon-controlling interest
NOCsNational oil companies
NPSNet Promoter Score; a method of measuring the strength of customer loyalty for an organisation
OECDOrganisation for Economic Cooperation and Development
ROCEReturn on Capital Employed, EBIT as a percentage of the average capital employed
Shale gas A natural gas formed as a result of being trapped within shale formations
SHESafety, Health and Environment
ThroughputVolume of a product handled by a terminal in a given period, calculated as (in + out)/2
Tight oil A petroleum play that consists of light crude oil contained in petroleum-bearing formations of relatively low porosity and permeability (shales)
TJ Terrajoules
TLA Terminal de LNG de Altamira (LNG terminal in Mexico)
Total Injury Rate (TIR)Total number of injuries per million hours worked (own personnel)
TTRVopak Tank Terminal Rotterdam, one of the chemical terminals in Rotterdam
VBDOVereniging van Beleggers voor Duurzame Ontwikkeling (Dutch Association of Investors for Sustainable Development)
VSQI Vopak Service Quality Index: shows the quality of the various business processes at Vopak as indicated by Vopak's customers by an annual customer satisfaction survey

Other information | Contact us
Vopak | Annual Report 2012 | 177
Royal Vopak
Global Communication & Investor RelationsTelephone: +31 (0)10 400 2911Email: [email protected]
Visiting address
Westerlaan 103016 CK RotterdamThe Netherlands
Postal address
P.O. Box 8633000 AW RotterdamThe Netherlands
Media contact
Gerbert van Genderen StortTelephone: +31 (0)10 400 27 86Email: [email protected]
Investor Relations contact
Tom SmeenkTelephone: +31 (0)10 400 27 76Email: [email protected]
Sustainability contact
Willem van der ZonTelephone: +31 (0)10 400 25 61Email: [email protected]
Contact us

Other information | Imprint
Vopak | Annual Report 2012 | 178
Imprint
Royal Vopak
Global Communication & Investor RelationsTelephone: +31 (0)10 400 2911Email: [email protected]
Consultancy, concept and design
DartGroup, Amsterdam
Text support
Stampa Communications, Amsterdam
Technical realization
DartGroup, AmsterdamPolder Knowledge, Rotterdam
Photography board members
Fotografie Alexander, Almere

Royal VopakWesterlaan 103016 CK RotterdamP.O. Box 8633000 AW RotterdamThe Netherlands
Telephone: +31 10 400 29 11Email: [email protected]
• • • • • • • • • • • • • • • • • • • • • • • • • • • • • • • • • • • •
• • • • • • • • • • • • • • • • • • • • • • • • • • • • • • • • • • • •
• • • • • • • • • • • • • • • • • • • • • • • • • • • • • • • • • • • •
• • • • • • • • • • • • • • • • • • • • • • • • • • • • • • • • • • • •
• • • • • • • • • • • • • • • • • • • • • • • • • • • • • • • • • • • •
• • • • • • • • • • • • • • • • • • • • • • • • • • • • • • • • • • • •
• • • • • • • • • • • • • • • • • • • • • • • • • • • • • • • • • • • •
• • • • • • • • • • • • • • • • • • • • • • • • • • • • • • • • • • • •