vtionir-en.vtion.de/data/vtion_fullnote_20120224_en.pdfanalysis: warburg research ... providers,...
TRANSCRIPT

Vtion
Warburg Research 1
Buy (old: Buy)
PT EUR 8.00 (old: 8.00)
Price EUR 3.63
Bloomberg V33 GR
Reuters V33G
Sector Telecom/Internet
Vtion offers wireless broadband data solutions in China. The development and marketing of wireless data cards is the company's core business.
Share data: 23.02.2012 / Closing price
Market cap: EUR 57.0 m
Enterprise Value (EV): EUR -48.9 m
Book value: EUR 135 m
No. of shares: 15.7 m
Trading volume Ø: EUR 73.3 th
Shareholders:
Awill Holdings 46.8 %Freefloat 25.8 %SCGC Capital H. 9.9 %Hong Kong Vtion Tech. 6.3 %Sunshine Century I. 3.1 %Axxion S.A. 3.1 % Calendar:
Annual report 2011 04/19/12Figures Q1 05/14/12AGM 06/26/12Figures Q2 08/13/12
Change 2011E 2012E 2013E
old Δ% old Δ% old Δ%
Sales 77.0 0 80.0 0 77.0 0 EBIT 7.9 0 8.2 0.0 7.2 0 EPS 0.41 0 0.43 0 0.38 0
Analysis: Warburg Research
Date of publication: 24.02.2012
Analyst:
Malte Räther +49 (40) 309537-185 [email protected]
Turnaround with tablet PC and mobile applications?
Vtion Wireless Technology AG (Vtion) is a provider of mobile broadband solutions in the People’s Republic of China. The company’s core business is the development and sale of wireless data cards for every established interface standard and all operational mobile communication standards. As part of the diversification of the product portfolio the company has expanded its offer by various new products such as, for instance, wireless routers and tablet PC. In addition, Vtion intends to position itself in the market for mobile applications and operate its own platform which is also planned to be opened for third parties.
The quality in competition is based on
§ The good business relations to the three Chinese mobile network providers, China Mobile, China Unicom and China Telecom, resulting from a long-standing cooperation. Vtion offers a major part of its products through their sales channels.
§ A lean and flexible cost structure. As Vtion is focused on the development and sale of the offered products and the production is outsourced, fixed costs are low and deviations in demand can be cushioned well.
Until approximately one year ago Vtion was almost exclusively specialised in the development and sale of wireless data cards. After the sharp slump in demand for wireless data cards at the end of 2010 the company has started to expand its offer. Vtion has only little experience in the new product segments and the markets addressed have a disproportionately higher degree of competition than the oligopolistic market for wireless data cards. Hence the successful establishment of the products on a sustainable basis is not guaranteed. Consequently, the operating business development has a low visibility and is subject to high uncertainties.
It can be assumed that demand and pricing for wireless data cards continue to be weak. However the revenues resulting from the new product segments should approximately compensate the decline in revenues from the data cards business. Hence revenues are expected to amount to approx. EUR 80m in 2012 and EUR 77m in 2013 whereas pressure on margins is likely to continue.
The fair value per share of EUR 8 is based on a DCF approach. The Vtion share currently trades well below the net cash position per share of EUR 7 as per Q3 2011. Thanks to the launch of the new products Vtion was able to reduce the dependency on the data card business and thus to stabilise business development – a further massive sales slump seems unlikely. Based on the lean and flexible cost structure the company should remain profitable and continue to generate positive cash flows in the mid term. Consequently, the Buy rating is retained with an upside of > 100%.
Fiscal year ending: 31.12. in EUR m 2007 2008 2009 2010 2011E 2012E 2013E
Sales 29.0 39.2 67.6 102 77.0 80.0 77.0 Change Sales yoy 189.9 % 35.1 % 72.7 % 50.3 % -24.3 % 3.9 % -3.8 % Gross balance 11.7 16.1 22.6 37.3 14.0 14.4 13.5 Gross margin 40.3 % 41.1 % 33.4 % 36.7 % 18.2 % 18.0 % 17.5 % EBITDA 9.3 12.8 19.0 29.7 8.5 8.8 7.8 EBITDA-margin 32.2 % 32.6 % 28.3 % 29.2 % 11.1 % 11.0 % 10.1 % EBIT 9.2 12.6 18.8 29.2 7.9 8.2 7.2 EBIT-margin 31.9 % 32.2 % 28.0 % 28.7 % 10.3 % 10.2 % 9.3 % Net income 9.2 12.4 16.4 22.0 6.4 7.7 6.7 EPS 0.80 1.13 1.31 1.38 0.41 0.43 0.38 Free Cash Flow per share 0.69 1.13 -0.84 1.86 0.46 0.42 0.41 Dividend 0.00 0.00 0.00 0.21 0.06 0.06 0.06 Dividend Yield n.a. n.a. n.a. 5.8 % 1.7 % 1.7 % 1.7 % EV/Sales n.m. n.m. n.m. n.m. n.m. n.m. n.m. EV/EBITDA n.m. n.m. n.m. n.m. n.m. n.m. n.m. EV/EBIT n.m. n.m. n.m. n.m. n.m. n.m. n.m. PER 4.5 3.2 2.8 2.6 8.9 8.4 9.6 ROCE 86.9 % 49.2 % 28.8 % 25.9 % 6.0 % 5.9 % 5.0 % Adj. Free Cash Flow Yield n.a. n.a. n.a. n.a. n.a. n.a. n.a.

Vtion Table of Contents
Warburg Research 2
Competitive Quality 3
High market potential for wireless broadband data solutions in China 3
Structurally difficult market environment for wireless data cards 5
Good business relations with network operators 5
Weak market position in the table PC market 5
Lean and flexible cost structure 6
Conclusion 6
Financials 7
Recent performance & sales mix 7
Balance sheet quality 9
Sales and earnings development from 2012-2013 10
Valuation 12
Free Cash Flow Yield 12
DCF model 13
Peer group valuation 14
Conclusion 15
Newsflow 16
Company & Products 18
Company background 18
China’s mobile communications market 20
Management 21
Shareholder structure 21
Figures 23

Vtion Competitive Quality
Warburg Research 3
§ High market potential for wireless broadband data solutions in China
§ Structurally difficult market environment for wireless data cards
§ Good business relations with network operators
§ Weak market position in the tablet PC market
§ Flexible cost structure thanks to outsourced production
High market potential for wireless broadband data solutions in China
The Chinese market for wireless broadband data solutions is a structural growth market. Important drivers of demand for wireless broadband solutions are the quality of the mobile communications infrastructure as well as the mobile communications and internet penetration as well as the wireless internet penetration.
Mobile communications infrastructure
At the beginning of 2009 the three Chinese mobile communications providers China Unicom, China Mobile and China Telecom started to establish their third generation (3G) mobile communications networks and are continuously expanding them ever since: in Q2 2011 China Unicom and China Telecom launched their 3.5G mobile communications networks, China Mobile intends to put its 4G mobile communications networks into operation in 2012. By expanding the reach of the 3G/3.5G mobile communications networks the providers improve the technical basis for the wireless internet use. As the providers want the utilisation of their networks to be as high as possible, they are highly interested in a rapid dissemination of wireless broadband solutions and, consequently, make for a strong demand for mobile end devices capable of 3G/3.5G.
Mobile communications penetration
The Chinese mobile phone penetration stood at ca. 71% at the end of October 2011. When comparing this figure with the one of the industrialised countries there is further upside potential. For instance, 109m mobile phone accesses were counted in Germany in 2010, corresponding to a mobile communications penetration of 127%. The diagram below gives an overview of the mobile communications penetration in selected countries.
Mobile communications penetrationCell phone contracts in % of population
Source: Monitoring-Report Deutschland Digital 2011, Warburg Research
0%
20%
40%
60%
80%
100%
120%
140%
Germany South Korea Japan USA China
2010 2009

Vtion Competitive Quality
Warburg Research 4
Internet penetration
China’s internet penetration was approx. 38% at the end of 2011. The diagram below shows that there is still growth potential in China also with regard to the further spread of internet usage.
Internet penetrationInternet connections in % of households
Source: Monitoring-Report Deutschland Digital 2011, Warburg Research
0%
20%
40%
60%
80%
100%
120%
South Korea Japan Germany USA China
2010 2009
Wireless internet penetration
The market potential for wireless internet solutions is also supported by the fact that only some 20% of China’s population used the internet on a mobile basis in 2010. Looking at the wireless internet penetration rates of Japan (2010: 88%) or South Korea (2010: 86%) a further increase in the number of users can be expected.
Wireless internet penetrationWireless internet users in % of population
Source: Monitoring-Report Deutschland Digital 2011, Warburg Research
0%
10%
20%
30%
40%
50%
60%
70%
80%
90%
100%
Japan Südkorea Deutschland China US A
2010 2009
0%
10%
20%
30%
40%
50%
60%
70%
80%
90%
100%
Japan South Korea Germany China US A
2010 2009
In view of the low mobile communications, internet and wireless internet penetration rates in an international comparison there is further market potential in China for wireless, internet-capable end devices. The rapid dissemination of wireless internet solutions is also supported by the continued further development of mobile communications networks, enabling ever higher data transmission output, and the providers’ interest to fill the networks as fast as possible.

Vtion Competitive Quality
Warburg Research 5
Structurally difficult market environment for wireless data cards
The market for wireless data cards in China has currently an oligopolistic structure on the demand side as well as on the supply side. Some 90% of the overall demand for wireless data cards can be attributed to the three network operators China Unicom, China Telecom and China Mobile. Approx. 80% to 90% of that demand is satisfied by the three major players in the market for data cards: Vtion, Huawei Technologies Co., Ltd. and Zhong Xing Telecommunication Equipment Co., Ltd (ZTE). The remaining 10% to 20% are supplied by a large number of smaller companies. Huawei is the biggest provider of data cards in China with an estimated market share of 30% to 35%, followed by ZTE with an estimated market share of between 25% and 30% and Vtion with an estimated market share von 20% to 25%.
It has to be noted however that the above mentioned growth potential of the market for wireless broadband data solutions does not apply to the segment of wireless data cards. The growth potential in the field of wireless data cards, Vtion is mainly active in, is largely depleted since end 2010. These changes in the market conditions can be put down to the strategy of the mobile network providers China Unicom, China Mobile and China Telecom, to increasingly sell alternative solutions such as smartphones or tablet PC instead of data cards. This has resulted in a significant slump in prices and a considerable slowdown in demand for data cards.
This development is clearly reflected in Vtion’s revenues. Revenues of the Vtion group generated with the sale of wireless data cards plummeted by 54% from EUR 93.4 m in FY 2010 to EUR 43.2 m (WRe) in FY 2011.
A recovery of the data card business is not expected for the structural reason above. Even though Vtion was able to grow revenues by some 56% to EUR 13.4m in Q2 11 compared to Q1 11 on the back of the introduction of the 3.5G network technology in China, revenues were down again by some 14% to EUR 11.5m in the seasonally strongest third quarter.
Good business relations with network operators
The good business relations with the mobile network operators are one of Vtion’s major strengths. They are the result of a long-standing successful cooperation in the field of wireless data cards in which Vtion was able to convince the providers of being a reliable supplier of high quality products. Vtion is rated Tier 1 supplier by China Unicom and China Telecom in the field of wireless data cards (China Mobile does not publish any supplier ratings). Based on the good business relations Vtion should be able to maintain its strong competitive position in the market for wireless data cards.
Vtion should have benefited from these business relations when the new products were established, as the company sells all of the products, except for the table PC, through the sales channels of the providers. For instance, Vtion operates a shop-in-shop model for its app business together with the three providers.
The tablet PCs are currently still sold by Vtion’s own sales team and in retail locations. However, the company aims for selling the devices through the providers’ sales channels going forward.
Weak market position in the table PC market Unlike the data card market, the tablet PC maket is one of the growth segments of the market for mobile broadband solutions. However, Vtion has a weak market position in this sector. Firstly, this results from the fact that competitors like Apple, Samsung or Lenovo have significantly higher brand awareness, economies of scale and more experience in this product segment and secondly, that Vtion cannot use its usual distribution network. The Vtion group’s strategy for the tablet PC market banks on differentiating from competitors through the price, on the one hand, and through pre-installed applications, e.g. for fashion accessories or for cosmetics, on the other hand. Furthermore, the company aims to develop tablet PC solutions for business and corporate customers, thus avoiding the high degree of competition in the general consumer market. Currently, Vtion is in negotiations with two companies of the

Vtion Competitive Quality
Warburg Research 6
insurance sector regarding the delivery of tablet PC with pre-installed applications specifically developed by Vtion for insurance companies. In view of the competitive disadvantages described above it cannot be regarded as certain that the company succeeds in establishing itself successfully in the long term in this segment of the market for mobile broadband data solutions.
Lean and flexible cost structure
The Vtion group is focused on the design, development and sale of the products offered. The production is fully outsourced. On top, development orders are placed with third-party providers on a regular basis. By doing so, the company’s costs are kept relatively variable and Vtion is able to react flexibly to deviations in demand. On the one hand, delivery quantities can be quickly increased when demand goes up as the company does not have to build up production capacities. On the other hand, there are no high fixed costs when demand goes down. This enabled the company to operate profitably at the EBIT and net income level despite the weak prices and demand in the field of wireless data cards since Q4 2010.
Conclusion
By introducing new products Vtion was partially able to compensate for the approx. 50% weaker revenues in the core business in FY 2011 compared to the previous year. As a result, overall revenues declined roughly 24%. Furthermore, the company was profitable at the EBIT and net income level in spite of the slump in revenues.
This was achieved thanks to…
§ the long-standing good business relations with the mobile communications providers which are an important basis for the establishment of the new products.
§ the lean cost structure resulting from the outsourced production, enabling the company to remain profitable despite the slump in sales.
However, Vtion has yet to prove whether it is able to successfully develop new structural growth segments in the market for wireless broadband data solutions on a sustainable basis and thereby participate in the growth potential of this market in China. Consequently, the company’s business development currently has a low visibility.
Vtion Financials
Warburg Research 7
§ Recent performance & sales mix
§ Despite structural weakness in the data card business: operating profitably
§ High balance sheet quality: equity rate ~90% as well as high net cash
§ Stabilised revenues and profitability expected
Recent performance & sales mix
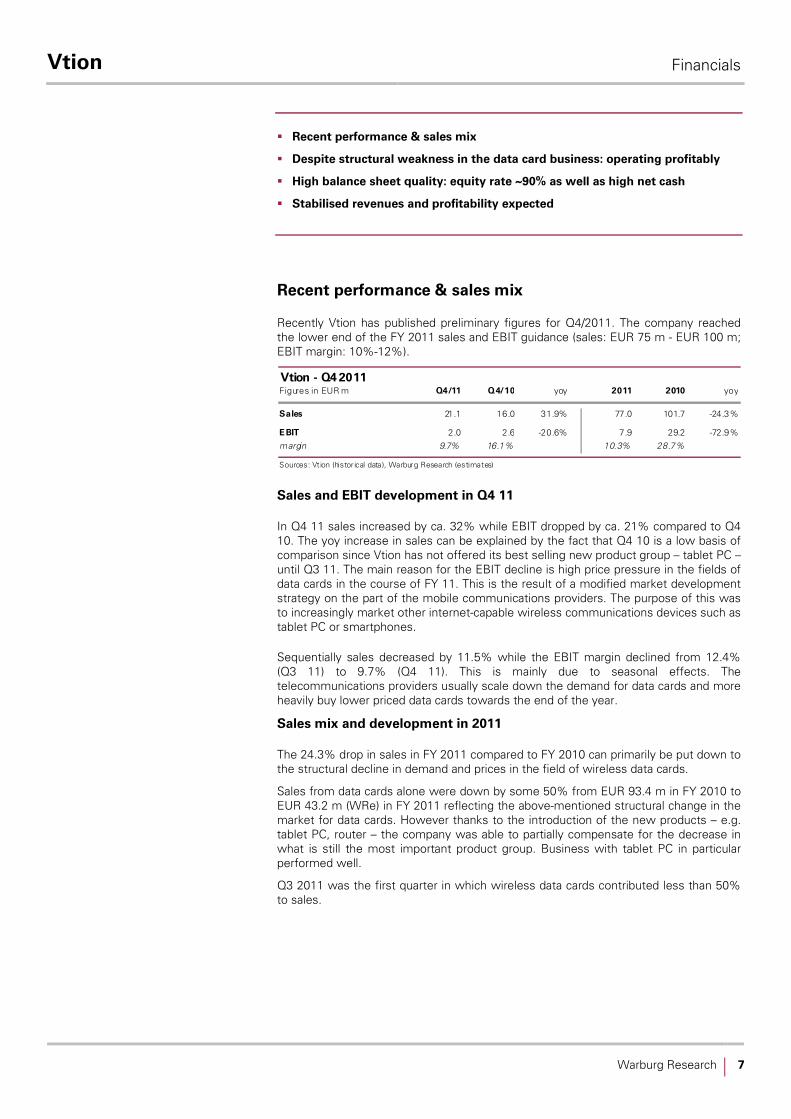
Recently Vtion has published preliminary figures for Q4/2011. The company reached the lower end of the FY 2011 sales and EBIT guidance (sales: EUR 75 m - EUR 100 m; EBIT margin: 10%-12%).
Vtion - Q4 2011Figures in EUR m Q4/11 Q4/10 yoy 2011 2010 yoy
Sales 21.1 16.0 31.9% 77.0 101.7 -24.3%
E BIT 2.0 2.6 -20.6% 7.9 29.2 -72.9%margin 9.7% 16.1% 10.3% 28.7%
Sources: Vt ion (histor ical data), Warburg Research (estimates)
Sales and EBIT development in Q4 11
In Q4 11 sales increased by ca. 32% while EBIT dropped by ca. 21% compared to Q4 10. The yoy increase in sales can be explained by the fact that Q4 10 is a low basis of comparison since Vtion has not offered its best selling new product group – tablet PC – until Q3 11. The main reason for the EBIT decline is high price pressure in the fields of data cards in the course of FY 11. This is the result of a modified market development strategy on the part of the mobile communications providers. The purpose of this was to increasingly market other internet-capable wireless communications devices such as tablet PC or smartphones.
Sequentially sales decreased by 11.5% while the EBIT margin declined from 12.4% (Q3 11) to 9.7% (Q4 11). This is mainly due to seasonal effects. The telecommunications providers usually scale down the demand for data cards and more heavily buy lower priced data cards towards the end of the year.
Sales mix and development in 2011
The 24.3% drop in sales in FY 2011 compared to FY 2010 can primarily be put down to the structural decline in demand and prices in the field of wireless data cards.
Sales from data cards alone were down by some 50% from EUR 93.4 m in FY 2010 to EUR 43.2 m (WRe) in FY 2011 reflecting the above-mentioned structural change in the market for data cards. However thanks to the introduction of the new products – e.g. tablet PC, router – the company was able to partially compensate for the decrease in what is still the most important product group. Business with tablet PC in particular performed well.
Q3 2011 was the first quarter in which wireless data cards contributed less than 50% to sales.

Vtion Financials
Warburg Research 8
Sales developement by product typeSales in EUR m (right); sales shares in % (left)
Source: Vtion, Warburg Re search
93%
80%
70%
46%
20%
30%
54%
48%
94%95%
68%
52%
32%
7%6%5%
0%
10%
20%
30%
40%
50%
60%
70%
80%
90%
100%
Q1/10 Q2/10 Q3/10 Q4/10 Q1/11 Q2/11 Q3/11 Q4/11e
0
5
10
15
20
25
30
35
Wireless datacards Other products Sa les
As a result of the structural problems of the data card market, the share of the data card business in total sales should continue to slightly decrease.
The table below gives an overview of the sales shares of the various new products since Q4 2010.
Sales of newer products by product typein EUR m Q4/10 Q1/11 Q2/11 Q3/11 Q4/11e
SmartphonesS ales 1.1 1.0 1.2 1.5 1.0In % of s ales 7% 8% 6% 6% 5%E -ReaderS ales 0.4 1.4 1.3 0.1 0.0In % of s ales 3% 11% 7% 0% 0%V pad Tablet-PC
S ales 0.0 0.0 0.6 6.3 6.0In % of s ales 0% 0% 3% 26% 28%Mob ile c ommunications routerS ales 0.5 1.2 2.0 2.9 3.1In % of s ales 3% 10% 10% 12% 15%P CtoTVS ales 0.0 0.0 0.5 1.7 1.4In % of s ales 0% 0% 3% 7% 7%T otal sales 16.0 12.6 19.4 24.0 21.1Thereof new products (%) 13% 29% 29% 52% 54%
Source: Vtion, Warburg Research
2011 EBIT development
Despite the weak demand and prices for wireless data cards, Vtion was profitable at EBIT level in FY 2011. Still, EBIT was down some 73% yoy from EUR 29.2m to EUR 7.9m and the EBIT margin declined from approx. 29% to approx. 10% yoy. However, the EBIT margin gradually increased during the course of the first three quarters. The decline in Q4 was due to the seasonal effect explained above. In our view the sequential improvement is attributable to two reasons. Firstly, China Unicom and China Telecom started to operate mobile communications networks based on 3.5G technologies (China Unicom: HSPA+, China Telecom: EVDO Rev. B) and accordingly asked for data cards of the new technology generation. The sale of 3.5G data cards should have resulted in a slightly higher EBIT margin when compared to 3G data cards. Secondly, the revenue share of the new products grew steadily over the first nine months of the fiscal year. This should also have had a positive impact on the EBIT margin. The diagram below shows the development of EBIT and EBIT margin.

Vtion Financials
Warburg Research 9
Developement EBIT & EBIT marginIn EUR m
Source: Vtion, Warburg Re search
9.7%12.4%
9.8%8.2%
16.1%
33.9%
0
2
4
6
8
10
12
Q3/10 Q4/10 Q1/11 Q2/11 Q3/11 Q4/11
0%
5%
10%
15%
20%
25%
30%
35%
40%
EBIT EBIT margin
9M 2011 cash flow development
In line with the drop in sales and EBIT, the cash flow from operating activities was also significantly down yoy, declining from approx. EUR 20m in the first nine months of 2010 by ca. 20% to EUR 15.5m in the same period of the current year.
As Vtion has outsourced the production, the company does not make high investment in property, plant and equipment. Thus, the cash flow from investment activities is currently insignificantly low as measured by the total cash flow.
The current share buy-back programme and the dividend payment (Q2 2011) explain the negative cash flow from financing activities.
Cash flow development
in EUR m Q3/2010 Q4/2010 Q1/11 Q2/11 Q3/11
Cash flow from operating activities 1.3 11.1 10.2 -0.8 6.2Cash flow from investment activities 0 -0.1 0.0 0.0 0.0Cash flow from financing activities 0 0.0 0.0 -4.4 -0.9Changes liquid funds 1.3 11.0 10.1 -5.3 5.3Effects from f/x changes -9.7 4.4 -5.1 -0.6 8.0Total liquid funds 83.6 99.0 104.0 98.2 111.5
Sources: Vtion, Warburg Research
Balance sheet quality
As per 9M 2011 the balance sheet total stood at approx. EUR 148m. Given an equity ratio of some 90% of the balance sheet total the Vtion group’s balance sheet has a high quality which is underlined by the fact that Vtion has no financial liabilities.
Vtion’s business model is hardly capital-intensive as the company, as explained above, has no own productions plants. This explains the low share of fixed asses in the balance sheet total. Liquid funds and accounts receivable make up the major item of the working capital. The former adds up to approx. EUR 111m or EUR 7 per share and is the largest item on the assets side with a share of approx. 75%. The latter amounts to ca. EUR 27m and makes up ~17% of the balance sheet total.

Vtion Financials
Warburg Research 10
Balance sheet VtionAs of 9/2011; in % of balance sheet total
Fixed assets 2.3% T otal equity 88.9%
Current assets 97.7% Liabilities 11.1%
Accounts receivable 17.3% Accounts payable 7.7%
Liquid assets 75.1% other Liabilities 3.4%
other current assets 5.5%
Source: Vtion, Warburg Re search
Dividend
Currently, Vtion is overcapitalised - the high cash reserves are currently not needed for the operating business. However, according to the company’s dividend policy only some 15% of the net income is distributed – it is not planned to pay out a special dividend for FY 2011. Instead, the company currently buys back shares in the amount of up to 10% of the share capital, i.e. up to 1.598m shares. We consider the payment of special dividends to be unlikely for two reasons. Firstly, management stressed out several times that the high cash reserves are necessary because of the uncertain business development. Secondly, the CEO, who holds some 50% of the shares, does not want to create the impression of drawing cash out of the company to take it for his own benefit.
Sales and earnings development from 2012-2013
Sales development
The revenues from the sale of wireless data cards are expected to decline slightly in the fiscal years 2012 and 2013, as demand and pricing should remain weak in this business segment.
However, the company is likely to participate in the growth potential for wireless broadband solutions in China through its product groups tablet PC and “wireless network devices” (router, PCtoTV). Consequently, we expect to see rising sales contributions from these segments. On the basis of these expectations we assume slightly increasing sales for FY 2012 and slightly declining sales for 2013.
Consolidated Profit & Loss Vtionin EUR m 2010 2011e 2012e 2013e
Sales 101.7 77.0 80.0 77.0
change yoy 50.3% -24.3% 3.9% -3.8%Gross profit 37.3 14.0 14.4 13.5
margin 36.7% 18.2% 18.0% 17.5%E BIT 29.2 7.9 8.2 7.2
margin 28.7% 10.3% 10.2% 9.3%Net income 22.0 6.4 6.8 5.9
margin 21.6% 8.4% 8.5% 7.7%
Sources: Vt ion (histor ical data), Warburg Research (estimates)
Cost structure
Cost of sales make up the largest cost item. They mainly include the costs for the external production, development costs as well as costs for material procurement. In 2011 we assume a gross margin of ~18% which is expected to slightly decrease over the next two fiscal years. Firstly, the price pressure for data cards, which continue to be the company’s most important product group in 2012 and 2013, should persist. Secondly, tablet PCs, which are expected to become the second most important product group, are unlikely to generate significantly higher gross margins.
SGA costs are rather low. For 2011 we assume administration costs amounting to ~6% and selling costs to ~3% of sales. The cost ratios are unlikely to change

Vtion Financials
Warburg Research 11
materially in 2012 and 2013.
Cost ratios Vtionin % of Sales 2010 2011e 2012e 2013e
Cost of sales 63.3% 81.8% 82.0% 82.5%S ales and marketing 4.7% 3.0% 3.1% 3.2%G eneral and administration 3.7% 5.9% 6.0% 6.3%
Sources: Vt ion (histor ical data), Warburg Research (estimates)
The cost structure of the Vtion group is highly flexible since the cost of sales which are predominantly variable costs are by far the largest cost position. The SGA costs which are mainly fixed costs are rather low. Thus, the loss potential is also limited. The payroll costs should amount to EUR 2m (WRe) in FY 2011.
EBIT development
The estimates for the different types of costs result in expected EBIT margins of ~10% and ~9,5% for 2012-2013. These estimates entail the following risks:
§ Prices and demand for wireless data cards are developing weaker than expected. It cannot be excluded that the three network providers have a stronger than expected focus on alternative internet-capable wireless end devices on the back of the market development strategies determined early in 2012.
§ The identification of niches in the tablet PC market is not very successful. The market for tablet PCs in China is highly competitive. Should Vtion fail (1) to identify suitable niches (2) to differentiate from competitors with pre-installed applications in the tablet PC segment and (3) to establish in the B2B business EBIT margins in this segment are likely to be lower than anticipated.

Vtion Valuation
Warburg Research 12
§ All valuation models indicate an undervaluation
§ The FCFY model does not adequately reflect the medium-term risks
§ The peer group comparison is of low relevance
§ The DCF model yields a fair value of EUR 8.
Free cash flow yield
The adjusted free cash flow yield assumes that investors seek to purchase assets (here the enterprise value) at such a price that the free cash flow return (free cash flow = net income + depreciations - maintenance capex + taxes - financial result) on the EV exceeds their opportunity costs of 10%.
Free Cash Flow Yield - VtionFigures in EUR m 2007 2008 2009 2010 2011e 2012e 2013e
Net Income 9.2 12.4 16.6 22.0 6.4 6.8 5.9+ Depreciation + Amortisation 0.1 0.2 0.2 0.4 0.6 0.6 0.6- Net Interest Income -0.1 -0.2 0.0 -3.2 -0.5 0.5 0.5+ Taxes 0.0 0.0 2.3 4.0 1.0 1.9 1.8- Maintenance Capex 1.0 1.0 1.0 1.0 1.5 1.5 1.5+ Others 0.0 0.0 0.0 0.0 0.0 0.0 0.0
= Adjusted Free Cash Flow 8.3 11.8 18.2 28.7 7.0 7.3 6.3
Adjusted Free Cash Flow Yield -20.7% -29.2% -45.1% -71.2% -16.9% -15.5% -11.9%Hurdle rate 10.0% 10.0% 10.0% 10.0% 10.0% 10.0% 10.0%
= Enterprise Value -40.2 -40.2 -40.2 -40.2 -41.4 -47.1 -52.8
= Fair Enterprise Value 83.3 117.6 181.5 286.5 70.1 73.0 62.8
- Net Debt (Cash) -99.0 -99.0 -99.0 -99.0 -100.2 -105.9 -111.5- Pension Liabilities 0.0 0.0 0.0 0.0 0.0 0.0 0.0- Others 0.0 0.0 0.0 0.0 0.0 0.0 0.0
= Fair Market Capitalisation 182.3 216.6 280.5 385.5 170.3 178.9 174.3
No. of shares (m) 15.7 15.7 15.7 15.7 15.7 15.7 15.7
= Fair value per share (EUR) 11.61 13.79 17.87 24.55 10.84 11.39 11.10
premium (-) / discount (+) in % 210.4% 268.7% 377.6% 556.3% 189.9% 204.5% 196.8%
Sensitivity Fair value per Share (EUR)
13.0% 10.39 12.07 15.20 20.34 9.81 10.32 10.1812.0% 10.73 12.55 15.94 21.51 10.10 10.62 10.4411.0% 11.13 13.11 16.82 22.89 10.44 10.97 10.7410.0% 11.61 13.79 17.87 24.55 10.84 11.39 11.109.0% 12.20 14.63 19.15 26.58 11.34 11.91 11.558.0% 12.94 15.67 20.76 29.12 11.96 12.55 12.107.0% 13.89 17.00 22.82 32.38 12.76 13.38 12.82
Sources: Vtion (historical data), Warburg Research (estimates)
Hurdle rate
The FCFY models for 2012e and 2013e result in a fair value per share of ca. EUR 11. However, as the margins are expected to decrease further after 2013, the medium-term risks of the business model cannot be adequately reflected on the basis of the FCFY. Therefore, the FCFY model is less appropriate for the determination of the fair value.

Vtion Valuation
Warburg Research 13
DCF model
The medium-term risks of the business model can be best reflected with a DCF model. We assume that Vtion will no longer grow at a sales level from 2014 onwards and that the EBIT margin will gradually decrease to 3%. On the one hand, these estimates are based on the expectation that the pressure on the selling prices of the wireless data cards persists and the demand in this sector remains weak. On the other hand, an improvement of the EBIT margin and growth momentum cannot be expected in view of the high degree of competition in the markets for tablet PC and mobile applications.
The WACC of 18.5% is composed of the model parameters below. The high beta of 3 is due to the very low visibility of the operating business development and the share’s low liquidity.
Based on these assumptions the DCF model indicates a fair value of EUR 8 for the Vtion share.
DCF Model - VtionFigures in EUR m 2011e 2012e 2013e 2014e 2015e 2016e 2017e 2018e 2019e 2020e 2021e 2022e 2023e 2024e
Sales 77.0 80.0 77.0 75.5 74.0 72.5 71.7 71.7 71.7 71.7 71.7 71.7 71.7 71.7Change -24.3% 3.9% -3.8% -2.0% -2.0% -2.0% -1.0% 0.0% 0.0% 0.0% 0.0% 0.0% 0.0% 0.0%
EBIT 7.9 8.2 7.2 5.3 4.8 4.0 3.9 3.6 2.9 2.9 2.2 2.2 2.2 2.2EBIT-Margin 10.3% 10.2% 9.3% 7.0% 6.5% 5.5% 5.5% 5.0% 4.0% 4.0% 3.0% 3.0% 3.0% 3.0%
Tax rate 13.5% 21.7% 22.8% 25.0% 25.0% 25.0% 25.0% 25.0% 25.0% 25.0% 25.0% 25.0% 25.0% 25.0%
NOPAT 6.9 6.4 5.5 4.0 3.6 3.0 3.0 2.7 2.2 2.2 1.6 1.6 1.6 1.6
Depreciation 0.6 0.6 0.6 0.8 0.7 0.7 1.1 1.1 1.1 1.1 1.1 1.1 1.1 1.1in % of Sales 0.8% 0.8% 0.8% 1.0% 1.0% 1.0% 1.5% 1.5% 1.5% 1.5% 1.5% 1.5% 1.5% 1.5%
Change in Liquidity from- Working Capital 1.1 0.1 0.9 -0.3 0.5 0.5 0.2 -1.4 0.0 -0.7 0.0 0.0 0.0 0.0- Capex -0.9 -1.0 -1.0 -1.0 -1.1 -1.1 -1.1 -1.1 -1.1 -1.1 -1.1 -1.1 -1.1 -1.1Capex in % of Sales 1.2% 1.3% 1.3% 1.4% 1.5% 1.5% 1.5% 1.5% 1.5% 1.5% 1.5% 1.5% 1.5% 1.5%
Other 0.0 0.0 0.0 0.0 0.0 0.0 0.0 0.0 0.0 0.0 0.0 0.0 0.0 0.0
Free Cash Flow 7.6 6.1 6.0 3.4 3.7 3.1 3.2 1.3 2.2 1.4 1.6 1.6 1.6 1.6(WACC-Model)
Model parameter Valuation (mln)
Debt ratio 0.00% Beta 3.00 Present values 2024e 25.7Costs of Debt n.a. WACC 18.50% Terminal Value 1.0Market return 9.00% Liabilities 0.0Risk free rate 4.25% Terminal Growth 0.00% Liquidity 99.0 No. of shares (mln) 15.70
Equity Value 125.7 Value per share (EUR) 8.00
Sensitivity Value per Share (EUR)
Terminal Growth Delta EBIT marginWACC -0.75% -0.50% -0.25% 0.00% 0.25% 0.50% 0.75% WACC -1.5 pp -1.0 pp -0.5 pp 0.0 +0.5 pp +1.0 pp +1.5 pp
19.50% 7.96 7.96 7.96 7.96 7.96 7.96 7.97 19.50% 7.62 7.74 7.85 7.96 8.08 8.19 8.3019.00% 7.98 7.98 7.98 7.98 7.98 7.99 7.99 19.00% 7.64 7.75 7.87 7.98 8.10 8.22 8.3318.75% 7.99 7.99 7.99 7.99 8.00 8.00 8.00 18.75% 7.64 7.76 7.88 7.99 8.11 8.23 8.3518.50% 8.00 8.00 8.00 8.00 8.01 8.01 8.01 18.50% 7.65 7.77 7.89 8.00 8.12 8.24 8.3618.25% 8.01 8.01 8.01 8.02 8.02 8.02 8.02 18.25% 7.66 7.78 7.90 8.02 8.14 8.26 8.3718.00% 8.02 8.03 8.03 8.03 8.03 8.03 8.03 18.00% 7.66 7.78 7.91 8.03 8.15 8.27 8.3917.50% 8.05 8.05 8.05 8.05 8.05 8.05 8.05 17.50% 7.68 7.80 7.93 8.05 8.17 8.30 8.42
Source: Warburg Research

Vtion Valuation
Warburg Research 14
Peer group valuation
The peer group comparison is based on three companies which, similar to Vtion, generate the majority of revenues with wireless data cards.
Sierra Wireless (Canada)
Employees: ~850
Sierra Wireless offers wireless data cards, routers and embedded modules amongst others. The global company is also active in the field of machine-to-machine (M2M) communication.
Novatel Wireless (USA)
Employees: ~500
The product portfolio of the globally active company also includes wireless data cards, routers as well as embedded modules. Furthermore, the company is active in the field of machine-to-machine (M2M) communication just like Sierra Wireless.
Option N.V. (Belgium)
Employees: ~240
Amongst others, the company is provider of wireless data cards, embedded modules and software solutions.
The table below shows the consensus estimates of the peers.
Peergroup - Key FiguresCompany LC Price MC EV
in LC in LC m in LC m 12e 13e 12e 12e 13e 12e 13e 12e 13e
N ovatel Wireless USD 3.28 105.2 16.3 0.06 0.38 5.55 434.4 484.8 9.0 3.4 4.5 20.4Option NV EUR 0.61 50.3 9.5 -0.06 -0.34 -0.06 49.4 24.3 4.7 -18.4 -4.3 n.a.S ierra Wireless USD 7.62 238.6 153.0 0.58 0.76 8.94 625.6 678.2 37.9 42.5 11.5 15.6
V tion EUR 3.60 56.5 -43.7 0.43 0.38 9.00 80.0 77.0 8.8 7.8 8.2 7.2
Source: Warburg Re search, Bloomberg
EBITDA EBITEPS BPS Sales
The significance of the EV multiples is limited as Vtion’s operating business is currently valued with a negative number and the EV multiples cannot be applied for this reason. Applying the 2012e and 2013e PER results in an undervaluation of 150% on average. This undervaluation is supported by the 2012e PBR which indicates an upside of 79%.
Peergroup - Valuation MultiplesCompany LC Price MC EV
in LC in LC m in LC m 12e 13e 12e 12e 13e 12e 13e 12e 13e
N ovatel Wireless USD 3.28 105.2 16.3 54.67 8.75 0.59 0.04 0.03 1.82 4.86 3.67 0.80Option NV EUR 0.61 50.3 8.6 neg. neg. neg. 0.18 0.36 1.84 neg. neg. n.a.S ierra Wireless USD 7.62 238.6 153.0 13.16 9.99 0.85 0.24 0.23 4.04 3.60 13.26 9.82
Average 33.91 9.37 0.72 0.15 0.21 2.57 4.23 8.47 5.31
V tion EUR 3.63 57.0 -43.2 8.44 9.55 0.40 neg. neg. neg. neg. neg. neg.
Valuation difference to Average 302% -2% 79% n.a. n.a . n.a. n.a. n.a. n.a.
Fair va lue per share based on Average 14.58 3.56 6.50 n.a. n.a . n.a. n.a. n.a. n.a.
Sources: W arburg Research, Bloombe rg
P / E P / B EV / Sales EV / EBITDA EV / EBIT
Vtion Valuation
Warburg Research 15
Conclusion
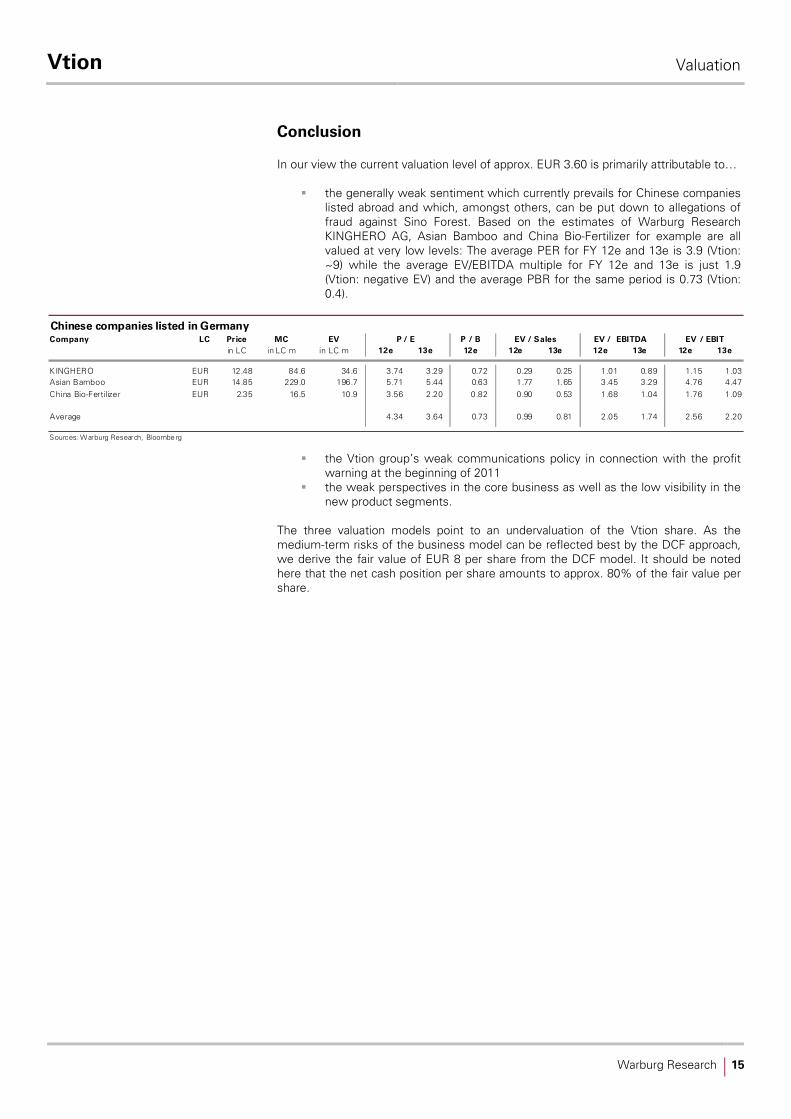
In our view the current valuation level of approx. EUR 3.60 is primarily attributable to…
§ the generally weak sentiment which currently prevails for Chinese companies listed abroad and which, amongst others, can be put down to allegations of fraud against Sino Forest. Based on the estimates of Warburg Research KINGHERO AG, Asian Bamboo and China Bio-Fertilizer for example are all valued at very low levels: The average PER for FY 12e and 13e is 3.9 (Vtion: ~9) while the average EV/EBITDA multiple for FY 12e and 13e is just 1.9 (Vtion: negative EV) and the average PBR for the same period is 0.73 (Vtion: 0.4).
Chinese companies listed in GermanyCompany LC Price MC EV
in LC in LC m in LC m 12e 13e 12e 12e 13e 12e 13e 12e 13e
K INGHERO EUR 12.48 84.6 34.6 3.74 3.29 0.72 0.29 0.25 1.01 0.89 1.15 1.03Asian Bamboo EUR 14.85 229.0 196.7 5.71 5.44 0.63 1.77 1.65 3.45 3.29 4.76 4.47China Bio-Fertilizer EUR 2.35 16.5 10.9 3.56 2.20 0.82 0.90 0.53 1.68 1.04 1.76 1.09
Average 4.34 3.64 0.73 0.99 0.81 2.05 1.74 2.56 2.20
Sources: W arburg Research, Bloombe rg
P / E P / B EV / Sales EV / EBITDA EV / EBIT
§ the Vtion group’s weak communications policy in connection with the profit warning at the beginning of 2011
§ the weak perspectives in the core business as well as the low visibility in the new product segments.
The three valuation models point to an undervaluation of the Vtion share. As the medium-term risks of the business model can be reflected best by the DCF approach, we derive the fair value of EUR 8 per share from the DCF model. It should be noted here that the net cash position per share amounts to approx. 80% of the fair value per share.

Vtion Newsflow
Warburg Research 16
§ Operating performance as an important share price driver
§ Optimisation of the mobile communications networks
§ Economic growth in China is slowing down
§ Acquisitions
Operating performance
Vtion’s news flow should primarily be determined by the operating performance. Particularly the performance of the new products, first and foremost tablet PC and mobile applications, is of high importance in view of the structural problems of the data card business. Vtion is currently undergoing negotiations with two insurance companies regarding the delivery tablet PC specifically developed for the insurance sector. A successful conclusion of these negotiations is likely to improve the share’s sentiment.
However, a sustainable recovery of the share cannot be expected before Vtion proves to be competitive in the field of tablet PC and mobile applications.
Optimisation of the mobile communications networks
The optimisation of the mobile communications networks, i.e. upgrades of these networks to newer mobile communications standards leads to a temporary abatement of the pressure on the selling prices for wireless data cards, as seen in Q2 2011. As such, an improvement of the mobile communications structure should improve the share’s sentiment. After China Unicom and China Telecom launched their 3.5G mobile communications networks in 2011, China Mobile plans the introduction of the 4G technology (TD-LTE) in 2012
Economic growth in China is slowing down
Vtion’s operating development might be burdened by the current slowdown in the economic growth in China. The growth rates of the GDP in China have been at a high level for several years. At present, however, a slowdown in the growth momentum can be observed. After the economic growth still amounted to 10.4% in 2010, the Chinese economy grew by 9.2% in 2011. The growth rate in Q4 2011 of 8.9% yoy reached the lowest level in two and a half years. Important leading indicators like the OECD leading indicator and the Purchasing Managers Index indicate that the economic dynamic may slow down further in the first months of 2012. The OECD leading indicator recently slowed down at a slower pace but a trend reversal is not yet visible.

Vtion Newsflow
Warburg Research 17
OECD leading indicator
Source: Warburg Research
92
94
96
98
100
102
104
Jan 0
5
Jul 0
5
Jan 06
Jul 06
Jan 0
7
Jul 0
7
Jan 08
Jul 0
8
Jan 09
Jul 0
9
Jan 1
0
Jul 1
0
Jan 11
Jul 1
1
Acquisitions
In view of the high cash reserves Vtion is likely to diversify its product portfolio further by means of acquisitions. However, the company communicated that it has not been able so far to identify appropriate takeover candidates and that this strategy is not of high priority at present. If Vtion should fail to successfully position itself in the market for tablet PC and mobile applications, takeovers may however become relevant to expand to product range.

Vtion Company & Products
Warburg Research 18
§ Vtion: provider of mobile broadband data solutions in China
§ Structural problems in the field of wireless data cards, the most important business segment
§ Diversification of the product portfolios on the basis of the good business relations to the mobile communications providers
Company background
The Vtion group offers mobile communications data solutions for mobile broadband services in the People’s Republic of China (VRC). The company’s core business is the development and sale of wireless data cards. Together with ZTE and Huawei, Vtion is one of the leading providers in the market for wireless data cards. Since the end of 2010 the company has expanded its product range by several new products such as, for instance, tablet PC or 3G wireless routers.
Vtion divides its operating business in three business segments: wireless data terminal, wireless intelligent terminals and mobile applications. Additionally, Vtion generated delayed sales revenues after 9M in 2011 with the Mobile Business Club which does not exist anymore and is combined in the data solution services segment. This segment will no longer generate revenues going forward.
The sales contributions of the three segments are as follows:
Revenue by segmentAs of 9/2011
Source: Vt ion, Warburg Re search
Wireless intelligent terminals
28%
Data solution service1%
Wireless data termina ls
71%
Group structure
Vtion Wireless Technology AG („Vtion“) was founded on October 1, 2007 as a German public limited company, headquartered in Frankfurt. It is the holding company and holds 100% of the Vtion Technology Company, Ltd. which is the sole owner of the Vtion Information Technology Co. Ltd. („Vtion IT“) and Vtion Software Co. Ltd. („Vtion Software“). Vtion IT is the sole owner of Vtion Communication Co. Ltd. („Vtion Communication“), Vtion Software is the sole owner of Vtion Anzhuo Technology Co. Ltd. (Vtion Anzhuo). The operating business of the Vtion Group is undertaken by Vtion IT, Vtion Software, Vtion Anzhuo and Vtion Communication.

Vtion Company & Products
Warburg Research 19
Source: Vtion
Vtion group structure
Vtion Wireless Technology AG Frankfurt, Germany
Vtion Technology Co, Ltd. British Virgin Islands
Vtion Information Technology (Fujian) Co., Ltd.People´s Republic of China
Vtion Software (Fujian) Co., LtdPeople´s Republic of China
100%
Vtion Communication (Fujian) Co., Ltd.People´s Republic of China
Vtion Anzhuo Technology (Beijing) Co., Ltd.People´s Republic of China
100%
100%
100%
100%
Employees
Vtion’s headcount grew from 191 to 248 in the course of FY 2011 which, amongst others, can be put down to the diversification of the business model and the foundation of a the new subsidiary: Vtion Anzhuo. The diagram below shows the split of the employees by areas of operation.
Employees by business functionAs of 2/2012
Source: Vtion, Warburg Re search
Administration79
Marketing & Sales98
Management5Customer Service & Call
Center19
Production11
R&D36
Product groups
Vtion’s operating business is divided in three business segments: wireless data terminals, wireless intelligent terminals and mobile applications.
The Wireless Data Terminals segment includes wireless data cards for every established interface standard (e.g. PCI or USB) and all operational 3G/3.5G mobile communications standards (3G: TD-SCDMA, WCDMA, CDMA 2000 EVDO; 3.5G: HSPA+, EVDO Rev B). The data cards serve as modems establishing a connection with the card-issuing mobile communications provider, thus enabling the mobile broadband internet access. The company also offers 3G wireless routers in this segment.
The Wireless Intelligent Terminals segment comprises two tablet PT models, a 7 inch model (V7) as well as a 10 inch model (V10). Additionally the company offers

Vtion Company & Products
Warburg Research 20
different iPhone package options (in cooperation with China Unicom), an e-reader and the PCtoTV network device. The latter enables the wireless connection between a laptop and a HDTV monitor.
In its Mobile Application segment Vtion offers mobile applications for end devices based on the Android operating system. As part of the shop-in-shop model Vtion currently sells some 600 apps mainly for free in the app stores of the three mobile network operators. Going forward, the company plans to sell the apps through its own distribution platform, the V store, and through the platforms of the providers. The first significant sales contributions of this segment are expected for FY 2012.
Range of products
Source: Vtion, Warburg Re search
Value chain
The value chain in the Wireless Data Terminals and Wireless Intelligent Terminals can be divided in four steps.
§ Step 1: product design and product specification. Based on an analysis of the technological trends in the fields of mobile internet, mobile communications and interface technology the company determines specifications and designs for future products.
§ Step 2: development. Taking the specifications as a basis the new products are then developed by both internal development capacities and third parties by way of development orders.
§ Step 3: production. The production is completely outsourced to external production service providers (amongst others to Foxconn’s subsidiary Hong Xun).
§ Step 4: marketing and distribution. Except for the tablet PC Vtion predominantly sells its products through the mobile service providers’ sales channels. In addition, the company sells its product via distribution partners and in retail locations.
In its mobile applications business segment Vtion pursues the strategy to acquire apps both inside and outside of China and to sell them through its own distribution platform.
China’s mobile communications market
The mobile communications market of the People’s Republic of China has an oligopolistic structure. At present there are three telecommunications operators – China Mobile, China Telecom and China Unicom – whose 3G networks are based on different mobile communications standards. China Telecom’s 3G network is based on the CDMA2000-EVDO mobile communications standard, China Unicom uses the WCDMA standard and China Mobile the TD-SCDMA standard. China Mobile has the most mobile communications and 3G customers. The table below gives an overview.

Vtion Company & Products
Warburg Research 21
Mobile Network operators in China
China Mobile China Un icom China Telecom
Mobile customers in m 639 192 120
Market share 67% 20% 13%
3G customers 45 33 31
Market share 41% 30% 28%
Mobile communication s tandard TD-SCDMA WCDMA CDMA 2000 EVDO
Source: Warburg Research, Companies
The three mobile communications providers continue to develop their networks. In Q2 2011 mobile communications networks on the basis of the 3.5G standard were taken into operation (China Unicom: HSPA+; China Telecom: EVDO Rev B). China Mobile plans to start operating 4G mobile communications networks (TD-LTE Standard) in 2012.
Management
Executive board
The executive board of the Vtion group consists of five members.
Mr. Chen Guoping is the CEO and founder of Vtion. He is responsible for the management of the whole group and particularly for the strategic planning and the marketing segment. Mr. Chen Guopin has a good network of contacts in the wireless data card industry and was one of the winners of the National Outstanding Manager Awards in China in 2005. Mr. Chen Guoping has a degree in Executive Master of Business Administration of the Tsinghua university in Peking.
Mr. Zheng Hongbo is the company’s CFO since October 23, 2011. He is responsible for the financial administration and the capital market communication. Prior to his position with Vtion Mr. Zheng Hongbo worked as Finance Manager for Dell (China) Co., Ltd. Mr. Zheng Hongbo has an MBA from the business school INSEAD.
Mr. He Zhihong is the CTO. He is responsible for research & development. Prior to joining Vtion the trained computer scientist worked as a software developer for Minfa Securities Co., Ltd. and was head of the R&D division of Fuzhou Netto Technology Co., Ltd.
Ms. Fei Ping is responsible for the quality control, logistics and human resources amongst other things. Holding a degree in economics, Ms. Fei Ping worked in the marketing division of Budweiser (Wuhan) International Brewing Co., Ltd. and as a consultant at Canada Union Immigration Consulting Co., Ltd.
Mr. Ding Chaojie is responsible for sales and marketing amongst others. Prior to joining Vtion he was the head of the marketing division at Hongzhi Science and Technology Co., Ltd.
Shareholder structure
Mr. Chen Guoping, CEO of the Vtion group, holds 49.9% of the shares in Vtion Wireless Technology AG through the companies Anwill Holdings Ltd. and Sunshine Century Investment Ltd. 6% of the shares are held by the Hong Kong Vtion Wireless Technology Company Ltd. Two brothers of Mr. Chen Guoping, Mr. Chen Guohe (51%) and Mr. Chen Guoshun (22%), and Mr. He Zhihong (27%) have a stake in the company. The treasury stock amounts to ca. 5%; the free float is ca. 26%.

Vtion Company & Products
Warburg Research 22
Shareholder structureAs of: 2/2012
Source; FactSet, Vtion, Warburg Research
Treasury stock5%
Axxion S.A.3%
Sunshine Century Investment Ltd.
3%
Hong Kong Vtion Wireless Technology
Comp any Ltd.6%
SCGC Capital Holding Compan y Ltd.
10%
Freefloat26%
Awill Holdings Ltd.47%

Vtion Figures
Warburg Research 23
Consolidated Profit & Loss Vtion in EUR m 2007 2008 2009 2010 2011E 2012E 2013E Sales 29.0 39.2 67.6 102 77.0 80.0 77.0 Cost of sales 17.3 23.1 45.1 64.4 63.0 65.6 63.5 Gross balance 11.7 16.1 22.6 37.3 14.0 14.4 13.5 Research and development 0.0 0.0 0.0 0.0 0.0 0.0 0.0 Sales and marketing 0.9 1.4 2.0 4.7 2.3 2.5 2.5 General and administration 1.3 2.6 2.0 3.7 4.5 4.8 4.9 Other operating income/expenses -0.2 0.5 0.3 0.4 0.8 1.0 1.0 Unfrequent items 0.0 0.0 0.0 0.0 0.0 0.0 0.0 EBITDA 9.3 12.8 19.0 29.7 8.5 8.8 7.8 Depreciation of fixed assets 0.0 0.1 0.1 0.2 0.3 0.3 0.3 EBITA 9.3 12.7 18.9 29.4 8.2 8.5 7.5 Amortisation of intangible fixed assets 0.1 0.1 0.1 0.2 0.3 0.3 0.3 Impairment charges and amortisation of goodwill 0.0 0.0 0.0 0.0 0.0 0.0 0.0 EBIT 9.2 12.6 18.8 29.2 7.9 8.2 7.2 Interest income 0.2 0.3 0.2 0.7 2.0 0.5 0.5 Interest expenses 0.3 0.5 0.2 3.9 2.5 0.0 0.0 Financial result -0.1 -0.2 0.0 -3.2 -0.5 0.5 0.5 Recurring pretax income from cont. operations 9.1 12.4 18.8 26.0 7.4 8.7 7.7 Extraordinary income/loss 0.0 0.0 0.0 0.0 0.0 0.0 0.0 EBT 9.1 12.4 18.8 26.0 7.4 8.7 7.7 Taxes total 0.0 0.0 2.3 4.0 1.0 1.0 1.0 Net income from continuing operations 9.2 12.4 16.4 22.0 6.4 7.7 6.7 Income from discontinued operations (net of tax) 0.0 0.0 0.0 0.0 0.0 0.0 0.0 Net income before minorities 9.2 12.4 16.4 22.0 6.4 7.7 6.7 Minority interest 0.0 0.0 0.0 0.0 0.0 0.0 0.0 Net income 9.2 12.4 16.4 22.0 6.4 7.7 6.7
Sources: Vtion (historical data), Warburg Research (forecasts)
Consolidated Profit & Loss Vtion in % of Sales 2007 2008 2009 2010 2011E 2012E 2013E Sales 100.0 % 100.0 % 100.0 % 100.0 % 100.0 % 100.0 % 100.0 % Cost of sales 59.7 % 58.9 % 66.6 % 63.3 % 81.8 % 82.0 % 82.5 % Gross balance 40.3 % 41.1 % 33.4 % 36.7 % 18.2 % 18.0 % 17.5 % Research and development 0.0 % 0.0 % 0.0 % 0.0 % 0.0 % 0.0 % 0.0 % Sales and marketing 3.3 % 3.5 % 2.9 % 4.7 % 3.0 % 3.1 % 3.2 % General and administration 4.5 % 6.6 % 2.9 % 3.7 % 5.9 % 6.0 % 6.3 % Other operating income/expenses -0.7 % 1.2 % 0.5 % 0.4 % 1.0 % 1.3 % 1.3 % Unfrequent items 0.0 % 0.0 % 0.0 % 0.0 % 0.0 % 0.0 % 0.0 % EBITDA 32.2 % 32.6 % 28.1 % 29.2 % 11.1 % 11.0 % 10.1 % Depreciation of fixed assets 0.1 % 0.2 % 0.2 % 0.2 % 0.4 % 0.4 % 0.4 % EBITA 32.1 % 32.4 % 28.0 % 28.9 % 10.7 % 10.6 % 9.7 % Amortisation of intangible fixed assets 0.2 % 0.2 % 0.2 % 0.2 % 0.4 % 0.4 % 0.4 % Impairment charges and amortisation of goodwill 0.0 % 0.0 % 0.0 % 0.0 % 0.0 % 0.0 % 0.0 % EBIT 31.9 % 32.2 % 27.8 % 28.8 % 10.3 % 10.2 % 9.3 % Interest income 0.8 % 0.7 % 0.3 % 0.7 % 2.6 % 0.6 % 0.7 % Interest expenses 1.1 % 1.2 % 0.3 % 3.8 % 3.3 % 0.0 % 0.0 % Financial result -0.3 % -0.5 % -0.1 % -3.2 % -0.7 % 0.6 % 0.7 %
Recurring pretax income from cont. operations 31.5 % 31.6 % 27.8 % 25.6 % 9.7 % 10.8 % 10.0 % Extraordinary income/loss 0.0 % 0.0 % 0.0 % 0.0 % 0.0 % 0.0 % 0.0 % EBT 31.5 % 31.6 % 27.8 % 25.6 % 9.7 % 10.8 % 10.0 % Taxes total -0.1 % 0.0 % 3.5 % 4.0 % 1.3 % 1.3 % 1.3 % Net income from continuing operations 31.6 % 31.6 % 24.3 % 21.6 % 8.4 % 9.6 % 8.7 % Income from discontinued operations (net of tax) 0.0 % 0.0 % 0.0 % 0.0 % 0.0 % 0.0 % 0.0 % Net income before minorities 31.6 % 31.6 % 24.3 % 21.6 % 8.4 % 9.6 % 8.7 % Minority interest 0.0 % 0.0 % 0.0 % 0.0 % 0.0 % 0.0 % 0.0 % Net income 31.6 % 31.6 % 24.3 % 21.6 % 8.4 % 9.6 % 8.7 %
Sources: Vtion (historical data), Warburg Research (forecasts)

Vtion Figures
Warburg Research 24
Balance sheet Vtion in EUR m 2007 2008 2009 2010 2011E 2012E 2013E
Assets
Intangible assets 0.6 0.8 1.3 1.3 1.3 1.5 1.7 thereof other intangible assets 0.6 0.8 1.3 1.3 1.3 1.5 1.7 thereof Goodwill 0.0 0.0 0.0 0.0 0.0 0.0 0.0 Property, plant and equipment 0.2 0.5 0.6 1.2 1.5 1.7 1.9 Financial assets 0.0 0.0 0.0 0.0 0.0 0.0 0.0 Fixed assets 0.8 1.2 1.9 2.6 2.9 3.2 3.6 Inventories 2.3 4.9 3.8 3.6 3.9 4.0 3.9 Accounts receivable 10.1 6.4 34.8 32.6 36.9 38.4 36.9 Other Assets 1.1 8.2 7.9 8.0 13.5 13.5 13.5 Liquid assets 12.2 30.3 61.5 99.0 100 106 112 Current assets 25.8 49.8 108 143 155 162 166 Total assets 26.6 51.0 110 146 157 165 169
Liabilities and shareholders' equity
Subscribed capital 10.0 11.5 16.0 16.0 16.0 16.0 16.0 Additional paid-in capital 0.0 7.6 48.2 48.2 48.2 48.2 48.2 Surplus capital 0.8 13.2 29.7 51.7 54.8 60.8 65.9 Other equity components -0.4 3.3 2.1 13.5 16.3 16.4 16.3 Book value 10.4 35.6 96.0 129 135 141 146 Minority Interest 0.0 0.0 0.0 0.0 0.0 0.0 0.0 Total equity 10.4 35.6 96.0 129 135 141 146 Provision for pensions and similar obligations 0.0 0.0 0.0 0.0 0.0 0.0 0.0 Provisions 3.0 3.8 0.7 0.4 0.4 0.4 0.4 Financial liabilities 5.2 0.0 0.0 0.0 0.0 0.0 0.0 Accounts payable 4.7 8.3 8.2 11.2 16.9 18.6 17.9 Other liabilities 3.3 3.3 5.0 4.7 4.7 4.7 4.7 Liabilities 16.2 15.4 13.9 16.3 22.0 23.7 23.0 Total liabilities and shareholders' equity 26.6 51.0 110 146 157 165 169
Sources: Vtion (historical data), Warburg Research (forecasts)
Balance sheet Vtion in % of Balance Sheet Total 2007 2008 2009 2010 2011E 2012E 2013E
Assets
Intangible assets 2.2 % 1.5 % 1.2 % 0.9 % 0.9 % 0.9 % 1.0 % thereof other intangible assets 2.2 % 1.5 % 1.2 % 0.9 % 0.9 % 0.9 % 1.0 % thereof Goodwill 0.0 % 0.0 % 0.0 % 0.0 % 0.0 % 0.0 % 0.0 % Property, plant and equipment 0.7 % 1.0 % 0.6 % 0.9 % 1.0 % 1.0 % 1.1 % Financial assets 0.0 % 0.0 % 0.0 % 0.0 % 0.0 % 0.0 % 0.0 % Fixed assets 2.9 % 2.4 % 1.8 % 1.8 % 1.8 % 2.0 % 2.1 % Inventories 8.7 % 9.6 % 3.4 % 2.5 % 2.5 % 2.4 % 2.3 % Accounts receivable 38.1 % 12.5 % 31.7 % 22.4 % 23.5 % 23.3 % 21.8 % Other Assets 4.3 % 16.0 % 7.2 % 5.5 % 8.6 % 8.2 % 8.0 % Liquid assets 46.0 % 59.5 % 55.9 % 68.0 % 63.7 % 64.2 % 65.8 % Current assets 97.1 % 97.6 % 98.2 % 98.3 % 98.2 % 98.0 % 97.9 % Total assets 100.0 % 100.0 % 100.0 % 100.0 % 100.0 % 100.0 % 100.0 %
Liabilities and shareholders' equity
Subscribed capital 37.6 % 22.5 % 14.5 % 11.0 % 10.2 % 9.7 % 9.4 % Additional paid-in capital 0.0 % 14.9 % 43.8 % 33.1 % 30.6 % 29.2 % 28.4 % Surplus capital 2.9 % 25.8 % 27.0 % 35.5 % 34.9 % 36.8 % 38.9 % Other equity components -1.4 % 6.6 % 2.0 % 9.3 % 10.4 % 10.0 % 9.6 % Book value 39.1 % 69.8 % 87.4 % 88.9 % 86.0 % 85.7 % 86.4 % Minority Interest 0.0 % 0.0 % 0.0 % 0.0 % 0.0 % 0.0 % 0.0 % Total equity 39.1 % 69.8 % 87.4 % 88.9 % 86.0 % 85.7 % 86.4 % Provision for pensions and similar obligations 0.0 % 0.0 % 0.0 % 0.0 % 0.0 % 0.0 % 0.0 % Provisions 11.3 % 7.5 % 0.6 % 0.2 % 0.2 % 0.2 % 0.2 % Financial liabilities 19.5 % 0.0 % 0.0 % 0.0 % 0.0 % 0.0 % 0.0 % Accounts payable 17.8 % 16.2 % 7.5 % 7.7 % 10.7 % 11.3 % 10.6 % Other liabilities 12.3 % 6.5 % 4.5 % 3.3 % 3.0 % 2.9 % 2.8 % Liabilities 60.8 % 30.2 % 12.6 % 11.2 % 14.0 % 14.4 % 13.6 % Total liabilities and shareholders' equity 100.0 % 100.0 % 100.0 % 100.0 % 100.0 % 100.0 % 100.0 %
Sources: Vtion (historical data), Warburg Research (forecasts)

Vtion Figures
Warburg Research 25
Statement of Cash Flows Vtion in EUR m 2007 2008 2009 2010 2011E 2012E 2013E
Net income 9.2 12.4 17.2 26.0 6.4 6.8 5.9 Depreciation of fixed assets 0.0 0.1 0.1 0.2 0.3 0.3 0.3 Amortisation of goodwill 0.0 0.0 0.0 0.0 0.0 0.0 0.0 Amortisation of intangible assets 0.1 0.1 0.1 0.2 0.3 0.3 0.3 Increase/decrease in long-term provisions 0.0 0.0 0.0 0.0 0.0 0.0 0.0 Other costs affecting income / expenses -0.2 0.5 0.3 -0.3 0.0 0.0 0.0 Cash Flow 9.0 13.0 17.7 26.2 7.0 7.4 6.5 Increase / decrease in inventory -0.7 -2.6 1.1 0.2 -0.3 -0.1 0.1 Increase / decrease in accounts receivable -7.5 3.8 -28.4 5.2 -4.3 -1.5 1.5 Increase / decrease in accounts payable 4.2 3.4 0.0 0.0 5.7 1.7 -0.7 Increase / decrease in other working capital positions 2.9 -5.2 0.0 -0.9 0.0 0.0 0.0 Increase / decrease in working capital -1.1 -0.6 -27.4 4.4 1.1 0.1 0.9 Cash flow from operating activities 7.9 12.4 -9.6 30.6 8.1 7.5 7.4 CAPEX 0.0 0.0 -1.0 -0.8 -0.9 -1.0 -1.0 Payments for acquisitions -0.7 -0.5 0.0 0.0 0.0 0.0 0.0 Financial investments 0.0 0.0 0.0 0.0 0.0 0.0 0.0 Income from asset disposals 0.0 0.0 0.0 0.0 0.0 0.0 0.0 Cash flow from investing activities -0.7 -0.5 -1.0 -0.8 -0.9 -1.0 -1.0 Change in financial liabilities 3.4 -5.2 0.0 0.0 0.0 0.0 0.0 Dividends paid 0.0 0.0 0.0 0.0 -3.3 -0.8 -0.8 Purchase of own shares 0.0 0.0 0.0 0.0 -2.7 0.0 0.0 Capital measures 0.0 9.1 43.9 0.0 0.0 0.0 0.0 Others 0.1 -0.3 0.0 0.0 0.0 0.0 0.0 Cash flow from financing activities 3.5 3.6 43.9 0.0 -6.0 -0.8 -0.8 Change in liquid funds 10.7 15.5 33.2 29.8 1.2 5.7 5.7 Effects of exchange rate changes on cash 0.0 2.7 -2.1 7.7 0.0 0.0 0.0 Liquid assets at end of period 12.2 30.3 61.5 99.0 100 106 112
Sources: Vtion (historical data), Warburg Research (forecasts)

Vtion Figures
Warburg Research 26
Financial Ratios Vtion 2007 2008 2009 2010 2011E 2012E 2013E
Operational Efficiency Total Operating Costs / Sales 8.4 % 8.9 % 5.4 % 7.9 % 7.9 % 7.8 % 8.2 % Sales per Employee 150,254 174,116 433,583 546,565 318,182 330,579 318,182 EBITDA per Employee 48,358 56,711 122,782 159,425 35,159 36,364 32,136 EBIT-margin 31.9 % 32.2 % 28.0 % 28.7 % 10.3 % 10.2 % 9.3 % EBITDA / Operating Assets 118.4 % 419.3 % 62.1 % 113.1 % 33.5 % 34.5 % 31.4 % ROA 1197.3 % 995.4 % 852.6 % 858.7 % 223.0 % 209.1 % 162.9 % Efficiency of Capital Employment Plant Turnover 161 79.5 107 81.4 50.0 46.5 40.3 Operating Assets Turnover 3.7 12.9 2.2 3.9 3.0 3.1 3.1 Capital Employed Turnover 1.9 1.1 0.7 0.8 0.6 0.6 0.5 Return on Capital ROCE 86.9 % 49.2 % 28.8 % 25.9 % 6.0 % 5.9 % 5.0 % EBITDA / Avg. Capital Employed 87.8 % 49.9 % 29.1 % 26.3 % 6.4 % 6.4 % 5.4 % ROE 88.1 % 34.8 % 17.2 % 17.0 % 4.8 % 4.8 % 4.0 % Net Profit / Avg. Equity 127.9 % 53.9 % 25.2 % 19.5 % 4.9 % 4.9 % 4.1 % Recurring Net Profit / Avg. Equity 127.9 % 53.9 % 25.2 % 19.5 % 4.9 % 4.9 % 4.1 % ROIC 49.2 % 30.5 % 16.9 % 16.9 % 4.7 % 4.8 % 4.0 % Solvency Net Debt -7.0 -30.3 -61.5 -99.0 -100 -106 -112 Net Gearing -67.7 % -85.2 % -64.0 % -76.5 % -74.0 % -74.9 % -76.2 % Book Value of Equity / Book Value of Debt 200.7 % n.a. n.a. n.a. n.a. n.a. n.a. Current ratio 2.0 4.3 8.2 9.0 7.1 6.9 7.3 Acid Test Ratio 1.5 2.9 7.5 8.6 6.8 6.7 7.0 EBITDA / Interest Paid 29.9 26.5 92.1 7.6 3.4 n.a. n.a. Interest Cover 97.3 60.3 591.4 9.1 15.9 n.a. n.a. Cash Flow Free Cash Flow 7.9 12.4 -10.6 29.8 7.2 6.5 6.4 Free Cash Flow / Sales 27.3 % 31.6 % -15.7 % 29.3 % 9.4 % 8.2 % 8.3 % Adj. Free Cash Flow 8.3 11.8 18.2 28.7 7.0 7.3 6.3 Adj. Free Cash Flow / Sales 27.7 % 28.8 % 23.1 % 20.4 % 4.6 % 6.8 % 5.9 % Free Cash Flow / Net Profit 86.5 % 100.0 % -64.2 % 135.3 % 112.1 % 96.2 % 108.7 % Interest Received / Avg. Cash 3.1 % 1.3 % 0.4 % 0.9 % 2.0 % 0.5 % 0.5 % Interest Paid / Avg. Debt 9.0 % 18.6 % n.a. n.a. n.a. n.a. n.a. Dividend Payout Ratio 0.0 % 0.0 % 0.0 % 15.3 % 14.6 % 13.9 % 15.9 % Fund Management Investment ratio 0.0 % 0.0 % 1.5 % 0.8 % 1.2 % 1.3 % 1.3 % Maint. Capex / Sales 3.4 % 2.6 % 1.5 % 1.0 % 1.9 % 1.9 % 1.9 % Capex / Dep 0.0 % 0.0 % 431.0 % 196.0 % 155.8 % 156.3 % 162.3 % Avg. Working Capital / Sales 20.2 % 15.0 % 26.3 % 28.3 % 33.0 % 31.0 % 31.6 % Trade Creditors / Trade Debtors 214.0 % 77.0 % 423.0 % 291.6 % 218.3 % 206.5 % 206.1 % Inventory turnover (days) 29.0 45.5 20.3 13.0 18.3 18.3 18.3 Receivables collection period (DSOs) 128 59.3 188 117 175 175 175 Payables collection period (days) 59.6 77.1 44.4 40.1 80.0 85.0 85.0 Cash conversion cycle (days) 97.0 23.8 163 89.7 113 108 108 Valuation Dividend Yield n.a. n.a. n.a. 5.8 % 1.7 % 1.7 % 1.7 % P/B 5.5 1.6 0.6 0.4 0.4 0.4 0.4 EV/sales n.m. n.m. n.m. n.m. n.m. n.m. n.m. EV/EBITDA n.m. n.m. n.m. n.m. n.m. n.m. n.m. EV/EBIT n.m. n.m. n.m. n.m. n.m. n.m. n.m. EV/FCF n.m. n.m. n.m. n.m. n.m. n.m. n.m. P/E 4.5 3.2 2.8 2.6 8.9 8.4 9.6 P/CF 6.3 4.4 3.2 2.2 8.1 7.7 8.7 Adj. Free Cash Flow Yield n.a. n.a. n.a. n.a. n.a. n.a. n.a.
Sources: Vtion (historical data), Warburg Research (forecasts)

Vtion Figures
Warburg Research 27
Free Cash Flow Yield - VtionFigures in EUR m 2007 2008 2009 2010 2011e 2012e 2013e
Net Income 9.2 12.4 16.6 22.0 6.4 6.8 5.9+ Depreciation + Amortisation 0.1 0.2 0.2 0.4 0.6 0.6 0.6- Net Interest Income -0.1 -0.2 0.0 -3.2 -0.5 0.5 0.5+ Taxes 0.0 0.0 2.3 4.0 1.0 1.9 1.8- Maintenance Capex 1.0 1.0 1.0 1.0 1.5 1.5 1.5+ Others 0.0 0.0 0.0 0.0 0.0 0.0 0.0
= Adjusted Free Cash Flow 8.3 11.8 18.2 28.7 7.0 7.3 6.3
Adjusted Free Cash Flow Yield -19.6% -27.7% -42.8% -67.5% -16.1% -14.8% -11.4%Hurdle rate 10.0% 10.0% 10.0% 10.0% 10.0% 10.0% 10.0%
= Enterprise Value -42.4 -42.4 -42.4 -42.4 -43.7 -49.3 -55.0
= Fair Enterprise Value 83.3 117.6 181.5 286.5 70.1 73.0 62.8
- Net Debt (Cash) -99.0 -99.0 -99.0 -99.0 -100.2 -105.9 -111.5- Pension Liabilities 0.0 0.0 0.0 0.0 0.0 0.0 0.0- Others 0.0 0.0 0.0 0.0 0.0 0.0 0.0
= Fair Market Capitalisation 182.3 216.6 280.5 385.5 170.3 178.9 174.3
No. of shares (m) 15.7 15.7 15.7 15.7 15.7 15.7 15.7
= Fair value per share (EUR) 11.61 13.79 17.87 24.55 10.84 11.39 11.10
premium (-) / discount (+) in % 222.5% 283.2% 396.3% 582.0% 201.2% 216.5% 208.4%
Sensitivity Fair value per Share (EUR)
13.0% 10.39 12.07 15.20 20.34 9.81 10.32 10.1812.0% 10.73 12.55 15.94 21.51 10.10 10.62 10.4411.0% 11.13 13.11 16.82 22.89 10.44 10.97 10.7410.0% 11.61 13.79 17.87 24.55 10.84 11.39 11.109.0% 12.20 14.63 19.15 26.58 11.34 11.91 11.558.0% 12.94 15.67 20.76 29.12 11.96 12.55 12.107.0% 13.89 17.00 22.82 32.38 12.76 13.38 12.82
Sources: Vtion (historical data), Warburg Research (estimates)
Hurdle rate

Vtion Figures
Warburg Research 28
DCF Model - VtionFigures in EUR m 2011e 2012e 2013e 2014e 2015e 2016e 2017e 2018e 2019e 2020e 2021e 2022e 2023e 2024e
Sales 77.0 80.0 77.0 75.5 74.0 72.5 71.7 71.7 71.7 71.7 71.7 71.7 71.7 71.7Change -24.3% 3.9% -3.8% -2.0% -2.0% -2.0% -1.0% 0.0% 0.0% 0.0% 0.0% 0.0% 0.0% 0.0%
EBIT 7.9 8.2 7.2 5.3 4.8 4.0 3.9 3.6 2.9 2.9 2.2 2.2 2.2 2.2EBIT-Margin 10.3% 10.2% 9.3% 7.0% 6.5% 5.5% 5.5% 5.0% 4.0% 4.0% 3.0% 3.0% 3.0% 3.0%
Tax rate 13.5% 21.7% 22.8% 25.0% 25.0% 25.0% 25.0% 25.0% 25.0% 25.0% 25.0% 25.0% 25.0% 25.0%
NOPAT 6.9 6.4 5.5 4.0 3.6 3.0 3.0 2.7 2.2 2.2 1.6 1.6 1.6 1.6
Depreciation 0.6 0.6 0.6 0.8 0.7 0.7 1.1 1.1 1.1 1.1 1.1 1.1 1.1 1.1in % of Sales 0.8% 0.8% 0.8% 1.0% 1.0% 1.0% 1.5% 1.5% 1.5% 1.5% 1.5% 1.5% 1.5% 1.5%
Change in Liquidity from- Working Capital 1.1 0.1 0.9 -0.3 0.5 0.5 0.2 -1.4 0.0 -0.7 0.0 0.0 0.0 0.0- Capex -0.9 -1.0 -1.0 -1.0 -1.1 -1.1 -1.1 -1.1 -1.1 -1.1 -1.1 -1.1 -1.1 -1.1Capex in % of Sales 1.2% 1.3% 1.3% 1.4% 1.5% 1.5% 1.5% 1.5% 1.5% 1.5% 1.5% 1.5% 1.5% 1.5%
Other 0.0 0.0 0.0 0.0 0.0 0.0 0.0 0.0 0.0 0.0 0.0 0.0 0.0 0.0
Free Cash Flow 7.6 6.1 6.0 3.4 3.7 3.1 3.2 1.3 2.2 1.4 1.6 1.6 1.6 1.6(WACC-Model)
Model parameter Valuation (mln)
Debt ratio 0.00% Beta 3.00 Present values 2024e 25.7Costs of Debt n.a. WACC 18.50% Terminal Value 1.0Market return 9.00% Liabilities 0.0Risk free rate 4.25% Terminal Growth 0.00% Liquidity 99.0 No. of shares (mln) 15.70
Equity Value 125.7 Value per share (EUR) 8.00
Sensitivity Value per Share (EUR)
Terminal Growth Delta EBIT marginWACC -0.75% -0.50% -0.25% 0.00% 0.25% 0.50% 0.75% WACC -1.5 pp -1.0 pp -0.5 pp 0.0 +0.5 pp +1.0 pp +1.5 pp
19.50% 7.96 7.96 7.96 7.96 7.96 7.96 7.97 19.50% 7.62 7.74 7.85 7.96 8.08 8.19 8.3019.00% 7.98 7.98 7.98 7.98 7.98 7.99 7.99 19.00% 7.64 7.75 7.87 7.98 8.10 8.22 8.3318.75% 7.99 7.99 7.99 7.99 8.00 8.00 8.00 18.75% 7.64 7.76 7.88 7.99 8.11 8.23 8.3518.50% 8.00 8.00 8.00 8.00 8.01 8.01 8.01 18.50% 7.65 7.77 7.89 8.00 8.12 8.24 8.3618.25% 8.01 8.01 8.01 8.02 8.02 8.02 8.02 18.25% 7.66 7.78 7.90 8.02 8.14 8.26 8.3718.00% 8.02 8.03 8.03 8.03 8.03 8.03 8.03 18.00% 7.66 7.78 7.91 8.03 8.15 8.27 8.3917.50% 8.05 8.05 8.05 8.05 8.05 8.05 8.05 17.50% 7.68 7.80 7.93 8.05 8.17 8.30 8.42
Source: Warburg Research

Vtion Figures
Warburg Research 29
CAPEX and Cash Flow - Vtion Balance Sheet Quality - Vtion
2007 2008 2009 2010 2011e 2012e 2013e 2007 2008 2009 2010 2011e 2012e 2013eCAPEX 0,0 0,0 1,0 0,8 0,9 1,0 1,0 Net Debt -7,0 -30,3 -61,5 -99,0 -100,2 -105,9 -111,5Maintenance CAPEX1,0 1,0 1,0 1,0 1,5 1,5 1,5 Book value of Equity10,4 35,6 96,0 129,4 135,3 141,4 146,4Cash Flow 7,9 12,4 -9,6 30,6 8,1 7,5 7,4 Net Gearing -67,7% -85,2% -64,0% -76,5% -74,0% -74,9% -76,2%
Sources: Vtion (historical data), Warburg Research (forecasts) Sources: Vtion (historical data), Warburg Research (forecasts)
§§§§ §§§§
Free Cash Flow Generation - Vtion Working Capital - Vtion
2007 2008 2009 2010 2011e 2012e 2013e 2007 2008 2009 2010 2011e 2012e 2013eFree Cash Flow 7,9 12,4 -10,6 29,8 7,2 6,5 6,4 Working Capital 7,7 4,0 31,6 26,0 24,9 24,8 23,9Free Cash Flow / Sales27,3% 31,6% -15,7% 29,3% 9,4% 8,2% 8,3% Working Capital / Sales26,7% 10,2% 46,7% 25,5% 32,3% 31,0% 31,0%
Sources: Vtion (historical data), Warburg Research (forecasts) Sources: Vtion (historical data), Warburg Research (forecasts)
§§§§ §§§§
Operating Leverage - Vtion ROCE Development - Vtion
2007 2008 2009 2010 2011e 2012e 2013e 2007 2008 2009 2010 2011e 2012e 2013eOperating Leverage1,4 1,0 0,7 1,1 3,0 0,7 3,3 ROCE 86,9% 49,2% 28,8% 25,9% 6,0% 5,9% 5,0%OPEX / Sales 8,4% 8,9% 5,4% 7,9% 7,9% 7,8% 8,2% EBIT-margin 31,9% 32,2% 28,0% 28,7% 10,3% 10,2% 9,3%
Capital Employed Turnover1,9 1,1 0,7 0,8 0,6 0,6 0,5
Sources: Vtion (historical data), Warburg Research (forecasts) Sources: Vtion (historical data), Warburg Research (forecasts)
§§§§ §§§§§§§§
Operating leverage limited Decrease of EBIT margin due to promblems in core business
Declining ROCE due to equity retention + lower EBIT margin
Low Capex ratio as there are no own production capacities Short balance sheet with high share of cash
Stable FCF in 2012e and 2013e Normalisation of working capital development in 2011e
-15,0
-10,0
-5,0
0,0
5,0
10,0
15,0
20,0
25,0
30,0
35,0
2007 2008 2009 2010 2011e 2012e 2013e
EUR m
CAPEX Maintenance CAPEX Cash Flow
-150,0
-100,0
-50,0
0,0
50,0
100,0
150,0
200,0
2007 2008 2009 2010 2011e 2012e 2013e
EUR m
-90,0%
-80,0%
-70,0%
-60,0%
-50,0%
-40,0%
-30,0%
-20,0%
-10,0%
0,0%
Net Debt Book value of Equity Net Gearing
0,0
5,0
10,0
15,0
20,0
25,0
30,0
35,0
2007 2008 2009 2010 2011e 2012e 2013e
EUR m
0,0%
5,0%
10,0%
15,0%
20,0%
25,0%
30,0%
35,0%
40,0%
45,0%
50,0%
Working Capital Working Capital / Sales
-15,0
-10,0
-5,0
0,0
5,0
10,0
15,0
20,0
25,0
30,0
35,0
2007 2008 2009 2010 2011e 2012e 2013e
EUR m
-20,0%
-10,0%
0,0%
10,0%
20,0%
30,0%
40,0%
Free Cash Flow Free Cash Flow / Sales
0,0%
10,0%
20,0%
30,0%
40,0%
50,0%
60,0%
70,0%
80,0%
90,0%
100,0%
2007 2008 2009 2010 2011e 2012e 2013e
0,0
0,2
0,4
0,6
0,8
1,0
1,2
1,4
1,6
1,8
2,0
ROCE EBIT-margin Capital Employed Turnover
0,0
0,5
1,0
1,5
2,0
2,5
3,0
3,5
2007 2008 2009 2010 2011e 2012e 2013e
0,0%
1,0%
2,0%
3,0%
4,0%
5,0%
6,0%
7,0%
8,0%
9,0%
10,0%
Operating Leverage OPEX / Sales

Vtion Disclaimer
Warburg Research 30
Legal Disclaimer This research report was prepared by the Warburg Research GmbH, a subsidiary of the M.M.Warburg & CO KGaA. It contains selected information and does not purport to be complete. The report bases on publicly available information and data ("the Information") believed to be accurate and complete. Warburg Research GmbH neither does examine the Information to be accurate and complete, nor guarantees its accuracy and completeness. Possible errors or incompleteness of the Information do not constitute grounds for liability, neither with regard to indirect nor to direct or consequential damages. In particular, neither M.M.Warburg & CO KGaA nor the Warburg Research GmbH are liable for the statements, plans or other details contained in the Information concerning the examined companies, their associated companies, strategies, economic situations, market and competitive situations, regulatory environment, etc. Although due care has been taken in compiling this research report, it cannot be excluded that it is incomplete or contains errors. M.M.Warburg & CO KGaA and Warburg Research GmbH, their shareholders and employees are not liable for the accuracy and completeness of the statements, estimations and the conclusions derived from the Information contained in this document. Provided any research report is being transmitted in connection with an existing contractual relationship, i.e. financial advisory or similar services, the liability of M.M.Warburg & CO KGaA and Warburg Research GmbH shall be restricted to gross negligence and willful misconduct. Only in case of failure in essential tasks, M.M.Warburg & CO KGaA and Warburg Research GmbH are liable for normal negligence. In any case, the liability of M.M.Warburg & CO KGaA and Warburg Research GmbH is limited to typical, expectable damages and the liability for any indirect damages is excluded. This research report does not constitute an offer or a solicitation of an offer for the purchase or sale of any security. Partners, directors or employees of M.M.Warburg & CO KGaA or Warburg Research GmbH may serve on the board of directors of companies mentioned in a report. Opinions expressed in this report are subject to change without notice. All rights reserved.
Copyright Notice This work including all its parts is protected by copyright. Any use beyond the limits provided by copyright law without permission is prohibited and punishable. This applies, in particular, to reproductions, translations, microfilming, and storage and processing on electronic media of the entire content or parts thereof.
Disclosure according to Section 34b of the German Securities Trading Act and FinAnV Section 34 b of the German Securities Trading Act in combination with the FinAnV requires an enterprise preparing a securities analysis to point out possible conflicts of interest with respect to the company that is the subject of the analysis. In this connection, we point out that:
- M.M.Warburg & CO KGaA or Warburg Research GmbH is party to an agreement with this company relating to the production of research recommendations.
The valuation underlying the rating of the equity security analysed in this report is based on generally accepted and widely used methods of fundamental valuation, such as DCF model, Peer group comparison and – where applicable – a Sum-of-the-parts model. M.M.Warburg & CO KGaA and Warburg Research GmbH have set up effective organisational and administrative arrangements to prevent and avoid possible conflicts of interest and, where applicable, to disclose them. Valuations, ratings and target prices for the companies analysed by M.M.Warburg & CO KGaA and Warburg Research GmbH are subject to constant reviews and may therefore change, if any of the fundamental factors underlying these items do change. All share prices given in this equity analysis are closing prices, except where stated otherwise. Neither M.M.Warburg & CO KGaA’s analysts nor Warburg Research GmbH's analysts do receive any payments directly or indirectly from any affiliates’ investment banking activity. M.M.Warburg & CO KGaA and Warburg Research GmbH are under supervision of the BaFin – German Federal Financial Supervisory Authority.

Vtion Disclaimer
Warburg Research 31
Investment recommendation: expected direction of the share price development for equity security up to the given Target price in the opinion of the analyst who covers the issue. B Buy: The price of the analysed equity security is expected to rise over the next 12 months. H Hold: The price of the analysed equity security is expected to remain mostly flat over the next 12 months. S Sell: The price of the analysed equity security is expected to fall over the next 12 months. “-“ Rating suspended: The available information does not currently permit an evaluation of the company.
M.M.Warburg & CO KGaA and Warburg Research GmbH research universe by rating:
Rating Number of stocks % of Universe
Buy 122 68%
Hold 48 27%
Sell 7 4%
Rating suspended 3 2%
Total 180
M.M.Warburg & CO KGaA and Warburg Research GmbH research universe by rating, looking only at companies for which a disclosure according to section 34b German Securities Trading Act has to be made:
Rating Number of stocks % of Universe
Buy 99 69%
Hold 38 26%
Sell 4 3%
Rating suspended 3 2%
Total 144
The charts have markings if Warburg Research GmbH changed its rating in the last 12 months. Every marking represents the date and closing price on the day of the rating change.

Vtion Contact
Warburg Research 32
Warburg Research GmbH
Hermannstraße 9 | 20095 Hamburg | www.warburg-research.com
Tel.: +49 40 309537-0 | Fax: +49 40 309537-110 | [email protected]
Christian Bruns Head of Research
+49 40 309537-253 [email protected]
Henner Rüschmeier Head of Research
+49 40 309537-270 [email protected]
Christian Cohrs +49 40 309537-175 [email protected]
Thomas Rau
+49 40 309537-220 [email protected]
Felix Ellmann
+49 40 309537-120 [email protected]
Jochen Reichert
+49 40 309537-130 [email protected]
Jörg Philipp Frey
+49 40 309537-258 [email protected]
Christopher Rodler
+49 40 309537-290 [email protected]
Ulrich Huwald
+49 40 309537-255 [email protected]
Malte Schaumann
+49 40 309537-170 [email protected]
Thilo Kleibauer
+49 40 309537-257 [email protected]
Susanne Schwartze
+49 40 309537-155 [email protected]
Torsten Klingner
+49 40 309537-260 [email protected]
Oliver Schwarz
+49 40 309537-250 [email protected]
Eggert Kuls
+49 40 309537-256 [email protected]
Marc-René Tonn
+49 40 309537-259 [email protected]
Frank Laser
+49 40 309537-235 [email protected]
Björn Voss
+49 40 309537-254 [email protected]
Malte Räther
+49 40 309537-185 [email protected]
Andreas Wolf
+49 40 309537-140 [email protected]
Andreas Pläsier
+49 40 309537-246 [email protected]
Stephan Wulf
+49 40 309537-150 [email protected]
Björn Blunck Business Support
+49 40 309537-160 [email protected]
Markus Pähler Business Support
+49 40 309537-221 [email protected]
Daniel Bonn Business Support
+49 40 309537-205 [email protected]
Claudia Vedder Business Support
+49 40 309537-105 [email protected]
Annika Boysen Business Support
+49 40 309537-202 [email protected]
Katrin Wauker Business Support
+49 40 309537-200 [email protected]
M.M. Warburg & CO KGaA
Ferdinandstraße 75 | 20095 Hamburg | www.mmwarburg.com
Tel.: +49 40 3282-0 | Fax: +49 40 3618-1000 | [email protected]
Oliver Merckel Head of Sales Trading
+49 40 3282-2634 [email protected]
Holger Nass Head of Equity Sales
+49 40 3282-2669 [email protected]
Thekla Struve Sales Trading
+49 40 3282-2668 [email protected]
Christian Alisch Equity Sales
+49 40 3282-2667 [email protected]
Gudrun Bolsen Sales Trading
+49 40 3282-2679 [email protected]
Cynthia Chavanon Equity Sales
+49 40 3282-2630 [email protected]
Bastian Quast Sales Trading
+49 40 3282-2701 [email protected]
Robert Conredel Equity Sales
+49 40 3282-2633 [email protected]
Patrick Schepelmann Sales Trading
+49 40 3282-2700 [email protected]
Matthias Fritsch Equity Sales
+49 40 3282-2696 [email protected]
Jörg Treptow Sales Trading
+49 40 3282-2658 [email protected]
Michael Kriszun Equity Sales
+49 40 3282-2695 [email protected]
Marc Niemann Equity Sales
+49 40 3282-2660 [email protected]
Dirk Rosenfelder Equity Sales
+49 40 3282-2692 [email protected]
Andrea Carstensen Sales Assistance
+49 40 3282-2632 [email protected]
Marco Schumann Equity Sales
+49 40 3282-2665 [email protected]
Kerstin Tscherner Sales Assistance
+49 40 3282-2703 [email protected]
Julian Straube Equity Sales
+49 40 3282-2666 [email protected]
Katharina Bruns Roadshow / Marketing
+49 40 3282-2694 [email protected]
Philipp Stumpfegger Equity Sales
+49 40 3282-2635 [email protected]