wang et al, 2015. detection of honey adulteration with starch syrup by hplc
TRANSCRIPT
Food Chemistry 172 (2015) 669–674
Contents lists available at ScienceDirect
Food Chemistry
journal homepage: www.elsevier .com/locate / foodchem
Analytical Methods
Detection of honey adulteration with starch syrup by high performanceliquid chromatography
http://dx.doi.org/10.1016/j.foodchem.2014.09.0440308-8146/� 2014 Elsevier Ltd. All rights reserved.
⇑ Corresponding author. Tel.: +86 10 82479325; fax: +86 10 62348045.E-mail address: [email protected] (S. Wang).
Shaoqing Wang ⇑, Qilei Guo, Linlin Wang, Li Lin, Hailiang Shi, Hong Cao, Baosen CaoChina National Food Quality & Safety Supervision and Inspection Center, No. 17 Fengde East Road, Yongfeng Industrial Base, Haidian District, Beijing 100094, China
a r t i c l e i n f o
Article history:Received 26 April 2013Received in revised form 11 June 2014Accepted 10 September 2014Available online 17 September 2014
Keywords:HoneyStarch syrupHoney adulterationHigh fructose syrups (HFS)High performance liquid chromatogram(HPLC)
a b s t r a c t
According to saccharide profile comparison between starch syrups and pure honeys analysed throughhigh performance liquid chromatography (HPLC), a characteristic peak was found at 15.25 min retentiontime in HPLC chromatogram of syrup, but no peak was observed at the same retention time in chromato-gram of pure honeys. This characteristic peak for syrup was identified as an overlapping peak of oligosac-charides with more than 5 degree of polymerisation (DP) based on HPLC chromatogram comparisonbetween starch syrup and a series of standard mono-, di- and oligosaccharides of 3–7 DP. Additionallysyrup content correlated linearly with the height of the characteristic peak of syrup under different slopein two ranges 2.5–7.5% and 10–100%, respectively. Therefore, the characteristic peak at 15.25 min reten-tion time can serve as a syrup indicator in HPLC analysis of the adulterated honeys. This new HPLCmethod for honey adulteration detection was further applied in an authenticity inspection on more than100 commercial honeys. In addition to the improved accuracy of honey adulteration detection, the pro-posed HPLC method was simple, low cost and easy practice for honey product quality control by govern-ment department considering the popularity of HPLC device and technology.
� 2014 Elsevier Ltd. All rights reserved.
1. Introduction
With rapid growth in honey production, China’s honey has anincreasing share of the world honey trade (Wei, Huang, & Yang,2012). Due to its high cost and worldwide popularity, honey isalways the main target of food adulteration. This has attractedthe attention of many researchers on food authenticity control. Inorder to assure Chinese honey product quality, Chinese govern-ment has invested a lot of money to develop the new technologyfor honey adulteration detection in addition to the common testsfor honey product quality control. In the past several decades,researchers developed several methods to disclose the honey falsi-fication, such as water, sucrose and 5-hydroxylmethyl-2-furalde-hyde (HMF) content analysis and stable carbon isotope ratioanalysis (SCIRA) method (AOAC, 2005; White, 1978; White &Winters, 1989). Water content analysis was mainly used to controlhoney quality to eliminate some immature honey products fromthe market and sucrose content analysis was mainly used to mon-itor honey adulteration with commercial sucrose because authen-tic honey contains only about 5% sucrose (Guo, Zhu, Liu, & Zhuang,2010; Wang & Li, 2011). As the byproduct of sucrose acidification,
HMF concentration was monitored to control honey adulterationwith reducing sugar syrup produced by sucrose acidification.Recently, this method was doubted because HMF concentrationincreases spontaneously when honey is stored in a warm environ-ment (Ajlouni & Sujirapinyokul, 2010). Based on SCIRA method, theaddition of high fructose corn syrup (HFCS) in honey would bedetected when the adulteration is more than 7% (White et al.,1998; Simsek, Bilsel, & Goren, 2012). However, it is difficult usingthis method to disclose the honey adulteration with other highfructose syrup (HFS) from C3 plant (C3 HFS), such as rice, beetand cassava etc, because the difference of d13C‰ between C3 HFSand honey is too small to be used as a standard to prove the adul-teration in honey (Krueger & Reesman, 1982). Recently, moreresearches have been focused on the carbohydrate profile of honeyagain, which is usually applied to control the botanical and geo-graphical origin of honey (Anklam, 1998; Consonni, Cagliani, &Cogliati, 2013; Cotte, Casabianca, Chardon, Lheritier, & Grenier-Loustalot, 2004).
It was well know that honey carbohydrate mainly includes acomplex mixture of 70% monosaccharides (glucose and fructose),10% disaccharides, and small amount of trisaccharides and tetrasac-charides. No oligosaccharides of more than 5 degree of polymerisa-tion (DP) was found in honey. But a large amount of these higholigosaccharides was present in starch syrups as the intermediate
min0 10 20 30 40
nRIU
0
50000
100000
150000
200000
250000
300000
Retention time
Aut
o si
gnal
of R
ID
min14.5 15 15.5 16 16.5
nRIU
5000
10000
15000
20000
14
S2H15
Indicator peak of Syrup
0
H15S2
Insetfigure
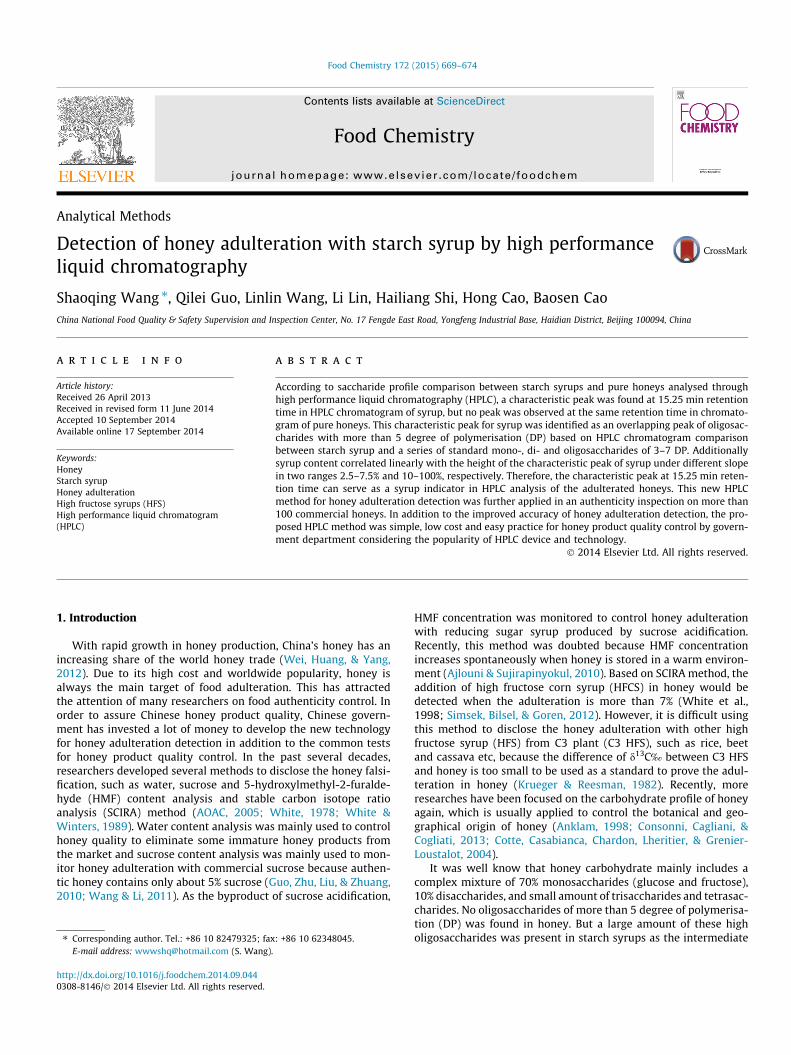
Fig. 1. HPLC chromatogram comparison between an authentic chaste honeysample, H15 and a rice starch HFS sample, S2.
670 S. Wang et al. / Food Chemistry 172 (2015) 669–674
product of syrup producing process, enzymolysis of starch (Low,1998; White, 1978). Therefore these high oligosaccharides may betaken as an indicator of starch syrups in honey adulteration detec-tion (Morales, Corzo, & Sanz, 2008).
A fingerprint profile of honey oligosaccharides can be obtainedthrough high performance anion-exchange chromatography-pulsed amperometric detection (HPAEC-PAD) system (Moraleset al., 2008; Ouchemoukh, Schweitzer, Bachir Bey, Djoudad-Kadji,& Louaileche, 2010), gas chromatography (GC) analysis (Ruiz-Matute, Brokl, Soria, & Martínez-Castro, 2010) or Raman spectrum(Özbalci, Boyaci, Topcu, Kadılar, & Tamer, 2013). Before HPAEC-PAD analysis, the oligosaccharides in honey must be fractionatedby passing the sample through a gel permeation chromatography(GPC) column or being treated with activated charcoal. In analysis,a gradient elution solution was used with different concentrationof sodium hydroxide. GC–MS provides better resolution for honeyoligosaccharide analysis (disaccharides, trisaccharides and tetra-saccharides). But derivatization, which is an essential step in car-bohydrates analysis using GC–MS, may result in very complexchromatograms because of many carbohydrate isomers in finalreaction solution (Ruiz-Matute, Hernández-Hernández,Rodríguez-Sánchez, Sanz, & Martínez-Castro, 2011).
However, so much detail information of oligosaccharides is notnecessary for the detection of honey adulteration. In fact, if only acertain amount of the oligosaccharides were detected in honeys,these honey samples could be directly considered being adulter-ated with starch syrup. Therefore, taking the oligosaccharides peakat 15.25 min retention time as syrup indicator, a simple, low cost,environmental and precise method was found for the detection ofhoney adulteration with starch syrup through high performanceliquid chromatography (HPLC) equipped with common refractiveindex detector (RID). During the whole analysis process, no preli-minary treatment and no any organic solvent were needed.
2. Materials and methods
2.1. Materials
2.1.1. Chemical materials and standardsMilliQ water was used in the whole research work in lab;
Glucose, fructose, sucrose were obtained from Beijing chemicalindustry group Co. Ltd. (Beijing, China). Maltose, maltotriose,maltotetraose, maltopentaose, maltohexaose and maltoheptaosestandards were purchased from Tokyo Chemical Industry Co. Ltd.(Tokyo, Japan). All chemicals used in honey protein purificationwere also obtained from Beijing Chemical Ltd. (Beijing, China).
Table 1Geographic origin and nectar source of pure honey samples.
Sample No. Nectar source Geographic origin
H1-H14 Acacia Beijing Miyun, Hebei XingtaH15-H33 Chaste Beijing Miyun, Liaoning JinzH34-H41 Wildflower Beijing Miyun, Gansu GannH42-H44 Rape Gansu Gannan, Jiangsu WuH45-H49 Jujube Henan Luoyang, Liaoning JiH50-H52 Citrus Fujian Quanzhou, Hunan ChH53-H56 Longan Fujian Quanzhou, GuangdonH57-H61 Lychee Fujian Quanzhou, GuangdonH62-H63 Loquat Fujian Quanzhou, GuangxiH64-H65 Eucalypt Hainan Haikou, GuangdongH66-H68 Linden Heilongjiang Yichun/YabuliH69-H70 Osmanthus Fujian Quanzhou, Hunan ChH71-H72 Motherwort Hubei Wuhan, Liaoning JinzH73 Clover Hunan ChangdeH74 Winter Guangdong ConghuaH75 Buckwheat Inner Mongolia ChifengH76 Apple Liaoning Gaizhou
The experimental consumables used in d13C‰ analysis wereobtained from Elemental Microanalysis Ltd. (Okehampton, UK).
2.1.2. Honey and syrup samples collectionThe pure honey samples from different nectar sources were
provided by locate Bee farmer in various province of China. Detailinformation for these samples was summarised in Table 1. Thecommercial honey samples were purchased from the supermar-kets located in different provinces in China. The collected syrupsamples included high fructose syrup (HFS) of F55 type: S1, S3–S7 from corn starch, S2 from rice starch and S8 from cavassastarch; HFS of F42 type: S10–S13 from corn starch and S9 from ricestarch; oligoisomaltose syrup: S14–S16 from corn starch; oxyl-oli-gosaccharide syrup: S17 from corn stalk. All the collected syrupsamples were mainly provided by different producers located indifferent province in China (Sn was the denoted syrup samplenumber and F55 or F42 was the type of high fructose syrupsample).
2.2. Preparation of artificial fraud honey
The series of artificial fraud honey samples were prepared bymixing one authentic acacia honey, H9 with 2.5%, 5%, 7.5%, 10%,30%, 50%, 75% and 100% (w/w) of rice HFS, S2. The sum mass ofhoney and syrup was 1 g in one artificial fraud honey sample. Thenthe mixture was solved in 99 g pure water. All the mixed sample
i, Liaoning Jinzhou, Shandong Yantai/Linyi/Qingdao, Shanxi Changzhi/Yangquanhou, Shandong Linyi, Shanxi Niangziguan/Yangquan
an, Shandong Linyi, Shanxi Yangquanxi/Nantongnzhou, Shandong Taian/Yantaiangdeg Conghua, Guangxi Guiping, Hainan Haikoug Conghua, Guangxi Guiping, Hainan Haikou
GuipingConghua
, Jilin Tonghuaangdehou
S. Wang et al. / Food Chemistry 172 (2015) 669–674 671
solutions were stored overnight at room temperature to furtherhomogenise the components of the mixture before analysis.
2.3. HPLC analysis
For HPLC analysis, samples were prepared by dissolving 1.0 ghoney or syrup in 100 ml of MilliQ water and homogenised for10 min in an ultrasound water bath or overnight at room temper-ature. The sample solution was filtered through 0.45 lm mem-brane into auto sampler vials for HPLC analysis.
All HPLC analyses were accomplished with an Agilent 1200liquid chromatography system (Agilent Technologies Deutschland,Waldbronn, Germany), equipped with a vacuum degasser, a qua-ternary solvent delivery pump, a thermo-stated column compart-ment and a refractive index detector (RID). All HPLC analyseswere carried on a Carbomix Ca-NP5: 8% column (7.8 � 300 mm,5 lm) at 80 �C. Pure water was used as mobile phase in elution.The flow-rate was 0.3 ml/min. 30 ll of sample solution was
min0 10 20 30 40
nRIU
0
5000
10000
15000
20000
(a)
Aut
o si
gnal
of R
ID
Fig.2(b)
Aut
o si
gnal
of R
ID
(c)
min0 10 20 30 40
nRIU
0
5000
10000
15000
Fig.2(d)
Retention time
Aut
o si
gnal
of R
ID
(e)
min0 10 20 30 40
nRIU
0
10000
20000
30000Syrup indicator
peak
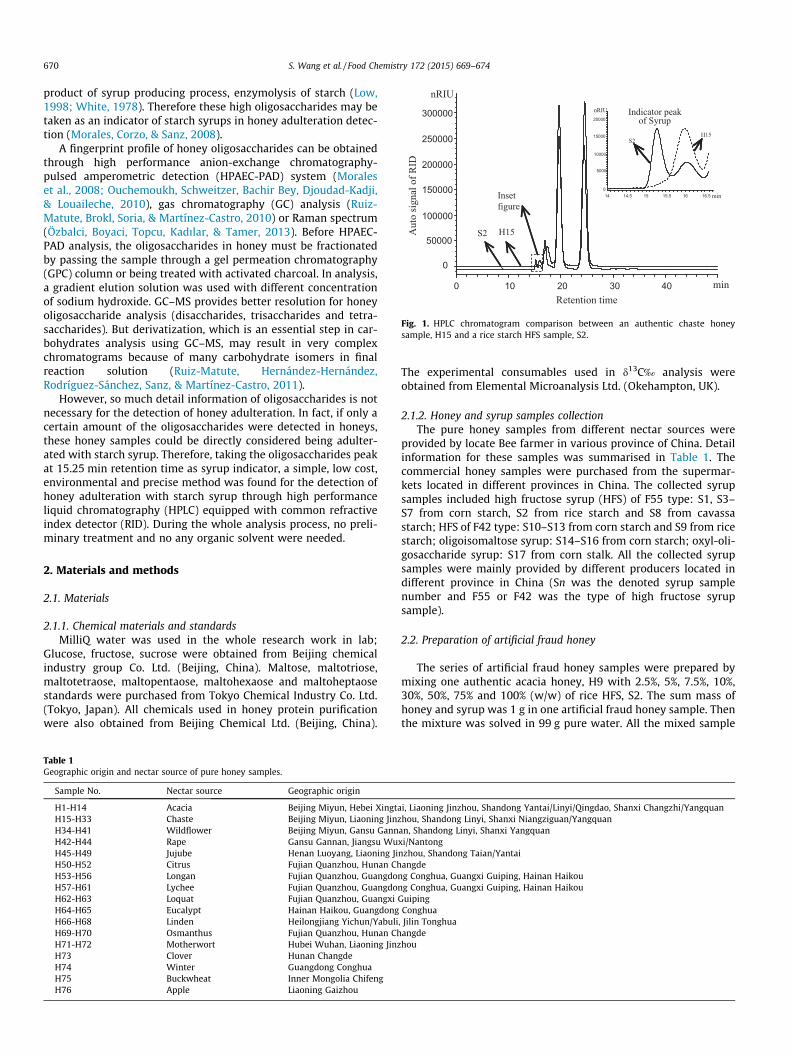
Fig. 2. HPLC chromatograms of the collected syrup samples in this work: (a, b) HFS of F55d) HFS of F42 type: S10–S13 from corn starch and S9 from rice starch; (e) oligoisomaltostalk.
injected for each HPLC analysis. For the analysis of authentic honeyand syrup samples, each sample was analysed twice in triplicate.For the determination of linearity of peak height, six replicate anal-yses at each content level of syrup were performed. Finally, for thecommercial samples inspection, all samples were analysed in trip-licate at certain concentration.
2.4. Commercial honey samples analysis using SCIRA method
All d13C‰ determination were performed on Continue-Flowingisotopic ratio mass spectrometer (CF-IRMS), 20-20H from Sercon(Cheshire, UK). The whole procedure for SCIRA analysis was thesame as that of AOAC998.12 method. In brief, 2 lL of honey orsyrup, or 2.8 mg of protein was sealed into 6 � 4 mm tin capsulesfor d13C‰ determination according to one standard olive oil(1.5 lL in one capsule, d13C‰std = �28.51‰ ± 0.16‰). After finish-ing the analysis of one batch of samples, d13C‰ value for each sam-ple was calculated and printed out automatically.
(b)
Syrup indicator peak
min14 14.5 15 15.5 16
nRIU
0
400
800
1200
(d)
Syrup indicator peak
min14 14.5 15 15.5 16
nRIU
0
500
1000
1500
Retention time
(f)
min0 10 20 30 40
nRIU
0
4000
8000
12000
16000
Syrup indicator peak
type: S1, S3–S7 from corn starch, S2 from rice starch and S8 from cavassa starch; (c,se syrup: S14–S16 from corn starch; (f) oxyl-oligosaccharide syrup: S17 from corn

No Syrup indicator
peak
min14 14.5 15 15.5 16 16.5
0
nRIU
4000
8000
12000
16000
Retention time
Aut
o si
gnal
of R
ID
(b)
Fig.3(b)
(a)
min0 10 20 30 40 50
nRIU
0
20000
40000
60000
80000
100000
120000
Retention time
Aut
o si
gnal
of R
ID
H49H67
H60H56
H4H3
H25H36
H43
Fig. 3. HPLC chromatograms of 12 pure honey samples from different nectar source and geographical origin in China, including H43, H3, H4, H36, H25, H56, H60, H67 andH49. Detail information about the 12 pure honey samples refer to Table 1.
min15 15.5 16 16.5 17 17.5 18
nRIU
10200
10400
10600
10800
11000
11200
Aut
o si
gnal
of R
ID
Retention time
(b)
min15 15.5 16 16.5 17 17.5
nRIU
0
500
1000
1500
2000
2500
3000
3500
Retention time
Aut
o si
gnal
of R
ID
(d)
3456789
Aut
o si
gnal
of R
ID
Retention time
(a)
Fig.4(b)
12
min0 10 20 30 40
nRIU
0
2000
4000
6000
8000
10000
Retention time
Aut
o si
gnal
of R
ID
(c)
Fig.4(d)
min10 20 30 400
nRIU
0
4000
8000
12000
16000
Fig. 4. HPLC chromatogram comparison between (a, b) a series of standard saccharides (1) fructose, (2) glucose, (3) sucrose, (4) D-(+)-maltose, (5) D-(+)-maltotriose, (6)maltotetraose, (7) maltopentaose, (8) maltohexaose, (9) maltoheptaose and (c, d) the rice starch HFS, S2.
672 S. Wang et al. / Food Chemistry 172 (2015) 669–674
3. Results and discussion
3.1. HPLC chromatogram comparison between honey and starch syrup
For the detection of food falsification in food quality control, thekey is to find a notable distinction between the adulterant andauthentic food. Furthermore the notable distinction must originatefrom the adulterant, but do not being contained in the authenticfood. Therefore, the HPLC chromatograms of one authentic honeyand one rice HFS were compared in Fig. 1 by overlaying signalsto see fine difference between them. Most of the two chromato-grams were essentially coincident except one small peak at
15.25 min retention time on the investigated HFS chromatogram.This small peak can be seen clearly in the enlarged inset figure.In contrast, no swelling slope was observed on the base line ofhoney chromatogram at the same retention time. Whether thissmall peak of the HFS chromatogram can be taken as a notable dis-tinction between honey and syrup must be validated through adetail inspection on a lot of authentic honey from various nectarsources or geographical origin and various kinds of syrup from dif-ferent producers. Fig. 2 showed HPLC chromatogram of HFS fromcorn, rice or cavassa starch (Fig. 2(a)–(d)), oligoisomaltose(Fig. 2(e)) and oxyl-oligosaccharide syrup (Fig. 2(f)) produced bydifferent producers in China. All the inspected HFS chromatograms

S. Wang et al. / Food Chemistry 172 (2015) 669–674 673
showed a small peak at 15.25 min retention time clearly. In thecase of oligoisomaltose and oxyl-oligosaccharide syrup, a very highpeak was also observed at the same retention time on HPLC chro-matogram. However, no small peak was observed at the sameretention time on the chromatogram of 12 pure honey samplesfrom different nectar sources and geographical origin (Fig. 3).Totally, 76 pure honey samples (Table 1) were checked throughHPLC in the present work (Data was not all shown here). Almostall the authentic honey samples showed a flat base line at15.25 min retention time, except 3 honey samples showed a negli-gible swelling slope at 15.25 min retention time on their HPLCchromatograms. Being compared to the peak of artificial fraudhoney sample of 2.5% syrup content (Fig. 5), the biggest swellingslope of these 3 honey samples was corresponding to about 1%(w/w) of syrup content, which is statistically negligible. That is tosay, the peak at 15.25 min retention time was a notable distinctionpoint between honey and syrup samples inspected in this workand it can be taken as a syrup indicator for honey adulterationdetection in the present new method.
3.2. HPLC chromatogram comparison between syrup and standardoligosaccharide of various DP
In order to indentify the material represented by the indicatingHPLC peak of starch syrup, an HPLC chromatogram comparisonwas performed between starch syrup and several standard oligo-saccharides of various DP. Usually, syrup was produced throughenzymatic conversion of starch, during which starch was firstlyconverted into polysaccharide segments of different DP. In the fol-lowing, these polysaccharides were hydrolysed into oligosaccha-rides and finally into monosaccharide. However, during thisenzymatic conversion process some intermediate oligosaccharides
HFS content (m%)
y = 148.96x + 1168.4R2 = 0.9952
0
500
1000
1500
2000
2500
0 2 4 6 8
Hei
ght o
f syr
up c
hara
cter
istic
pea
k(n
RIU
)
(c)
Fig.3(b)
Retention time
Aut
o si
gnal
of R
ID
(a)
min0 10 20 30 40
nRIU
0
50000
100000
150000
200000
250000
Fig. 5. (a, b) HPLC chromatogram of a series of artificial fraud honey samples with differe(c, d) linear regression between syrup indicator peak height and syrup with differenrespectively for the above fraud honey samples. Preparation of the series of artificial fra
of different DP may remained in the final syrup product (Reeve,1992), which may be detected out in the HPLC or GC–MS chro-matogram of syrup (Low, 1998). In Fig. 4, HPLC chromatogram ofa rice syrup, S2, was compared with that of a series of standard sac-charides. As expected, the monosaccharide (both glucose and fruc-tose) peaks of syrup S2 (Fig. 4(c)) appeared at the same retentiontime, respectively, as the correspond standard (Fig. 4(a)). In thecase of disaccharides (sucrose and maltose) (Fig. 4(b)), their peaksoverlapped into one peak at about 17.1 min retention time forsyrup S2 (Fig. 4(d)). For tri- and tetrasaccharide (Fig. 4(b)), theoverlapping peak was included in the peak at 16.1 min retentiontime for syrup S2 (Fig. 4(d)). Finally, the abutting peaks of malto-pentaose, maltohexaose and maltoheptaose were contained inthe peak at 15.25 min retention time for syrup S2, which may con-tain some other oligosaccharides of higher DP additionally(Fig. 4(d)). So far, no literatures reported that any maltopentaose,maltohexaose or maltoheptaose was found in the carbohydrateprofile of honey. Therefore, the indicator peak of syrup at15.25 min retention time should be corresponding to the oligosac-charides of higher DP than 4.
3.3. Characterisation of the present HPLC method for honeyadulteration detection
As discussed above, the adulterated honey samples with syrupcan be detected according to the presence of this characteristicpeak of syrup at 15.25 min retention time. Here, this method wascharacterised on linearity. A series fraud honey samples were pre-pared in laboratory by intermingling one authentic acacia honeyand one rice HFS sample in different mass proportions, 2.5–100%.HPLC chromatograms of these artificial honey samples were shownby overlaying signals in Fig. 5(a) and (b). Along with the increasing
y = 120.09x + 4277.9R2 = 0.9835
0
4000
8000
12000
16000
0 20 40 60 80 100 120
HFS content (m%)
(d)
Retention time
min14 14.5 15 15.5 16
nRIU
0
4000
8000
12000
16000
100%
75%
50%
30%
10% 7.5%5%2.5%
(b)
nt proportion of rice HFS content, 2.5%, 5%, 7.5%, 10%, 30%, 50%, 75% and 100% (w/w);t slope coefficient in two ranges of syrup content 2.5–7.5% and 10–100% (w/w),ud honey samples refer to the part of Section 2.
674 S. Wang et al. / Food Chemistry 172 (2015) 669–674
amount of syrup, the original flat baseline at 15.25 min retentiontime changed into a small swelling slope firstly, and then increasedinto a higher peak gradually (Fig. 5(b)). The height of the growingpeaks correlated linearly with the adulterated amount of rice HFS,S2 in two ranges 2.5–7.5% and 10–100% (w/w), respectively(Fig. 5(c) and (d)). According to Fig. 5(c), as low as 2.5% of HFS inthe adulterated honey samples could still be detected using thepresent HPLC method.
In principle, the linear regression equations in Fig. 5(c) and (d)can be used to calculate syrup content in fraud honey when theanalysis and operation conditions are the same. But, according toFig. 2, the inspected various syrup samples had different contentof oligosaccharides of higher DP. Thus, when the equations inFig. 5(c) and (d) was used to calculate the added amount of syrupin fraud honeys, a positive or negative deviation will be foundwhen the used syrup possesses a higher or lower peak at15.25 min retention time on HPLC chromatogram. In fact, once acertain amount of syrup was detected in honey sample, this honeycan be considered fraud no matter how much syrup was used inthe falsification.
3.4. Commercial honey samples inspection by the present HPLCmethod
To check the validity of the present HPLC method, an inspectionwas carried out on more than 100 commercial honey samples fromdifferent nectar sources and producers. All these honey sampleswere examined firstly by AOAC998.12 method. According to theresult of AOAC998.12 analysis, all the inspected samples can bedivided into two groups, the pure honey samples 1 > X‰ > �1and the adulterated honey samples X‰ > 1 or X‰ < �1(X‰ = d13CHoney‰ � d13CProtein‰). As expected, syrup was detectedin most of the adulterated honey samples, X‰ > 1 or X‰ < �1.Contrarily, in some ‘‘authentic’’ honey samples, 1 > X‰ > �1, a highproportion of syrup was detected by the proposed HPLC method.That was confirmed with another starch syrup detection method,thin-layer chromatography (TLC) method (AOAC, 1988), whichwas only valid when the starch syrup content was higher than10% (w/w). These misjudged fraud honeys may be adulterated withmixture of C4 and C3 syrups according to a certain ratio.
4. Conclusion
In the present work, an indicator peak of starch syrup on HPLCchromatograms was found valid for honey adulteration detectionwith a detectable syrup content near 2.5% (w/w), which is lowerthan that of both SCIRA method 7% (AOAC, 2005) and TLC method10% (AOAC, 1988). According to the height of this syrup indicatorpeak, syrup content in the adulterated honeys can be calculatedout approximately. Especially, the proposed HPLC method candetect both C4 and C3 starch syrup in honey. However, SCIRA
method was only valid for the detection of C4 starch syrup inhoney. In addition to the increased accuracy for honey adulterationdetection, the proposed new HPLC method was simple, low costand easy practice for honey product quality control by governmentdepartments considering the popularity of HPLC device andtechnology.
Acknowledgements
This work was supported by the research project 2010QK010funded by AQSIQ (General Administration of Quality Supervision,Inspection and Quarantine of the People’s Republic of China).
References
Ajlouni, S., & Sujirapinyokul, P. (2010). Hydroxymethylfurfuraldehyde and amylasecontents in Australian honey. Food Chemistry, 119, 1000–1005.
Anklam, E. (1998). A review of the analytical methods to determine thegeographical and botanical origin of honey. Food Chemistry, 63(4), 549–562.
AOAC (1988). High fructose starch syrup in honey thin-layer chromatographicmethod. Official methods of analysis (979.22), 71, 88.
AOAC (2005). C-4 plant sugars in honey. Internal standard stable carbon isotoperatio method. Official methods of analysis (998.12), 44, 33.
Consonni, R., Cagliani, L. R., & Cogliati, C. (2013). Geographical discrimination ofhoneys by saccharides analysis. Food Control, 32, 543–548.
Cotte, J. F., Casabianca, H., Chardon, S., Lheritier, J., & Grenier-Loustalot, M. F. (2004).Chromatographic analysis of sugars applied to the characterisation ofmonofloral honey. Analytical and Bioanalytical Chemistry, 380(4), 698–705.
Guo, W., Zhu, X., Liu, Y., & Zhuang, H. (2010). Sugar and water contents of honeywith dielectric property sensing. Journal of Food Engineering, 97, 275–281.
Krueger, W. H., & Reesman, R. H. (1982). Carbon isotope analyses in foodtechnology. Mass Spectrometry Reviews, 1, 205–236.
Low, N. H. (1998). Oligosaccharides analysis. In P. R. Ashurst & M. J. Dennis (Eds.),Analytical methods on food authentication (la ed., pp. 97–136). London: BlackieAcademic and Professional ed.
Morales, V., Corzo, N., & Sanz, M. L. (2008). HPAEC-PAD oligosaccharide analysis todetect adulterations of honey with sugar syrups. Food Chemistry, 107, 922–928.
Ouchemoukh, S., Schweitzer, P., Bachir Bey, M., Djoudad-Kadji, H., & Louaileche, H.(2010). HPLC sugar profiles of Algerian honeys. Food Chemistry, 121, 561–568.
Özbalci, B., Boyaci, _I. H., Topcu, A., Kadılar, C., & Tamer, U. (2013). Rapid analysis ofsugars in honey by processing Raman spectrum using chemometric methodsand artificial neural networks. Food Chemistry, 136, 1444–1452.
Reeve, A. (1992). Starch hydrolysis: Process and equipment. In F. W. Schenk & R. F.Hebeda (Eds.), Starch hydrolysis products (pp. 79–120). VCH Publishers Inc.
Ruiz-Matute, A. I., Brokl, M., Soria, A. C., & Martínez-Castro, I. (2010). Gaschromatographic–mass spectrometric characterization of tri- and tetrasaccharidesin honey. Food Chemistry, 120, 637–642.
Ruiz-Matute, A. I., Hernández-Hernández, O., Rodríguez-Sánchez, S., Sanz, M. L., &Martínez-Castro, I. (2011). Derivatization of carbohydrates for GC and GC–MSanalyses. Journal of Chromatography B, 879, 1226–1240.
Simsek, A., Bilsel, M., & Goren, A. C. (2012). 13C/12C pattern of honey from turkeyand determination of adulteration in commercially available honey samplesusing EA-IRMS. Food Chemistry, 130, 1115–1121.
Wang, J., & Li, Q. X. (2011). Chemical composition, characterization, anddifferentiation of honey botanical and geographical origins. Advances in Foodand Nutrition Research, 62, 89–137.
Wei, G., Huang, J., & Yang, J. (2012). Honey safety standards and its impacts onChina’s honey export. Journal of Integrative Agriculture, 11(4), 684–693.
White, J. W. Jr, (1978). Honey. Advances in Food Research, 24, 287–374.White, J. W., & Winters, K. (1989). Honey protein as internal standard for stable
carbon isotope ratio detection of adulteration of honey. Journal of the Associationof Official Agricultural Chemists, 72, 907–911.