wastewater reuse for irrigation - irc :: home · 2014-03-09 · wastewater reuse for irrigation in...
TRANSCRIPT

ISSN-0169-6246
Report no 70Wastewater reuse for irrigationin Cali Region, ColombiaCommunications of the Department of Water Management, Environmentaland Sanitary Engineering
February 1997 Meike van Ginneken MSc.
Cali
offtake
tertiarycanal flexitube s u g a r c a n e
^—\"A rjii nvwwíA
TUDelftTechnische Universiteit Delft
Faculty of Civil EngineeringMechanics & StructuresStructural Mechanics

TTI I n\ 1X4. Faculty of Civil Engineering
' ^ ^ ^ ^ ^ ' ' *• Department of Water Management,university of Technology Environmental and Sanitary Engineeering
Wastewater Reuse for the Irrigation ofSugarcane in Cali Region, Colombia
Communications Report no. 70
MeiKe van omnenen February 1997
LIBRARY IRCPO Box 93190, 2509 AD THE HAGUE
Tel.: +31 70 30 689 80Fax: +31 70 35 899 64
BARCODE: | l ( , S>mLO: T
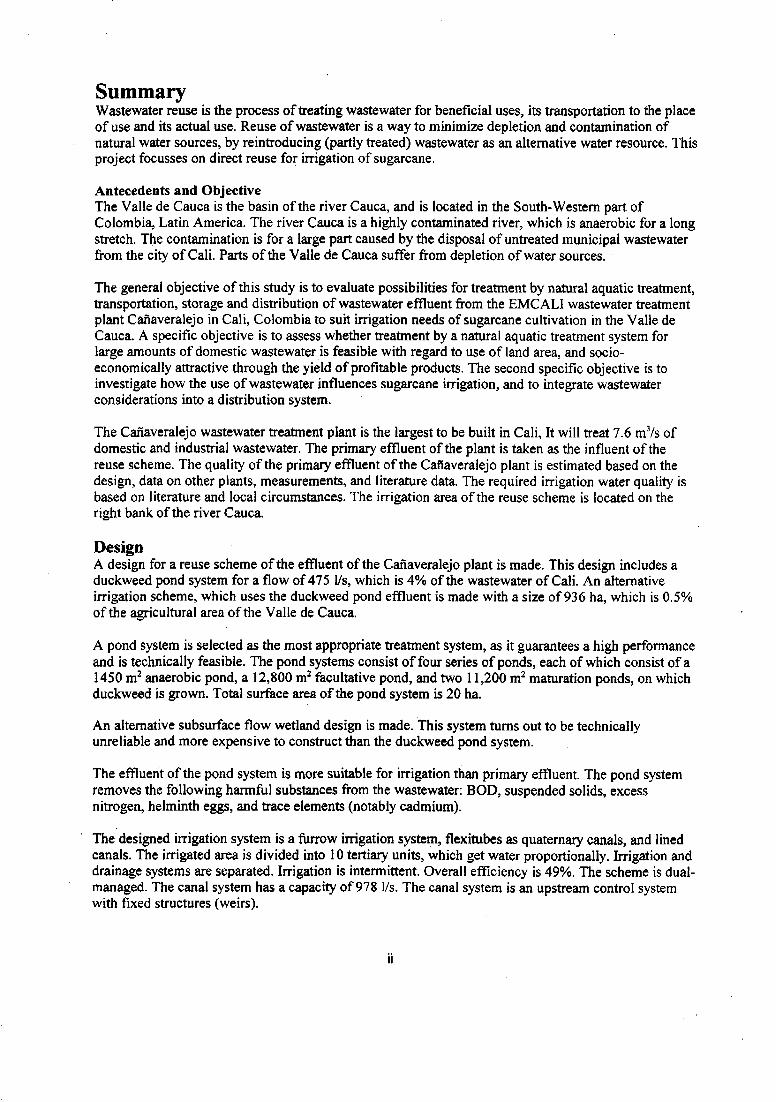
Publication of the Department of Water Management,Environmental and Sanitary EngineeringISSN-0169-6246, report no. 70
Faculty of Civil EngineeringDelft University of TechnologyP.O. box 50482600 GA Delft, The Netherlands
Copies to be ordered:Ms. E.G. Rothfusz, secretaryRoom 4.75, Phone 015-2781646, Fax 015-2785559

PrefaceThis report is a revision of my MSc thesis for the faculty of Civil Engineering, department of WaterManagement, Environmental and Sanitary Engineering of Delft University of Technology. My thesisproject took place from November 1995 to August 1996, including a five months field period in Cali,Colombia. The field period was carried out with assistance of CINARA, the Universidad del Valle andthe Convenio IHE-DUT-Univalle.
I like to thank the following people in Cali for their kind cooperation: Miguel Peña, Hernán Materon,Inés Restrepo, Henri Jimenez, Huub Gijzen, and Rob Lloyd. In Delft I am grateful to Prof.ir. R.Brouwer, prof.dr. M.Donze, prof.ir. J.H.J.M. van der Graaf and ir. P. Ankum for their help andguidance.
Meike van Ginneken.
February 1997.
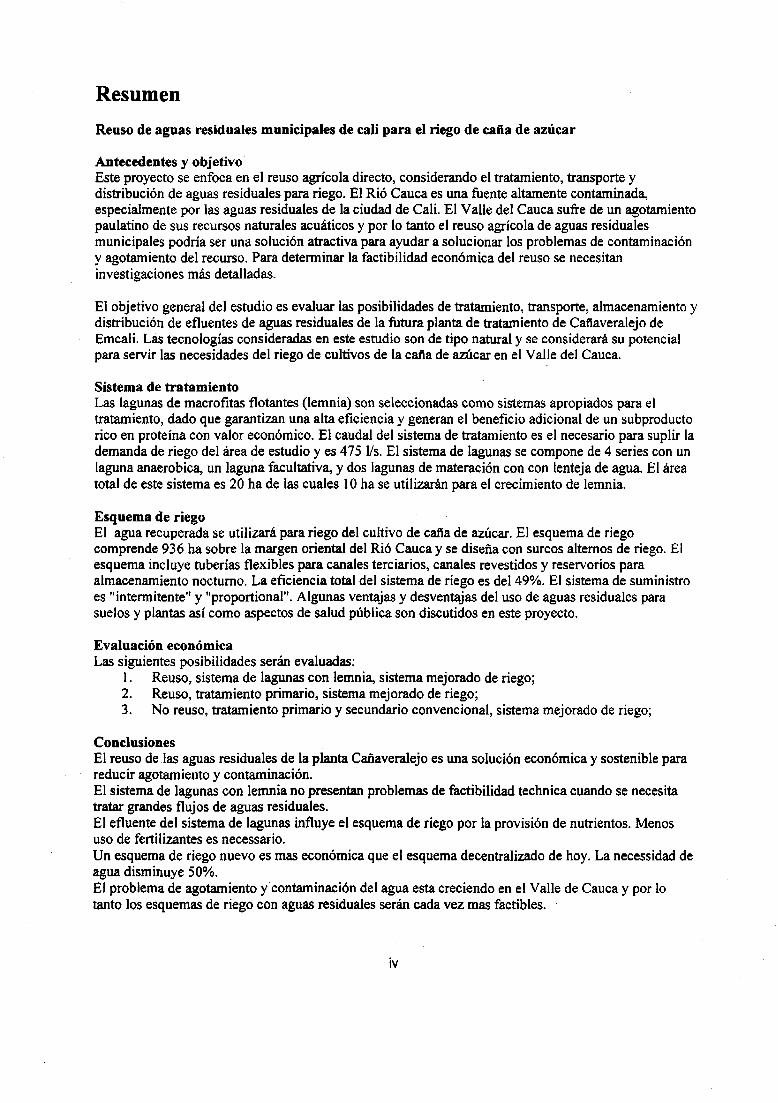
SummaryWastewater reuse is the process of treating wastewater for beneficial uses, its transportation to the placeof use and its actual use. Reuse of wastewater is a way to minimize depletion and contamination ofnatural water sources, by reintroducing (partly treated) wastewater as an alternative water resource. Thisproject focusses on direct reuse for irrigation of sugarcane.
Antecedents and ObjectiveThe Valle de Cauca is the basin of the river Cauca, and is located in the South-Western part ofColombia, Latin America. The river Cauca is a highly contaminated river, which is anaerobic for a longstretch. The contamination is for a large part caused by the disposal of untreated municipal wastewaterfrom the city of Cali. Parts of the Valle de Cauca suffer from depletion of water sources.
The general objective of this study is to evaluate possibilities for treatment by natural aquatic treatment,transportation, storage and distribution of wastewater effluent from the EMC ALI wastewater treatmentplant Cañaveralejo in Cali, Colombia to suit irrigation needs of sugarcane cultivation in the Valle deCauca. A specific objective is to assess whether treatment by a natural aquatic treatment system forlarge amounts of domestic wastewater is feasible with regard to use of land area, and socio-economically attractive through the yield of profitable products. The second specific objective is toinvestigate how the use of wastewater influences sugarcane irrigation, and to integrate wastewaterconsiderations into a distribution system.
The Cañaveralejo wastewater treatment plant is the largest to be built in Cali, It will treat 7.6 mVs ofdomestic and industrial wastewater. The primary effluent of the plant is taken as the influent of thereuse scheme. The quality of the primary effluent of the Cañaveralejo plant is estimated based on thedesign, data on other plants, measurements, and literature data. The required irrigation water quality isbased on literature and local circumstances. The irrigation area of the reuse scheme is located on theright bank of the river Cauca.
DesignA design for a reuse scheme of the effluent of the Cañaveralejo plant is made. This design includes aduckweed pond system for a flow of 475 1/s, which is 4% of the wastewater of Cali. An alternativeirrigation scheme, which uses the duckweed pond effluent is made with a size of 936 ha, which is 0.5%of the agricultural area of the Valle de Cauca.
A pond system is selected as the most appropriate treatment system, as it guarantees a high performanceand is technically feasible. The pond systems consist of four series of ponds, each of which consist of a1450 m2 anaerobic pond, a 12,800 m2 facultative pond, and two 11,200 m2 maturation ponds, on whichduckweed is grown. Total surface area of the pond system is 20 ha.
An alternative subsurface flow wetland design is made. This system turns out to be technicallyunreliable and more expensive to construct than the duckweed pond system.
The effluent of the pond system is more suitable for irrigation than primary effluent. The pond systemremoves the following harmful substances from the wastewater: BOD, suspended solids, excessnitrogen, helminth eggs, and trace elements (notably cadmium).
The designed irrigation system is a furrow irrigation system, flexitubes as quaternary canals, and linedcanals. The irrigated area is divided into 10 tertiary units, which get water proportionally. Irrigation anddrainage systems are separated. Irrigation is intermittent. Overall efficiency is 49%. The scheme is dual-managed. The canal system has a capacity of 978 1/s. The canal system is an upstream control systemwith fixed structures (weirs).

Water BalanceA surface water balance and a groundwater balance of the complete Valle de Cauca are made. Thesebalances show that there is no permanent overexploitation of natural water resources. Groundwaterresources are temporarily overexploited in dry periods, especially in areas where farmers usegroundwater for irrigation.
Economic evaluationThe evaluation includes a financial cost-benefit analysis and a qualitative checklist. This checklistjudges impacts which are hard to express in financial terms: effectivity, technical feasibility,institutional and regulatory aspects, social impacts, and environmental impacts. An evaluation is madeof three alternatives:
1. Reuse with pond system effluent;2. Reuse with primary effluent;3. No reuse; activated sludge treatment, and present irrigation scheme;
The evaluation shows that alternative 1 and 3 are feasible alternatives. Alternative 1 has a morefavorable score than alternative 3. Alternative 2 is inexpensive, but ineffective.
ConclusionsReuse of part of the Cañaveralejo effluent for the irrigation of sugarcane of the area between the RioCauca and Rio Fraile is an economically feasible and sustainable alternative to decrease effluentdisposal problems of Cali. The Cañaveralejo reuse scheme is cheaper to construct, operate and maintainthan the combination of an activated sludge treatment and the old irrigation scheme. The quality of theprimary effluent of Cañaveralejo plant can serve as a reliable source for irrigation after treatment with aduckweed pond system, without putting at risk public health, crops or soils.
Duckweed pond systems are technical feasible for large quantities of domestic wastewater. The use ofsubsurface flow wetlands for the treatment of large urban wastewater flows is not yet a feasible option,as knowledge about and experience with functioning, design, operation and maintenance under tropicalcircumstances are limited. The wetland concept is promising for Colombia, where temperature isconstant and high yearround.
The effluent of a duckweed pond system influences sugarcane irrigation by providing nutrients. Thewastewater provides part of the nutrient demand of the sugarcane, so less fertilizer has to be applied.Maintenance of canals and structures increases due to weeds.
An improved centralized irrigation scheme is more economical than unimproved individual farmirrigation schemes, with or without wastewater reuse. An improved furrow irrigation system withflexitubes as quaternary canals, larger furrow spacing, and lined canals can halve water demand.
The need for reuse of wastewater in the Valle de Cauca will increase in the coming years.Contamination will be increased by population growth and the rise of the standard of living. Depletionof groundwater and surface water is a growing problem, as water demand for agriculture, human useand industry increases. Reuse of municipal wastewater is, however, only a very small factor in solvingdepletion problems: only 6% of the water use in the Valle de Cauca is used for domestic uses. Reuseprojects are more attractive in areas where presently groundwater is used for irrigation. Pumping costsare higher and depletion a serious environmental problem.
ResumenReuso de aguas residuales municipales de cali para el riego de caña de azúcar
Antecedentes y objetivoEste proyecto se enfoca en el reuso agrícola directo, considerando el tratamiento, transporte ydistribución de aguas residuales para riego. El Rió Cauca es una fuente altamente contaminada,especialmente por las aguas residuales de la ciudad de Cali. El Valle del Cauca sufre de un agotamientopaulatino de sus recursos naturales acuáticos y por lo tanto el reuso agrícola de aguas residualesmunicipales podría ser una solución atractiva para ayudar a solucionar los problemas de contaminacióny agotamiento del recurso. Para determinar la factibilidad económica del reuso se necesitaninvestigaciones más detalladas.
El objetivo general del estudio es evaluar las posibilidades de tratamiento, transporte, almacenamiento ydistribución de efluentes de aguas residuales de la futura planta de tratamiento de Cañaveralejo deEmcali. Las tecnologías consideradas en este estudio son de tipo natural y se considerará su potencialpara servir las necesidades del riego de cultivos de la caña de azúcar en el Valle del Cauca.
Sistema de tratamientoLas lagunas de macrofitas flotantes (lemnia) son seleccionadas como sistemas apropiados para eltratamiento, dado que garantizan una alta eficiencia y generan el beneficio adicional de un subproductorico en proteína con valor económico. El caudal del sistema de tratamiento es el necesario para suplir lademanda de riego del área de estudio y es 475 1/s. El sistema de lagunas se compone de 4 series con unlaguna anaerobica. un laguna facultativa, y dos lagunas de materación con con lenteja de agua. El áreatotal de este sistema es 20 ha de las cuales 10 ha se utilizarán para el crecimiento de lemnia.
Esquema de riegoEl agua recuperada se utilizará para riego del cultivo de caña de azúcar. El esquema de riegocomprende 936 ha sobre la margen oriental del Rió Cauca y se diseña con surcos alternos de riego. Elesquema incluye tuberías flexibles para canales terciarios, canales revestidos y reservónos paraalmacenamiento nocturno. La eficiencia total del sistema de riego es del 49%. El sistema de suministroes "intermitente" y "proportional". Algunas ventajas y desventajas del uso de aguas residuales parasuelos y plantas así como aspectos de salud pública son discutidos en este proyecto.
Evaluación económicaLas siguientes posibilidades serán evaluadas:
1. Reuso, sistema de lagunas con lemnia, sistema mejorado de riego;2. Reuso, tratamiento primario, sistema mejorado de riego;3. No reuso, tratamiento primario y secundario convencional, sistema mejorado de riego;
ConclusionesEl reuso de las aguas residuales de la planta Cañaveralejo es una solución económica y sostenible parareducir agotamiento y contaminación.El sistema de lagunas con lemnia no presentan problemas de factibilidad technica cuando se necesitatratar grandes flujos de aguas residuales.El efluente del sistema de lagunas influye el esquema de riego por la provisión de nutrientes. Menosuso de fertilizantes es necessário.Un esquema de riego nuevo es mas económica que el esquema decentralizado de hoy. La necessidad deagua disminuye 50%.El problema de agotamiento y contaminación del agua esta creciendo en el Valle de Cauca y por lotanto los esquemas de riego con aguas residuales serán cada vez mas factibles.
IV
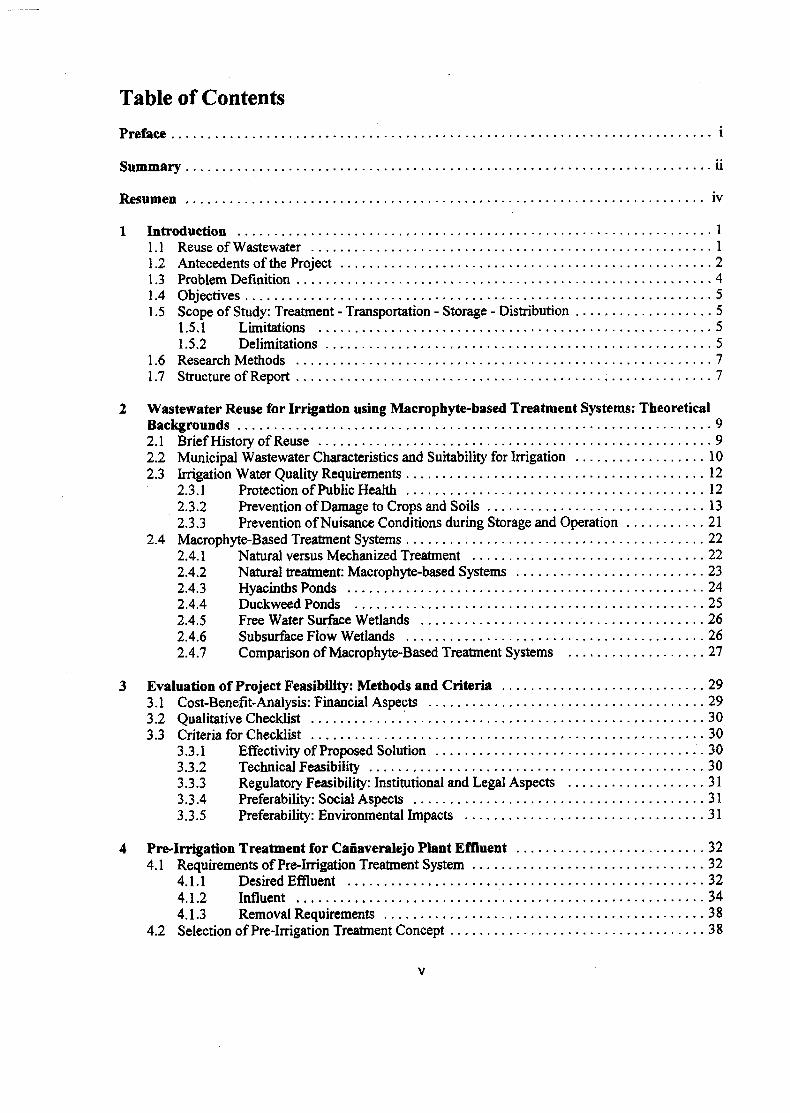
Table of Contents
Preface i
Summary ii
Resumen iv
1 Introduction 11.1 Reuse of Wastewater 11.2 Antecedents of the Project 21.3 Problem Definition 41.4 Objectives 51.5 Scope of Study: Treatment - Transportation - Storage - Distribution 5
1.5.1 Limitations 51.5.2 Delimitations 5
1.6 Research Methods 71.7 Structure of Report 7
2 Wastewater Reuse for Irrigation using Macrophyte-based Treatment Systems: TheoreticalBackgrounds 92.1 Brief History of Reuse 92.2 Municipal Wastewater Characteristics and Suitability for Irrigation 102.3 Irrigation Water Quality Requirements 12
2.3.1 Protection of Public Health 122.3.2 Prevention of Damage to Crops and Soils 132.3.3 Prevention of Nuisance Conditions during Storage and Operation 21
2.4 Macrophyte-Based Treatment Systems 222.4.1 Natural versus Mechanized Treatment 222.4.2 Natural treatment: Macrophyte-based Systems 232.4.3 Hyacinths Ponds 242.4.4 Duckweed Ponds 252.4.5 Free Water Surface Wetlands 262.4.6 Subsurface Flow Wetlands 262.4.7 Comparison of Macrophyte-Based Treatment Systems 27
3 Evaluation of Project Feasibility: Methods and Criteria 293.1 Cost-Benefit-Analysis: Financial Aspects 293.2 Qualitative Checklist 303.3 Criteria for Checklist 30
3.3.1 Effectivity of Proposed Solution .303.3.2 Technical Feasibility 303.3.3 Regulatory Feasibility: Institutional and Legal Aspects 313.3.4 Preferability: Social Aspects 313.3.5 Preferability: Environmental Impacts 31
4 Pre-Irrigation Treatment for Cañaveralejo Plant Effluent 324.1 Requirements of Pre-Irrigation Treatment System 32
4.1.1 Desired Effluent 324.1.2 Influent 344.1.3 Removal Requirements 38
4.2 Selection of Pre-Irrigation Treatment Concept 38

4.2.1 Comparison 384.2.2 Conclusion 394.2.3 Design parameters 40
4.3 Location of Pre-Irrigation Treatment System 414.4 Duckweed Pond System 42
4.4.1 Characterization of Pond System 424.4.2 Design Concepts 424.4.3 Anaerobic Pond 434.4.4 Facultative Pond 444.4.5 Maturation Ponds 444.4.6 Integration of Storage Reservoirs 454.4.7 Evaporation and Rainfall 454.4.8 Layout of Ponds 474.4.9 Structures and Piping 484.4.10 Performance of pond System and Suitability of Effluent for Irrigation 494.4.11 Management, Operation, and Maintenance 51
4.5 No Pré-Irrigation Treatment Alternative 524.6 Cost Estimate 534.7 Benefit Estimate 55
Predesign Irrigation System for Cafiaveralejo project 575.1 Characterization of the Irrigation Area 57
5.1.1 Climate 575.1.2 Soils and Topography 585.1.3 Crop: Sugarcane 585.1.4 Management and Organization of Farmers 595.1.5 Population 605.1.6 Present Irrigation Practices in the Valle de Cauca 605.1.7 Water Resources 62
5.2 Characterization of the Irrigation Scheme 635.2.1 Definition of Irrigable Area in the Juanchito-Guanabanal-Palmaseca zone . . . . 635.2.2 Field Application System 645.2.3 Combined or Separated System 655.2.4 Management of Scheme 655.2.5 Water Delivery Schedule 665.2.6 Operation 665.2.7 Control System 665.2.8 Efficiencies 67
5.3 Irrigation Water Requirements 685.3.1 Water Requirement 685.3.2 Peak Reduction: Rotation and Storage 705.3.3 Capacity Line 71
5.4 Layout of Irrigated Field Area 735.4.1 Grouping in Tertiary Units 735.4.2 Layout of Distribution System 73
5.5 Design of Irrigation System 735.5.1 Design of Reservoirs 745.5.2 Canal Design 745.5.3 Structure Design 75
5.6 Example of Design of Tertiary Unit 765.6.1 Layout within the Tertiary Unit 765.6.2 Canals .785.6.3 Tertiary Control System 78
vi

5.7 Cost Estimate 795.7.1 Investment in New Irrigation Scheme 795.7.2 Annual Costs 81
5.8 Benefit Estimate 83
6 Feasibility Estimate of "Cañaveralejo" Project 856.1 Alternatives: Combinations of Treatment and Irrigation 856.2 Financial Cost-Benefit Analysis 86
6.2.1 Summary of Costs 866.2.2 Summary of Benefits 866.2.3 Benefit-Cost Ratio 87
6.3 Qualitative Checklist 876.3.1 Effectivity 876.3.2 Technical Feasibility 896.3.3 Institutional and Legal Aspects 906.3.4 Social Aspects 916.3.5 Environmental Impacts 92
6.4 Discussion 93
7 Conclusions and Recommendations 957.1 Results 957.2 Conclusions 957.3 Recommendations 96
Literature 97
Appendix I: List of Symbols 105
Appendix II: Organizations and Addresses 109
Appendix III: Water balance of the Valle de Cauca . . . I l l
AppendixIV: Climate 115
Appendix V: Soils and Land Capability 119
Appendix VI: Present and Planned Wastewater Treatment 123
Appendix VII: Irrigation Water Quality Guidelines 127
Appendix VIII: Subsurface Flow Wetland Design 133
Appendix IX: Prices 147
VII
1 Introduction
This chapter introduces the subject and antecedents of the study, and defines the objectives and scopeof the study. An introduction of the terminology of reuse is given in §1.1. The antecedents of theproject (§ 1.2) lead to the problem definition (§ 1.3), and the objectives of the study (§ 1.4). § 1.5describes the scope of the study and lists the limitations and delimitations. The research methods whichare used in the study are introduced in §1.6. The final paragraph of this chapter (§1.7) explains thestructure of this report.
1.1 Reuse of Wastewater
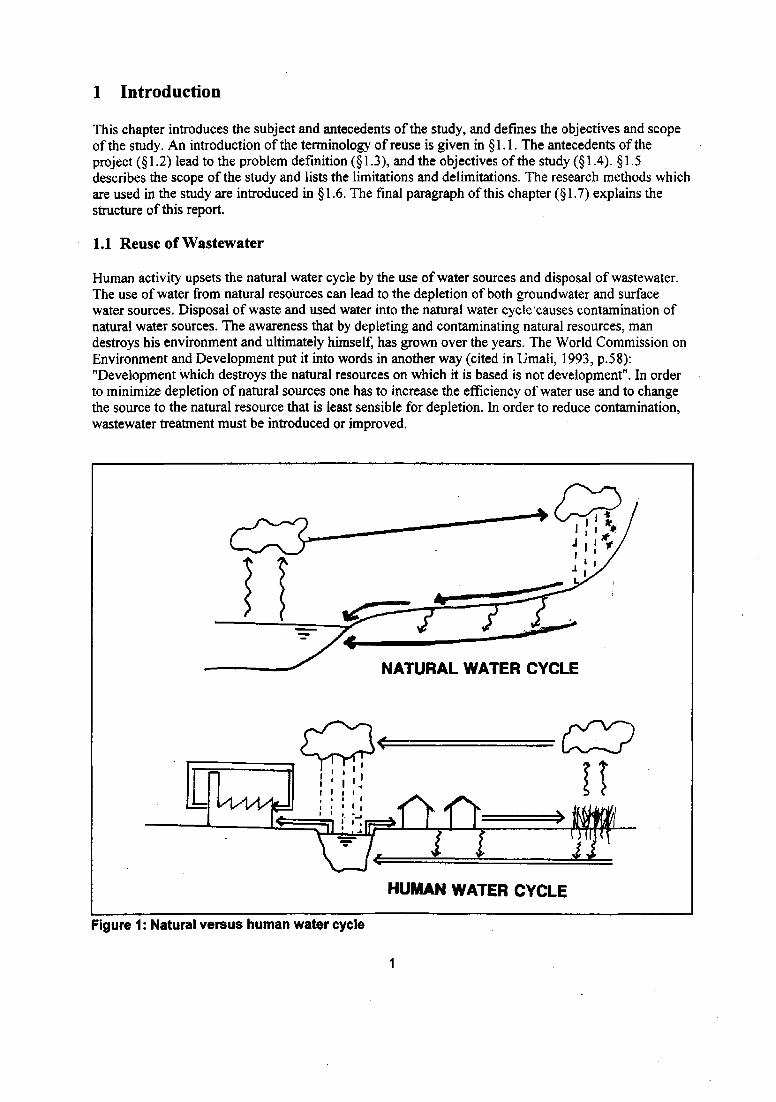
Human activity upsets the natural water cycle by the use of water sources and disposal of wastewater.The use of water from natural resources can lead to the depletion of both groundwater and surfacewater sources. Disposal of waste and used water into the natural water cycle causes contamination ofnatural water sources. The awareness that by depleting and contaminating natural resources, mandestroys his environment and ultimately himself, has grown over the years. The World Commission onEnvironment and Development put it into words in another way (cited in Umali, 1993, p.58):"Development which destroys the natural resources on which it is based is not development". In orderto minimize depletion of natural sources one has to increase the efficiency of water use and to changethe source to the natural resource that is least sensible for depletion. In order to reduce contamination,wastewater treatment must be introduced or improved.
NATURAL WATER CYCLE
HUMAN WATER CYCLE
Figure 1: Natural versus human water cycle

Reuse of wastewater is a sustainable way of minimizing both depletion and contamination of naturalwater sources, by reintroducing (partly treated) wastewater as an alternative water resource. Wastewaterreuse systems in effect, mimic the natural water cycle through engineered processes. As the linkbetween wastewater, reclaimed water, and water reuse has become better defined, increasingly smallerrecycle loops are possible (see figure 1 ).
Wastewater reclamation or wastewater reuse is the process of treating wastewater for new uses, itstransportation to the place of use and its actual use (Pettygrove and Asano, 1985). A distinction can bemade between direct reuse (when there is a direct piped or canal connection of a wastewater effluent tothe intake of the new use), and indirect reuse (when water for productive use is abstracted from anatural surface or underground source that is fed in part by the discharge of wastewater effluent).
Reuse can be categorized according to the productive use the water will have after treatment andtransportation. The four main categories are:
agricultural reuse: reuse for irrigation;aquacultural reuse: reuse for fish-farming;industrial reuse: reuse for industrial use;potable reuse: reuse for human consumption;household reuse: reuse for household uses.
This project focusses on direct agricultural reuse, the treatment, transportation and distribution ofwastewater effluent for irrigation. Agriculture uses 85% of available water in developing countries.Irrigated agriculture should therefore play a major role in solving depletion problems and effluentdisposal problems.
Agricultural reuse is the easiest reuse to realize as agriculture can accept lower quality water thandomestic and industrial users. In quantitative terms, the volume of domestic wastewater available forreuse by irrigated agriculture is negligible when compared with the overall volume of water used forirrigation. However, the potential environmental and social impacts of agricultural reuse of wastewaterare so important, that the need for sound planning exceeds the relatively small quantities and areasinvolved (Ayers and Westcot, 1985).
Agricultural wastewater reuse is a multi-disciplinary process, involving sanitary, irrigation andagronomic engineering as well as hydrology and economy. Sanitary engineers evaluate and minimizepublic health risks, and design wastewater treatment. Irrigation engineers evaluate operational risks anddesign distribution systems. Agronomists evaluate risks to crops and calculate water needs, given acertain water quality. Hydrologist evaluate the availability of water resources, the consequent need ofreuse, and the influence it will have on the natural water cycle. Economists evaluate costs and economicfeasibility of reuse projects. Because wastewater contains impurities careful consideration must begiven to protection of public health, prevention of damage to crops and soils, and prevention ofnuisance conditions during storage and operation. These effects are normally manageable if associatedproblems with impurities are understood and accounted for (Ayers and Westcot, 1985).
1.2 Antecedents of the Project
In recent years several Latin American countries, notably Mexico, Colombia, and Chile, haveexperienced elevated levels of economic growth in the commercial and financial sectors.Approximately US$ 4 * 109 will be spent on water supply and wastewater treatment in the Andesregion in the next four years (Gijzen, IHE, pers.comm.).The economic growth has led to an increase ofgovernment investment in the provision of public services, especially in water supply and sewerage.Reasons for the poor coverage in many regions are an inability to pay for expensive conventional

technology, a lack of infrastructural and institutional development, a scarcity of human resources tofacilitate operation and maintenance, and a lack of community involvement in development projects.
The situation in Colombia is similar to the general South-American situation. In March 1995, theNational (Colombian) Planning Department in coordination with the National Council of Social andEconomic Policy launched the "Water Plan" for the period 1995-1998 with the broad aims ofimproving the coverage, functioning, and institutional management of the sector and the overall goal ofachieving 90% coverage of water supply and 77% coverage of sewer systems by 1998. A furtherobjective of the "Water Plan" is to reduce the negative effects of wastewater discharges on all rivers andreceiving bodies of water through the effective treatment of wastewater. The plan intends to improvethe quality of life for those people living near the receiving water course, and also of reducing the costof the treatment of potable water, and providing a valuable natural resource for reuse with a minimumrisk to public health (Departamento Nacional de Planeacion, 1995).
COLOMBIA
SOUTH-AMERICA
VALLE DE CAUCA
Figure 2: Map of the Valle de Cauca
This study focusses on the Valle de Cauca. Valle de Cauca is a province in the South Western part ofColombia, Latin America, and is located between 3° and 5° North and 75° and 77° West (see figure2). Valle de Cauca also is the name of the basin of the river Cauca. In this report the name Valle deCauca refers to this part of the Cauca river basin which is located within the Valle de Cauca province.The borders of this area are the Cordillera Occidental on the Western side, the Cordillera Central on theEastern side, the cross section at Puenta de Balsa in the South and the cross section at Puenta Anacaroin the North. The surface area of the Valle de Cauca is 14,800 km2 of which 3,370 km2 is flat land and11,430 km2 is mountainous. Total population is 3,158,000 of which more than half lives in Cali, theprovince's capital.
The Valle de Cauca is a rich agricultural area: 310,000 ha is used for agriculture, of which 185,000 hafor sugarcane cultivation (Álzate, 1994; CONE, 1995). The water demand of the sugarcane farmers ishigh and pumping costs are high, much effort is put into decreasing water demands. Water is obtainedboth from surface water (the River Cauca and its attributive streams) and groundwater. The sugarcanefarmers are united in ASOCAÑA, research is carried out by CENICAÑA, the national sugarcaneresearch institute.
Cali is the capital of the Valle de Cauca province the second city of Colombia. Its population (1994) is1,844,000 (Guzman, 1995). The population is estimated to grow to more than 3,000,000 by 2020(Banguero and Castellar, 1993). Of Cali's population 94% is connected to the water supply system and80% to sewerage (Álzate, 1994).
The river Cauca the main stream in the Valle de Cauca is a highly contaminated river. At presentpractically all domestic wastewater of Cali city is discharged untreated on the River Cauca, thisdischarge accounts for 72% of the BOD (biochemical oxygen demand) load of the river. Other pollutersare industries, the municipality of Yumbo, and several paper mills. Downstream of Cali a 80 km longstretch of the river is anaerobic and therefore creates a habitat for insects, mollusca and bacteria. Due tothe construction of a hydroelectrical dam upstream at Salvanija, discharges have dropped and waterscarcity has grown in the Valle de Cauca.
EMCALI is the municipal works department responsible for wastewater collection and treatment.EMC ALI planned the construction of 4 wastewater plants in the future, the largest will be theCañaveralejo plant treating a discharge of 7.6 m3/s. Some of these plants are not to be finished in thenext 25 years and even after construction of the plants the wastewater disposal problem of Cali will notyet be solved: the plants will only partly treat the wastewater and by that time the city's population willhave grown.
The CVC is the provincial water resources body and hence is responsible for control of watercontamination and use of natural water sources. The contamination of natural water bodies is regulatedin law 1594 (Republica de Colombia Ministerio de Salud, 1984) and Acuerdo No. 14 (CVC, 1976),which up till now has not been enforced. Last year the CVC introduced a tax on water use (CVC,1995), which is very low at the moment but will be increased in the future. There are no special lawsfor wastewater reuse, and it is not clear if and when effluents for reuse will have to comply to the lawsmentioned above.
1.3 Problem Definition
The river Cauca is a highly contaminated river, which is anaerobic for a long stretch. Thecontamination is for a large part caused by the disposal of untreated municipal wastewater from the cityof Cali into the river.
The Valle de Cauca suffers from depletion of water sources. The use of surface water is regulated bylaw, but disputes between municipal and agricultural users occur often. There is a discussion whetherthe groundwater in the region is overexploited. New water taxes are imposed on the use of both surfaceand groundwater.
The Valle de Cauca is one of the richest region of Latin America, but even here economically feasiblesolutions for the problems stated above should be found.
1.4 Objectives
Agricultural reuse of municipal wastewater could be an attractive solution to help to solve thecontamination and the depletion problem in an economically feasible way. In order to determine theeffects of reuse as well as the economical feasibility, further investigation is required.
The general objective of this study is to evaluate possibilities for treatment by natural aquatic treatment,transportation, storage and distribution of wastewater effluent from the EMC ALI wastewater treatmentplant Cañaveralejo in Cali, Colombia to suit irrigation needs of sugarcane cultivation in the Valle deCauca.
A specific objective will be to assess whether treatment by a natural aquatic treatment system for largeamounts of domestic wastewater is feasible with regard to use of land area and socio-economicallyattractive through the yield of profitable products.
The second specific objective will be to investigate how the use of wastewater influences sugarcaneirrigation and to integrate wastewater considerations into a distribution system.
1.5 Scope of Study: Treatment - Transportation - Storage - Distribution
Delimitations are limitations on the research design that the researcher imposes deliberately.Limitations are restrictions over which the researcher has no control (Huckin, 1991).
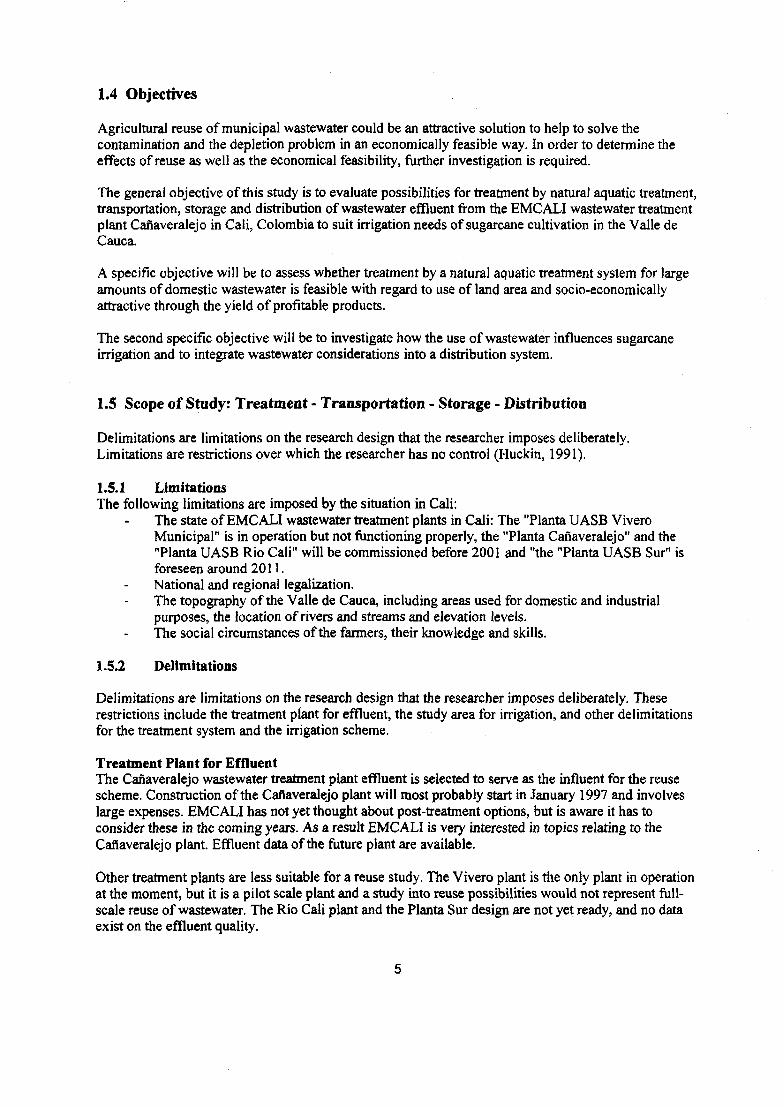
1.5.1 LimitationsThe following limitations are imposed by the situation in Cali:
The state of EMC ALI wastewater treatment plants in Cali: The "Planta UASB ViveroMunicipal" is in operation but not functioning properly, the "Planta Cañaveralejo" and the"Planta UASB Rio Cali" will be commissioned before 2001 and "the "Planta UASB Sur" isforeseen around 2011.National and regional legalization.The topography of the Valle de Cauca, including areas used for domestic and industrialpurposes, the location of rivers and streams and elevation levels.The social circumstances of the farmers, their knowledge and skills.
1.5.2 Delimitations
Delimitations are limitations on the research design that the researcher imposes deliberately. Theserestrictions include the treatment plant for effluent, the study area for irrigation, and other delimitationsfor the treatment system and the irrigation scheme.
Treatment Plant for EffluentThe Cañaveralejo wastewater treatment plant effluent is selected to serve as the influent for the reusescheme. Construction of the Cañaveralejo plant will most probably start in January 1997 and involveslarge expenses. EMCALI has not yet thought about post-treatment options, but is aware it has toconsider these in the coming years. As a result EMCALI is very interested in topics relating to theCañaveralejo plant. Effluent data of the future plant are available.
Other treatment plants are less suitable for a reuse study. The Vivero plant is the only plant in operationat the moment, but it is a pilot scale plant and a study into reuse possibilities would not represent full-scale reuse of wastewater. The Rio Cali plant and the Planta Sur design are not yet ready, and no dataexist on the effluent quality.

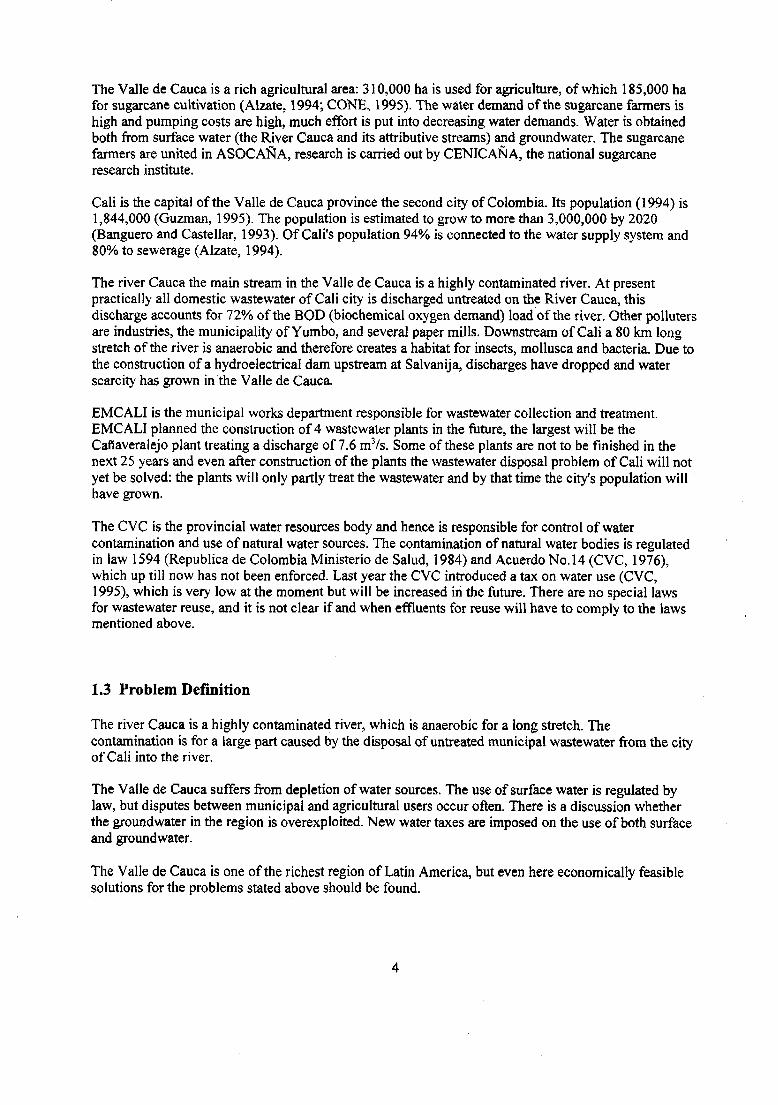
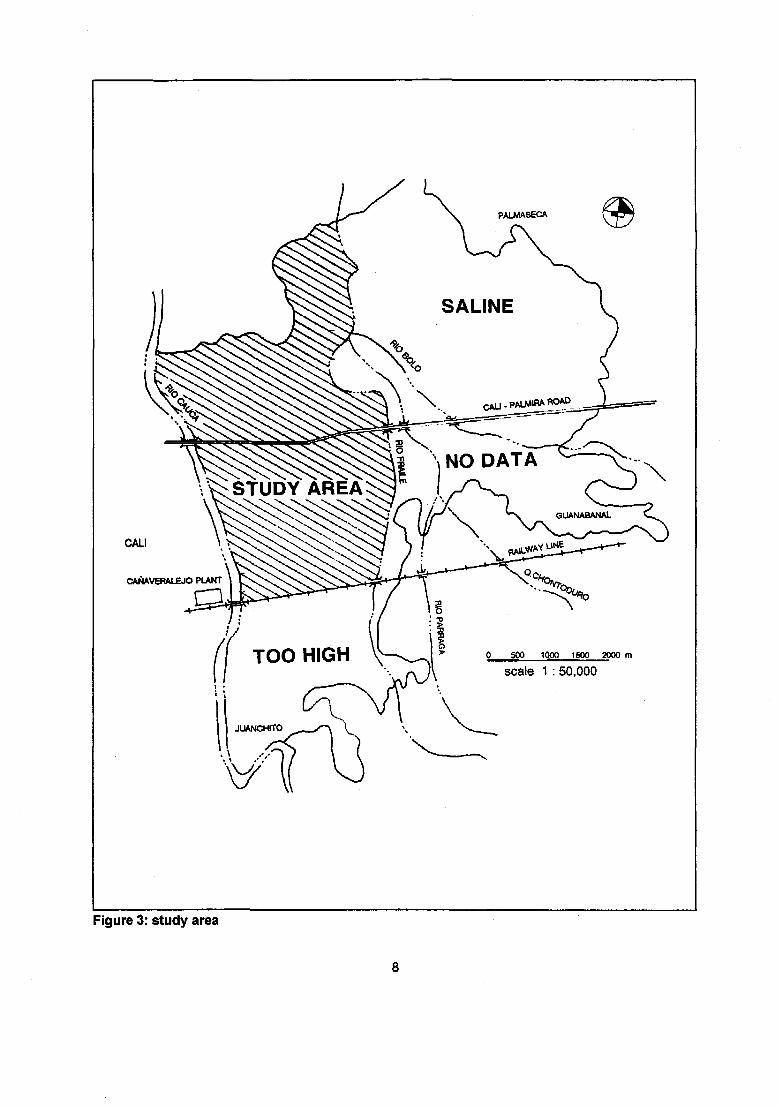
Study Area for IrrigationThe reclaimed wastewater is used to irrigate sugarcane on the right bank of the river Cauca in the Vallede Cauca. The prevailing slope in the Valle de Cauca is from the South (high) to the North (low), sofrom the Cañaveralejo plant only an area to the North can be irrigated by gravity; the railway line canserve as a border. The choice of the extent of the study area depends on the availability of data. Thethree main categories of data necessary to plan an irrigation scheme are climatological data, soil dataand topographical data.
Based on the availability of climatological and agronomic data the Juanchito-Guanabanal-Palmaseca ischosen (see figure 3). This area is well documented in a thesis about climate and soils (Aristazabal andZambrano, 1993). The Juanchito-Guanabanal-Palmaseca region is situated on the East bank of theCauca river, at an altitude of 950 m. Juanchito, Guanabanal and Palmaseca are corregimientos,jurisdictional zones, of the municipality of Palmira. The area is bordered in the East by Palmira, in theWest by the Rio Cauca and Cali city, In the North by the corregimiento of Vereda Matapalos and in theSouth by the municipality of Candelaria.
There are no elevation data on the area South of the Cali- Palmira road and East of the Rio Fraile. Thearea South of the Cali-Palmira road, East of the Rio Fraile will not be included in further investigation.
Data on the area East of the Rio Bolo/Rio Gauchal and North of the Cali-Palmira road are incomplete.The area is very distinct from the rest of the Juanchito-Guanabanal-Palmaseca area, as there are serioussalinity problems. The objective of this study is not to look into various irrigation problems; in order tobe able to focus on reuse issues, this area will not be taken into account.
The study area will be the area between the Rio Cauca and the Rio Fraile/Rio Gauchal on the East. TheSouth border will be the railway Cali-Palmira, and in the North the area will be bordered by thecorregimiento of Vereda Matapalos. The surface area of the study area is 1237 ha.
Other Delimitations Treatment SystemOther delimitations regarding the treatment system are:
Primary effluent is considered.A macrophyte-based wastewater treatment system treats the wastewater prior to irrigation.Macrophyte-based treatment systems are defined as discharging natural wastewater treatmentsystems in which aquatic macrophytes (wetlands plants, which are adapted to growingconditions in water saturated soils) have a key function in relation to the cleaning ofwastewater (Brix, 1993). The treatment system should meet local community interests andyield interesting products (duckweed, reed etc). Macrophyte-based treatment concepts whichmeet these requirements are: hyacinth and duckweed ponds and constructed wetlands (bothfree water surface and subsurface flow). Submerged macrophyte-based systems, multistagesystems and vertical-flow systems will not be discussed.The location of the pre-irrigation treatment can be on the right bank of the river Cauca.Transportation to the pre-irrigation site and storage of water at the EMC ALI plants is notdesigned. Transportation is taken into consideration when analyzing the costs and benefits ofthe system.
Other Delimitations Irrigation SystemRestriction for the irrigation scheme are:
The design of the irrigation system will be "from scratch", as revising of the old system is notpracticable in the scope of this thesis. The design will include transportation from the pre-irrigation site, any storage and distribution. The irrigation scheme is productive, or crop-based irrigation: the objective of the irrigation management is to maximize the return per unitarea. The irrigation scheme has to function by gravity.Drainage is not designed.

It is assumed that the complete agricultural area is used for sugarcane. In reality over 90% isused for sugarcane. Other crops include annual crops and pastures.The use of wastewater for irrigation may not cause a drop in sugarcane yield.
1.6 Research Methods
The objectives stated above will be fulfilled using mainly existing data. No new data will be producedvia practical and experimental work, except a series of electric conductivity measurements in the rawCañaveralejo wastewater.
Computer programs used include:Profile, a computer program to calculate the profile of a trapezoidal canal using Strickler-Manning resistance formula. Version 2.0 of this program made by the Center of OperationalWatermanagement of Delft University of Technology was used.Cropwat, an irrigation planning and management tool, written by the Land and waterDevelopment Division of the Food and Agricultural Organization of the United Nations wasused to calculate irrigation needs. Version 5.7, of October 1991 was used.
1.7 Structure of Report
This report focusses on the reuse of municipal wastewater of Cali city, collected by EMCALI, forirrigation of sugarcane cultivation at the East bank of the river Cauca. The study consist of three parts:
1. a theoretical part on wastewater reuse; water criteria for irrigation; natural aquatic treatmentsystems; generation of criteria set for feasibility;
2. a design for the reuse of the effluent of the Cañaveralejo plant;3. conclusions and recommendations.
The first theoretical part contains two elements: background from literature in chapter 2 and thegeneration of a criteria set in chapter 3. Chapter 2 focuses on themes related to the topic of this studyand includes a brief history of wastewater reuse (§2.1); an introduction into wastewater characteristics(§2.2); a more elaborate part on irrigation water quality requirements (§2.3); and a discussion aboutnatural aquatic treatment systems (§2.4). Chapter 3 describes the methods and criteria, which are usedfurther on to evaluate the feasibility of the reuse alternative. Methods include a cost-benefit-ratio (§3.1),and a qualitative checklist (§3.2). §3.3 discusses the criteria used for the checklist.
The second part (chapter 4, 5 and 6) of this study is a design of the reuse scheme of wastewater of theCañaveralejo plant and is the core of the study. Chapter 4 is a selection and a predesign of a treatmentsystem for the effluent before irrigation. The present wastewater is compared to irrigation water criteria(§4.1). A treatment system is selected (§4.2), and designed (§4.3). The pre-irrigation system serves asthe water resource for the design of an irrigation system in chapter 5. Present irrigation practices arediscussed in §5.1. A 936 ha irrigation scheme is designed, including transportation from the treatmentsystem, storage and distribution (§5.2 - §5.6). Chapter 6 gives an outline of the costs and benefits andother effects of implementation of both the pre-irrigation system and the irrigation system, based on thecriteria generated in chapter 3.
The final part of the study (chapter 7) is a chapter of conclusions (§7.1) and recommendations (§7.2).After chapter 7 follows a literature list and appendices.
V ^ ^ ^ ^F ^ ^ ^ ^ ^ ^ ^ ^
\^ STUDY AREA
CALI
CAÑAVERALEJO PLANT
0 500 1000 1500 2000 m
scale 1 :50,000
Figure 3: study area

2 Wastewater Reuse for Irrigation using Macrophyte-based TreatmentSystems: Theoretical Backgrounds
This chapter gives a short literature review on the history of reuse, municipal wastewater, irrigationwater quality guidelines, and macrophyte-based treatment systems. The first paragraphs (§2.1)describes the history of reuse from ancient times to recent years. The characteristics of municipalwastewater and its suitability for irrigation are discussed in §2.2. Irrigation water quality guidelinesinclude three categories: protection of public health risks (2.3.1), prevention of damage to crops andsoils (§2.3.2), and prevention of nuisance (§2.3.3). The final paragraph (§2.4) discusses fourmacrophyte-based wastewater treatment systems: hyacinth ponds, duckweed ponds, free water surfacewetlands, and subsurface flow wetlands.
2.1 Brief History of Reuse
The ability of normal, porous aerated soil to purify water as well as the beneficial effects of nutrients inwastewater upon soils have been known for a long time. Use of wastewater for crop irrigation inwestern civilizations can be traced as far back as ancient Athens. However, the difference betweenusing sewage to irrigate crops and using land to treat sewage has only been recognized in the twentiethcentury (Dean and Lund, 1981).
During the second half of the nineteenth century there was a considerable increase in the number ofreuse schemes in the United States and in Europe, where pollution of many rivers had reachedunacceptable levels. Disposal of wastewater on land was the only feasible means of treatment available.Reuse was practiced at so-called sewage farms, with a primary objective of waste disposal, howevercrop production benefitted from the nutrients present in the wastewater. Some of these nineteenthcentury sewage farms are still in use today (Hespanhol and Prost, 1994).
A number of reasons led to a significant reduction in the use of wastewater for irrigation. The increasein the volume of wastewater as a consequence of the growth of cities made use for irrigation lessfeasible, because of the large areas of land needed. The development of wastewater systems at thebeginning of the twentieth century created alternative treatment methods. The interest in use forirrigation lowered due to the scientific research provided by Pasteur and Koch revealing that microbespresent in excreta cause disease transmission. After Pasteur's discovery hygienists have been promotingthe need for a total elimination of pathogens from the human environment. The lack of enforcement onwater pollution control caused mismanagement of sewage farms. Furthermore the economic benefitsgained from reuse did not balance the increased public perception of the risks involved (Hespanhol andProst, 1994).
Only in regions were there was a great necessity to meet growing water needs, such as the arid westernand southwestern states of the USA, reuse projects were developed in the first half of the twentiethcentury. In particular in California wastewater (first untreated, then treated in septic tanks) was usedfrom 1912 on for irrigation purposes.
In the past two decades the use of wastewater for crop irrigation has been revived in the arid and semi-arid regions of the world in response to the need for alternative sources of water to increase local foodproduction. The number of wastewater reuse projects is still increasing today. Even in water-plentifulareas reuse of effluent is gaining importance as a beneficial water conservation measure. In many partsof the developing world, wastewater reuse is carried out informally where the obvious benefits to thecrops have been recognized. Wastewater reuse is not limited to developing countries, however, as manyreuse schemes are found in Australia, Europe, and the USA. Mexico is probably the largest user ofwastewater for irrigation in the world: as no conventional wastewater treatment can be economically
provided to the flow of about 80 m3/s of wastewater from Mexico City, it is stored in reservoirs andused for crop irrigation. Mexico has established and is strictly enforcing a policy of crop restriction as ameasure for health protection (Hespanhol and Prost, 1994).
The effects of wastewater reuse on public health, crop yield, soil properties and irrigation operationcontinue to be subject to discussion, although some consistent sets of criteria have been generated(Ayers and Westcot, 1985, Shainberg and Oster, 1978). It had become clear that the "germ free"approach, used by early hygienists is impossible to be achieved for practical reasons. Recent publichealth regulations have been based on pathogen-host relationships and epidemiological evidence ofdisease transmission caused by the practice of reuse: helminth eggs are now regarded as the main actualpublic health risk of wastewater irrigation (Hespanhol and Prost, 1994). Meanwhile scientific literaturehas reported the results of many studies indicating the beneficial effects of nutrients contained inmunicipal wastewater, which can be of significant economic benefit in irrigation. Moreover possibleharmful influence of irrigation water quality on soil properties and crop growth were discovered, likesalinity and sodicity. Recently considerable attention is given to environmental aspects of water quality,including the possible presence of minute amounts of potentially harmful substances, such as traceelements and trace organics (Page and Chang, 1985a, 1985b).
2.2 Municipal Wastewater Characteristics and Suitability for Irrigation
Sewage or municipal wastewater is the spent water of a community. It contains pollutants, consistingmainly of faeces, urine and sullage; and is approximately 99.9% water and 0.1% solids. Municipalwastewater is composed of domestic wastewater, industrial wastewater, infiltration water and, incombined sewer systems, stormwater run-off. The composition of untreated wastewater and thesubsequently treated effluent depend upon the composition of the municipal water supply, the numberand type of commercial and industrial establishments, and the nature of the residential community.
Due to changing water consumption patterns, increased reliability of water supply and low water prices,wastewater flows have increased in many parts of the world. The volume of domestic wastewater plusinfiltration-inflow, excluding industrial wastewater and stormwater runoff, generated in a communityon a per capita basis varies from 0.19 to 0.57 mVday (Asano et al., 1985). Wastewater flows to atreatment plant can vary widely in quantity. Several cycles can be recognized. The short-term variationsin wastewater flows observed at municipal wastewater treatment plants tend to follow a diurnal pattern:flow is low during the early morning hours, when water consumption is lowest, an higher during theafternoon and the evening. In combined sewer systems flow peaks occur due to stormwater runoff.Long-term, seasonal variations in flow may occur in holiday resorts and university campuses. Althoughmixing and retention time in treatment system depress peaks, variation should be taken into accountwhen using the effluent: storage is required to guarantee a consistent flow (Asano et al., 1985; Van derGraaf, 1995a).
Water quality conceptually refers to the characteristics of a water supply that will influence itssuitability for a specific use, and is defined by certain physical, chemical and biological characteristics.Wastewater quality generated by a community varies according to the time of day, the standard ofliving, the season, and the degree and nature of industrialization in the area in question. Rawwastewater consists the following substances (see table 1):
Biodegradable organics; caused by domestic, commercial and industrial sources and mostcommonly expressed in biochemical oxygen demand (BOD) or chemical oxygen demand(COD);Solids; ranging from large floatable objects to small invisible particles. A measure for smallparticles is the concentration of total suspended solids (TSS);Nutrients; particularly total nitrogen (TN) and total phosphorus (TP) content of wastewater,
10

caused by domestic and agricultural wastes as well as natural runoff;Pathogens; Domestic wastewater contains a large number of micro-organisms, some of whichare pathogenic. The easily identified coliform group of bacteria is used to indicate thepresence of other pathogens which are difficult to detect and identify. Helminth eggs aremeasured separately;Micropollutants; These include heavy metals, mainly deriving from industrial wastes andpesticides. Wastewater can include a wide variety of micropollutants in variousconcentrations;Salts; The principal salt present is sodium chloride. Sources include food, water softeners,and salt that is originally present in water supply.
Wastewater quality data measured and reported are mostly in terms of gross pollutant parameters (e.g.BOD, COD, TSS) that are of interest in water pollution control. In contrast, the water characteristics ofimportance in irrigation are specific chemical elements and compounds that affect plant growth or soilpermeability and are not often measured or reported by wastewater treatment agencies as part of theirroutine monitoring program. As a result it is often necessary to sample and analyze the wastewater forthose constituents that define the suitability of the water for irrigation. For purposes of planning, in theabsence of actual effluent data, the composition can be estimated from data of the water supply qualityand data presented in literature (Asano et al., 1985).
Table 1 : Literature values of raw wastewater quality
pollutant
BOD
TSS
TN
TP
coliforms
helminth eggs
electric conductivity
concentration
220 - 290 mg/l
220-260 mg/l
30-80 mg/l
5-15 mg/l
1e7-1e9/100 ml
10-10000 eggs/I
0.2-1.3 dS/m
source
D'ltri,1981; Metcalf & Eddy, 1991; Van derGraaf, 1995a
D'ltri.1981; Metcalf & Eddy, 1991
D'ltri,1981; Metcalf & Eddy, 1991; Van der Graaf, 1995a
D'ltri,1981; Metcalf & Eddy, 1991; Van der Graaf, 1995a
Arthur, 1983; D'ltri,1981; Metcalf & Eddy, 1991; Mara et al., 1992
Metcalf & Eddy, 1991; Mara etal., 1992
Dean and Lund, 1981; D'ltri, 1981; Metcalf & Eddy, 1995
The general objective of wastewater treatment is to improve water quality to such an extent that it issuitable for its safe disposal into the environment (groundwater or surface water) or its intended reuse.Municipal wastewater treatment consists of a combination of physical, chemical, and biologicalprocesses and operations. General terms used to describe different degrees of treatment, in order ofincreasing treatment level, are preliminary, primary, secondary and advanced or tertiary treatment.Preliminary treatment operations include coarse screening and comminution of large objects and gritremoval by sedimentation. Primary treatment removes settleable organic and inorganic solids bysedimentation, and scum by skimming. Secondary treatment involves the removal of biodegradabledissolved and colloidal organic matter using biological treatment processes. Secondary treatment caneither be performed by high-rate, mechanized treatment processes or by low-rate, natural processes.Advanced or tertiary treatment is any physical, chemical, or biological treatment process used toaccomplish a degree of treatment greater than secondary treatment. Usually it implies removal ofnutrients and a high percentage of suspended solids. Salinity, which largely determines the suitability ofa wastewater for irrigation, is not reduced substantially in most wastewater treatment systems: in somenatural systems salinity may even increase as a result of evaporation (Asano et al., 1985).
The use of municipal wastewater for irrigation should not cause harmful side effects, when treated
11

sufficiently and managed well. Some degree of treatment must be provided to raw municipalwastewater before it is suitable for irrigation. Pre-irrigation treatment of wastewater is practiced for thefollowing reasons: protection of public health; prevention of damage to crops and soils; and preventionof nuisance conditions during storage and operation (Asano et al., 1985). Feachem et al. (1983) stressthat waste stabilization ponds, conventional treatment followed by maturation ponds, land application,or sand filtration are the only treatment processes that produce an effluent that can be reused forirrigation without public health problems. The level of pre-irrigation treatment required for irrigation,from an agricultural point of view, depends on soil characteristics, the crop irrigated, and the type ofdistribution and application system.
2.3 Irrigation Water Quality Requirements
Guidelines are a management tool; they are intended to provide background and guidance for makingrisk management decisions and are not to be confused with legal standards. Evaluation must be done interms of specific local conditions of use and farm management ability of the water user (Ayers andWestcot, 1985). Guidelines for evaluation of water quality for irrigation emphasize the reasons for pre-irrigation treatment mentioned above. They can be categorized in three categories:
Protection of public health.Prevention of damage to crops and soils.Prevention of nuisance conditions during storage and operation.
This paragraph will discuss all three categories of guidelines and will use a problem-solving approach:guidelines will be followed by suggestions on management alternatives to overcome potential problems(Ayers and Westcot, 1985).
2.3.1 Protection of Public HealthWastewater contains the disease causing agents of infected humans, such as excreted bacteria, viruses,protozoa, and helminths. Faecal-oral transmitted diseases (including amoebic dysenteries, cholera,giardiasis, and poliomyelitis) and water-based diseases are caused by pathogens transmitted in humanexcreta. Wastewater use for irrigation can cause two major public health risks: consumers can beexposed to risks by eating (raw) products and workers can be exposed when working withcontaminated water (Feachem et al., 1983).
Two indicators are used to assess public health risk in wastewater to be used in irrigation: faecalcoliforms and helminth eggs. Because pathogens in water are relatively few in number and difficult toisolate, the nonpathogenic faecal coliform group of bacteria, which is more numerous and easily testedfor, is used as an indicator of the presence of viruses, bacteria and protozoans in treated water.Helminth eggs are more persistent than faecal coliforms, and can survive up to two months in anaquatic environment. Accordingly faecal coliforms cannot be used as an indicator for their presence,and the presence of helminth eggs has to be investigated separately.
Guidelines for wastewater reuse have changed several times in the past and even today are still subjectto discussion. In 1918 the Califomian State Health Department set quality criteria for irrigation. Afterseveral revisions this legislation is one of the most complete and restrictive in use today (State ofCalifornia, 1978). The strictness of these guidelines regarding the amount of coliforms (2.2 per 100ml)has been subject to discussion over the past 20 years, but still many countries have adopted the samecriteria with little or no adaptation (Hespanhol and Prost 1994, Mara 1995). In 1971 the WHO Meetingof Experts on the Reuse of Effluents suggested 100 total coliforms per 100 ml for irrigation ofvegetables eaten cooked. Epidemiologists and public health experts agreed that the actual riskassociated with irrigation with treated wastewater is much lower than previously estimated and thatearly standards, particularly in respect of bacterial pathogens, were unjustifiably restrictive. Helminth
12
eggs were regarded as the main actual public health risk associated with wastewater irrigation(Hespanhol and Prost, 1994). In 1987 the Scientific Group on Health Guidelines for the Use ofWastewater in Agriculture and Aquaculture once again reviewed the guidelines. In their guidelines theonly coliform norm left is for irrigation of crops likely to be eaten uncooked, of sports fields, and ofpublic parks. The 1987 WHO guidelines are included in table 2 appendix VII.
There are four main methods of protecting the public health of a population from the risks associatedwith wastewater reuse (Lloyd, 1995):
wastewater treatment: the removal of pathogens from the water before application andexposure is the most reliable way of reducing public health risks. The amount of treatmentneeded is expressed in the WHO application guidelines (table 2 appendix VII);crop restriction: crops eaten raw will cause a higher risk of infection for consumers thancereal crops, industrial crops (such as cotton and sisal), food crops for canning, fodder crops,pasture, and trees;control of wastewater application: careful choice of the irrigation system used can help tocontrol the risk of wastewater reuse. The exposure of workers is less when using an automaticsystem and irrigation with wastewater can be stopped several weeks before harvesting;human exposure control: not only for workers but also for their families; the crop handlerswho are involved with processing; the consumers; and those people living in the immediateenvironment of the irrigation. There are a number of ways of exposure control: protectiveclothing for workers, positioning of sprinklers at least 50-100 m from houses and roads toprevent wetting passers-by, localization of canals within the fields and not at the borders,information about the location of the fields where wastewater is used and the importance ofavoiding contact and health education program. The distance to residential areas and roads isfor example set by law in Israel (Shelef et al., 1987).
2.3.2 Prevention of Damage to Crops and SoilsGuidelines for evaluation of water quality for irrigation emphasize the long-term influence of waterquality on crop production and soil conditions. A number of different water quality guidelines relate toirrigated agriculture and crop response to water quality (National Technical Advisory Committee to theSecretary of the Interior, 1972; FAO/UNESCO, 1973; Shainberg an Oster, 1978; Shelef et al., 1987;Rhoades and Loveday, 1990). They all cover different problems, and use slightly different systems. Inthis study the FAO classification (Ayers and Westcot, 1985) of guidelines will be used, because of itscompleteness and clear categorizing.
The four categories that are used for evaluation are:salinity;water infiltration rate problems;toxicity;miscellaneous problems.
The various water quality problems mentioned above often occur in combination, but they are moreeasily understood and solved if each factor is considered individually. Complex problems may affectcrop production more severely than a single problem (Ayers and Westcot, 1985).
SalinitySalinity problems occur when salts in soil or water reduce water availability to the crop to such anextent that yield is affected. Salinity, measured by electrical conductivity (ECW) or total dissolved solids(TDS), is the most important parameter in determining the suitability of water for irrigation (Ayers andWestcot, 1985). The effect of salt on crop growth is believed to be of osmotic nature: excess saltsincrease the energy that the plant must expend to acquire water from the soil and undertake thebiochemical adjustments necessary to survive. This energy is wasted in the sense that it is diverted fromthe processes that lead to normal growth and yield (Rhoades and Loveday, 1990; Umali, 1993).
13
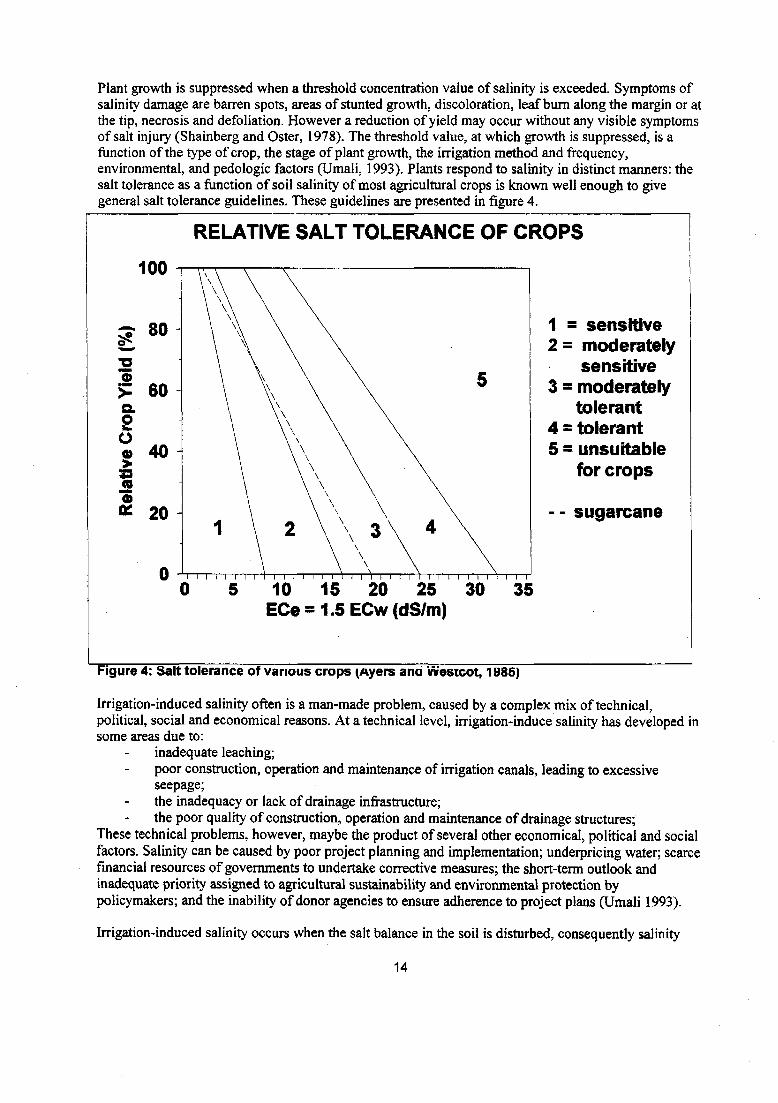
Plant growth is suppressed when a threshold concentration value of salinity is exceeded. Symptoms ofsalinity damage are barren spots, areas of stunted growth, discoloration, leaf burn along the margin or atthe tip, necrosis and defoliation. However a reduction of yield may occur without any visible symptomsof salt injury (Shainberg and Oster, 1978). The threshold value, at which growth is suppressed, is afunction of the type of crop, the stage of plant growth, the irrigation method and frequency,environmental, and pédologie factors (Umali, 1993). Plants respond to salinity in distinct manners: thesalt tolerance as a function of soil salinity of most agricultural crops is known well enough to givegeneral salt tolerance guidelines. These guidelines are presented in figure 4.
RELATIVE SALT TOLERANCE OF CROPS
100
1 = sensitive2 = moderately
sensitive3 = moderately
tolerant4 = tolerant5 • unsuitable
for crops
-- sugarcane
10 15 20 25 30 35ECe = 1.5ECw(dS/m)
Figure 4: Salt tolerance of various crops (Avers ana Wesicot, 1985)
Irrigation-induced salinity often is a man-made problem, caused by a complex mix of technical,political, social and economical reasons. At a technical level, irrigation-induce salinity has developed insome areas due to:
inadequate leaching;poor construction, operation and maintenance of irrigation canals, leading to excessiveseepage;the inadequacy or lack of drainage infrastructure;the poor quality of construction, operation and maintenance of drainage structures;
These technical problems, however, maybe the product of several other economical, political and socialfactors. Salinity can be caused by poor project planning and implementation; underpricing water; scarcefinancial resources of governments to undertake corrective measures; the short-term outlook andinadequate priority assigned to agricultural sustainability and environmental protection bypolicymakers; and the inability of donor agencies to ensure adherence to project plans (Umali 1993).
Irrigation-induced salinity occurs when the salt balance in the soil is disturbed, consequently salinity
14

can be controlled by restoring the salt balance. Salts are added to the soil with each irrigation andremoval by crops is mostly insufficient to maintain salt balance. Accumulation depends upon thequantity of salt applied in the irrigation water (salts in) and the rate at which salt is removed by leaching(salts out). The salt balance of a root zone can be written in terms of volumes which flow in and out ofthe rootzone (D [m3]) concentrations (C [g/m3]), and amounts of salts (S [g]). The net differencebetween input and output gives the resultant change in soil-water salinity or storage (ASSW).
D¡W*CiW + Dr*Cr + V C » v + Sm+ Sf = D**C» + Sp
+ Sc + A S ^ (1)
where: D iw = flow of irrigation water [m 3 ] ;C iw - salt concentrat ion of irrigation water [g/m3];D m = flow of rainwater [m3];C m = salt concentrat ion of rain water [g/m 3] ;D ^ = flow of groundwater [m 3 ] ;Cgw = salt concentrat ion o f groundwater [g/m 3] ;Dd w = flow of drainage water [m3] ;C,jw = salt concentrat ion of drainage water [g/m3] ;Sm = Amoun t of salt dissolved from minerals in the soils [g];Sf = Amoun t of salt added by agricultural chemicals, such as fertilizers [g];Sp = Amount of salt percolating into the soil after irrigation [g]; •Sc = Amoun t of salt removed through crops [g];AS5W= Storage of salts [g];
Salt storage in the rootzone should equal zero for good salinity control, and be negative for reclamationof saline soils. The salt balance equation reduces to equation 2, when the following assumptions can bemade:
Rainfall contains zero salts (C r=0);There is n o capillary rise from the groundwater (Dg w=0);The dissolution of minerals, and salts added by fertilizers is zero (Sm=S f
ss :0);Loss o f soluble salt through percolation, and loss through crop uptake do not contributeappreciably (SP=SC=O);There is a uniform areal application of water in the field;There is no storage of salts (ASSW=O);
Concentrat ion can be substi tuted by electric conductivity (EC), since the electric conductivity of a wateris a reliable index of its total solute concentration within practical limits (Rhoades and Loveday, 1990).
= LF n\
where: ECiw = electric conductivity of irrigation water [dS/m];ECdw = electric conductivity of drainage water [dS/m];LF = leaching fraction [-];
By varying the leaching fraction of applied water that is percolating through the root zone, it is possibleto control the concentration of salts in the drainage water within certain limits and, hence, to controlsalinity in the rootzone, which is the intermediate between ECiw and ECdw. The best means ofcontrolling soil and water salinity is the provision of efficient irrigation with adequate but minimumleaching and drainage management that maintains a downward net flux of water in the soil. Goodsalinity control is more than setting standards for irrigation water quality: it is a complex mixture ofdesign and operation. The primary concerns in water management for salinity control are (Oster andRhoades, 1985, Rhoades and Loveday, 1990):
crop management;
15

land and soil management;irrigation management;drainage management;monitoring.
crop managementBecause crops and different varieties of the same crop vary considerably in their tolerance to salinity,crops can be selected that produce satisfactorily for the particular conditions of salinity in the root zone.When selecting a crop, it is important to consider the crop's salt tolerance during seedling development,as this is often the most sensitive growing stage. Plant density may be increased to compensate forsmaller plant size that exists under saline conditions. This increases interception of the incoming energyof the sun and therefore, crop yield relative to normal conditions (Rhoades and Loveday, 1990).
land and soil managementLand management should be aimed at the most uniform water application to secure the best salinitycontrol. Where irrigation is by flood or furrow methods, careful landgrading, such as is possible usinglaser-controlled earth-moving equipment, is desirable. Salt accumulation can be especially damaging togermination and seedling establishment when raised beds or ridges are used and "wet-up" by furrowirrigation, even when the average salt levels in the soil and irrigation water are moderately low(Rhoades and Loveday, 1990). Fertilization may increase salinity problems if fertilizer, manures andsoil amendments are placed too close to the germinating seedling of grown plants. Care, therefore,should be taken in placement and timing of fertilization (Ayers and Westcot, 1985).
irrigation managementThe prime requirements for irrigation management for salinity control are frequent irrigation, adequateleaching, water table depth control, a well-managed delivery system and an appropriate fieldapplication system (Oster and Rhoades, 1985; Rhoades and Loveday, 1990).
Seepage losses in the delivery system are often a major cause of the development of high water tablesand excessive soil salinity in irrigated lands. In order to minimize seepage losses special attentionshould be paid to the construction of canals, flow-measuring devices and water delivery policy.Seepage may be reduced by compacting the canal floor and walls or by lining them with less permeablematerials. In order to identify seepage losses and oversupply to farms, a net of effective flow-measuringdevices at critical points needs to be installed. Ideally, water delivery should be on demand, becausewater delivery for a fixed period, or in fixed amounts, encourage overirrigation (Rhoades and Loveday,1990).
In general, improvements in salinity control come from improvements made in on-farm irrigationefficiency, by providing the appropriate amount of water at the appropriate time with uniformity ofapplication. The ideal irrigation scheme would provide water more or less continuously to the plant tomatch evapotranspiration losses and to keep water content within narrow limits commensurate withadequate aeration and adequate loss in deep percolation for leaching. Each irrigation method has certainadvantages and disadvantages. Well-designed trickle systems are an excellent application system forsalinity control and higher levels of salinity in the irrigation water can be tolerated with these systemsthan with other methods of irrigation (Shainberg and Oster, 1978, Rhoades and Loveday, 1990). Awell-designed sprinkler system applies water with good uniformity and will result in an excellentoverall irrigation and adequate and uniform leaching (Ayers and Westcot, 1985, Rhoades and Loveday,1990). Flood and furrow irrigation can cause variable growth by uneven water distribution due toinadequate levelling and variations in soil properties, but good water and salinity control can beachieved, if designed and operated properly (Shainberg and Oster, 1978). In furrow systems use ofclosed conduits instead of open waterways for laterals, reducing furrow lengths, and surge irrigationimprove performance. Subirrigation, in which the water table is maintained high enough so thecapillary fringe and the root zone coincide, is not suitable over the long term with saline water
16
(Rhoades and Loveday, 1990). Periodic flooding, along with crop rotation, is recommended for salinitycontrol for both furrow and trickle systems (Oster and Rhoades, 1985).
drainage managementDrainage, either artificial or natural, is an indispensable part of any irrigation area to remain viable inthe long term. Without drainage, groundwaters eventually rise to levels that allow salts to accumulate inthe soil and the root zone to become waterlogged. Water collected in drains can be reused for irrigationin lower fields, if necessary diluted with better-quality waters.
monitoringThe proper operation of a viable, permanently irrigated agriculture requires monitoring, providingperiodic information on the levels and distributions of soil salinity within the root zones and fields ofthe irrigated area. Direct monitoring of root zone salinity is recommended to evaluate the effectivenessof various management programs (Rhoades and Loveday, 1990).
Water Infiltration RateAn infiltration problem related to water quality occurs when the normal infiltration rate for the appliedwater or rainfall is appreciably reduced, and water infiltrates too slowly to supply the crop withsufficient water to maintain acceptable yields. The combination of salinity and high sodicity causes clayparticles to swell, and reduces the normal infiltration rate. Suspended solids further reduce the waterinfiltration rate of an already slowly permeable soil (Ayers and Westcot 1985).
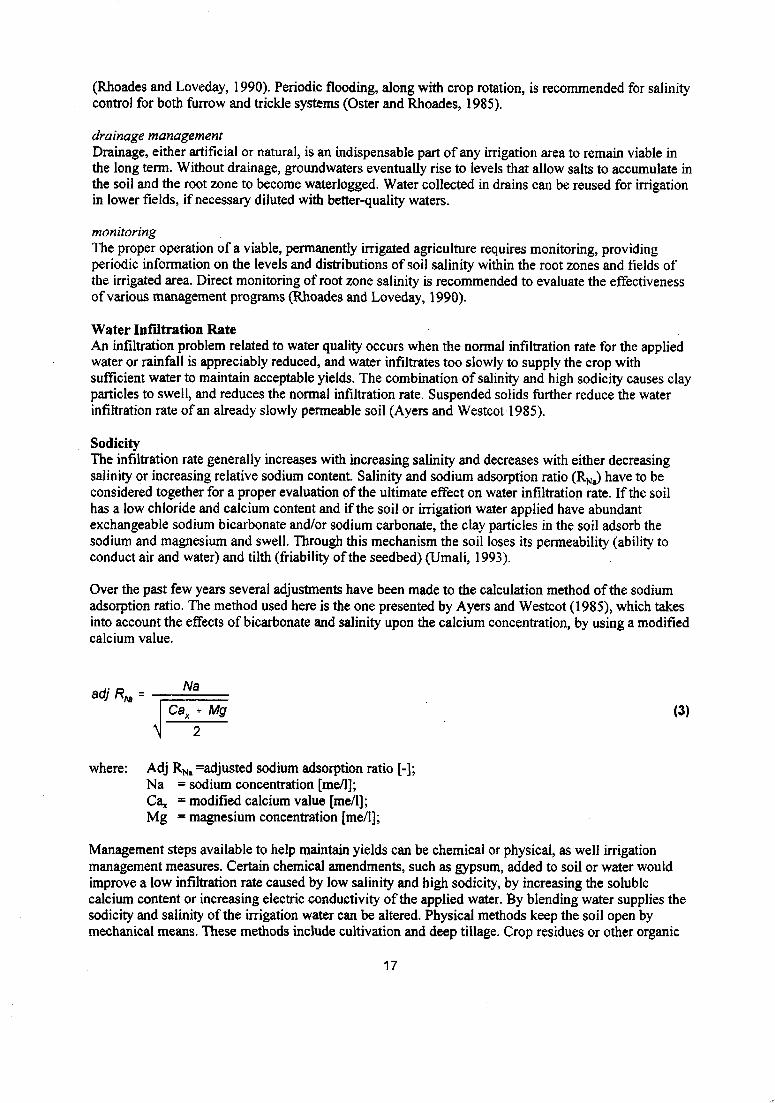
SodicityThe infiltration rate generally increases with increasing salinity and decreases with either decreasingsalinity or increasing relative sodium content. Salinity and sodium adsorption ratio (RNa) have to beconsidered together for a proper evaluation of the ultimate effect on water infiltration rate. If the soilhas a low chloride and calcium content and if the soil or irrigation water applied have abundantexchangeable sodium bicarbonate and/or sodium carbonate, the clay particles in the soil adsorb thesodium and magnesium and swell. Through this mechanism the soil loses its permeability (ability toconduct air and water) and tilth (friability of the seedbed) (Umali, 1993).
Over the past few years several adjustments have been made to the calculation method of the sodiumadsorption ratio. The method used here is the one presented by Ayers and Westcot (1985), which takesinto account the effects of bicarbonate and salinity upon the calcium concentration, by using a modifiedcalcium value.
Na
Cax + Mg (3)
where: Adj RNs =adjusted sodium adsorption ratio [-];Na = sodium concentration [me/1];Ca* = modified calcium value [me/1];Mg = magnesium concentration [me/1];
Management steps available to help maintain yields can be chemical or physical, as well irrigationmanagement measures. Certain chemical amendments, such as gypsum, added to soil or water wouldimprove a low infiltration rate caused by low salinity and high sodicity, by increasing the solublecalcium content or increasing electric conductivity of the applied water. By blending water supplies thesodicity and salinity of the irrigation water can be altered. Physical methods keep the soil open bymechanical means. These methods include cultivation and deep tillage. Crop residues or other organic
17
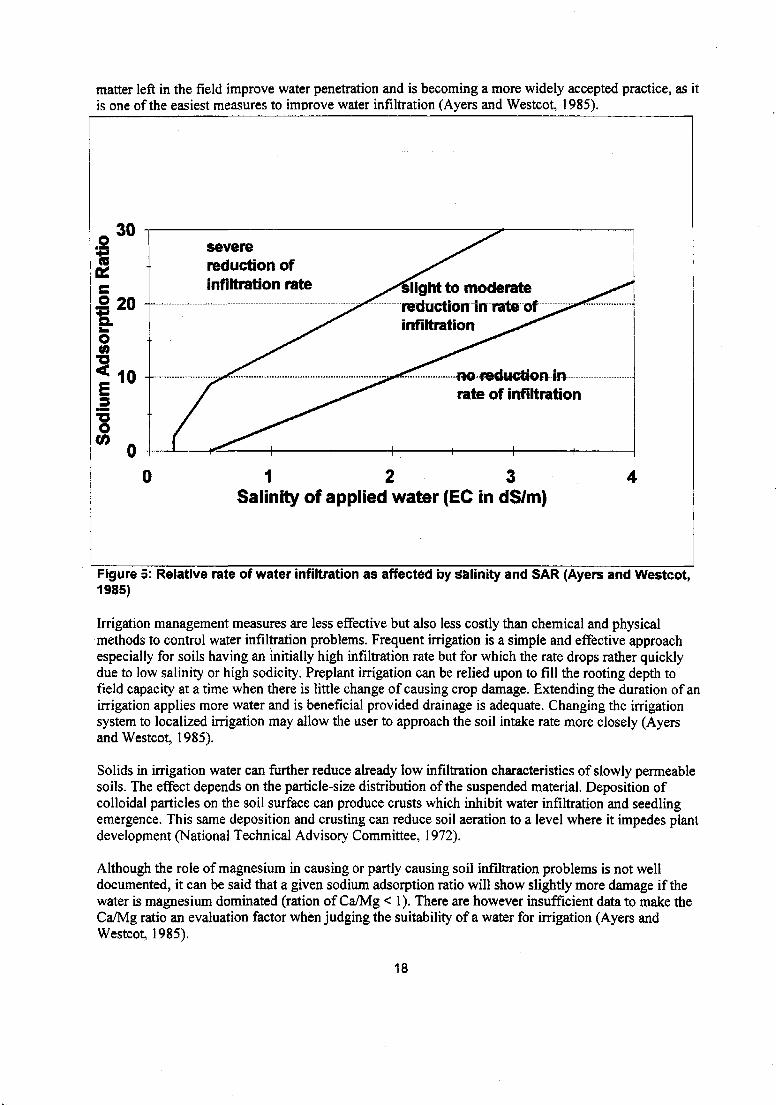
matter left in the field improve water penetration and is becoming a more widely accepted practice, as itis one of the easiest measures to improve water infiltration (Ayers and Westcot, 1985).
severereduction ofinfiltration rate light to moderate
reduction in rate ofinfiltration
-no reduction mrate of infiltration
1 2 3Salinity of applied water (EC in dS/m)
Figure 5: Relative rate of water infiltration as affected by salinity and SAR (Ayers and Westcot,1985)
Irrigation management measures are less effective but also less costly than chemical and physicalmethods to control water infiltration problems. Frequent irrigation is a simple and effective approachespecially for soils having an initially high infiltration rate but for which the rate drops rather quicklydue to low salinity or high sodicity. Preplant irrigation can be relied upon to fill the rooting depth tofield capacity at a time when there is little change of causing crop damage. Extending the duration of anirrigation applies more water and is beneficial provided drainage is adequate. Changing the irrigationsystem to localized irrigation may allow the user to approach the soil intake rate more closely (Ayersand Westcot, 1985).
Solids in irrigation water can further reduce already low infiltration characteristics of slowly permeablesoils. The effect depends on the particle-size distribution of the suspended material. Deposition ofcolloidal particles on the soil surface can produce crusts which inhibit water infiltration and seedlingemergence. This same deposition and crusting can reduce soil aeration to a level where it impedes plantdevelopment (National Technical Advisory Committee, 1972).
Although the role of magnesium in causing or partly causing soil infiltration problems is not welldocumented, it can be said that a given sodium adsorption ratio will show slightly more damage if thewater is magnesium dominated (ration of Ca/Mg < 1). There are however insufficient data to make theCa/Mg ratio an evaluation factor when judging the suitability of a water for irrigation (Ayers andWestcot, 1985).
18

ToxicityToxicity problems occur if certain ions in the soil or water are taken up by the plant and accumulate toconcentrations high enough to cause crop damage or yield reduction. A toxicity problem occurs withinthe plant itself and is not caused by a water shortage. The degree of damage depends on the uptake andthe crop sensitivity. Permanent crops are more sensitive than annual crops, because of possibleaccumulation of toxic ions.
The substances of primary concern are (1) specific ions, (2) trace elements, and (3) trace organics. Thespecific ions boron, chloride and sodium can be toxic by plant uptake and by absorption of leaves whenoverhead sprinkler irrigation is applied, both processes causing leaf burn. Specific ion toxicity iscommonly associated with woody species and rarely occurs among herbaceous plants (Shainberg andOster, 1978). Trace elements are toxic to plants at very low concentrations, but most irrigation suppliescontain very low concentrations of these trace elements. Wastewater however, especially fromindustrial sources, could contain harmful concentrations (Ayers and Westcot, 1985). Trace organics cancause environmental risks.
Specific ionsBoron is a constituent of practically all natural waters. It is essential for plant growth but is exceedinglytoxic at concentrations only slightly above optimum. Symptoms of boron toxicity include yellowing,spotting and drying of leaves. Sensitivity to boron varies widely, however, prolonged use of watercontaining boron levels exceeding 3 mg/1 is not generally recommended (Shainberg and Oster, 1978).Boron is not removed effectively during wastewater treatment (Page and Chang, 1985a).
Chloride is not adsorbed or held back by the soil and therefore is taken up by plants and accumulates inthe leaves. If the chloride concentration in the leaves exceeds the tolerance of the crop, injurysymptoms develop, such as leaf burn and drying of leaf tissue. Chloride tolerances vary: woody cropsand fruit crops are the more sensitive. (Ayers and Westcot, 1985; Rhoades and Loveday, 1990). Osterand Rhoades (1985) state that chloride is not toxic to vegetable, grain, forage or fiber crops.
Sodium not only affects soil permeability, but can also have a direct toxic effect. Typical toxicitysymptoms are stunted growth, leaf burn, scorch and dead tissue along the outside edges of the leaves(Shainberg and Oster, 1978, Ayers and Westcot, 1985). Direct toxicity effects related to sodium aregenerally limited to perennial woody species; injury is common in avocado, citrus, nuts, beans andstone-fruit trees (Ayers and Westcot, 1985; Oster and Rhoades, 1985; Rhoades and Loveday, 1990).Sodium toxicity is often modified or reduced if sufficient calcium is available in the soil. The measureused for sodium toxicity is the exchangeable sodium percentage (ESP) of the of the soil. Sugarcane issemi-tolerant to exchangeable sodium, its tolerance being 14-40 ESP, which is normally reached as thesodium adsorption ratio of irrigation water exceeds 13 me/1 (Ayers and Westcot, 1985).
Toxicity from boron, chloride and sodium can be controlled using cultural practices. Potentially toxicions can be reduced by leaching in a manner similar to that of salinity, but the depth of water requiredvaries with the toxic ion and may in some cases become excessive. Increasing the frequency ofirrigation supplies a greater proportion of the water needs from the upper soil, where toxic ionconcentration are generally lower. Toxicity problems can also be solved by stimulating vegetativegrowth by extra fertilization. Sodium toxicity from applied water can be countered by use of a soil orwater amendment such as gypsum. If these cultural practices can not counteract toxicity, either thewater supply should be blended or changed or the crop grown should be changed (Ayers and Westcot,1985).
A chloride or sodium toxicity can also occur by direct leaf absorption through leaves wetted duringoverhead sprinkler irrigation (foliar adsorption). Absorption and toxicity occur mostly during periods ofhigh temperature and low humidity (<30 percent), frequently aggravated by windy conditions. Rotating
19

sprinklers heads present the greatest risk, because water evaporates between rotations. High frequency(near daily) spray irrigation can also create problems. Crop tolerances to sodium and chloride insprinkler-applied irrigation are not well established and depending on climatic conditions (Ayers andWestcot, 1985). Foliar adsorption is negligible in sugarcane cultivation (Shainberg and Oster, 1978).
Trace elementsIn small quantities many elements are essential to biochemical growth, while others have nophysiological function; at a slightly higher concentration, many elements may become toxic to plants.The term trace element is used to denote a group of otherwise unrelated chemical elements present inthe natural environment in low concentrations. In the soil uncontrolled trace element inputs areundesirable, because once accumulated in the soil, these substances are in most cases practicallyimpossible to remove and may lead to toxicity to plants grown, exposure of humans through crops, andtransport to ground or surface water, thus making this water unfit for its intended use (Page and Chang,1985a).
Trace elements are effectively removed from wastewater by removal of suspended solids. Among thetrace elements commonly found in municipal wastewater, cadmium, copper, nickel and zinc areconsidered to present a potentially serious hazard if they are introduced into the cropland in anuncontrolled manner. Following common crop production practices, manganese, iron, aluminum,chromium, arsenic, selenium, and lead inputs through application of treated domestic wastewater toland should not result in toxicity or expose humans to potentially hazardous trace elements levels (Pageand Chang, 1985a).
Since trace elements concentrations of wastewater vary considerably, it is essential that croplandirrigation operations should be evaluated case by case. Various organizations have made systems ofguidelines for irrigation water quality regarding trace elements. These threshold limits are intended toprotect even the most sensitive plants from harmful effects. Page and Chang (1985a) state that watercontaining higher concentrations may be suitable for irrigation if their use is carefully planned andmanaged. A review of existing guidelines is given in table 5, appendix VII.
Trace organicsTrace organics are those organic substances that are present in seemingly uncontamined water ortreated wastewater effluents in extremely low concentrations. As they are only discovered quiterecently, data on these substances are scarce. Conventional wastewater treatment processes greatlyreduce the number and concentrations of trace organics and the environmental risk should not begreater than that associated with using surface water, which also contains trace organics. Environmentalimpacts associated with the application of pesticides outrank these of the use of reclaimed wastewater(Page and Chang, 1985b).
MiscellaneousThree other parameters cause damage to crops and soils besides salinity, reduction of water infiltrationrate, and toxicity: high nitrogen concentrations, high BOD-concentrations, and scale formation. Highnitrogen concentrations can cause excessive vegetative growth and delayed crop maturity. High BOD-concentrations indicate high biodegradable organics concentrations, which can cause oxygen deficits inthe soil. White scale formation on fruit or leaves can result from overhead sprinkler irrigation with highbicarbonate water, water containing gypsum, or water high in iron.
Nitrogen is a plant nutrient and stimulates crop growth. Natural soil nitrogen or added fertili2ers are theusual sources, but nitrogen in the irrigation water has much the same effect as soil-applied fertilizer
20
nitrogen. Excess nitrogen in irrigation water causes problems, just as too much fertilizer. If excessivequantities are present or applied, production of several commonly grown crops may be upset because ofover-stimulation of growth, delayed maturity or poor quality. Total nitrogen concentrations of less than5 mg/1 has little effect, even on nitrogen sensitive crops. Sensitive crops may be affected by totalnitrogen concentrations above 5 mg/1; most other crops are relatively unaffected until total nitrogenexceeds 30 mg/1. Fertilizer requirements of sugarcane are high, and sugarcane can be regarded astolerant to high nitrogen levels (Jones et al-, 1990). The sensitivity of the crop varies with the growingstage. High nitrogen levels are beneficial during early growth stages, but may cause yield losses duringthe later flowering and fruiting stages. Blending or changing supplies during the later more criticalgrowth stages should be helpful. For crops irrigated with water containing nitrogen, the rates ofnitrogen fertilizer supplied to the crop can be reduced by an amount very nearly equal to that availablefrom the water supply (Ayers and Westcot, 1985).
Nitrogen in wastewater applied to land is subject to leaching if not intercepted by plants roots,immobilized by microorganisms, or denitrified. Eutrophication, the accumulation of nitrogen in surfacewater and groundwater can cause algal bloom and subsequent O2 depletion in surface water. It mayresult in fish kills, and a decrease in esthetic and recreational value. Nitrates may accumulate ingroundwater and present a public health problem, especially to infants younger than 12 weeks of age(Hornsby, 1990). However, the contribution of surface-applied nitrogen to this accumulation is not welldefined. Estimates of the quantity of nitrogen leached in a given situation can be made by subtractingnitrate utilized by the crop from the total nitrogen applied and then using a reasonable estimate ofdenitrification loss to adjust the remainder (Broadbent and Reisenauer, 1985).
The significance of BOD-values of irrigation water has not been fully assessed, though soil aeration andoxygen availability are reckoned to be a factor deterring plant growth. BOD is not likely to be aproblem were sprinkler irrigation, which provides considerable aeration, is used and adequate drainageis provided. The National Technical Advisory Committee (1972) does not prescribe specific criteria,because of insufficient information. Shelef et al. (1987) quote Israeli limits varying from 25 to 60 mg/1depending on the crop. Arthur (1983) and Culp and Hinrichs (1981) suggest a maximum BOD-concentration of 35 mg/1 for irrigation, the US Department of the Interior (1966) suggests an evenlower limit of 20 mg/1, other sources do not set BOD-limits.
Irrigation water containing a high proportion of slightly soluble salts such as calcium, bicarbonate andsulphate presents a problem of white scale formation on leaves or fruit when sprinklers are used.Calcium deposits form even at very low concentrations if sprinklers are used during periods of very lowhumidity (< 30 percent), resulting in a high rate of evapotranspiration. Management options to avoiddeposit problems included adding acid material to high calcium water, irrigation at night, increase ofthe speed of sprinkler rotation, and decrease of irrigation frequency (Ayers and Westcot, 1985).
2.3.3 Prevention of Nuisance Conditions during Storage and OperationPoor quality irrigation water can create problems in operation and maintenance of the irrigation system.The major problems that can occur are: water-induced corrosion, clogging of equipment by suspendedsolids, and nuisance growth of algae and plants.
Due to water-induced corrosion or encrustation deterioration of equipment can occur. This problem ismost serious for wells and pumps, but a poor quality water can also damage irrigation equipment andcanals. Low pH water is very corrosive and may rapidly corrode pipelines, sprinklers and controlequipment (Ayers and Westcot, 1985).
Suspended solids cause problems in irrigation systems through clogging of gates, sprinkler heads anddrippers and sedimentation of canals and ditches. This can cause costly dredging and maintenanceproblems (Ayers and Westcot, 1985). On the other hand suspended solids are fertile particles that are
21

beneficial to plant growth, and care should be taken to transport fertile solids to the irrigated fields.Small particles of suspended solids can penetrate the canal walls and bottom and thus decreasepermeability and seepage (auto-colmatage) (FAO/UNESCO, 1973). Where sprinkler irrigation is useddeposition on leaf surfaces could occur, which could reduce photosynthetic activity and therefore detergrowth (National Technical Advisory Committee, 1972). Ayers and Westcot (1985) suggest a TSS limitof 50 mg/1 for trickle irrigation systems, and more flexible limits for sprinkler and gravity systems. Culpand Hinrichs (1981) quote a value of 50 mg/1, regardless of the distribution system. Shelef et al. (1987)quote Israeli maxima of 20 to 50 mg/1, depending on the crop (see table 49, appendix VII). Telsch et al.(1991) stress the importance of clogging capacity of reclaimed wastewater as a quality criteria for dripirrigation, but propose other parameters, such as filterability tests for evaluation of water quality.
Nitrogen may stimulate nuisance growth of algae and plants, which clogs equipment, decreases channelcapacity and increases maintenance costs. Very low nitrogen concentrations (< 5 mg/1) can causenuisance growth, especially when temperature, sunlight, and other nutrients are optimum. Nitrogenproblems can either be managed by mechanical controls such as screens and filters or chemical controlwith materials such as copper sulphate. (Ayers and Westcot, 1985). The National Technical AdvisoryCommittee (1972) states a maximal nitrogen concentration of 45 mg/1.
2.4 Macrophyte-Based Treatment Systems
Macrophyte-based are natural wastewater treatment systems in which aquatic macrophytes (wetlandsplants, which are adapted to growing in water saturated soils) have a key function in relation to thecleaning of wastewater (Brix, 1993). This paragraph discusses the differences between natural andmechanized systems (§2.4.1); the definition of macrophyte-based treatment systems (§2.4.2), fourexamples of macrophyte-based treatment system (§2.4.3-§2.4.6), and a comparison of these systems(§2.4.7).
2.4.1 Natural versus Mechanized TreatmentBiotechnical systems for wastewater treatment can roughly be grouped into two categories: (1)mechanized systems and (2) natural wastewater systems. All biotechnical systems depend on naturalresponses such as gravity forces for sedimentation, or on natural components such as biologicalorganisms; natural treatment systems are systems that depend primarily on their natural components toachieve the intended purpose of treating wastewater.
Natural treatment systems offer effective and reliable wastewater treatment and have several advantagesand disadvantages when compared to mechanized systems. Natural systems are relatively inexpensiveto construct and operate and easy to maintain. They are relatively tolerant of fluctuating hydrologicaland contaminant loading rates and may provide indirect benefits such as green space, wildlife habitats,and recreational and educational areas. In general natural systems are favored in tropical climates: dueto the higher temperature of the sewage, most bioconversion processes are accelerated which may resultin cost savings. Furthermore in tropical countries land and unskilled labor are often comparativelycheaper than equipment. Land prices largely determine investments in natural treatment systems.Arthur (1983) estimated the break-even point, above which the choice of a mechanized system becomespreferable, at about US$8 per square meter. Disadvantages of natural systems for wastewater treatmentcompared to conventional systems include: relatively large land area requirements for advancedtreatment; current imprecise design and operating criteria; biological and hydrological complexity; lackof understanding of important process dynamics; and possible problems with pests. In moderateclimates natural technologies are often not advocated as their performance is very low at winter periodsand land costs are comparatively high (Hammer and Bastían, 1989; Al-Nozaily, 1995).
22
2.4.2 Natural treatment: Macrophyte-based SystemsNatural wastewater treatment technology is emerging as a low-cost, easily operated efficient alternativeto conventional treatment systems for a wide variety of wastewaters (Watson et al., 1989). There areseveral systems of categorizing natural treatment systems: Reed et al. divide natural systems in threemajor categories: aquatic, terrestrial, and wetlands concepts; others classify systems according to thelife form present in the system (Pescod and Mara, 1988; Brix, 1993). Natural treatment systems canalso be divided hydrologically, into discharging systems (with an outfall or other direct discharge) andnondischarging systems (Reed et al., 1995). I differentiate according to the life form between pondsystems with floating macrophytes (hyacinth ponds and duckweed ponds), and wetlands with rootedmacrophytes (free water surface wetlands and subsurface flow wetlands).
Wastewater stabilization ponds have been in operation for many years. One of their drawbacks is,however, the presence of algae in the effluent. This reduces treatment efficiencies of suspended solids,and pond effluent therefore is sometimes not suitable for use in irrigation. Recently other naturaltreatment concepts, which produce effluent with no algae present, have been put into practice,especially macrophyte-based systems, such as hyacinth ponds, duckweed ponds and constructedwetlands. Information on these systems is limited and sometimes inconsistent: their greatest drawbackis the lack of detailed information from long-term experience (Pescod and Mara, 1988; Hammer andBastian, 1989; Sapkota and Bavor, 1994).
Macrophyte-based wastewater treatment systems are defined as natural wastewater treatment systems inwhich aquatic macrophytes (wetlands plants, which are adapted to growing in water saturated soils)have a key function in relation to the cleaning of wastewater (Brix, 1993). Macrophyte-based treatmentsystems removed pollutants by a complex variety of biological, chemical and physical processes,including sedimentation, filtration, soil adsorption, microbiological degradation, (de)nitrification,natural die-off and plant uptake. Macrophytes remove pollutants by assimilating them into their tissueand by providing surfaces and suitable environment for microorganisms to transform pollutants.Oxygen transfer into the rootzone contributes to pollutant removal, by creating an aerobic environmentfor certain bacteria. Most macrophyte-based systems serve two purposes: wastewater treatment and theproduction of biomass. Typical biomass crops yielded include: reeds for thatching, building andmatting, wood for building, plants for animal feeding, and biomass for production of biogas. Somenatural treatment systems serve as a wildlife habitat (Hillman and Culley, 1978; Pescod and Mara,1988). It is not clear if natural systems can be optimized for both waste treatment and proteinproduction at the same time (Reed et al., 1995).
Macrophyte-based treatment systems may be classified according to the life form of the dominatingmacrophyte into (Brix, 1993):
Free-floating macrophyte-based treatment systems: hyacinth and duckweed ponds;Rooted emergent macrophyte-based wastewater treatment systems: free water surface andsubsurface flow wetlands;Submerged macrophyte-based wastewater treatment systems;
The latter type, submerged macrophyte-based systems is not discussed here. Submerged systems areponds with small plants which are entirely submerged; these plants are not considered a useful crop andharvesting is only carried out for maintenance purposes (Brix, 1993). This concept therefore does notmeet the criteria set for the pré-irrigation treatment to be designed.
Free floating macrophyte-based systems are aquatic wastewater treatment systems. Some sources lookupon them as upgraded wastewater stabilization ponds (Pescod and Mara, 1988), others as a kind ofwetlands (Brix, 1993), others as a separate kind of treatment concept (Reed et al., 1995). A free floatingmacrophyte-based wastewater treatment system typically consists of an anaerobic pond, a maturationpond, and one or more maturation ponds covered with free floating macrophytes. No design for floatingmacrophyte ponds has been sufficiently evaluated to confirm its long term efficiency in operation, butwaste stabilization pond design concepts are used for the largest part. Free floating macrophytes are
23
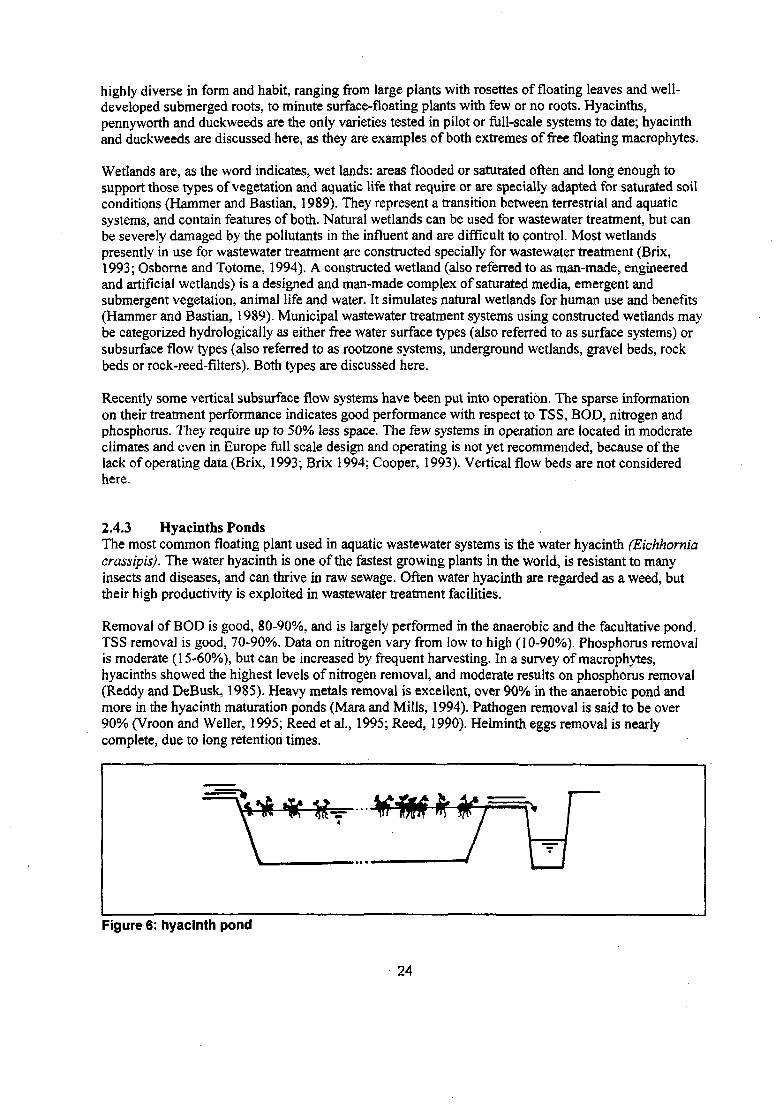
highly diverse in form and habit, ranging from large plants with rosettes of floating leaves and well-developed submerged roots, to minute surface-floating plants with few or no roots. Hyacinths,pennyworth and duckweeds are the only varieties tested in pilot or full-scale systems to date; hyacinthand duckweeds are discussed here, as they are examples of both extremes of free floating macrophytes.
Wetlands are, as the word indicates, wet lands: areas flooded or saturated often and long enough tosupport those types of vegetation and aquatic life that require or are specially adapted for saturated soilconditions (Hammer and Bastian, 1989). They represent a transition between terrestrial and aquaticsystems, and contain features of both. Natural wetlands can be used for wastewater treatment, but canbe severely damaged by the pollutants in the influent and are difficult to control. Most wetlandspresently in use for wastewater treatment are constructed specially for wastewater treatment (Brix,1993; Osborne and Totome, 1994). A constructed wetland (also referred to as man-made, engineeredand artificial wetlands) is a designed and man-made complex of saturated media, emergent andsubmergent vegetation, animal life and water. It simulates natural wetlands for human use and benefits(Hammer and Bastian, 1989). Municipal wastewater treatment systems using constructed wetlands maybe categorized hydrologically as either free water surface types (also referred to as surface systems) orsubsurface flow types (also referred to as rootzone systems, underground wetlands, gravel beds, rockbeds or rock-reed-filters). Both types are discussed here.
Recently some vertical subsurface flow systems have been put into operation. The sparse informationon their treatment performance indicates good performance with respect to TSS, BOD, nitrogen andphosphorus. They require up to 50% less space. The few systems in operation are located in moderateclimates and even in Europe full scale design and operating is not yet recommended, because of thelack of operating data (Brix, 1993; Brix 1994; Cooper, 1993). Vertical flow beds are not consideredhere.
2.4.3 Hyacinths PondsThe most common floating plant used in aquatic wastewater systems is the water hyacinth (Eichhorniacrassipis). The water hyacinth is one of the fastest growing plants in the world, is resistant to manyinsects and diseases, and can thrive in raw sewage. Often water hyacinth are regarded as a weed, buttheir high productivity is exploited in wastewater treatment facilities.
Removal of BOD is good, 80-90%, and is largely performed in the anaerobic and the facultative pond.TSS removal is good, 70-90%. Data on nitrogen vary from low to high (10-90%). Phosphorus removalis moderate (15-60%), but can be increased by frequent harvesting. In a survey of macrophytes,hyacinths showed the highest levels of nitrogen removal, and moderate results on phosphorus removal(Reddy and DeBusk, 1985). Heavy metals removal is excellent, over 90% in the anaerobic pond andmore in the hyacinth maturation ponds (Mara and Mills, 1994). Pathogen removal is said to be over90% (Vroon and Weller, 1995; Reed et al., 1995; Reed, 1990). Helminth eggs removal is nearlycomplete, due to long retention times.
Figure 6: hyacinth pond
24
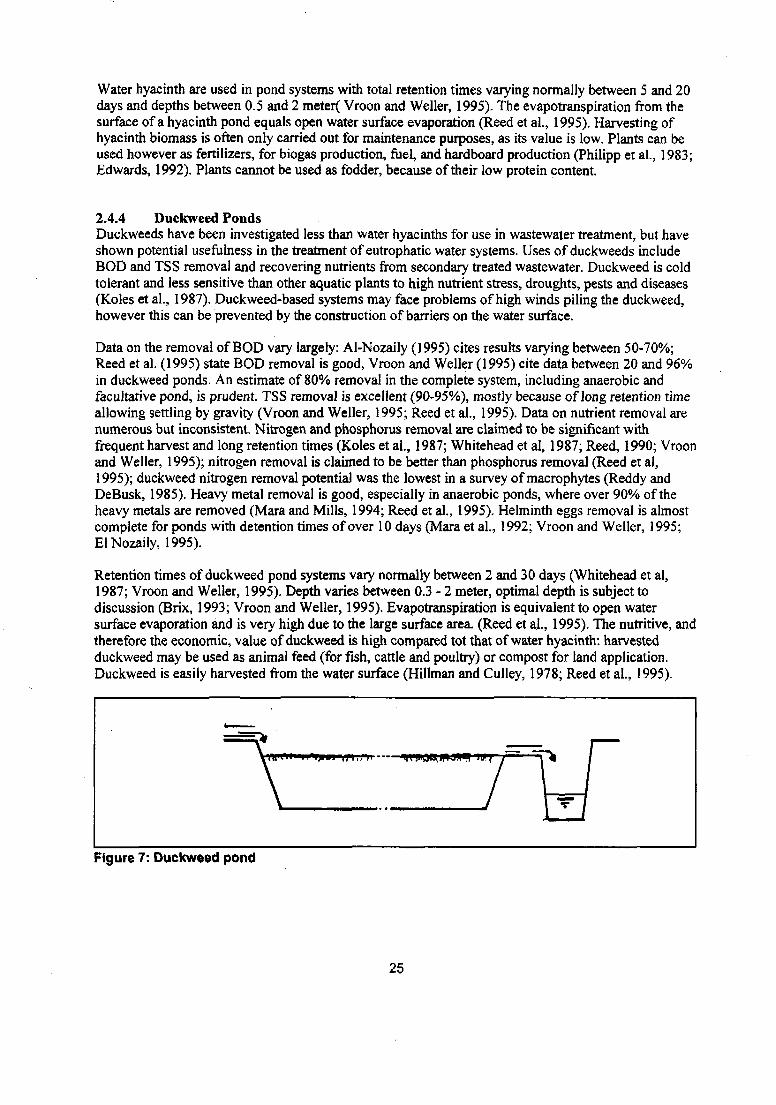
Water hyacinth are used in pond systems with total retention times varying normally between 5 and 20days and depths between 0.5 and 2 meter( Vroon and Weller, 1995). The evapotranspiration from thesurface of a hyacinth pond equals open water surface evaporation (Reed et al., 1995). Harvesting ofhyacinth biomass is often only carried out for maintenance purposes, as its value is low. Plants can beused however as fertilizers, for biogas production, fuel, and hardboard production (Philipp et al., 1983;Edwards, 1992). Plants cannot be used as fodder, because of their low protein content.
2.4.4 Duckweed PondsDuckweeds have been investigated less than water hyacinths for use in wastewater treatment, but haveshown potential usefulness in the treatment of eutrophatic water systems. Uses of duckweeds includeBOD and TSS removal and recovering nutrients from secondary treated wastewater. Duckweed is coldtolerant and less sensitive than other aquatic plants to high nutrient stress, droughts, pests and diseases(Koles et al., 1987). Duckweed-based systems may face problems of high winds piling the duckweed,however this can be prevented by the construction of barriers on the water surface.
Data on the removal of BOD vary largely: Al-Nozaily (1995) cites results varying between 50-70%;Reed et al. (1995) state BOD removal is good, Vroon and Weller (1995) cite data between 20 and 96%in duckweed ponds. An estimate of 80% removal in the complete system, including anaerobic andfacultative pond, is prudent. TSS removal is excellent (90-95%), mostly because of long retention timeallowing settling by gravity (Vroon and Weller, 1995; Reed et al., 1995). Data on nutrient removal arenumerous but inconsistent. Nitrogen and phosphorus removal are claimed to be significant withfrequent harvest and long retention times (Koles et al., 1987; Whitehead et al, 1987; Reed, 1990; Vroonand Weller, 1995); nitrogen removal is claimed to be better than phosphorus removal (Reed et al,1995); duckweed nitrogen removal potential was the lowest in a survey of macrophytes (Reddy andDeBusk, 1985). Heavy metal removal is good, especially in anaerobic ponds, where over 90% of theheavy metals are removed (Mara and Mills, 1994; Reed et al., 1995). Helminth eggs removal is almostcomplete for ponds with detention times of over 10 days (Mara et al., 1992; Vroon and Weller, 1995;EINozaily, 1995).
Retention times of duckweed pond systems vary normally between 2 and 30 days (Whitehead et al,1987; Vroon and Weller, 1995). Depth varies between 0.3 - 2 meter, optimal depth is subject todiscussion (Brix, 1993; Vroon and Weller, 1995). Evapotranspiration is equivalent to open watersurface evaporation and is very high due to the large surface area. (Reed et a]., 1995). The nutritive, andtherefore the economic, value of duckweed is high compared tot that of water hyacinth: harvestedduckweed may be used as animal feed (for fish, cattle and poultry) or compost for land application.Duckweed is easily harvested from the water surface (Hillman and Culley, 1978; Reed et al., 1995).
Figure 7: Duckweed pond
25
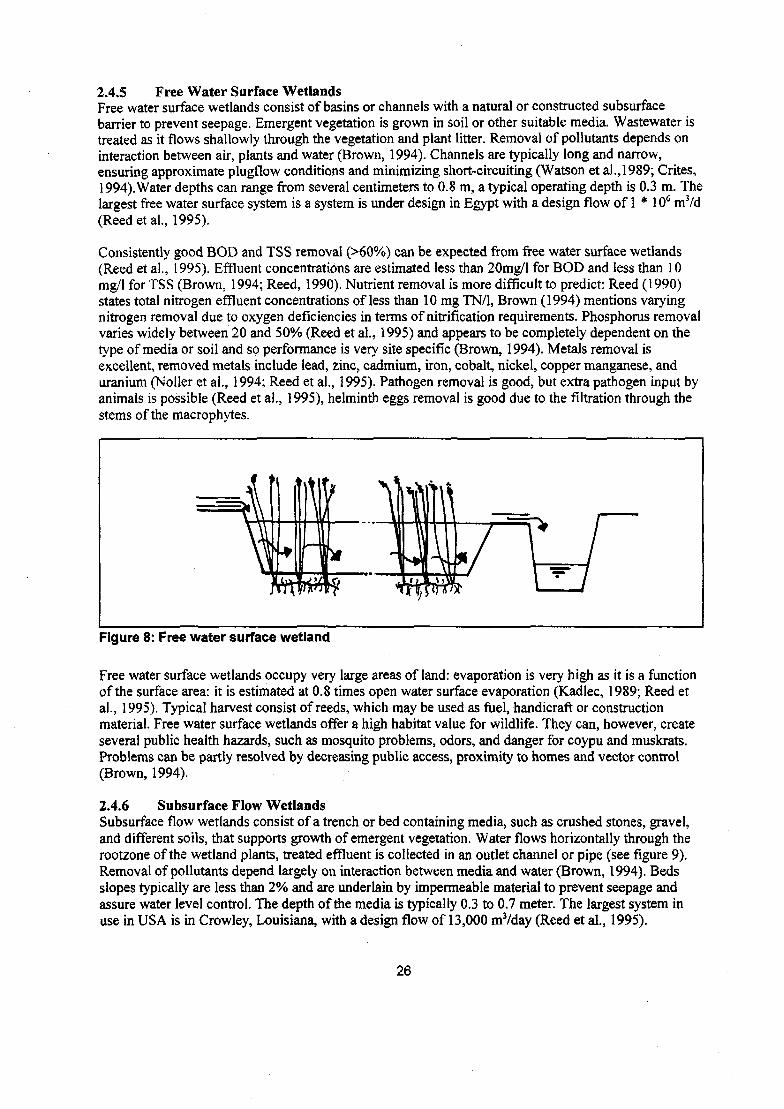
2.4.5 Free Water Surface WetlandsFree water surface wetlands consist of basins or channels with a natural or constructed subsurfacebarrier to prevent seepage. Emergent vegetation is grown in soil or other suitable media. Wastewater istreated as it flows shallowly through the vegetation and plant litter. Removal of pollutants depends oninteraction between air, plants and water (Brown, 1994). Channels are typically long and narrow,ensuring approximate plugflow conditions and minimizing short-circuiting (Watson et al., 1989; Crites,1994). Water depths can range from several centimeters to 0.8 m, a typical operating depth is 0.3 m. Thelargest free water surface system is a system is under design in Egypt with a design flow of 1 * 106 mVd(Reed et al., 1995).
Consistently good BOD and TSS removal (>60%) can be expected from free water surface wetlands(Reed et al., 1995). Effluent concentrations are estimated less than 20mg/l for BOD and less than 10mg/1 for TSS (Brown, 1994; Reed, 1990). Nutrient removal is more difficult to predict: Reed (1990)states total nitrogen effluent concentrations of less than 10 mg TN/1, Brown (1994) mentions varyingnitrogen removal due to oxygen deficiencies in terms of nitrification requirements. Phosphorus removalvaries widely between 20 and 50% (Reed et al., 1995) and appears to be completely dependent on thetype of media or soil and so performance is very site specific (Brown, 1994). Metals removal isexcellent, removed metals include lead, zinc, cadmium, iron, cobalt, nickel, copper manganese, anduranium (Noller et al., 1994; Reed et al., 1995). Pathogen removal is good, but extra pathogen input byanimals is possible (Reed et al., 1995), helminth eggs removal is good due to the filtration through thestems of the macrophytes.
Figure 8: Free water surface wetland
Free water surface wetlands occupy very large areas of land: evaporation is very high as it is a functionof the surface area: it is estimated at 0.8 times open water surface evaporation (Kadlec, 1989; Reed etal., 1995). Typical harvest consist of reeds, which may be used as fuel, handicraft or constructionmaterial. Free water surface wetlands offer a high habitat value for wildlife. They can, however, createseveral public health hazards, such as mosquito problems, odors, and danger for coypu and muskrats.Problems can be partly resolved by decreasing public access, proximity to homes and vector control(Brown, 1994).
2.4.6 Subsurface Flow WetlandsSubsurface flow wetlands consist of a trench or bed containing media, such as crushed stones, gravel,and different soils, that supports growth of emergent vegetation. Water flows horizontally through therootzone of the wetland plants, treated effluent is collected in an outlet channel or pipe (see figure 9).Removal of pollutants depend largely on interaction between media and water (Brown, 1994). Bedsslopes typically are less than 2% and are underlain by impermeable material to prevent seepage andassure water level control. The depth of the media is typically 0.3 to 0.7 meter. The largest system inuse in USA is in Crowley, Louisiana, with a design flow of 13,000 mVday (Reed et al., 1995).
26
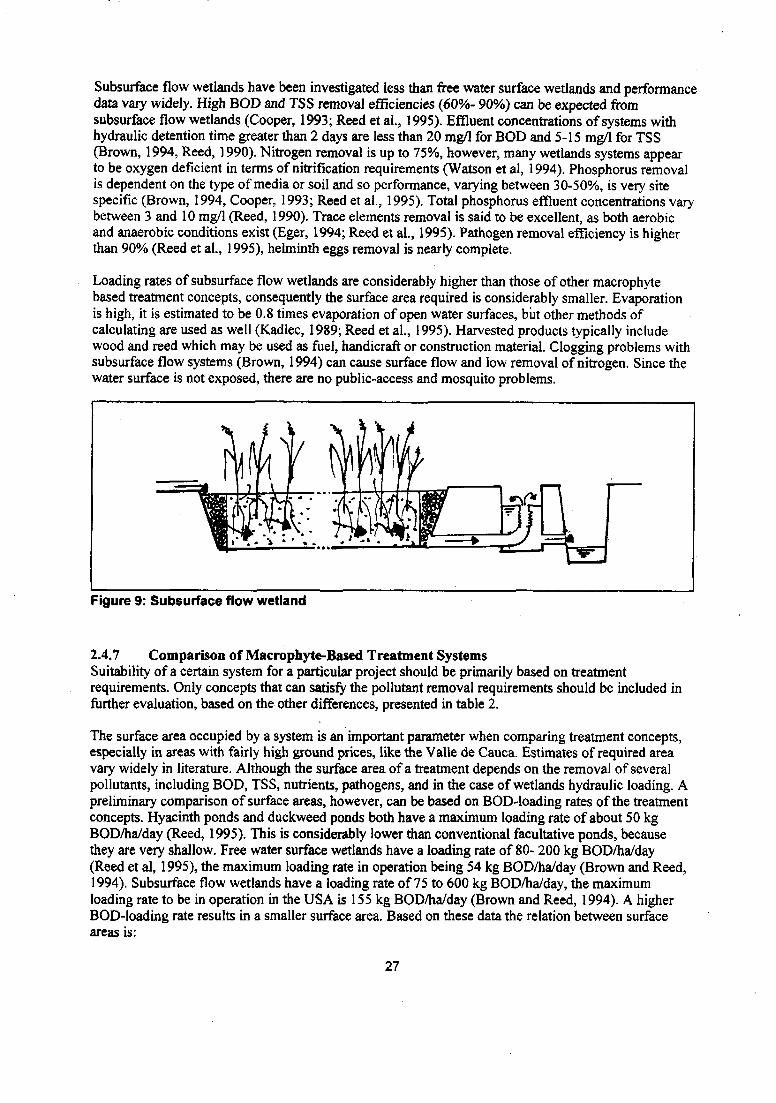
Subsurface flow wetlands have been investigated less than free water surface wetlands and performancedata vary widely. High BOD and TSS removal efficiencies (60%- 90%) can be expected fromsubsurface flow wetlands (Cooper, 1993; Reed et al., 1995). Effluent concentrations of systems withhydraulic detention time greater than 2 days are less than 20 mg/1 for BOD and 5-15 mg/1 for TSS(Brown, 1994, Reed, 1990). Nitrogen removal is up to 75%, however, many wetlands systems appearto be oxygen deficient in terms of nitrification requirements (Watson et al, 1994). Phosphorus removalis dependent on the type of media or soil and so performance, varying between 30-50%, is very sitespecific (Brown, 1994, Cooper, 1993; Reed et al., 1995). Total phosphorus effluent concentrations varybetween 3 and 10 mg/1 (Reed, 1990). Trace elements removal is said to be excellent, as both aerobicand anaerobic conditions exist (Eger, 1994; Reed et al., 1995). Pathogen removal efficiency is higherthan 90% (Reed et al., 1995), helminth eggs removal is nearly complete.
Loading rates of subsurface flow wetlands are considerably higher than those of other macrophytebased treatment concepts, consequently the surface area required is considerably smaller. Evaporationis high, it is estimated to be 0.8 times evaporation of open water surfaces, but other methods ofcalculating are used as well (Kadlec, 1989; Reed et al., 1995). Harvested products typically includewood and reed which may be used as fuel, handicraft or construction material. Clogging problems withsubsurface flow systems (Brown, 1994) can cause surface flow and low removal of nitrogen. Since thewater surface is not exposed, there are no public-access and mosquito problems.
Figure 9: Subsurface flow wetland
2.4.7 Comparison of Macrophyte-Based Treatment SystemsSuitability of a certain system for a particular project should be primarily based on treatmentrequirements. Only concepts that can satisfy the pollutant removal requirements should be included infurther evaluation, based on the other differences, presented in table 2.
The surface area occupied by a system is an important parameter when comparing treatment concepts,especially in areas with fairly high ground prices, like the Valle de Cauca. Estimates of required areavary widely in literature. Although the surface area of a treatment depends on the removal of severalpollutants, including BOD, TSS, nutrients, pathogens, and in the case of wetlands hydraulic loading. Apreliminary comparison of surface areas, however, can be based on BOD-loading rates of the treatmentconcepts. Hyacinth ponds and duckweed ponds both have a maximum loading rate of about 50 kgBOD/ha/day (Reed, 1995). This is considerably lower than conventional facultative ponds, becausethey are very shallow. Free water surface wetlands have a loading rate of 80- 200 kg BOD/ha/day(Reed et al, 1995), the maximum loading rate in operation being 54 kg BOD/ha/day (Brown and Reed,1994). Subsurface flow wetlands have a loading rate of 75 to 600 kg BOD/ha/day, the maximumloading rate to be in operation in the USA is 155 kg BOD/ha/day (Brown and Reed, 1994). A higherBOD-loading rate results in a smaller surface area. Based on these data the relation between surfaceareas is:
27

hyacinth p o n d : duckweed p o n d :free water surface wetland : subsurface flow wetland = 3 : 3 : 3 : 1
All macrophyte-based wastewater treatment systems are cheap to construct, to maintain and to operate,when compared to conventional systems. Some cost estimates do exist, but they are hard to compare asall of them do include different parts of the treatment system, and are made in various years andcountries. The actual construction and operation cost will depend largely on local circumstances.
Construction costs of hyacinth ponds, duckweed ponds and free water surface wetlands per m2 arecomparable, while costs of subsurface flow wetlands are higher, as they involve the purchase of vastvolumes of gravel media. Construction costs of pond systems in the USA are reported to be 500-1000USS per mVday (Reed 1990). Construction costs of wetland systems in the USA are reported to be inthe range of US$ 20-2000 per mVday (Reed 1990; Brown, 1994; Brown and Reed, 1994). Somesources state that construction costs of subsurface flow wetlands per m2 are up to 50% higher than thoseof free water surface wetlands because of the cost of placing of medium.
Table 2: Comparison
Removal
BOD
TSS
Nitrogen
Phosphorus
Conform
Helminth eggs
Trace elements
Tropical experience
Area of land
Temperature
Construction costs
Operation costs
sludge removal
Products yielded
Harvesting
Public health risks
Environmental value
of macrophyte-based treatment concepts
Hyacinth ponds
good
good
moderate to good
moderate
excellent
excellent
excellent
moderate
very large
desirable 20-30°C; survival >10°C
very low
low
every 2-3 years
low value(hyacinths)
difficult
moderate
low mosquitoproblems, hyacinthis weed in thetropics
Duckweed ponds
moderate to good
excellent
poor to good
inconsistent data
moderate
excellent
good
moderate
very large
optimum 20-30 °C;survival 5-33°C
very low
low
every 2-3 years
moderate value(duckweed)
easy
moderate
lowodor problems mayoccur
Free watersurface wetlands
good
good
moderate to good
inconsistent data
good
good
excellent; limited data
scarce
very large
the higher the better
very low
low
no removal
moderate value(reed)
difficult
moderate
high
Subsurface flowwetlands
good
excellent
moderate to good
inconsistent data
good
excellent
excellent; limiteddata
scarce
large
the higher thebetter
low
low
no removal;clogging problemsmay occur
moderate value,wide variety (reedor wood)
easy
low
moderate
28
3 Evaluation of Project Feasibility: Methods and Criteria
The evaluation of the alternatives will consist of a financial cost-benefit-analysis and a checklist for theevaluation of impacts which are hard to express in financial terms. These impacts include effectivity;technical and regulatory feasibility; social impacts; and environmental impacts. The judgment of thefeasibility of a reuse project should be based on a comparison with other possible solutions for theproblems stated, using a set of criteria which regards all results caused by the implementation of theproject. Treatment costs have to be balanced against public health risk and agricultural risks.
The feasibility of a reuse project depends on two values: the "sanitary" value and the "agricultural"value. The "sanitary" is the value of diminishing (treatment to prevent) contamination of naturalresources, and can be estimated by the value of alternative treatment systems. The "agricultural" is thevalue of providing an alternative water resource for agriculture and can be estimated by the price ofexisting resources.
In the past many projects have emphasized financial criteria, while smaller projects have been aiming atenvironmental or social objectives, without taking into consideration the financial factors. Both kind ofprojects have not met expectations. A remarkable consensus has been emerging in recent years formanaging water resources on an efficient, equitable and sustainable basis. At the 1992 DublinInternational Conference on Water and Sustainable Development the idea was established that freshwater is a finite and vulnerable resource and should be recognized as an economic good (DICWSD,1992; Serageldin, 1994).
3.1 Cost-Benefit-Analysis: Financial Aspects
A cost-benefit-analysis lists ail costs and benefits per alternative, and thus provides a price label foreach alternative. The economic criterion is a maximum benefit-cost-ratio. A wastewater reuse project isnot likely to make a profit. It could, however, generate less costs than the sum of a separate treatmentsystem and a separate irrigation scheme.
Costs and benefits are stated in US dollars, because this currency is internationally accepted. The lifespan of all alternatives is 20 years, after which the investment do not have a rest value. The interest rateis set at 24%; inflation at 21%. The real interest rate is 3%. The inflation rate in Cali over the past fiveyears was 21%, and it is expected that this inflation will stay the same in the coming years.
The net present value method is used in order to take the time value of money into account. In thismethod the value of all expenditures and revenues in the past and in the future are determined at onedefinite point and time. For a series of annual payments in the future the net present value is given inequation 4 (Brouwer, 1993; Blokland and Trifunovic, 1994). The net present value at the first of May1996 will be calculated for all costs.
m
where: Wh = net present value [US$];= annual payment [US$];- real interest rate [-];
29

The benefit-cost-ratio is the quotient of the total benefits and the total costs (see equation 5). The cost-benefit-ratio is 1, if total benefits equal total costs. If the benefit-cost-ratio is smaller than 1, the costsare larger than the benefits and the investment is loss-making. If the benefit-cost-ratio is more than 1,the benefits outweigh the costs and the investment is profitable (Brouwer, 1993).
BIC-ratio - Z benefits . (5)I costs l '
The cost-benefit-analysis will only regard financial (investment and annual) costs. Investment costsconsist of the acquisition of land, and the contraction costs for the construction of the system. Annualcosts include energy costs, operation, and maintenance costs. Opportunity costs (the cost of water as aninput) are not rated in the analysis. In irrigation the opportunity costs are a considerable fraction of totalcosts, especially in situations of water scarcity.
3.2 Qualitative Checklist
I have chosen to use a checklist in which an aspect can be rated desirable (+), no influence (0) andunwanted (-). A checklist consists of a list of impacts on one axis and quantitative and qualitativeconclusions on the other axis. The qualitative checklist is introduced to account for impacts of the reusescheme, which cannot be expressed financially.
3.3 Criteria for Checklist
Five categories of criteria are distinguished: effectivity, technical feasibility, regulatory feasibility,social preferability, and environmental preferability. These categories are discussed in the followingparagraphs. The categories are based on the classification for the judgment of feasibility into fourcategories of Huckin (1991): effectivity, technical feasibility, affordability and preferability.Affordability is not discussed, as it is already discussed in the cost-benefit-analysis.
3.3.1 Effectivity of Proposed SolutionThe term effectivity refers to the extend to which the implementation of a project solves the problems itis supposed to solve. The objective of agricultural wastewater reuse is two-sided. Reuse diminishes thecontamination of natural water sources by treating wastewater and provides an alternative water source,and so diminishes depletion of scarce natural water resources.
Effectivity has to be judged on both objectives:Does contamination of natural water sources diminish after implementation of the project?Does depletion of natural water sources diminish after implementation of the project?
3.3.2 Technical FeasibilityTechnical feasibility refers to the availability of resources that are necessary for the implementation ofthe project. These resources include technology, (skilled) labor, materials, and natural resources.
In order to judge technical feasibility the following questions have to be answered:Does the treatment concept have a solid theoretical basis which guarantees a secureconstruction and operation?Can the wastewater considerations be integrated into a distribution system in a secure way?Are skilled labor and manpower available for the implementation of the project?Are all materials for the construction of the system present or obtainable in Cali region?
30
3.3.3 Regulatory Feasibility: Institutional and Legal AspectsRegulatory feasibility refers to the presence of institutions and regulations that influence theimplementation of the project.To judge regulatory feasibility the following questions must be answered:
Which laws and regulations exist, that the project has to obey? Do any of them forbid orcomplicate the implementation of the project?In which legislative units is the project located and does the project cross legislative borders?Does an institutional framework exist, which can implement the project? Or how can theinstitutional framework be established?
3.3.4 Preferability: Social AspectsPreferability refers to the fact whether and the reasons why a solution is better than or preferred overother possible solutions. The social aspects of the reuse scheme include the risks for public healthinvolved in the alternatives, the acceptance of reuse in the Valle de Cauca, benefits and nuisance forlocal communities and the effects of centralization of the irrigation system for farmers.
In order to judge social preferability the following questions have to be answered. Will theimplementation of the alternative:
create a public health risk?be socially accepted in the Valle de Cauca?create jobs and/or income for local communities?create infrastructure of services which can be used by local communities?offer education to local community members?occupy or affect areas which are of major significance for human settlement, agriculture,animal husbandry or similar?be self-sufficient; How is looked at ways to meet each need at a more local level?create nuisance conditions to people living nearby (smells, noise etc.)?be vulnerable for theft, vandalism, and terrorism?be socio-economically attractive through the yield of profitable products?be manageable for the farmers?
3.3.5 Preferability: Environmental ImpactsEnvironmental preferability refers to the fact whether the environmental impacts of a solution are betterthan or preferred over those of other possible solutions. The various aspects to judge environmentalimpacts are obtained from an overview of the Directorate General of International Cooperation of theDutch Ministry of Foreign Affairs, which is used to list impacts of projects which they finance in othercountries (DGIS, 1990).
The following aspects will be judged. Will the project:lead to the development of an unwanted disposal site, which displaces original wildlife?occupy or affect areas which are of major significance for human settlement, agriculture,animal husbandry or similar?occupy or affect areas which support animal or plant life worthy of protection or especiallyvulnerable ecosystems?affect areas with historic remains or landscape elements of importance to the population?lead to pollution of air, water or soil?drain rivers or change the flow of water in such a way that it creates considerable changes forthe environment and the utilization of natural resources?require intensive use of non-renewable energy sources?lead to felling of trees for fuel etc. which is larger than the rate of growth?create major demands on other forms of infrastructure?cause a noticeable reduction in the flow of nutrient elements or fish production?lead to substantial waterlogging or salinity of cultivated or cultivable land?create a risk of spread of disease?
31
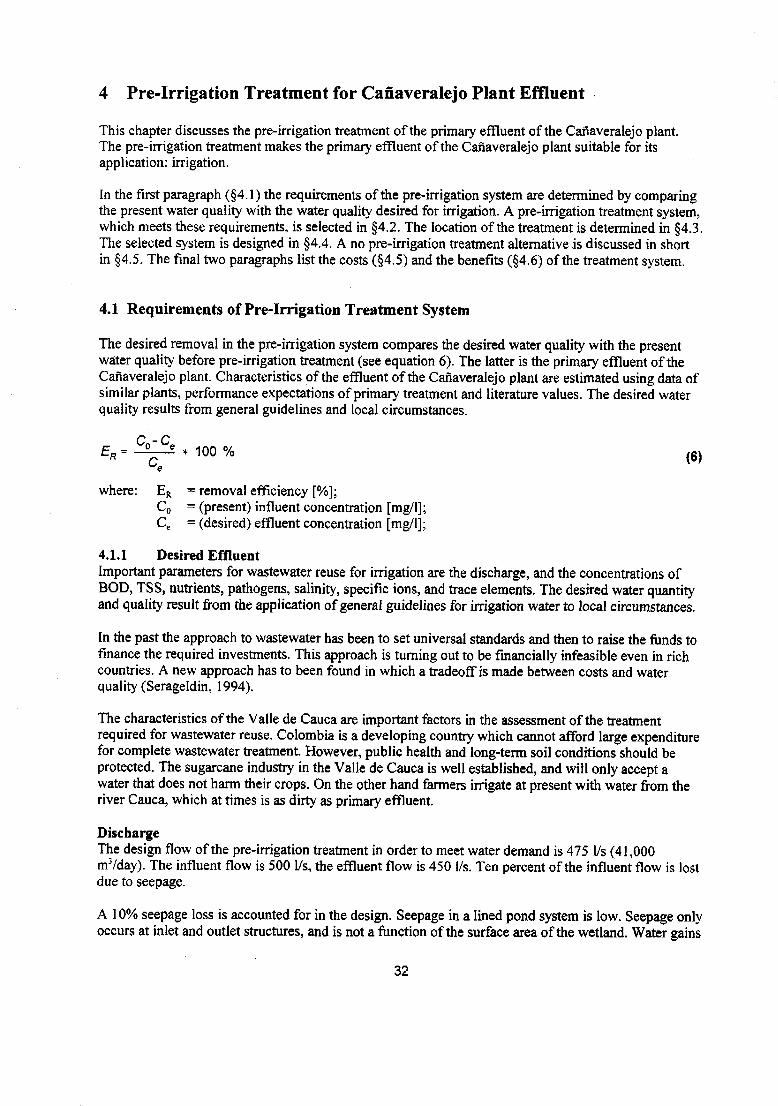
4 Pre-Irrigation Treatment for Cañaveralejo Plant Effluent
This chapter discusses the pre-irrigation treatment of the primary effluent of the Cañaveralejo plant.The pre-irrigation treatment makes the primary effluent of the Cañaveralejo plant suitable for itsapplication: irrigation.
In the first paragraph (§4.1) the requirements of the pre-irrigation system are determined by comparingthe present water quality with the water quality desired for irrigation. A pre-irrigation treatment system,which meets these requirements, is selected in §4.2. The location of the treatment is determined in §4.3.The selected system is designed in §4.4. A no pre-irrigation treatment alternative is discussed in shortin §4.5. The final two paragraphs list the costs (§4.5) and the benefits (§4.6) of the treatment system.
4.1 Requirements of Pre-Irrigation Treatment System
The desired removal in the pre-irrigation system compares the desired water quality with the presentwater quality before pre-irrigation treatment (see equation 6). The latter is the primary effluent of theCañaveralejo plant. Characteristics of the effluent of the Cañaveralejo plant are estimated using data ofsimilar plants, performance expectations of primary treatment and literature values. The desired waterquality results from general guidelines and local circumstances.
where: ER = removal efficiency [%];Co = (present) influent concentration [mg/l];Ce = (desired) effluent concentration [mg/l];
4.1.1 Desired EffluentImportant parameters for wastewater reuse for irrigation are the discharge, and the concentrations ofBOD, TSS, nutrients, pathogens, salinity, specific ions, and trace elements. The desired water quantityand quality result from the application of general guidelines for irrigation water to local circumstances.
In the past the approach to wastewater has been to set universal standards and then to raise the funds tofinance the required investments. This approach is turning out to be financially infeasible even in richcountries. A new approach has to been found in which a tradeoff is made between costs and waterquality (Serageldin, 1994).
The characteristics of the Valle de Cauca are important factors in the assessment of the treatmentrequired for wastewater reuse. Colombia is a developing country which cannot afford large expenditurefor complete wastewater treatment. However, public health and long-term soil conditions should beprotected. The sugarcane industry in the Valle de Cauca is well established, and will only accept awater that does not harm their crops. On the other hand farmers irrigate at present with water from theriver Cauca, which at times is as dirty as primary effluent.
DischargeThe design flow of the pre-irrigation treatment in order to meet water demand is 475 1/s (41,000mVday). The influent flow is 500 1/s, the effluent flow is 450 1/s. Ten percent of the influent flow is lostdue to seepage.
A 10% seepage loss is accounted for in the design. Seepage in a lined pond system is low. Seepage onlyoccurs at inlet and outlet structures, and is not a function of the surface area of the wetland. Water gains
32

and losses due to evaporation and rainfall are negligible (see §4.4.7).
A central storing facility, integrated in the treatment system, is designed to obtain an intermittent flowduring irrigation operation hours. The outflow of the treatment and storage system has to be anintermittent flow during 12 hours per day from Monday to Saturday of 900 1/s.
The effluent of the macrophyte-based treatment system will serve to irrigate the 936 ha irrigable areabetween the Rio Cauca and the Rio Fraile, which is defined in §5.2.1. The peak water requirement ofthe sugarcane is 384 1/s (see §5.3). To meet this water requirement in 6 days a week, a minimum flowof 450 1/s is required. On Sundays water is neither used nor stored.
Gross pollutants: BOD and TSSA conservative limit of 50 mg BOD/1 is set. Setting a standard for BOD-concentrations is difficult asseveral sources contradict each other on this subject: some do not set any limits, whereas others suggestmaximums as low as 20 rng/1 (US Department of the Interior, 1966; Culp and Hinrichs, 1981; Arthur,1983; Shelef et al., 1987).
In this furrow irrigation system the suspended solids maximum of 50 mg TSS/1 is set in order to avoidsedimentation of canals and ditches. Suspended solids can reduce already low soil infiltration rates,cause clogging of equipment and sedimentation problems in canals. Surface water often contains farhigher concentrations of sediments (up to 30 g/1) than domestic wastewater (200-500 mg/1) (NationalTechnical Advisory Committee, 1972).
NutrientsThe design of the pre-irrigation system aims at a nitrogen concentration between 10 and 20 mg/1. Themaximum phosphorus concentration is 4 mg/1, this guideline is adopted from Ayers and Westcot(1985). This is a tradeoff between agronomic benefits and extra maintenance costs.
Nutrients in irrigation water can cause growth of weeds in canals which results in extra maintenancecosts for the distribution system. Nutrients also generate agronomic benefits by fertilizing land and thusincreasing yields. Fertilizers can be saved when applying nutrient rich irrigation water. Very highnutrient concentrations cause crop damage, and pollute groundwater.
Nitrogen concentration should be between 10 and 20 mg/1. Sugarcane is tolerant for nitrogenconcentrations up to 30 mg/1. Irrigation practices can avoid damage in the ripening growing stage bynot irrigating after a certain date. Nitrogen levels should be kept low in order to lower maintenancecosts. Ayers and Westcot (1985) suggest values of 5 mg/1 in critical circumstances, while the NationalTechnical Advisory Committee (1972) states a maximal nitrogen concentration of 45 mg/1.
PathogensNo faecal coliform limit is set, based on the WHO guidelines. Maximum helminth eggs concentration is1 egg per liter.
The microbiological guidelines of the WHO of 1989 (table 45, appendix VII) classify sugarcane incategory B, which are restricted crops which are not eaten raw (cereal crops, industrial crops, foddercrops, pasture and trees). The WHO does not specify a faecal coliforms limit for these crops, but statesa maximum helminth egg concentration of 1 egg per liter.
SalinityMaximum electric conductivity of the effluent is 1.7 dS/m. This guidelines is derived from the FAOguidelines, presented by Ayers and Westcot (1985). The salinity guidelines from the FAO are acceptedas the most comprehensive and are used throughout the world (see figure 5, §2.3.2), Investigation ofCENICAÑA of electric conductivity for varieties used in the Valle de Cauca supports the FAO value.
33

The sodium adsorption ratio of water is related to the electric conductivity, and a SAR limit should beset according to the relation discussed in §2.3.2 (see figure 5).
Specific IonsA maximum chloride concentration of 107 mg/1 is adopted from the FAO guidelines, as chloride affectssoils and plants and is present in wastewater.
Ayers and Westcot (1985) provide FAO guidelines for four specific ions: sodium, bicarbonate, boronand chloride (see table 46, appendix VII). Sodium and bicarbonate are no major parameters whenassessing irrigation water quality, and boron is only found in very low concentrations in wastewater.Chloride greatly affects soils and plants, and is present in wastewater.
Trace ElementsThe design includes the following trace elements limits: 2.0 mg/1 of zinc, 0.2 mg/1 of nickel, 0.01 mg/1of cadmium, 5.0 mg/1 of lead, and 0.20 mg/1 of copper. These values are used in large parts of theworld.
Most countries (i.e. USA, Colombia, and Saudi-Arabia) use a set of guidelines similar to the FAOguidelines, presented in Ayers and Westcot, 1985 (see table 47, appendix VII). The set of guidelinesconsists of a long list of trace elements, of which only zinc, nickel, cadmium, lead and copper arepresent in wastewater in harmful concentrations. It should be noted that these threshold limits areintended to protect even the most sensitive plants from harmful effects: if these guidelines are exceededfor any element, a second evaluation based on crop and local circumstances has to be made (Page andChang, 1985a).
4.1.2 InfluentIt is important to investigate the quality of the wastewater of the Cañaveralejo plant as it is a mixedwastewater. The wastewater of the Cañaveralejo plant is a weak wastewater of mainly domestic origin.The weakness of the wastewater is caused by the high water use per person in Cali. A small industrialarea discharges on the sewer system of the Cañaveralejo plant. The Cañaveralejo plant is described inappendix VI.
The wastewater treated in the Cañaveralejo plant will be a combination of four sources: Cañaveralejopumping station, Navarro pumping station, Aguablanca pumping station (which is not yet constructed),and the Colector General (see figure 10). The fact that those flows are not yet connected and samplesare only taken in one of the four sources complicates estimating the quality of the wastewater.
Cañaveralejo.92 m3/s
Navarro2.58 m3/s
Aguablanca0.9 m3/s
Cañaveralejo pumpinstation
Colector General2.20 m3/s
Navarro pumpingstation
CANAVERALEJOPLANT
Figure 10: Discharges Cañaveralejo plant
34
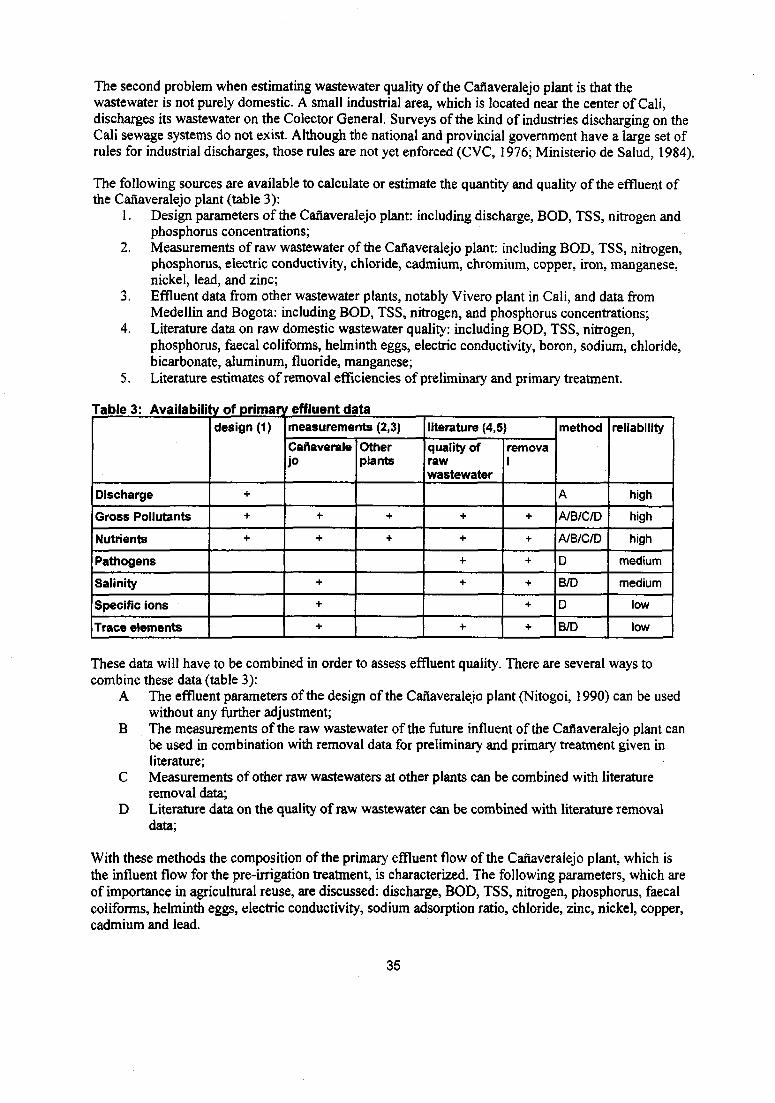
The second problem when estimating wastewater quality of the Caftaveralejo plant is that thewastewater is not purely domestic. A small industrial area, which is located near the center of Cali,discharges its wastewater on the Colector General. Surveys of the kind of industries discharging on theCali sewage systems do not exist. Although the national and provincial government have a large set ofrules for industrial discharges, those rules are not yet enforced (CVC, 1976; Ministerio de Salud, 1984).
The following sources are available to calculate or estimate the quantity and quality of the effluent ofthe Cañaveralejo plant (table 3):
1. Design parameters of the Cañaveralejo plant: including discharge, BOD, TSS, nitrogen andphosphorus concentrations;
2. Measurements of raw wastewater of the Cañaveralejo plant: including BOD, TSS, nitrogen,phosphorus, electric conductivity, chloride, cadmium, chromium, copper, iron, manganese,nickel, lead, and zinc;
3. Effluent data from other wastewater plants, notably Vivero plant in Cali, and data fromMedellin and Bogota: including BOD, TSS, nitrogen, and phosphorus concentrations;
4. Literature data on raw domestic wastewater quality: including BOD, TSS, nitrogen,phosphorus, faecal coliforms, helminth eggs, electric conductivity, boron, sodium, chloride,bicarbonate, aluminum, fluoride, manganese;
5. Literature estimates of removal efficiencies of preliminary and primary treatment.
Table 3: Availability of priman effluent data
Discharge
Gross Pollutants
Nutrients
Pathogens
Salinity
Specific ions
Trace elements
design (1)
+
+
+
measurements (2,3)
Cañavéralejo
+
+
+
+
+
Otherplants
+
+
literature (4,5)
quality ofrawwastewater
+
+
+
+
+
removaI
+
+
+
+
+
+
method
A
A/B/C/D
A/B/C/D
D
B/D
D
B/D
reliability
high
high
high
medium
medium
low
low
These data will have to be combined in order to assess effluent quality. There are several ways tocombine these data (table 3):
A The effluent parameters of the design of the Cañaveralejo plant (Nitogoi, 1990) can be usedwithout any farther adjustment;
B The measurements of the raw wastewater of the future influent of the Cañaveralejo plant canbe used in combination with removal data for preliminary and primary treatment given inliterature;
C Measurements of other raw wastewaters at other plants can be combined with literatureremoval data;
D Literature data on the quality of raw wastewater can be combined with literature removaldata;
With these methods the composition of the primary effluent flow of the Cañaveralejo plant, which isthe influent flow for the pre-irrigation treatment, is characterized. The following parameters, which areof importance in agricultural reuse, are discussed: discharge, BOD, TSS, nitrogen, phosphorus, faecalcoliforms, helminth eggs, electric conductivity, sodium adsorption ratio, chloride, zinc, nickel, copper,cadmium and lead.
35
DischargeThe maximum discharge available for reuse is the initial discharge after the first construction stage,which will be 7.6 m3/s (6.6 * 105 mVd). EMCALI officially still plans on completion of the first stageof construction in 1998, but that this date will be reached, is very improbable, as construction has yet tobegin and the design of the plant states a construction period of at least 4 years (Nitogoi, 1990).
Gross Pollutants: BOD and TSSThe BOD concentration is 106 mg/1 and TSS concentration is 129 mg/1, these are the effluentconcentrations after primary treatment of the design of the Cañaveralejo plant (Nitogoi, 1990). Theseparameters are also measured in the raw wastewater, the influent of the Cañaveralejo plant. The designvalues of raw wastewater (167 mg BOD/1 and 224 mg TSS/1) are slightly lower than the measuredvalues (194 mg BOD/1 and 250 mg TSS/1).
NutrientsTotal kjeldahl nitrogen (TKN) concentration is 26 mg/1 and total phosphorus (TP) concentration is 3mg/1. These values derive from the design of the Cañaveralejo plant. When comparing the measureddata with the design parameters of raw wastewater, nitrogen concentrations are very similar, but thephosphorus design concentration (3 mg/1) appears to be quite optimistic: it is consistently lower thanaverage measured values (4.8 mg/1). As this is not an enquiry into the primary treatment provided bythe Cañaveralejo plant, the design parameters of the effluent of the Cañaveralejo plant are used.
PathogensPrimary effluent faecal coliform concentration is estimated at 5*107 faecal coliforms per 100 ml,helminth egg concentration is estimated at 300 eggs per liter. These concentrations are based onliterature, because pathogen data of the Cañaveralejo effluent or other raw wastewater sources inColombia are not available.
Pathogen concentrations can be estimated well using literature values. Various resources (Arthur, 1983;Metcalf and Eddy, 1991 ; Mara et al., 1992; Mara, 1995) suggest a design value of 1 * 10s faecalcoliforms per 100 ml in raw wastewater. The number of helminth eggs in raw wastewater is normally inthe range of 100 to 1000 per liter, 600 per liter is a good design estimate (Pescod and Mara, 1985; Maraet al., 1992). Primary treatment removes 25- 75% of faecal coliforms (Dean and Lund, 1981; Crook,1985; Van der Graaf, 1995a), and removes 50-90% of helminth eggs (Dean and Lund, 1981; Crook,1985). A presumed coliform removal of 50% leaves 5*107 faecal coliforms per 100 ml; a helminth eggsremoval of 50% leaves 300 helminth eggs per liter in the primary effluent of the Cañaveralejo plant.
SalinityElectric conductivity of the primary effluent is estimated 0.70 dS/m. The electric conductivity derivesfrom measurements and literature. The sodium adsorption ratio is in the range of 0 to 5.
EMCALI has not measured electric conductivity in the wastewater in Cali. In connection with thisstudy a short series of measurements was taken in the Colector General, showing an average electricconductivity of 0.51 dS/m. A two-month measurements series of the raw wastewater at the Ginebralagoon (see appendix VI) shows electric conductivity between 0.40 and 0.57 dS/m, average being 0.47dS/m. Estimates for salinity in literature vary between 0.23 dS/m and 1.33 dS/m (D'ltri, 1981; Asano etal., 1985; Metcalf and Eddy, 1991). By combining literature and measured values raw wastewaterelectric conductivity of raw wastewater is estimated as 0.70 dS/m. Primary treatment does not removesalts, therefore the electric conductivity of primary effluent equals the value for raw wastewater.
The sodium adsorption ratio is assumed to be in the range of 0 to 5. This figure is based on the electricconductivity of the wastewater and the assumption that it has a normal relative sodium content. Thesodium adsorption ratio is not measured in the wastewater if the Cañaveralejo plant. Very limitedinformation is available in literature.
36
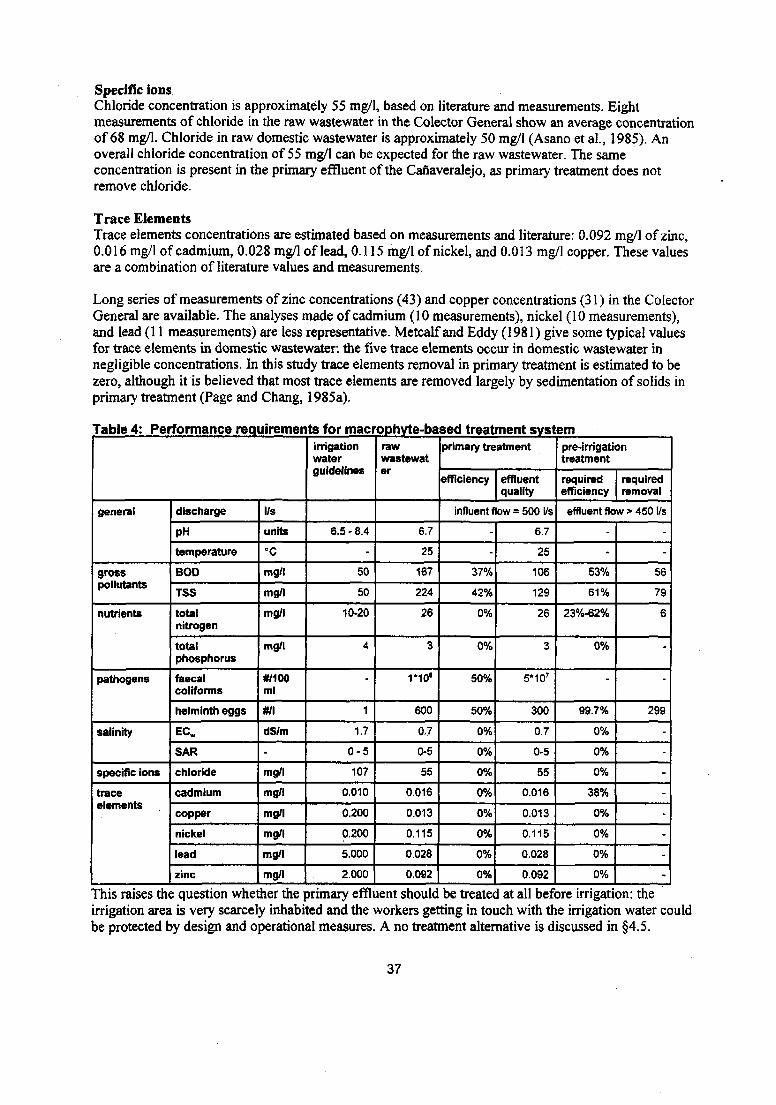
Specific ionsChloride concentration is approximately 55 mg/1, based on literature and measurements. Eightmeasurements of chloride in the raw wastewater in the Colector General show an average concentrationof 68 mg/1. Chloride in raw domestic wastewater is approximately 50 mg/1 (Asano et al., 1985). Anoverall chloride concentration of 55 mg/1 can be expected for the raw wastewater. The sameconcentration is present in the primary effluent of the Cañaveralejo, as primary treatment does notremove chloride.
Trace ElementsTrace elements concentrations are estimated based on measurements and literature: 0.092 mg/1 of zinc,0.016 mg/1 of cadmium, 0.028 mg/1 of lead, 0.115 mg/1 of nickel, and 0.013 mg/1 copper. These valuesare a combination of literature values and measurements.
Long series of measurements of zinc concentrations (43) and copper concentrations (31) in the ColectorGeneral are available. The analyses made of cadmium (10 measurements), nickel (10 measurements),and lead (11 measurements) are less representative. Metcalf and Eddy (1981) give some typical valuesfor trace elements in domestic wastewater: the five trace elements occur in domestic wastewater innegligible concentrations. In this study trace elements removal in primary treatment is estimated to bezero, although it is believed that most trace elements are removed largely by sedimentation of solids inprimary treatment (Page and Chang, 1985a).
Table 4: Performance requirements for macrophyte-based treatment system
general
grosspollutants
nutrients
pathogens
salinity
specific ions
traceelements
discharge
PH
temperature
BOD
TSS
totalnitrogen
totalphosphorus
faecalcoliforms
helminth eggs
ECW
SAR
chloride
cadmium
copper
nickel
lead
zinc
l/s
units
°C
mg/1
mg/1
mg/1
mg/1
#/100ml
#/l
dS/m
-
mg/l
mg/l
mg/l
mg/l
mg/l
mg/l
irrigationwaterguidelines
6.5 - 8.4
-
50
50
10-20
4
-
1
1.7
0 -5
107
0.010
0.200
0.200
5.000
2.000
rawwastewater
6.7
25
167
224
26
3
1*10"
600
0.7
0-5
55
0.016
0.013
0.115
0.028
0.092
primary treatment
efficiency effluentquality
influent flow = 500 l/s
-
-
37%
42%
0%
0%
50%
50%
0%
0%
0%
0%
0%
0%
0%
0%
6.7
25
106
129
26
3
5*10r
300
0.7
0-5
55
0.016
0.013
0.115
0.028
0.092
pre-irrigationtreatment
requiredefficiency
requiredremoval
effluent flow > 450 l/s
-
-
53%
61%
23%-62%
0%
-
99.7%
0%
0%
0%
38%
0%
0%
0%
0%
-
-
56
79
6
-
-
299
-
-
-
-
-
-
-
This raises the question whether the primary effluent should be treated at all before irrigation: theirrigation area is very scarcely inhabited and the workers getting in touch with the irrigation water couldbe protected by design and operational measures. A no treatment alternative is discussed in §4.5.
37
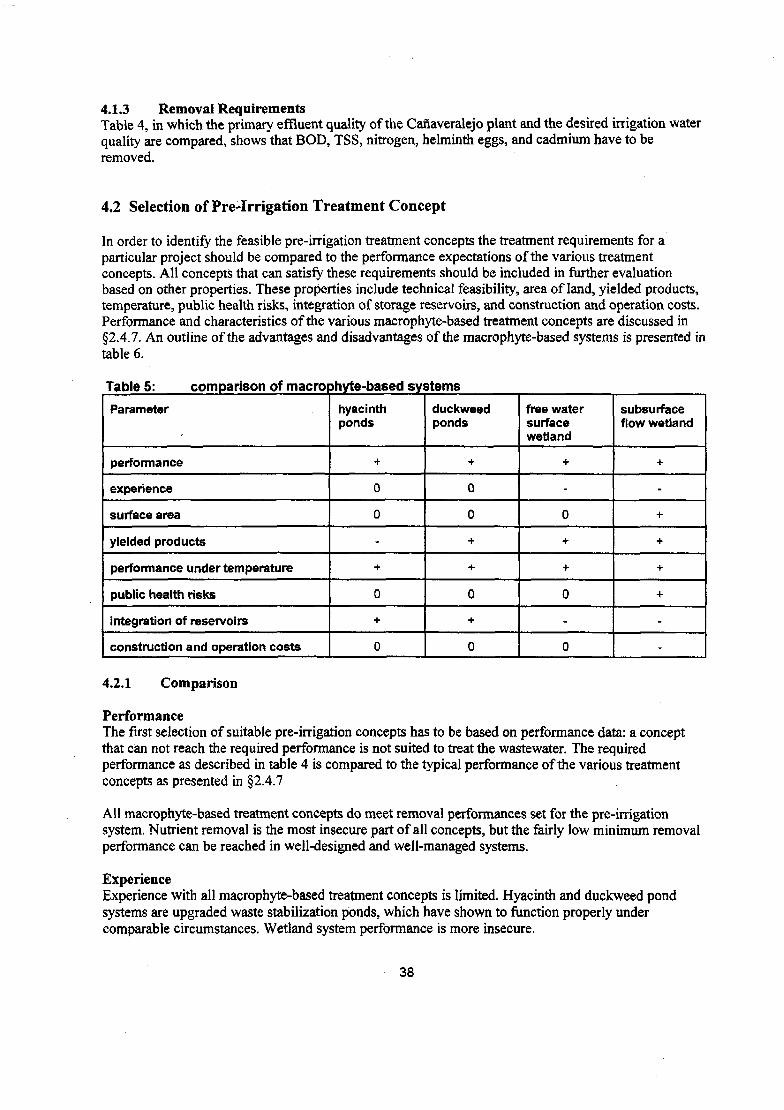
4.1.3 Removal RequirementsTable 4, in which the primary effluent quality of the Cañaveralejo plant and the desired irrigation waterquality are compared, shows that BOD, TSS, nitrogen, helminth eggs, and cadmium have to beremoved.
4.2 Selection of Pre-Irrigation Treatment Concept
In order to identify the feasible pre-irrigation treatment concepts the treatment requirements for aparticular project should be compared to the performance expectations of the various treatmentconcepts. All concepts that can satisfy these requirements should be included in further evaluationbased on other properties. These properties include technical feasibility, area of land, yielded products,temperature, public health risks, integration of storage reservoirs, and construction and operation costs.Performance and characteristics of the various macrophyte-based treatment concepts are discussed in§2.4.7. An outline of the advantages and disadvantages of the macrophyte-based systems is presented intable 6.
Table 5: comparison of macrophyte-based systems
Parameter
performance
experience
surface area
yielded products
performance under temperature
public health risks
integration of reservoirs
construction and operation costs
hyacinthponds
+
0
0
-
+
0
+
0
duckweedponds
+
0
0
+
+
0
+
0
free watersurfacewetland
+
-
0
+
+
0
-
0
subsurfaceflow wetland
+
-
+
+
+
+
-
-
4.2.1 Comparison
PerformanceThe first selection of suitable pre-irrigation concepts has to be based on performance data: a conceptthat can not reach the required performance is not suited to treat the wastewater. The requiredperformance as described in table 4 is compared to the typical performance of the various treatmentconcepts as presented in §2.4.7
All macrophyte-based treatment concepts do meet removal performances set for the pre-irrigationsystem. Nutrient removal is the most insecure part of all concepts, but the fairly low minimum removalperformance can be reached in well-designed and well-managed systems.
ExperienceExperience with all macrophyte-based treatment concepts is limited. Hyacinth and duckweed pondsystems are upgraded waste stabilization ponds, which have shown to function properly undercomparable circumstances. Wetland system performance is more insecure.
38
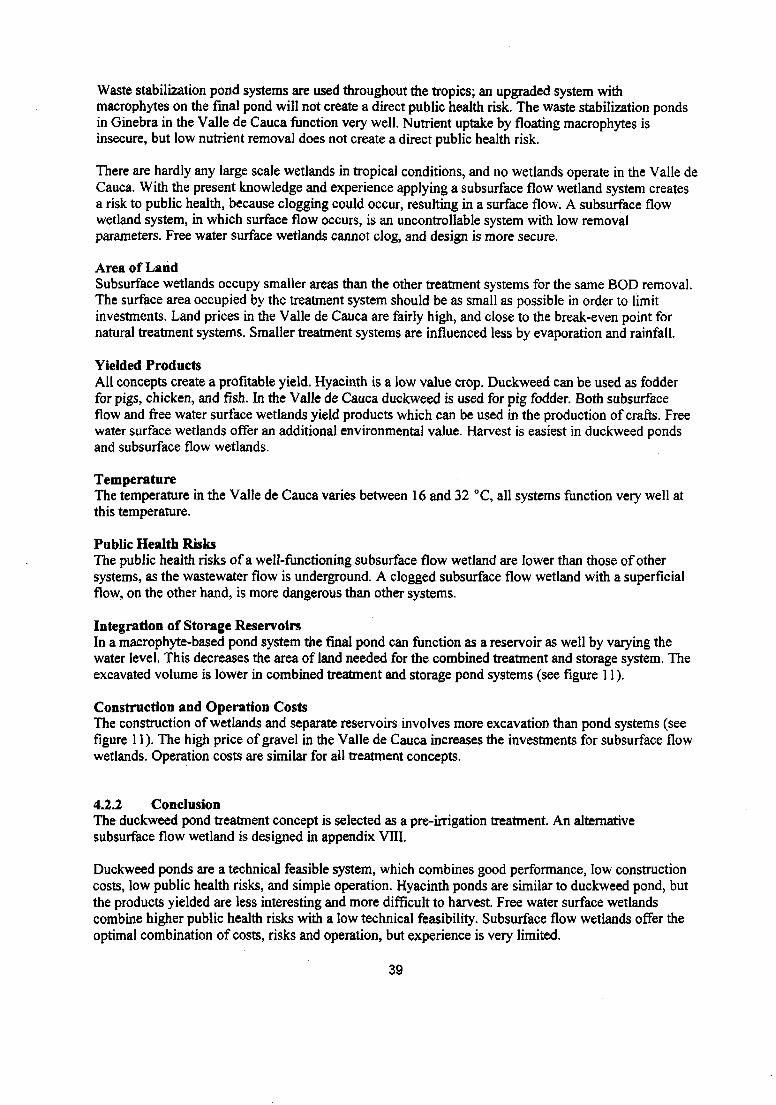
Waste stabilization pond systems are used throughout the tropics; an upgraded system withmacrophytes on the final pond will not create a direct public health risk. The waste stabilization pondsin Ginebra in the Valle de Cauca function very well. Nutrient uptake by floating macrophytes isinsecure, but low nutrient removal does not create a direct public health risk.
There are hardly any large scale wetlands in tropical conditions, and no wetlands operate in the Valle deCauca. With the present knowledge and experience applying a subsurface flow wetland system createsa risk to public health, because clogging could occur, resulting in a surface flow. A subsurface flowwetland system, in which surface flow occurs, is an uncontrollable system with low removalparameters. Free water surface wetlands cannot clog, and design is more secure.
Area of LandSubsurface wetlands occupy smaller areas than the other treatment systems for the same BOD removal.The surface area occupied by the treatment system should be as small as possible in order to limitinvestments. Land prices in the Valle de Cauca are fairly high, and close to the break-even point fornatural treatment systems. Smaller treatment systems are influenced less by evaporation and rainfall.
Yielded ProductsAll concepts create a profitable yield. Hyacinth is a low value crop. Duckweed can be used as fodderfor pigs, chicken, and fish. In the Valle de Cauca duckweed is used for pig fodder. Both subsurfaceflow and free water surface wetlands yield products which can be used in the production of crafts. Freewater surface wetlands offer an additional environmental value. Harvest is easiest in duckweed pondsand subsurface flow wetlands.
TemperatureThe temperature in the Valle de Cauca varies between 16 and 32 °C, all systems function very well atthis temperature.
Public Health RisksThe public health risks of a well-functioning subsurface flow wetland are lower than those of othersystems, as the wastewater flow is underground. A clogged subsurface flow wetland with a superficialflow, on the other hand, is more dangerous than other systems.
Integration of Storage ReservoirsIn a macrophyte-based pond system the final pond can function as a reservoir as well by varying thewater level. This decreases the area of land needed for the combined treatment and storage system. Theexcavated volume is lower in combined treatment and storage pond systems (see figure 11).
Construction and Operation CostsThe construction of wetlands and separate reservoirs involves more excavation than pond systems (seefigure 11). The high price of gravel in the Valle de Cauca increases the investments for subsurface flowwetlands. Operation costs are similar for all treatment concepts.
4.2.2 ConclusionThe duckweed pond treatment concept is selected as a pre-irrigation treatment. An alternativesubsurface flow wetland is designed in appendix VIII.
Duckweed ponds are a technical feasible system, which combines good performance, low constructioncosts, low public health risks, and simple operation. Hyacinth ponds are similar to duckweed pond, butthe products yielded are less interesting and more difficult to harvest. Free water surface wetlandscombine higher public health risks with a low technical feasibility. Subsurface flow wetlands offer theoptimal combination of costs, risks and operation, but experience is very limited.
39
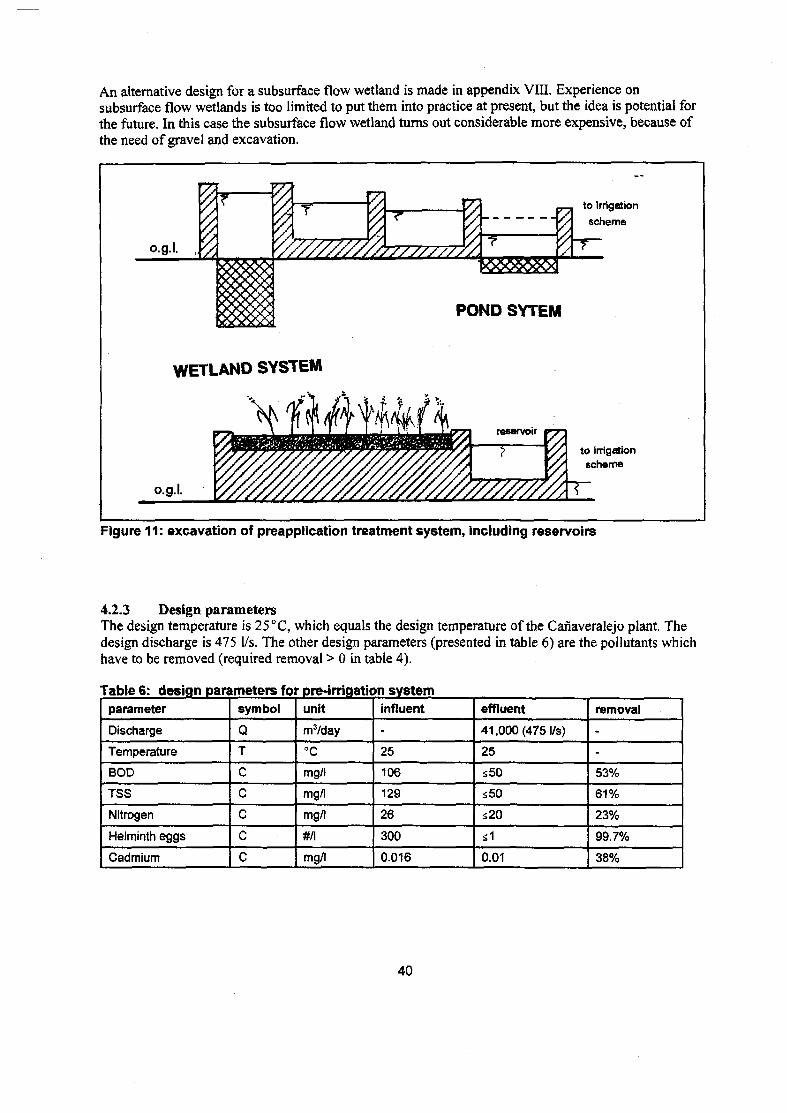
An alternative design for a subsurface flow wetland is made in appendix VIII. Experience onsubsurface flow wetlands is too limited to put them into practice at present, but the idea is potential forthe future. In this case the subsurface flow wetland turns out considerable more expensive, because ofthe need of gravel and excavation.
o.g.l.
OCO3O9CX
to irrigation
scheme
POND SYTEM
WETLAND SYSTEM
o.g.l.
to irrigationscheme
Figure 11: excavation of preapplication treatment system, including reservoirs
4.2.3 Design parametersThe design temperature is 25 °C, which equals the design temperature of the Cañaveralejo plant. Thedesign discharge is 475 l/s. The other design parameters (presented in table 6) are the pollutants whichhave to be removed (required removal > 0 in table 4).
Table 6: design parameters for pre-irrigation systemparameter
Discharge
Temperature
BOD
TSS
Nitrogen
Helminth eggs
Cadmium
symbol
Q
T
C
cccc
unit
m3/day
°C
mg/l
mg/l
mg/l
#/l
mg/l
influent
-
25
106
129
26
300
0.016
effluent
41,000 (475 I/S)
25
s50
£50
£20
s1
0.01
removal
-
-
53%
61%
23%
99.7%
38%
40
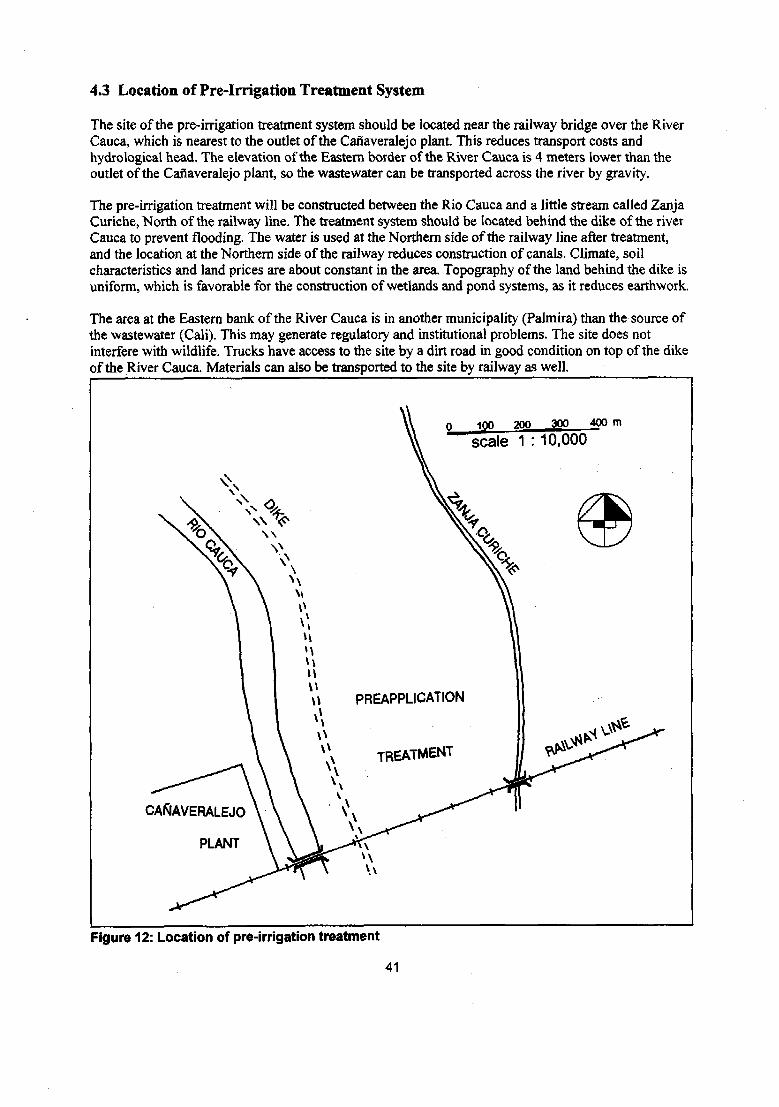
4.3 Location of Pré-Irrigation Treatment System
The site of the pre-irrigation treatment system should be located near the railway bridge over the RiverCauca, which is nearest to the outlet of the Cañaveralejo plant. This reduces transport costs andhydrological head. The elevation of the Eastern border of the River Cauca is 4 meters lower than theoutlet of the Cañaveralejo plant, so the wastewater can be transported across the river by gravity.
The pre-irrigation treatment will be constructed between the Rio Cauca and a little stream called ZanjaCuriche, North of the railway line. The treatment system should be located behind the dike of the riverCauca to prevent flooding. The water is used at the Northern side of the railway line after treatment,and the location at the Northern side of the railway reduces construction of canals. Climate, soilcharacteristics and land prices are about constant in the area. Topography of the land behind the dike isuniform, which is favorable for the construction of wetlands and pond systems, as it reduces earthwork.
The area at the Eastern bank of the River Cauca is in another municipality (Palmira) than the source ofthe wastewater (Cali). This may generate regulatory and institutional problems. The site does notinterfere with wildlife. Trucks have access to the site by a dirt road in good condition on top of the dikeof the River Cauca. Materials can also be transported to the site by railway as well.
inn 200 300 400 m
scale 1 :10,000
CAÑAVERALEJO
PLANT
Figure 12: Location of pre-irrigation treatment
41
4.4 Duckweed Pond System
This paragraph describes the design of a duckweed pond system. First the pond system is characterized(§4.4.1) and the design concepts are determined (§4.4.2). The stages of the actual design are: the designof the anaerobic pond (§4.4.3), the facultative pond (§4.4.4), and the maturation ponds (§4.4.5); theintegration of storage reservoirs (§4.4.6); the description of the influence of rainfall and evaporation(§4.4.7), the layout of ponds (§4.4.7), and the design of structures and piping (§4.4.9). Theperformance of the pond system and he suitability of the effluent for irrigation are discussed in §4.4.10.$4.4.11 describes the management, operation, and maintenance of the pond system.
4.4.1 Characterization of Pond System
Waste stabilization pond systems comprise a single series of anaerobic, facultative and severalmaturation ponds, or several such series in parallel. Anaerobic and facultative ponds are designed forBOD removal. Duckweed maturation ponds are designed for pathogen removal and nutrient removal.
The construction depth of the anaerobic pond is 4 m. The pond will fill up with sludge until a depth of2.5 m, when it will be desludged. Anaerobic ponds normally are between 2 and 5 m deep and receiveraw or settled wastewater. Anaerobic ponds function much like open septic tanks. They are loaded withhigh BOD loading rates of more than 300 g/m3*d. The ponds are completely devoid of dissolvedoxygen, and the suspended solids settle to the bottom of the pond, where they undergo anaerobicdigestion.
The design depth of the facultative pond is 1.5 m. Facultative ponds are mostly between 1 and 2 mdeep and receive either raw wastewater, settled wastewater, or effluent of anaerobic ponds. Facultativeponds have a lower anaerobic zone and an upper aerobic zone where oxygen for bacterial metabolism islargely provided by the photosynthetic activity of microalgae.
This pond system is designed with two subsequent maturation ponds of the same size in each series ofponds. The maturation ponds will be covered with duckweed. The design depth is of 1 m. Maturationponds with floating macrophytes are typically 1 and 1.5 m deep. Maturation ponds principally reducethe number of excreted pathogens and nutrients. Maturation ponds show less vertical stratification thanfacultative ponds, and are well oxygenated throughout the day.
LiningThe permeability of the soil at the pond site requires the installation of an impermeable liner at thebottom of the ponds to prevent groundwater contamination and water losses. The basic infiltration rateof the Juanchito soil is 4.6 mm/hour, Mara et al. (1992) advise lining if the basic infiltration rate of thesoil is more than 0.36 mm/hour.
Geotextile, a sheet material that is available in Columbia, is selected to line the ponds. Geotextile isstrong, impermeable, and smooth to prevent attachment. Other possible materials are compacted in situsoils (permeability less than 10"* cm/s), bentonite, asphalt, synthetic butyl rubber, or plastic membranes(Steiner, 1989).
4.4.2 Design ConceptsDesign methods of anaerobic and facultative ponds are based on a loading rate approach. The loadingmethods account for the influence of temperature on system performance, by varying loading rates withtemperature. Design concepts for duckweed maturation ponds are scarce. Most design manuals forwaste stabilization pond systems are written by the same authors and are based on the same experiences(Arthur, 1983; Mara, 1989; Pescod and Mara, 1989; Mara et al, 1992; Reed et al., 1995).
42
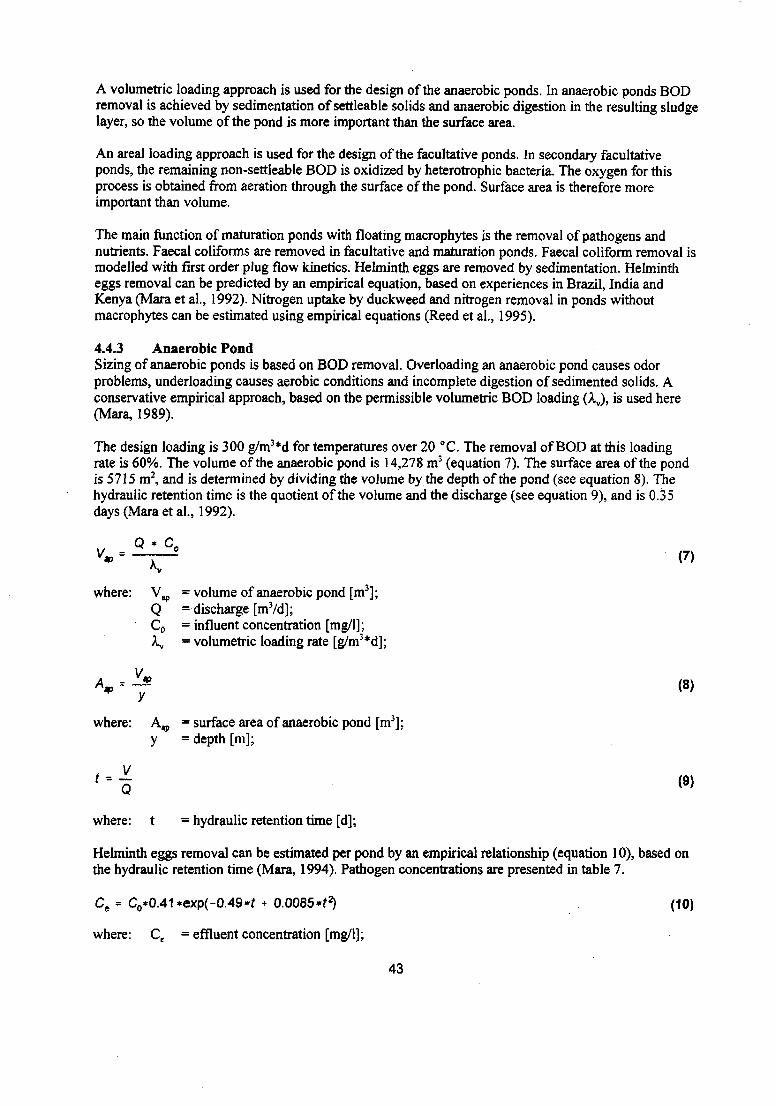
A volumetric loading approach is used for the design of the anaerobic ponds. In anaerobic ponds BODremoval is achieved by sedimentation of settleable solids and anaerobic digestion in the resulting sludgelayer, so the volume of the pond is more important than the surface area.
An areal loading approach is used for the design of the facultative ponds. In secondary facultativeponds, the remaining non-settleable BOD is oxidized by heterotrophic bacteria. The oxygen for thisprocess is obtained from aeration through the surface of the pond. Surface area is therefore moreimportant than volume.
The main function of maturation ponds with floating macrophytes is the removal of pathogens andnutrients. Faecal conforms are removed in facultative and maturation ponds. Faecal coliform removal ismodelled with first order plug flow kinetics. Helminth eggs are removed by sedimentation. Helmintheggs removal can be predicted by an empirical equation, based on experiences in Brazil, India andKenya (Mara et al., 1992). Nitrogen uptake by duckweed and nitrogen removal in ponds withoutmacrophytes can be estimated using empirical equations (Reed et al., 1995).
4.4.3 Anaerobic PondSizing of anaerobic ponds is based on BOD removal. Overloading an anaerobic pond causes odorproblems, underloading causes aerobic conditions and incomplete digestion of sedimented solids. Aconservative empirical approach, based on the permissible volumetric BOD loading (Av), is used here(Mara, 1989).
The design loading is 300 g/m3*d for temperatures over 20 °C. The removal of BOD at this loadingrate is 60%. The volume of the anaerobic pond is 14,278 m3 (equation 7). The surface area of the pondis 5715 m2, and is determined by dividing the volume by the depth of the pond (see equation 8). Thehydraulic retention time is the quotient of the volume and the discharge (see equation 9), and is 0.35days (Mara et al., 1992).
Kwhere: Wv
Q
(7)
= volume of anaerobic pond [m3];= discharge [mVd];= influent concentration [mg/1];- volumetric loading rate [g/m3*d];
A - (8)
where: Asp = surface area of anaerobic pond [m3];
Q
y = depth [m];
(9)
where: t = hydraulic retention time [d];
Helminth eggs removal can be estimated per pond by an empirical relationship (equation 10), based onthe hydraulic retention time (Mara, 1994). Pathogen concentrations are presented in table 7.
Ce = C0*0.41*exp(-0.49*f + 0.0085*?2)
where: Ce = effluent concentration [mg/1];
(10)
43
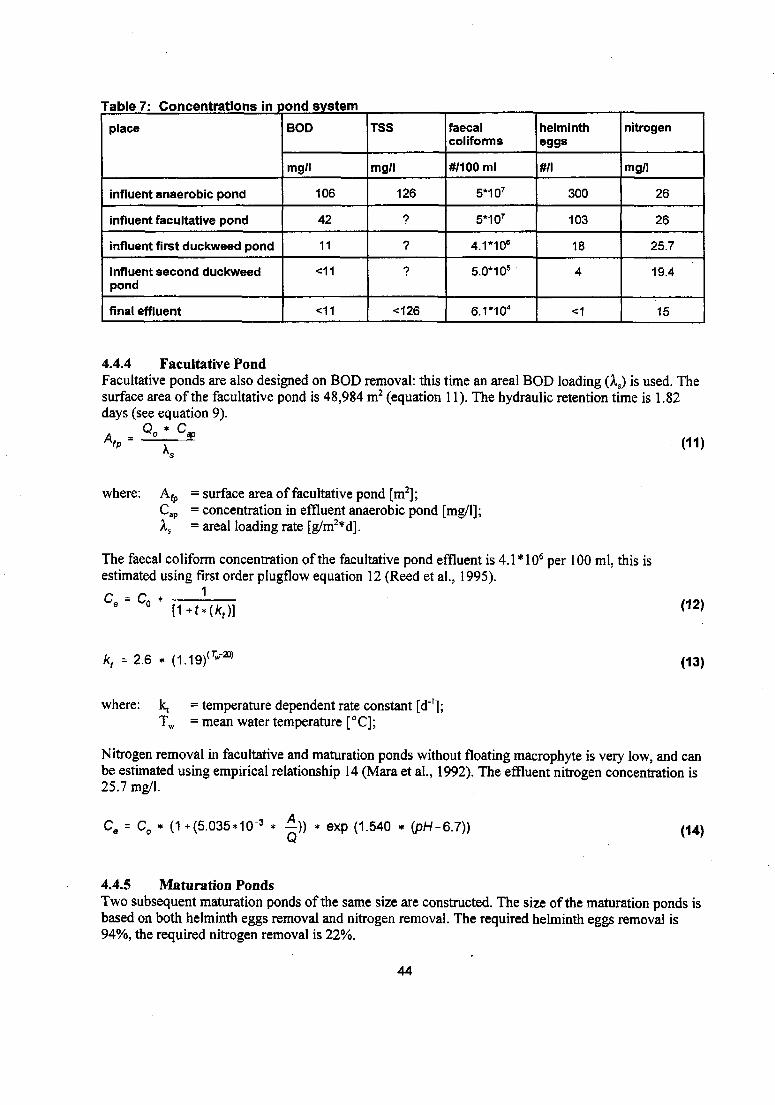
Table 7: Concentrations in pond system
place
influent anaerobic pond
influent facultative pond
influent first duckweed pond
influent second duckweedpond
final effluent
BOD
mg/l
106
42
11
<11
<11
TSS
mg/l
126
?
?
?
<126
faecalcoliforms
#/100ml
5*107
5*107
4. no 6
5.0*105
6.1*10"
helmintheggs
#/l
300
103
18
4
<1
nitrogen
mg/l
26
26
25.7
19.4
15
4.4.4 Facultative PondFacultative ponds are also designed on BOD removal: this time an areal BOD loading (Xs) is used. Thesurface area of the facultative pond is 48,984 m2 (equation 11). The hydraulic retention time is 1.82days (see equation 9).
(11)
where: ACap
= surface area of facultative pond [m2];= concentration in effluent anaerobic pond [mg/l];= areal loading rate [g/m2*d].
The faecal coliform concentration of the facultative pond effluent is 4.1 *106 per 100 ml, this isestimated using first order plugflow equation 12 (Reed et al., 1995).C = C 1 (12)
kt = 2.6 * (1.19)(V2P)(13)
where: k, = temperature dependent rate constant [d"'];Tw = mean water temperature [ ° C] ;
Nitrogen removal in facultative and maturation ponds without floating macrophyte is very low, and canbe estimated using empirical relationship 14 (Mara et al., 1992). The effluent nitrogen concentration is25.7 mg/l.
Ce = Co* (1 +(5.035*10"3 * —)) * exp (1.540 * (pH-6.7)) (14)
4.4.5 Maturation PondsTwo subsequent maturation ponds of the same size are constructed. The size of the maturation ponds isbased on both helminth eggs removal and nitrogen removal. The required helminth eggs removal is94%, the required nitrogen removal is 22%.
44

The minimum hydraulic retention time for the required helminth eggs removal is 1.16 days. Thisimplies a surface area of 45,000 m2 each (see equation 10). The effluent faecal coliform concentrationis 6.1*104 per 100 ml (equation 12).
Reed et al. (1995) give an empirical relation between the hydraulic loading rate of a floatingmacrophyte pond and the nitrogen removal (see equation 15 and 16). The hydraulic loading rate of bothduckweed maturation ponds is 9,000 mVha*d. The effluent nitrogen concentration after two subsequent45,000 m2 duckweed ponds is 15 mg/1.
HLR = 10,000 * — (15)
_i_
-12} (16)
where: HLR= hydraulic loading rate [m3/ha*d];
4.4.6 Integration of Storage ReservoirsA variation of the water level of the final duckweed pond of 0.45 m provides the set night storagecapacity. The required storage volume is 20,000 m3 to store a flow of 450 1/s for 12 hours.
4.4.7 Evaporation and RainfallWater gains and losses in the pond system derive from evapotranspiration, precipitation and seepage.Evaporation slows the water and increases hydraulic retention time, but on the other hand concentratesthe pollutants in the wastewater. Rainfall has the opposite effect, it shortens hydraulic retention timeand dilutes pollutant concentrations.
Water gains from evaporation and rainfall can be estimated in two ways: the average flow approachwhich presumes linear evaporation and rainfall (Reed et al., 1995), and the more complex actualretention time approximation (Kadlec 1989). The simpler average approach is used here, as only verysmall gains and losses of the influent flow occur due to evaporation and precipitation. Literature doesnot quantify the dilution of wastewater by rainfall or concentration by evapotranspiration.
The month in which evaporation is lowest and rainfall is highest, the wettest month, is the measure forwater gains and losses. The wettest month in the area is April, evaporation (E^ is 129.2 mm/month andaverage rainfall (P) is 139 mm/month (based on Rio Cauca station, appendix IV). The flow gain is6193 mVmonth equals 206 m3/day, which is 0.5% of the daily flow (equation 17). The water gain is sosmall that it is not taken into account for the design.
AQ = A *(P-EJ (17)
(18)
where: AQ = flow gain [m3/d];
P = average precipitation [m/month];Eo = evaporation [m/month];Qe = effluent discharge [mVd];Qo = influent discharge [mVdj;
45
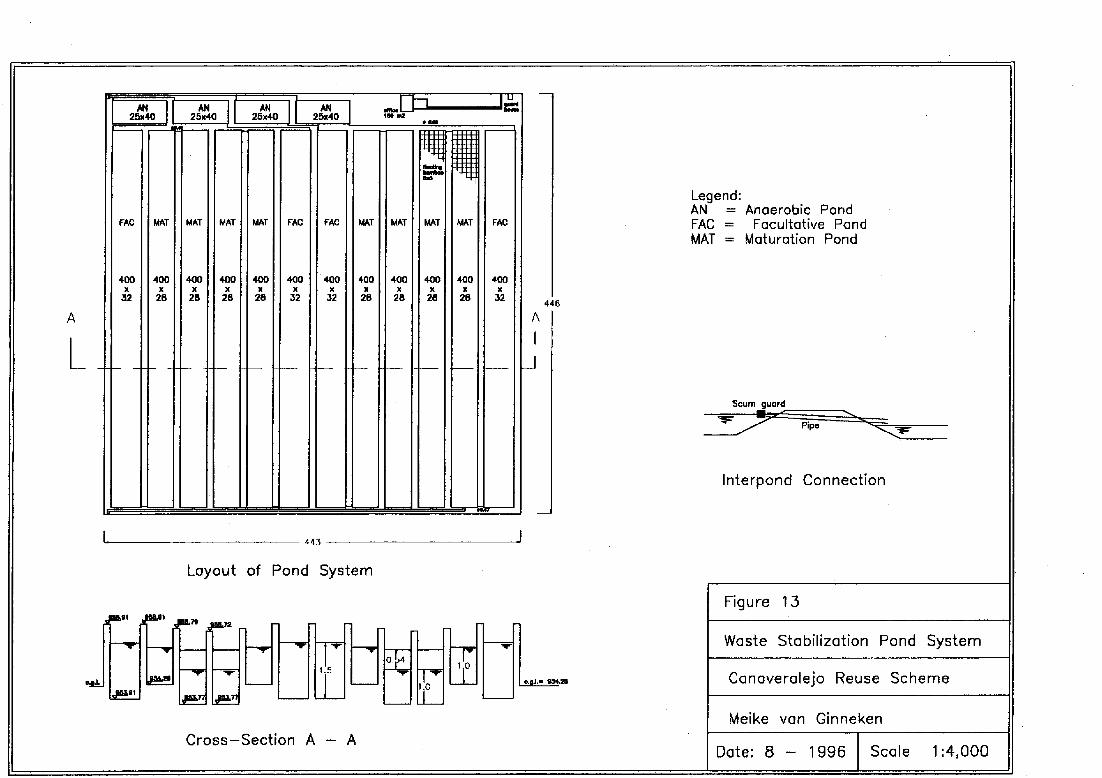
A
AN25x40
FAC
400x
32
MAT
400x28
AN25x40
AN25x40
AN25x40
MAT
400X
2B
MAT
400x
2B
MAT
400x28
FAC
400x
32
!»LJ=L
FAC
400x
32
MAT
400x
26
MAT
400x
28
MAT
400x
28
MAT
400x
28
FAC
400x
32446
J
Legend:AN = Anaerobic PondFAC = Facultative PondMAT = Maturation Pond
Scum guard
Interpond Connection
443
1«1 JSS.Í1
Layout of Pond System
JH-" JH.7Ï
• •JJ 1
5 1.0
Cross—Section A — A
Figure 13
Waste Stabilization Pond System
Canaveralejo Reuse Scheme
Meike von Ginneken
Date: 8 - 1996 Scale 1:4,000

4.4.8 Layout of PondsThe pond system serves a large discharge and four series of ponds in parallel are built in order toincrease operational flexibility. The pond geometry minimizes hydraulic short-circuiting andexcavation. Ponds are rectangular, length-to-width ratios vary. Inlet and outlets are located indiagonally opposite comers of the pond to avoid short-circuiting (see figure 13). The ponds fit in the450 m wide strip of land between the River Cauca and the Zanja Curiche. The total surface area is 450x 450= 19.8 hectares
The anaerobic ponds are located at the Northern end of the other ponds and are 58 m x 25 m.Anaerobic ponds have length-to-width ratios of 2.3:1 to avoid sludge banks forming near the inlet.
The water flows in a zigzag through the long facultative and maturation ponds. Facultative ponds havea length-to-width ratio of 1:12.5 to approximate plugflow conditions (Mara et al, 1992; Mara, 1994).The facultative ponds are 400 m long and 32 m wide. Duckweed maturation ponds have a length-to-width ration of 1:14. They are 400 m long and 28 m wide. In order to avoid piling of duckweed bywind, floating baffles of split bamboo are laid in a grid of 5 m x 5 m.
The vertical position of the pond system is designed to minimize net excavation. This means that thevolume excavated should equal the volume elevated above original ground level (see equation 19).Average original ground level is 954.25 m. Freeboard of all pods is 0.5 m. The maximum inflow levelis 956.74 m (the head of the wastewater after crossing the River Cauca). The minimum outflow level is954.56 m (the water level at the top of the irrigation canal system. The optimum situation is an outflowlevel of 954.57 m out of the ultimate duckweed pond, and an inlet level of 956.06 m. For this situationthe excavation balance is presented in table 8, and the cross-section is presented in figure 13. For headlosses in the pond system see table 9.
V. ponds (19)
Table 8: excavation pond system
pond
anaerobic
facultative
maturation I
maturationII
depthofpond
m
4
1,5
1
1.45
water levelelevation
m
955,74
955,51
955,
954,89
bottompond-
(1)
m
-2.51
-0.24
0.16
-0.81
areaiipnds
m*
5800
51200
44800
44800
top dike*
m
1.98
1.75
1.65
1.13
areadikes
m2
3070
14800
9120
5120
TOTAL NETEXCAVATION
excavation "
m2
-8449
13760
22307
-28147
-529
* in relation to the original ground level** excavation of pond is (1)*(2) +(3)*(4)
47

4.4.9 Structures and PipingPiping within the pond system as well as the transport across the River Cauca can be calculated usingthe formula of Strickler (equation 20, rewritten in equation 21). The hydraulic radius of a pipeline isone fourth of the diameter. The head losses in the pipes consist of friction losses and local losses (seeequation 22, 44). Maximum velocity in all pipelines is 2 m/s.
, 2 1
Q = 0.312* ks * D 3 * s 2 (20)
Hf = s * L = [0.312 *ks*D*3 (21)
where: ks = Strickler roughness coefficient [mi;3/s];D = diameter [m];s = slope [-];Hf = friction head loss [m];L = length of pipe [m];
H = Hf + H, = S*L + k*-Z— (22)2*g
where: H = total head loss [m];H, = local head loss [m];k = local head loss coefficient [-];v = velocity [m/s];g = 9.81 m2/s;
Piping in Treatment SystemIn the pond system head losses consist of friction head losses and local head losses in pipes and thehead loss over the ponds (Hp). Pipelines are made of concrete (Strickler roughness coefficient is 75m1/3/s). The slopes of the pipes are l%o, and 2%o. Total head loss in the system is 1.39 m. The headlosses and pipes of the pond system are presented in table 9.
Table 9: Piping in pond system
pipe
crossing
to anaerobic pond
anaerobic * facultative
facultative - maturationi
maturationi - maturationZ
outlet canal
l/s
500
250
250
125
125
900
L
m
200
266
150
10
10
380
i
1e-3
4
1
1,0
2,0
2,0
0,2
D
m
0.63
0,68
0,53
0,47
0,47
k
-
4
0
1,2
0,8
0
open canal
Hf
m
0.8
0,266
0,15
0,02
0,02
0,19
HI
m
0,56
0,00
0,03
0,03
0,00
0,00
Htotal
m
1,36
0,32
0,25
0,12
0,52
0,19
48
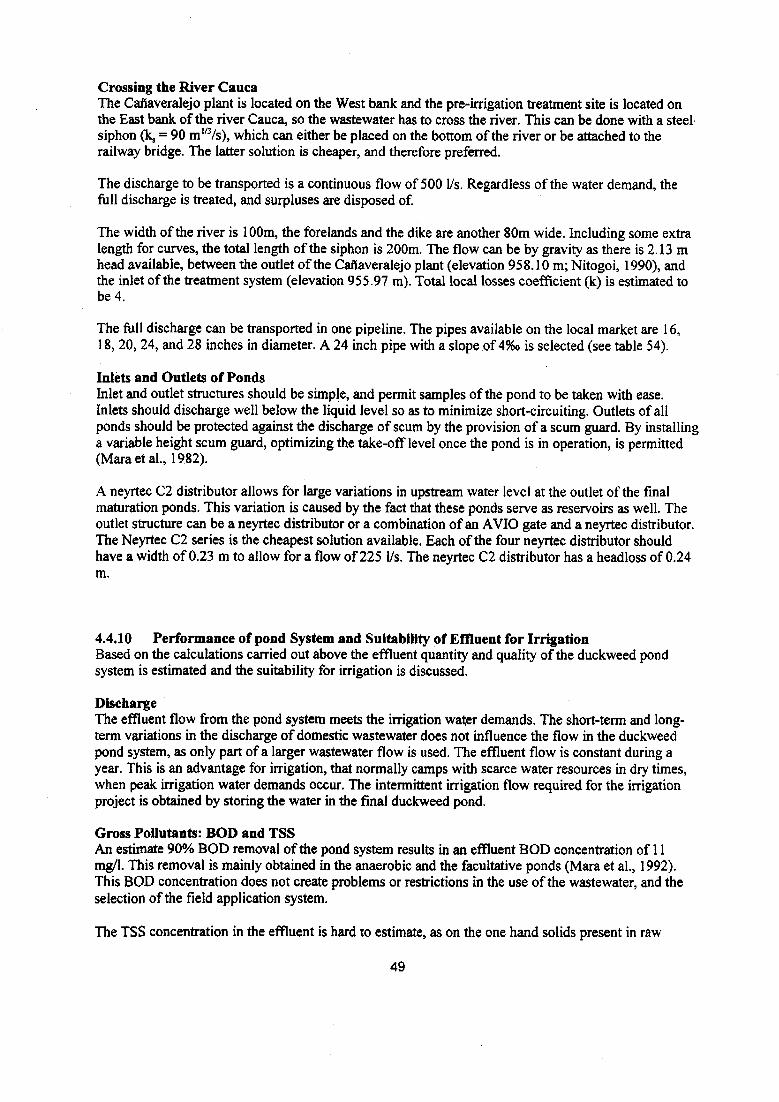
Crossing the River CaucaThe Cañaveralejo plant is located on the West bank and the pre-irrigation treatment site is located onthe East bank of the river Cauca, so the wastewater has to cross the river. This can be done with a steelsiphon (k, = 90 m1/3/s), which can either be placed on the bottom of the river or be attached to therailway bridge. The latter solution is cheaper, and therefore preferred.
The discharge to be transported is a continuous flow of 500 1/s. Regardless of the water demand, thefull discharge is treated, and surpluses are disposed of.
The width of the river is 100m, the forelands and the dike are another 80m wide. Including some extralength for curves, the total length of the siphon is 200m. The flow can be by gravity as there is 2.13 mhead available, between the outlet of the Cañaveralejo plant (elevation 958.10 m; Nitogoi, 1990), andthe inlet of the treatment system (elevation 955.97 m). Total local losses coefficient (k) is estimated tobe 4.
The full discharge can be transported in one pipeline. The pipes available on the local market are 16,18, 20, 24, and 28 inches in diameter. A 24 inch pipe with a slope of 4%o is selected (see table 54).
Inlets and Outlets of PondsInlet and outlet structures should be simple, and permit samples of the pond to be taken with ease.Inlets should discharge well below the liquid level so as to minimize short-circuiting. Outlets of allponds should be protected against the discharge of scum by the provision of a scum guard. By installinga variable height scum guard, optimizing the take-off level once the pond is in operation, is permitted(Mara et al., 1982).
A neyrtec C2 distributor allows for large variations in upstream water level at the outlet of the finalmaturation ponds. This variation is caused by the fact that these ponds serve as reservoirs as well. Theoutlet structure can be a neyrtec distributor or a combination of an AVIO gate and a neyrtec distributor.The Neyrtec C2 series is the cheapest solution available. Each of the four neyrtec distributor shouldhave a width of 0.23 m to allow for a flow of 225 1/s. The neyrtec C2 distributor has a headloss of 0.24m.
4.4.10 Performance of pond System and Suitability of Effluent for IrrigationBased on the calculations carried out above the effluent quantity and quality of the duckweed pondsystem is estimated and the suitability for irrigation is discussed.
DischargeThe effluent flow from the pond system meets the irrigation water demands. The short-term and long-term variations in the discharge of domestic wastewater does not influence the flow in the duckweedpond system, as only part of a larger wastewater flow is used. The effluent flow is constant during ayear. This is an advantage for irrigation, that normally camps with scarce water resources in dry times,when peak irrigation water demands occur. The intermittent irrigation flow required for the irrigationproject is obtained by storing the water in the final duckweed pond.
Gross Pollutants: BOD and TSSAn estimate 90% BOD removal of the pond system results in an effluent BOD concentration of 11mg/1. This removal is mainly obtained in the anaerobic and the facultative ponds (Mara et al., 1992).This BOD concentration does not create problems or restrictions in the use of the wastewater, and theselection of the field application system.
The TSS concentration in the effluent is hard to estimate, as on the one hand solids present in raw
49
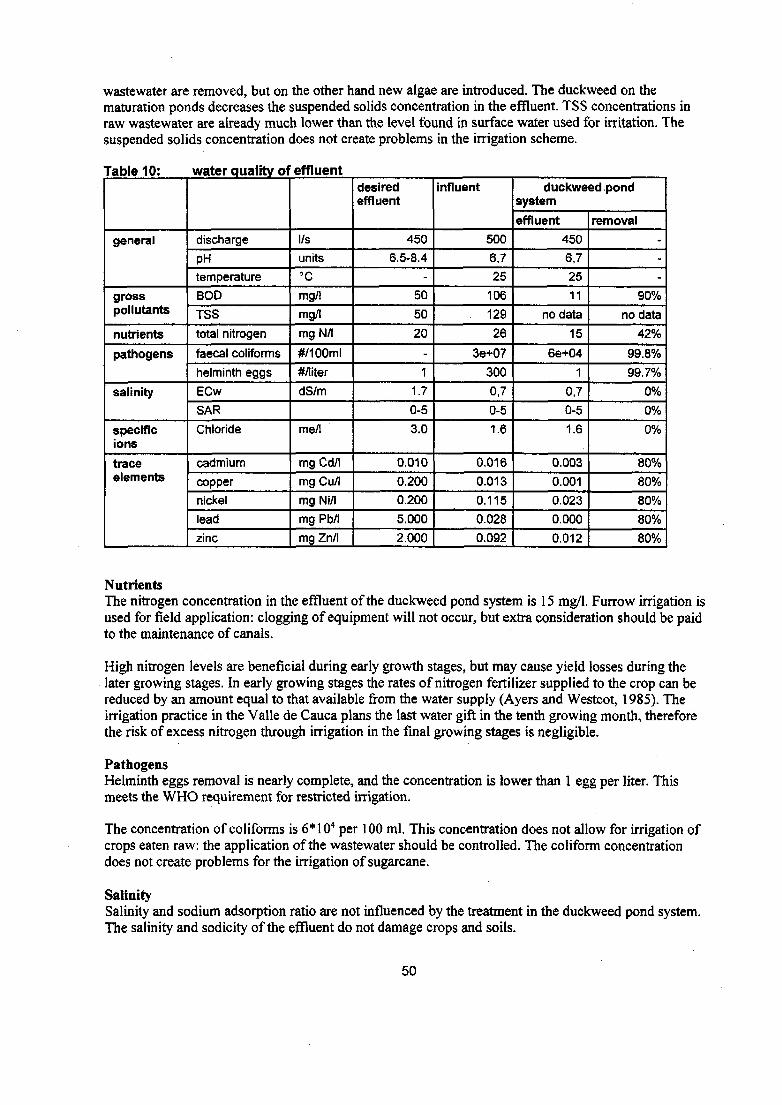
wastewater are removed, but on the other hand new algae are introduced. The duckweed on thematuration ponds decreases the suspended solids concentration in the effluent. TSS concentrations inraw wastewater are already much lower than the level found in surface water used for irritation. Thesuspended solids concentration does not create problems in the irrigation scheme.
Table 10:
general
grosspollutants
nutrients
pathogens
salinity
specificions
traceelements
water quality of effluent
discharge
PH
temperature
BOD
TSS
total nitrogen
faecal conforms
helminth eggs
ECwSAR
Chloride
cadmium
copper
nickel
lead
zinc
l/s
units
°Cmg/l
mg/l
mg N/I
#/100ml
«/liter
dS/m
me/I
mg Cd/I
mg Cu/l
mg Ni/l
mg Pb/I
mg Zn/I
desiredeffluent
450
6.5-8.4
-
50
50
20
-
1
1.7
0-5
3.0
0.010
0.200
0.200
5.000
2.000
influent
500
6,7
25106
. 129
26
3e+07
300
0,7
0-5
1.6
0.016
0.013
0.115
0.028
0.092
duckweed pondsystem
effluent
450
6,7
25
11
no data
15
6e+04
1
0,7
0-5
1.6
0.003
0.001
0.023
0.000
0.012
removal
-
-
-
90%
no data
42%
99.8%
99.7%
0%
0%
0%
80%
80%
80%
80%
80%
NutrientsThe nitrogen concentration in the effluent of the duckweed pond system is 15 mg/l. Furrow irrigation isused for field application: clogging of equipment will not occur, but extra consideration should be paidto the maintenance of canals.
High nitrogen levels are beneficial during early growth stages, but may cause yield losses during thelater growing stages. In early growing stages the rates of nitrogen fertilizer supplied to the crop can bereduced by an amount equal to that available from the water supply (Ayers and Westcot, 1985). Theirrigation practice in the Valle de Cauca plans the last water gift in the tenth growing month, thereforethe risk of excess nitrogen through irrigation in the final growing stages is negligible.
PathogensHelminth eggs removal is nearly complete, and the concentration is lower than 1 egg per liter. Thismeets the WHO requirement for restricted irrigation.
The concentration of coliforms is 6*10" per 100 ml. This concentration does not allow for irrigation ofcrops eaten raw: the application of the wastewater should be controlled. The coliform concentrationdoes not create problems for the irrigation of sugarcane.
SalinitySalinity and sodium adsorption ratio are not influenced by the treatment in the duckweed pond system.The salinity and sodicity of the effluent do not damage crops and soils.
50
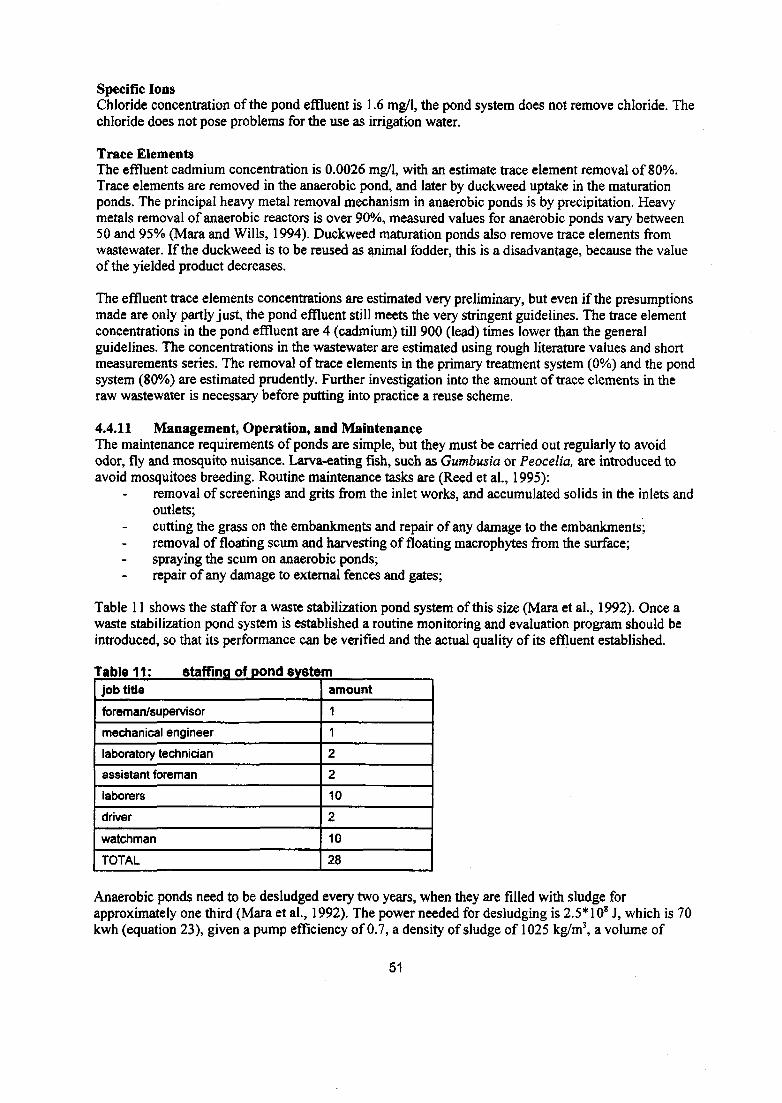
Specific IonsChloride concentration of the pond effluent is 1.6 mg/1, the pond system does not remove chloride. Thechloride does not pose problems for the use as irrigation water.
Trace ElementsThe effluent cadmium concentration is 0.0026 mg/1, with an estimate trace element removal of 80%.Trace elements are removed in the anaerobic pond, and later by duckweed uptake in the maturationponds. The principal heavy metal removal mechanism in anaerobic ponds is by precipitation. Heavymetals removal of anaerobic reactors is over 90%, measured values for anaerobic ponds vary between50 and 95% (Mara and Wills, 1994). Duckweed maturation ponds also remove trace elements fromwastewater. If the duckweed is to be reused as animal fodder, this is a disadvantage, because the valueof the yielded product decreases.
The effluent trace elements concentrations are estimated very preliminary, but even if the presumptionsmade are only partly just, the pond effluent still meets the very stringent guidelines. The trace elementconcentrations in the pond effluent are 4 (cadmium) till 900 (lead) times lower than the generalguidelines. The concentrations in the wastewater are estimated using rough literature values and shortmeasurements series. The removal of trace elements in the primary treatment system (0%) and the pondsystem (80%) are estimated prudently. Further investigation into the amount of trace elements in theraw wastewater is necessary before putting into practice a reuse scheme.
4.4.11 Management, Operation, and MaintenanceThe maintenance requirements of ponds are simple, but they must be carried out regularly to avoidodor, fly and mosquito nuisance. Larva-eating fish, such as Gumbusia or Peocelia, are introduced toavoid mosquitoes breeding. Routine maintenance tasks are (Reed et al., 1995):
removal of screenings and grits from the inlet works, and accumulated solids in the inlets andoutlets;cutting the grass on the embankments and repair of any damage to the embankments;removal of floating scum and harvesting of floating macrophytes from the surface;spraying the scum on anaerobic ponds;repair of any damage to external fences and gates;
Table 11 shows the staff for a waste stabilization pond system of this size (Mara et al., 1992). Once awaste stabilization pond system is established a routine monitoring and evaluation program should beintroduced, so that its performance can be verified and the actual quality of its effluent established.
Table 11 : staffing of pond systemjob title
foreman/supervisor
mechanical engineer
laboratory technician
assistant foreman
laborers
driver
watchman
TOTAL
amount
1
1
2
2
10
2
10
28
Anaerobic ponds need to be desludged every two years, when they are filled with sludge forapproximately one third (Mara et al., 1992). The power needed for desludging is 2.5* 108 J, which is 70kwh (equation 23), given a pump efficiency of 0.7, a density of sludge of 1025 kg/m3, a volume of
51

3500 m3, and a head of 5 m (out of the pond, up a bit and friction losses.
p ^ = g * € W * U * H (23)
where: Power - power [J];Pskdge = density of sludge [kg/m3] ;•n = efficiency [-];
4.5 No Pre-irrigation Treatment Alternative
The use of primary effluent of the Cañaveralejo plant for irrigation without further treatment posessome risks for public health, crops, and soils. On the other hand it saves large expenditure onwastewater treatment. The decision whether to provide pre-irrigation treatment is an economic decision.Risks have to be balanced against costs. The no pre-irrigation alternative is evaluated in the feasibilityevaluation (chapter 6) as alternative 2.
RisksThe primary effluent of the Cañaveralejo plant does not meet the guidelines for BOD, TSS, nitrogen,helminth eggs, and cadmium (see §4.1.3). This poses problems to public health (helminth eggs) andcrops and soils (cadmium).
The BOD concentration of the primary effluent (106 mg/1) does not pose serious problems. Standardsfor BOD in irrigation water contradict each other. The TSS concentration (129 mg/1) does increasemaintenance costs slightly, but do not create risks to crops, soils or public health. The nitrogenconcentration (26 mg/1) does increase maintenance costs, but decreases the use of fertilizers. Thenitrogen concentration does not create a public health risk through the pollution of groundwater (see§5.3.1).
The helminth eggs concentration in the primary effluent (300 eggs/1) does create a public health risk tothe workers in the sugarcane fields. Consumers of sugarcane are not affected, as this crop is processedand cooked before consumption. If farmers use the irrigation water for other crops, consumers are indanger. Protective measures can reduce the public health risk. These measures include protectiveclothing for workers, and information about the location of fields and risks to the local community.
The cadmium concentration (0.016 mg/1) is only slightly above the guideline set by the FAO (0.010mg/1). The measurements of cadmium and other trace elements are, however, so rough, that problemswith crops and soils could occur. The wastewater should before investigated more thoroughly beforeputting into practice a reuse scheme with primary effluent.
StoragePrimary effluent requires additional treatment prior to storage, to prevent reservoirs from becomingseptic (Smith et al, 1985). Night reservoirs cannot be used. The discharge of the influent will beintermittent: during the night and the weekend no water will be transported across the river.
CrossingFor direct application of primary effluent irrigation water has to be transported across the river duringdaytime, when land is irrigated. The outlet of the Cañaveralejo plant is 958.10 m, the inlet of theirrigation system is 954.56 m. The head available for the crossing is 3.54 m. For flexibility a number ofsmaller pipes is preferred, and an intermittent flow of 900 1/s if the primary effluent is used directly forirrigation. For the intermittent flow of 900 1/s three pipes of 18' with a slope of 7.5%o are the cheapestcombination.
52
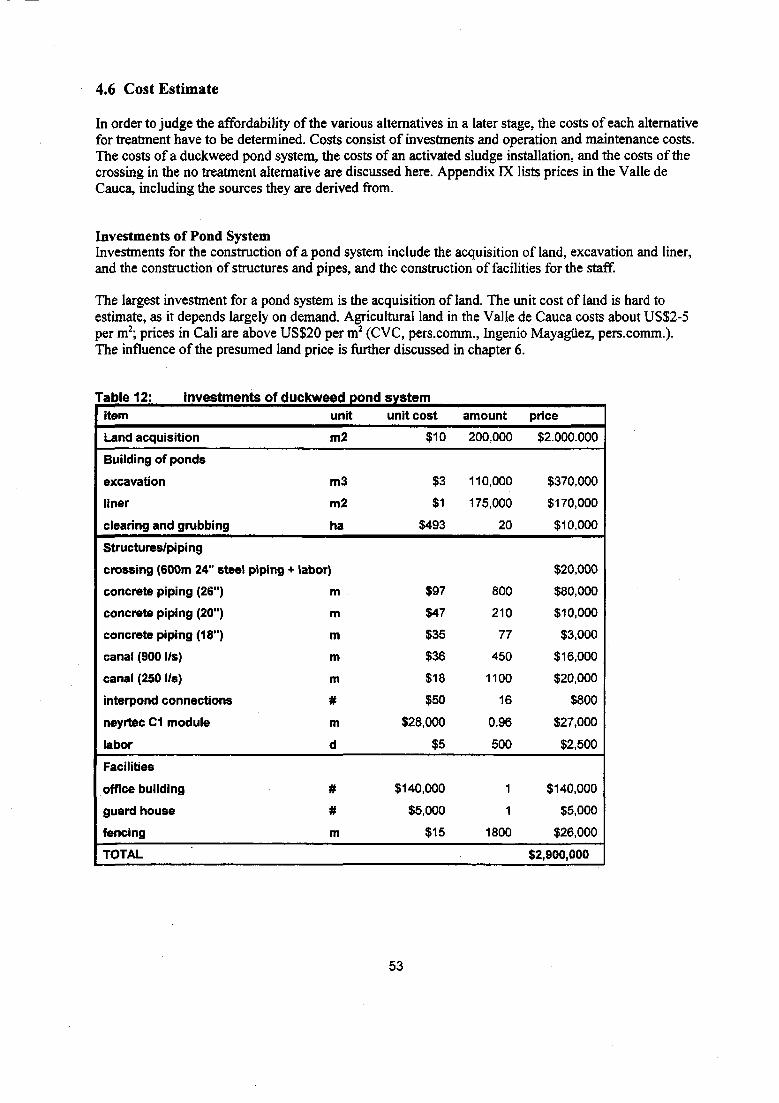
4.6 Cost Estímate
In order to judge the affordability of the various alternatives in a later stage, the costs of each alternativefor treatment have to be determined. Costs consist of investments and operation and maintenance costs.The costs of a duckweed pond system, the costs of an activated sludge installation, and the costs of thecrossing in the no treatment alternative are discussed here. Appendix IX lists prices in the Valle deCauca, including the sources they are derived from.
Investments of Pond SystemInvestments for the construction of a pond system include the acquisition of land, excavation and liner,and the construction of structures and pipes, and the construction of facilities for the staff.
The largest investment for a pond system is the acquisition of land. The unit cost of land is hard toestimate, as it depends largely on demand. Agricultural land in the Valle de Cauca costs about USS2-5per m2; prices in Cali are above US$20 per m2 (CVC, pers.comm., Ingenio Mayagüez, pers.comm.).The influence of the presumed land price is further discussed in chapter 6.
Table 12: investments of duckweed ponditem
Land acquisition
Building of ponds
excavation
liner
clearing and grubbing
Structures/piping
crossing (600m 24" steel piping -i
concrete piping (26")
concrete piping (20")
concrete piping (18")
canal (900 l/s)
canal (250 l/s)
interpond connections
neyrtec C1 module
labor
Facilities
office building
guard house
fencing
TOTAL
unit
m2
m3
m2
ha
i- labor)
m
m
m
m
m
#
m
d
#
#
m
systemunit cost
$10
$3
$1
$493
$97
$47
$35
$36
$18
$50
$28,000
$5
$140,000
$5,000
$15
amount
200,000
110,000
175,000
20
800
210
77
450
1100
16
0.96
500
1
1
1800
price
$2.000.000
$370,000
$170,000
$10,000
$20,000
$80,000
$10,000
$3,000
$16,000
$20,000
$800
$27,000
$2,500
$140,000
$5,000
$26,000
$2,900,000
53

The digging of the ponds involves over 100,000 m3 of groundwork, and 175,000 m2 of lining withgeotextile. Prices for excavation and geotextile are known (see appendix IX). A large volume has to beexcavated, although net excavation is very small.
The investment for structures and pipes are US$1505000. This includes the steel piping to cross theriver Cauca, 1100 m of concrete piping, and 500 m of open canal, 16 interpond connections, 4 neyrtecCl modules. These amounts are based on table 9 and figure 13.
The costs of the office, the guard house, and the fencing are US$165,000. The office facilitates forpond staff and irrigation scheme staff (see §5.2.4).
Annual Costs of Pond SystemThe annual costs of the pond system are US$200,000. Annual costs of the pond system includepersonnel, materials, costs of desludging, and maintenance of the crossing.
The personnel of the pond system is discussed in §4.4.11. Material costs are presumed to be 1% of theconstruction costs, as there are hardly any mechanical parts in the system. Desludging is discussed in§4.4.11. The maintenance of the crossing is 1% of the construction costs of the crossing.
Table 13: Annual costsitem
Personnel
foreman/supervisor
mechanical engineer
laboratory technician
assistant foreman
laborers
drivers
watchmen
materials
Desludging
desludger hire
pumping of desludging
sludge disposal
maintenance of crossing
TOTAL
of duckweed pond systemunit
year
year
year
year
year
year
year
-
days
kwh
m3
year
unit cost amount
$11,048
$8,406
$4,803
$7,085
$2,557
$2,401
$2,401
$29,000
$2,501
$0.071
$14.65
$197
1
1
2
10
2
5
10
1
35
1750
1
price
$11,000
$8,400
$9,600
$70,900
$5,100
$12,000
$24,000
$29,000
$2,500
$3
$25,600
$200
$200,000
54
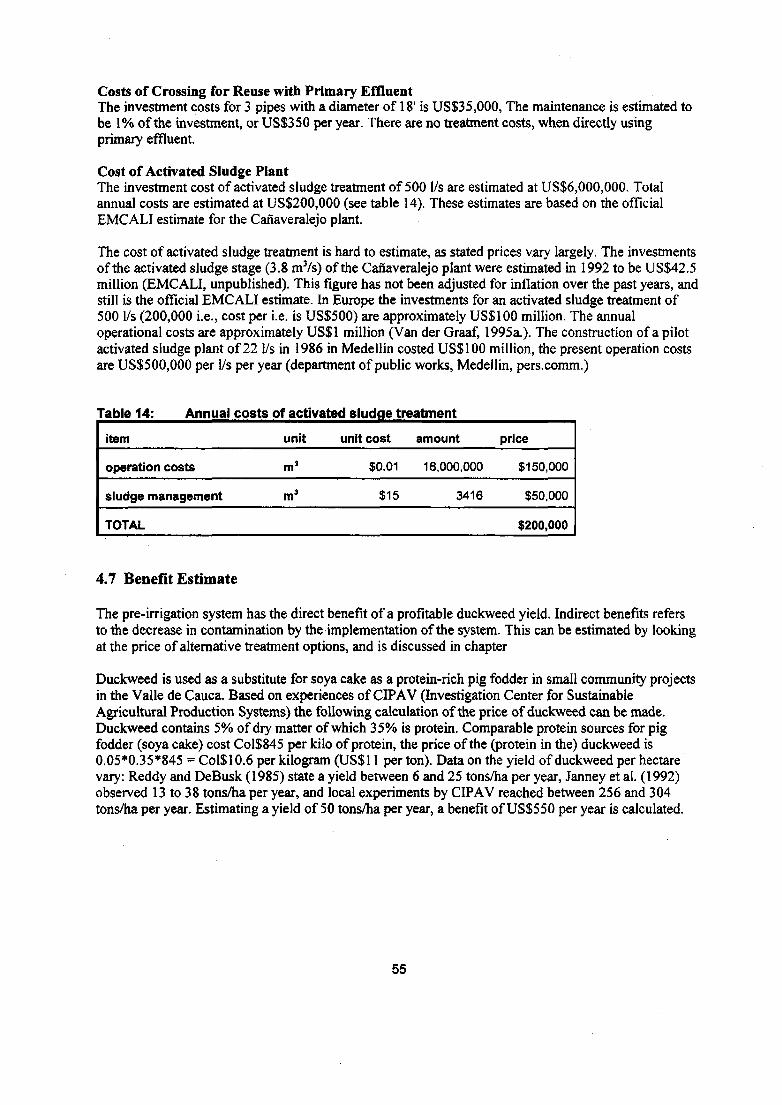
Costs of Crossing for Reuse with Primary EffluentThe investment costs for 3 pipes with a diameter of 18' is US$35,000, The maintenance is estimated tobe 1% of the investment, or US$350 per year. There are no treatment costs, when directly usingprimary effluent.
Cost of Activated Sludge PlantThe investment cost of activated sludge treatment of 500 1/s are estimated at US$6,000,000. Totalannual costs are estimated at US$200,000 (see table 14). These estimates are based on the officialEMCALI estimate for the Cañaveralejo plant.
The cost of activated sludge treatment is hard to estimate, as stated prices vary largely. The investmentsof the activated sludge stage (3.8 mVs) of the Cañaveralejo plant were estimated in 1992 to be US$42.5million (EMCALI, unpublished). This figure has not been adjusted for inflation over the past years, andstill is the official EMCALI estimate. In Europe the investments for an activated sludge treatment of500 1/s (200,000 i.e., cost per i.e. is US$500) are approximately US$100 million. The annualoperational costs are approximately US$1 million (Van der Graaf, 1995a.). The construction of a pilotactivated sludge plant of 22 1/s in 1986 in Medellin costed US$100 million, the present operation costsare US$500,000 per 1/s per year (department of public works, Medellin, pers.comm.)
Table 14: Annual costs of activated sludge treatment
item
operation costs
sludge management
TOTAL
unit
m3
m>
unit cost
$0.01
$15
amount
16,000,000
3416
price
$150,000
$50,000
$200,000
4.7 Benefit Estímate
The pre-irrigation system has the direct benefit of a profitable duckweed yield. Indirect benefits refersto the decrease in contamination by the implementation of the system. This can be estimated by lookingat the price of alternative treatment options, and is discussed in chapter
Duckweed is used as a substitute for soya cake as a protein-rich pig fodder in small community projectsin the Valle de Cauca. Based on experiences of CIPA V (Investigation Center for SustainableAgricultural Production Systems) the following calculation of the price of duckweed can be made.Duckweed contains 5% of dry matter of which 35% is protein. Comparable protein sources for pigfodder (soya cake) cost Col$845 per kilo of protein, the price of the (protein in the) duckweed is0.05*0.35*845 = Col$10.6 per kilogram (US$11 per ton). Data on the yield of duckweed per hectarevary: Reddy and DeBusk (1985) state a yield between 6 and 25 tons/ha per year, Janney et al. (1992)observed 13 to 38 tons/ha per year, and local experiments by CIPAV reached between 256 and 304tons/ha per year. Estimating a yield of 50 tons/ha per year, a benefit of US$550 per year is calculated.
55

56

5 Predesign Irrigation System for Cañaveralejo project
This chapter presents the design of an irrigation system. The effluent from the pre-irrigation treatmentin chapter 4 serves as the water resource. All stages of the design feature on water qualityconsiderations. The irrigation area is described in §5.1. §5.2 characterizes the irrigation scheme. Waterrequirements are discussed in §5.3. The layout and the design of canals and structures follow in §5.4and §5.5. An example of a tertiary unit design is developed in §5.6. The final part of the chapter liststhe benefits (§5.7) and the costs of the irrigation scheme (§5.8).
5.1 Characterization of the Irrigation Area
The irrigation area is characterized by climate, soils and topography, the crop, the management andorganization of farmers, the population, present irrigation practices and water resources.
5.1.1 ClimateThe dominant climate is an Aaf-climate in terms of the Koppen's classification: A tropical forestclimate with all months average above 18°C, warmest month above 22°C and rainfall in every monthof the year. Climate contrasts within short distances are widely developed in the northern portion oftropical America, and the deep valley of the river Cauca has a complex climatic pattern, with variousmicro-climates (Rumney, 1967).
Average annual rainfall in the study area is in the range of 850 mm to 1100 mm, dry months beingJanuary/February and July/August, wet months being April/May/June and October/November.Evaporation is 1400 mm to 1600 mm annually. Humidity is high, between 70 and 80%. Averagetemperature is 24°C. Wind velocity does not exceed 2 ni/s. A more detailed description of the climateis given in appendix IV.
The precipitation data of the Planta Rio Cauca station are used in this design. This series is the longestand most representative available in the area. Only open-pan evaporation is measured in the Valle deCauca. Evaporation data of the Granja ICA are used, because this is the longest series available (seetable 15, and figure 14).
Table 15: Evaporation and Rainfall
Evaporation
Rainfall
average
80% dep
effective
Deficit
Jan
144
51
18
15
-94
Feb
136
74
22
17
-62
Mar
150
115
63
50
-35
Apr
130
139
84
67
9
May
124
115
58
46
-9
Jun
120
74
32
25
-46
Jul
139
41
13
10
-98
Aug
148
52
12
10
-96
Sep
144
66
26
21
-78
Oct
139
127
83
66
-12
Nov
123
104
62
50
-19
Dec
132
77
39
31
-55
Ann
1627
1033
512
409
-594
57
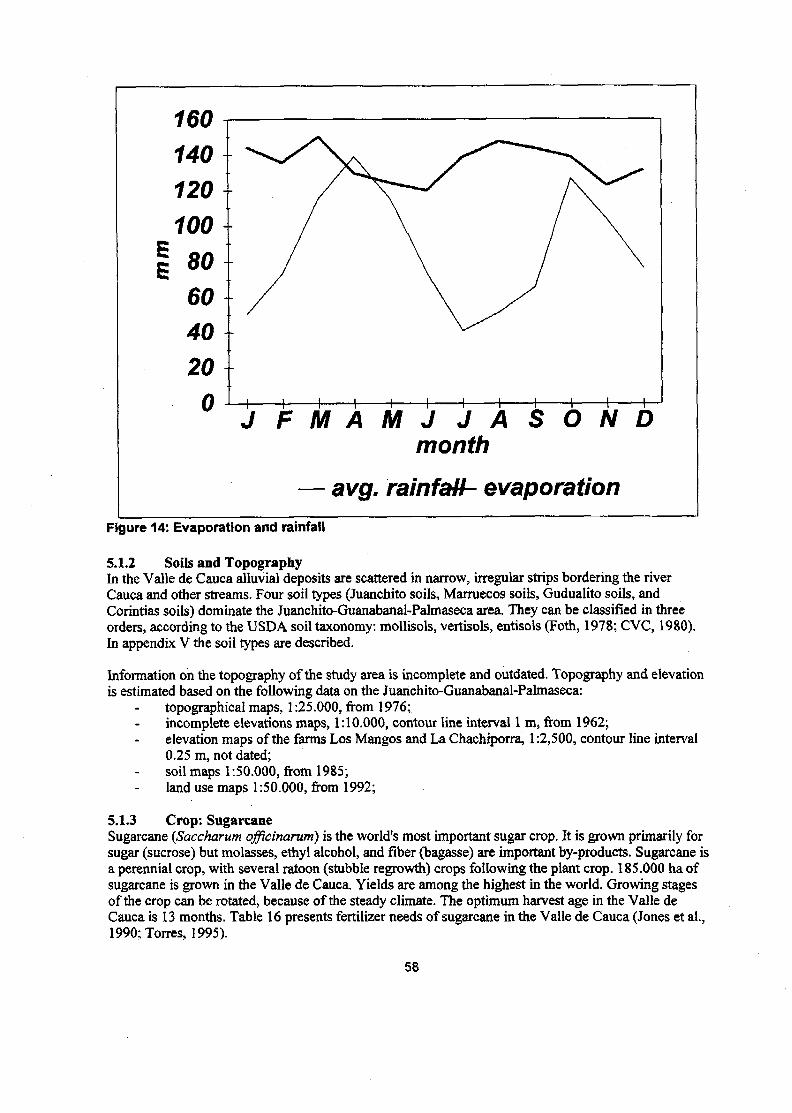
J F M A M J J A S O N Dmonth
avg. rainfaU- evaporation
Figure 14: Evaporation and rainfall
5.1.2 Soils and TopographyIn the Valle de Cauca alluvial deposits are scattered in narrow, irregular strips bordering the riverCauca and other streams. Four soil types (Juanchito soils, Marruecos soils, Gudualito soils, andCorintias soils) dominate the Juanchito-Guanabanal-Palmaseca area. They can be classified in threeorders, according to the USDA soil taxonomy: mollisols, vertisols, entisols (Foth, 1978; CVC, 1980).In appendix V the soil types are described.
Information on the topography of the study area is incomplete and outdated. Topography and elevationis estimated based on the following data on the Juanchito-Guanabanal-Palmaseca:
topographical maps, 1:25.000, from 1976;incomplete elevations maps, 1:10.000, contour line interval 1 m, from 1962;elevation maps of the farms Los Mangos and La Chachiporra, 1:2,500, contour line interval0.25 m, not dated;soil maps 1:50.000, from 1985;land use maps 1:50.000, from 1992;
5.1.3 Crop: SugarcaneSugarcane (Saccharum officinarum) is the world's most important sugar crop. It is grown primarily forsugar (sucrose) but molasses, ethyl alcohol, and fiber (bagasse) are important by-products. Sugarcane isa perennial crop, with several ratoon (stubble regrowth) crops following the plant crop. 185.000 ha ofsugarcane is grown in the Valle de Cauca. Yields are among the highest in the world. Growing stagesof the crop can be rotated, because of the steady climate. The optimum harvest age in the Valle deCauca is 13 months. Table 16 presents fertilizer needs of sugarcane in the Valle de Cauca (Jones et al.,1990; Torres, 1995).
58
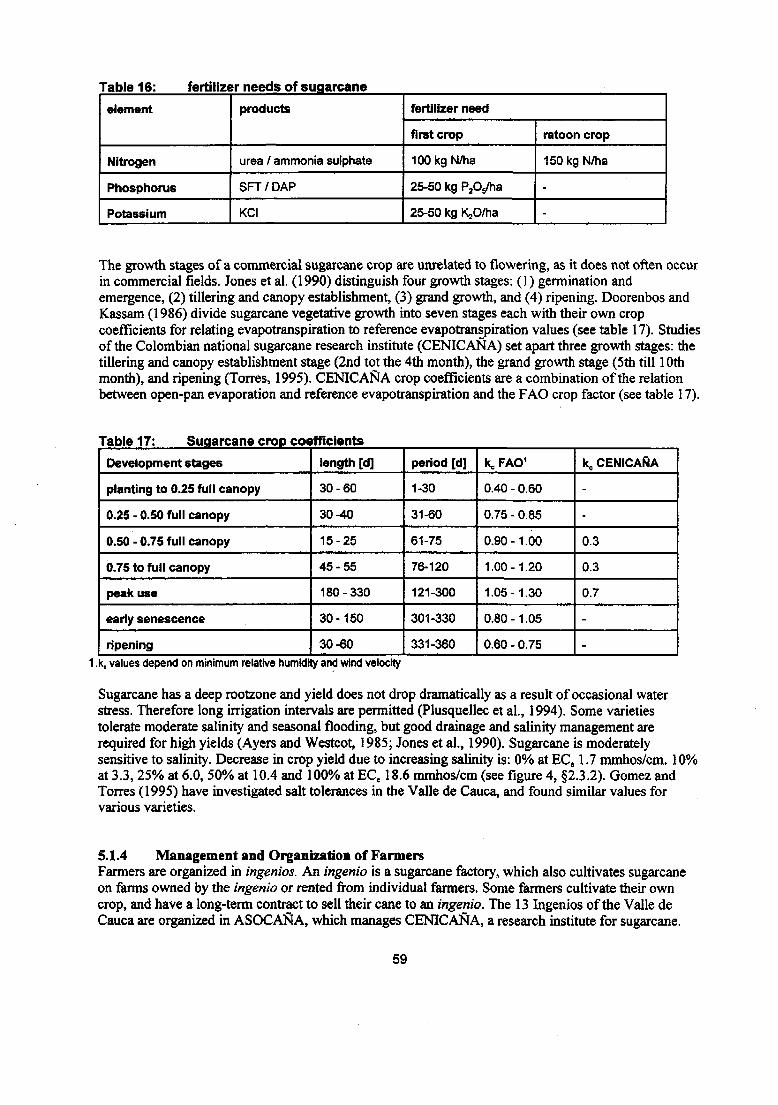
Table 16: fertilizer needs of sugarcane
element
Nitrogen
Phosphorus
Potassium
products
urea / ammonia sulphate
SFT/DAP
KCI
fertilizer need
first crop
100kgN/ha
25-50 kg PjOj/ha
25-50 kg K3O/ha
ratoon crop
150kgN/ha
-
-
The growth stages of a commercial sugarcane crop are unrelated to flowering, as it does not often occurin commercial fields. Jones et al. (1990) distinguish four growth stages: (1) germination andemergence, (2) tillering and canopy establishment, (3) grand growth, and (4) ripening. Doorenbos andKassam (1986) divide sugarcane vegetative growth into seven stages each with their own cropcoefficients for relating evapotranspiration to reference evapotranspiration values (see table 17). Studiesof the Colombian national sugarcane research institute (CENICAÑA) set apart three growth stages: thetillering and canopy establishment stage (2nd tot the 4th month), the grand growth stage (5th till 1 Othmonth), and ripening (Torres, 1995). CENICAÑA crop coefficients are a combination of the relationbetween open-pan evaporation and reference evapotranspiration and the FAO crop factor (see table 17).
Table 17: Sugarcane crop coefficients
Development stages
planting to 0.25 full canopy
0.25 - 0.50 full canopy
0.50 - 0.75 full canopy
0.75 to full canopy
peak use
early senescence
ripening
length [d]
30-60
30-40
15-25
45-55
180-330
30-150
30-60
period [d]
1-30
31-60
61-75
76-120
121-300
301-330
331-360
KFAO1
0.40 - 0.60
0.75 - 0.85
0.90-1.00
1.00-1.20
1.05-1.30
0.80-1.05
0.60 - 0.75
ke CENICAÑA
-
-
0.3
0.3
0.7
-
-
1 .ks values depend on minimum relative humidity and wind velocity
Sugarcane has a deep rootzone and yield does not drop dramatically as a result of occasional waterstress. Therefore long irrigation intervals are permitted (Plusquellec et al., 1994). Some varietiestolerate moderate salinity and seasonal flooding, but good drainage and salinity management arerequired for high yields (Ayers and Westcot, 1985; Jones et al , 1990). Sugarcane is moderatelysensitive to salinity. Decrease in crop yield due to increasing salinity is: 0% at ECe 1.7 mmhos/cm. 10%at 3.3, 25% at 6.0, 50% at 10.4 and 100% at ECe 18.6 mmhos/cm (see figure 4, §2.3.2). Gomez andTorres (1995) have investigated salt tolerances in the Valle de Cauca, and found similar values forvarious varieties.
5.1.4 Management and Organization of FarmersFarmers are organized in ingenios. An ingenio is a sugarcane factory, which also cultivates sugarcaneon farms owned by the ingenio or rented from individual farmers. Some farmers cultivate their owncrop, and have a long-term contract to sell their cane to an ingenio. The 13 Ingenios of the Valle deCauca are organized in ASOCAÑA, which manages CENICAÑA, a research institute for sugarcane.
59

5.1.5 PopulationThe total population of the area between the Rio Cauca and the Rio Fraile is approximately 3,000people: 1,000 in Caucaseca, 1,300 in Las Dolores and 700 in farms and houses scattered throughout thearea. Caucaseca is a settlement South of the Cali-Palmira road, adjacent to the Rio Fraile. Caucasecahad 225 inhabitants in 1988 (Bocanegra and Giraldo, 1989); on a field visit the village appeared tohave grown to approximately 1,000 inhabitants. Las Dolores is a mainly industrial area on the border ofthe River Cauca, just North of the Cali-Palmira road. It had 1307 inhabitants in 1988, which still seemsa realistic figure (Bocanegra and Giraldo, 1989).
5.1.6 Present Irrigation Practices in the Valle de CaucaIrrigation in the Valle de Cauca is mainly furrow irrigation. High pumping costs forced the sugarcaneproducers to improve furrow irrigation practices and to look for other irrigation techniques, such assprinkler irrigation and trickle irrigation. Although irrigation programming is improved, some farmersstill do not take into consideration the relation soil-water-crop (Aristazabal and Zambrano, 1993).
Field Application SystemsFurrow irrigation systems have been improved in various ways in the past few years. Reduced furrowlength has increased the uniformity of application and the field application efficiency. Alternatingfurrows (giving water only to one furrow out of two or three) has raised efficiency. The new alternatingfurrow technique does not only save spending on water supply, but also decreases labor costs. It isimplemented in 50-60% of the sugarcane fields in the Valle de Cauca. Unimproved furrow irrigationsystems in the Valle de Cauca have a field water application efficiency of 20 to 30%, alternatingfurrows systems have field application efficiencies of 40-50% (Torres, CENICAÑA, pers.comm.).
Sprinkler systems are used in 10- 15% of the Valle de Cauca, mainly at locations where furrowirrigation is not practicable. CENICAÑA found that up till now it is not economically feasible for mostingenios to switch to sprinkler systems (Cruz, CENICAÑA, pers.comm.).
Trickle irrigation is practiced in only 1-2% of the Valle de Cauca. CENICAÑA investigators found nodifference in the production of sugar between fields irrigated with trickle irrigation or with alternatingfurrow irrigation. Water use is about 50% lower with trickle irrigation. With the present cost of watertrickle irrigation is only feasible in areas where water is very scarce (Cruz, CENICAÑA, pers.comm.).
Conveyance and Distribution SystemFarms in the Valle de Cauca have their own water supply, either from adjacent rivers or from wells.Therefore they are not used to sharing water. In the Valle de Cauca the quaternary units are in generalbetween 4 and 11 ha: furrows are 100 to 120 m long, furrows are 1.5 m apart and 250 to 500 furrowsare served by one quaternary canal (Caraval and Marmolejo, 1989).
Sharp-edged adjustable gates and broad-crested measuring weirs are the only structures in operation inthe Valle de Cauca (Torres and Cruz, 1993). The absence of more sophisticated structures is due theminimal need for discharge measuring and regulating in the decentralized irrigation practices. DistrictoRUT in the Northern part of the Valle de Cauca is one of the few centralized irrigation schemes. In thisscheme there is some experience with automatic downstream regulators but parts were stolen, and lackof experience reduced the operation possibilities. The regulators are now replaced for more robuststructures. Theft and vandalism is a problem with all advanced equipment used in sugarcane irrigationin the Valle de Cauca.
Losses in tertiary canals are very high. CENICAÑA has developed a system to decrease lossesdrastically: the use of flexitubes and polyethylene pipes instead of open canals. This measure increasesdistribution efficiencies to 85%- 90% (Cruz et al., 1995).
60

A study on conveyance systems in an area, which is adjacent to the Juanehito-Guanabanal-Palmasecaarea, showed efficiencies in primary and secondary canals of 51% (Caraval and Marmolejo, 1989).Causes for this low performance include long canal lengths, poor maintenance, occasional overflow dueto excess discharges, bad construction of canals without taking into account soil characteristics, anddeterioration of gates. Benitez (1994) quotes an average efficiency of primary canals in another part ofthe Valle de Cauca of 79%, and states that lining of canals is economically feasible because of highcosts of pumping groundwater.
Primary canals are between 500 and 4000 meter long, discharges vary between 87 and 371 1/s. Thelength of tertiary canals is 500 to 700 meter, discharges are between 17 and 58 1/s (Caraval andMarmolejo, 1989).
EfficienciesThe combination of the low efficiencies, which are mentioned above, result in an overall efficiency ofunimproved systems as low as 11% (see equation 24).
eP = ea * ed * ec = 3 0 % * 6 0 % * 6 0 % = 1 1 % (24)
where: ep = overall efficiency [-];ea = field water application efficiency [-];ed = distribution efficiency [-];ee = conveyance efficiency [-];
The ingenios have implemented water-saving measures in the past few years. The saving in water use isshown in figure 15. Overall efficiency for improved systems, using alternating furrow irrigation, linedprimary and secondary canals and flexitubes in tertiary canals, is approximately 38%:
ep = ea * ed * ec = 5 0 % * 8 5 % * 9 0 % = 3 8 % (25)
On the long term CENICAÑA predicts that improved alternating furrow irrigation systems can reach a60% efficiency:e
P = e» * ed * ec = 7 0 % * 9 0 % * 9 5 % = 6 0 % (26)
StorageThe great variation in rainfall from year to year is one of the problems faced in irrigation planning anddesign in the Valle de Cauca. A huge storage capacity is installed to prevent crop damage in times ofdrought and flooding in extremely wet times. Most ingenios count 60 to 70 reservoirs, volumes varyingbetween 10,000 and 1,000,000 m3. Reservoir efficiency is 98% per day. Depth of reservoirs varybetween 1.5 and 1.8 m. Reservoirs are generally unlined, but small particles of suspended solidspenetrate the walls and bottom and thus decrease permeability and seepage (Cruz, CENICAÑA,pers.comm).
DrainageDrainage by gravity is possible most of the year. During periods of high water tables in rivers, the areacan only be drained by pumping (Caraval and Marmolejo, 1989). In April and May 90% of the zone isaffected by high water tables, the rest of the year 50% remains affected.
61
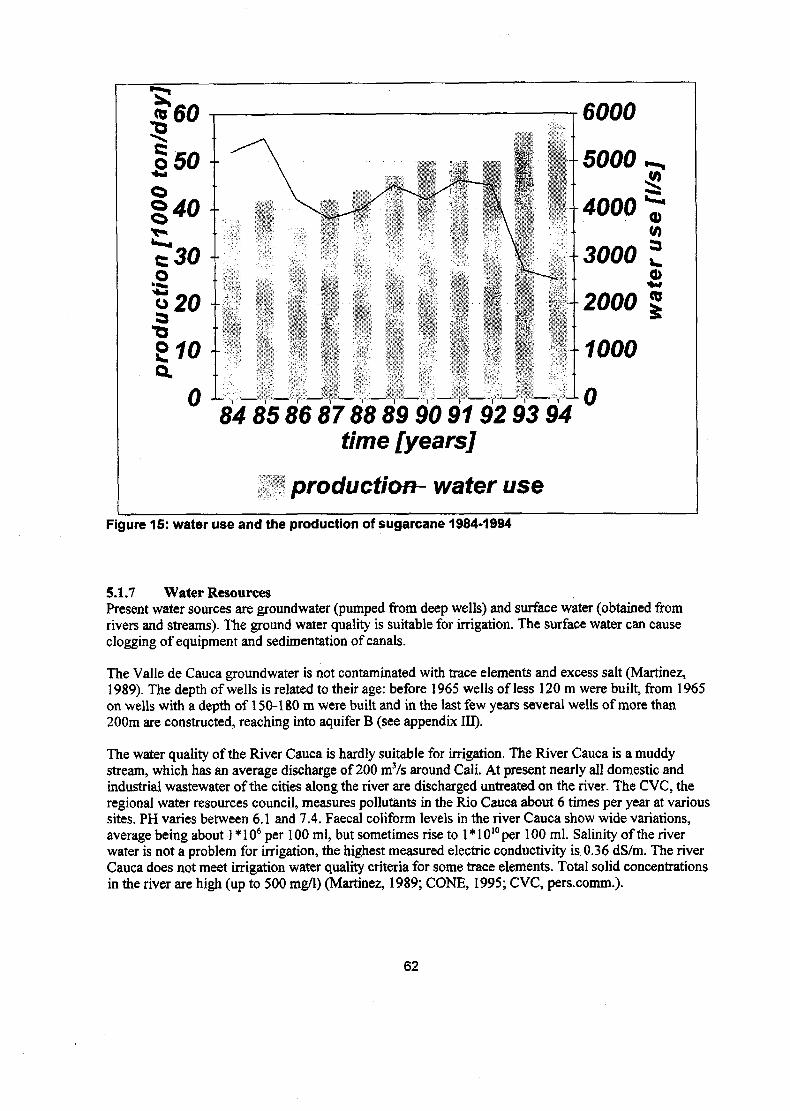
<o 605o 50*•*o§40tz30 +oo 20"O
gfOa
85868788899091929394°time [years]
^ production- water useFigure 15: water use and the production of sugarcane 1984-1994
5.1.7 Water ResourcesPresent water sources are groundwater (pumped from deep wells) and surface water (obtained fromrivers and streams). The ground water quality is suitable for irrigation. The surface water can causeclogging of equipment and sedimentation of canals.
The Valle de Cauca groundwater is not contaminated with trace elements and excess salt (Martinez,1989). The depth of wells is related to their age: before 1965 wells of less 120 m were built, from 1965on wells with a depth of 150-180 m were built and in the last few years several wells of more than200m are constructed, reaching into aquifer B (see appendix III).
The water quality of the River Cauca is hardly suitable for irrigation. The River Cauca is a muddystream, which has an average discharge of 200 m3/s around Cali. At present nearly all domestic andindustrial wastewater of the cities along the river are discharged untreated on the river. The CVC, theregional water resources council, measures pollutants in the Rio Cauca about 6 times per year at varioussites. PH varies between 6.1 and 7.4. Faecal coliform levels in the river Cauca show wide variations,average being about 1 * 106 per 100 ml, but sometimes rise to 1 * 1010 per 100 ml. Salinity of the riverwater is not a problem for irrigation, the highest measured electric conductivity is 0.36 dS/m. The riverCauca does not meet irrigation water quality criteria for some trace elements. Total solid concentrationsin the river are high (up to 500 mg/1) (Martinez, 1989; CONE, 1995; CVC, pers.comm.).
62

The Rio Fraile is much smaller and cleaner than the River Cauca. The base discharge is 592 1/s. TheRio Fraile is not affected by salinity: average salinity at the bridge of the Cali-Palmira road is 0.19dS/m. Other quality problems are not likely to occur as no wastewater is discharged upstream. The useof the Rio Fraile is divided as follows (Bocanegra and Giraldo, 1989):
0.5 1/s/ha for rice;0,32 1/s/ha for sugarcane;0.08 1/s/ha for fruit trees, corn and soya;260 1/person/day for domestic use;50 1/animal/day for livestock.
5.2 Characterization of the Irrigation Scheme
The principles on which the system is based have to be determined before planning the layout of anirrigation system. This irrigation scheme is productive, or crop-based irrigation: the objective of theirrigation management is to maximize the return per unit area. The irrigation scheme has to function bygravity.
Other principles include: the definition of the irrigable area, the field application system, the choicebetween a combined or separated system, the management, the water delivery schedule, the operation,and the control system. Based on these characteristics the efficiency of the system can be estimated.This paragraph discusses all those aspects.
5.2.1 Definition of Irrigable Area in the Juanchito-Guanabanal-Palmaseca zoneThe irrigable area is 936 ha and is the part of the study area that can be used for irrigated agriculture.The irrigable area is determined by defining the geographical area, the useful agricultural area and thecommand area (see figure 16). The availability of data, topography, elevation and land use form thebase for the definition of the irrigable area (Bergmann and Boussard, 1976).
The geographical area is the area of all farms and communes whose land is located within the irrigationperimeter, including agricultural area used and areas that are not under cultivation or not cultivable.The geographical area equals the study area as defined in §1.4.2, and is 1237 ha. The geographical areais the area bordered by the Rio Cauca in the West, the railway line in the South, the Rio Fraile and theRio Gauchal in the East and North.
The largest part of the geographical area is used for agriculture, mainly for the cultivation of sugarcane.150 hectares are used for industrial and residential purposes. The foreland between the Rio Cauca andthe dike (26 ha) is not usable because of risk of inundation. The useful agricultural area is the totalarable land (fallow land included), permanent pastures, perennial crops and gardens, includingpotentially effective agricultural land not yet used for agriculture is 1061 ha.
The command area is the useful agricultural area that can be irrigated by gravity, and is delimited by thehighest point the water can theoretically reach. The inlet of the irrigation system is located at the end ofthe treatment system, near the railway bridge in the South-Western corner of the agricultural area. Theelevation of the original ground level at this point is 954m. The area North of Las Dolores is hard toreach by gravity, without crossing industrial and residential areas. This is an area of 125 ha, thecommand area therefore becomes 936 ha. The irrigable area equals the command area.
63
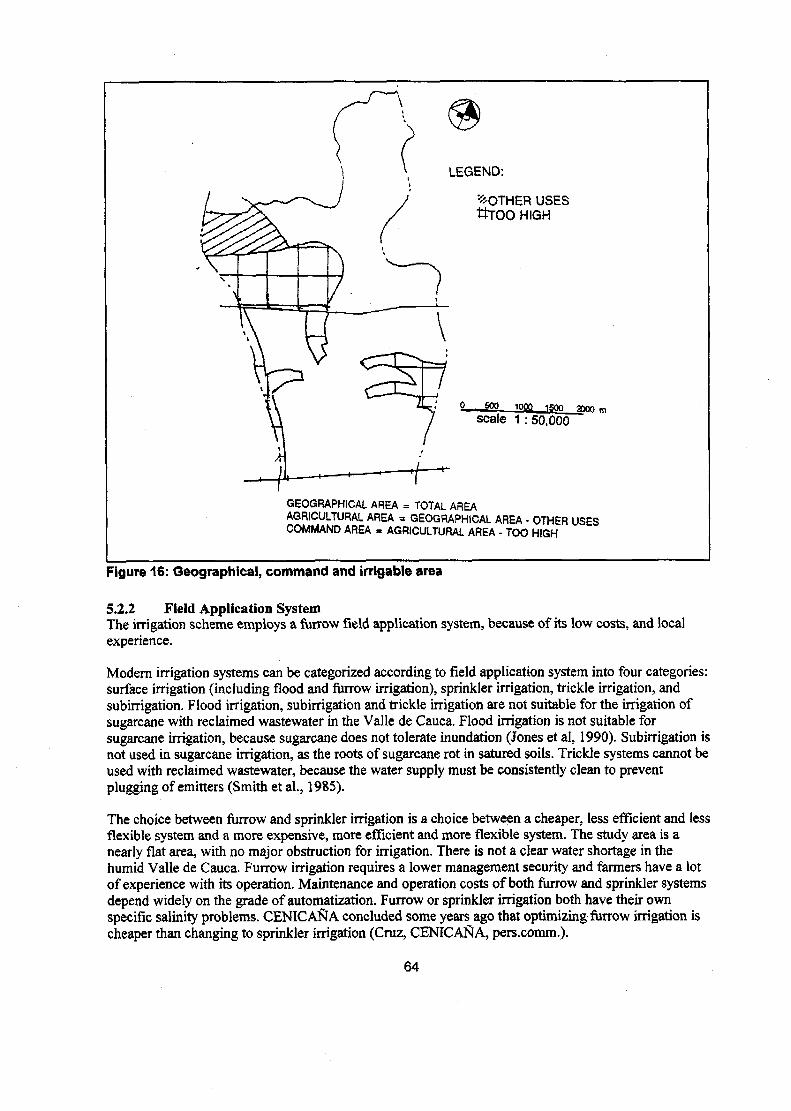
LEGEND:
MOTHER USESttroo HIGH
2 §og—ioo2_j5go__2poo mscale 1 :50,000
GEOGRAPHICAL AREA = TOTAL AREAAGRICULTURAL AREA = GEOGRAPHICAL AREA • OTHER USESCOMMAND AREA = AGRICULTURAL AREA - TOO HIGH
Figure 16: Geographical, command and irrigable area
5.2.2 Field Application SystemThe irrigation scheme employs a furrow field application system, because of its low costs, and localexperience.
Modern irrigation systems can be categorized according to field application system into four categories:surface irrigation (including flood and furrow irrigation), sprinkler irrigation, trickle irrigation, andsubirrigation. Flood irrigation, subirrigation and trickle irrigation are not suitable for the irrigation ofsugarcane with reclaimed wastewater in the Valle de Cauca. Flood irrigation is not suitable forsugarcane irrigation, because sugarcane does not tolerate inundation (Jones et al, 1990). Subirrigation isnot used in sugarcane irrigation, as the roots of sugarcane rot in satured soils. Trickle systems cannot beused with reclaimed wastewater, because the water supply must be consistently clean to preventplugging of emitters (Smith et al., 1985).
The choice between furrow and sprinkler irrigation is a choice between a cheaper, less efficient and lessflexible system and a more expensive, more efficient and more flexible system. The study area is anearly flat area, with no major obstruction for irrigation. There is not a clear water shortage in thehumid Valle de Cauca. Furrow irrigation requires a lower management security and farmers have a lotof experience with its operation. Maintenance and operation costs of both furrow and sprinkler systemsdepend widely on the grade of automatization. Furrow or sprinkler irrigation both have their ownspecific salinity problems. CENICAÑA concluded some years ago that optimizing furrow irrigation ischeaper than changing to sprinkler irrigation (Cruz, CENICAÑA, pers.comm.).
64
5.2.3 Combined or Separated SystemThe irrigation is a separated system with independent irrigation and drainage canals. A separatedsystem is clearly arranged and easily operated. The drainage system is not designed in this study.
The selection is based on the following considerations. In a combined system irrigation canals do serveas drainage canals as well, allowing the reuse of drainage water for irrigation in lower areas. Reuse ofdrainage water could cause concentration of certain pollutants, which create risks for soils or crops.Separated system involves higher construction costs as more canals have to be built. Combined canalsare unfeasible in gravity irrigation schemes, as the water level has to be above ground level in irrigationcanals, and has to be below ground level in drainage canals. In tropical areas with heavy rainfall like theValle de Cauca combined canals are difficult to design as they have to be able to deal with a largevariation in discharges, which can cause sedimentation problems and canal damage (Brouwer, 1993)
5.2.4 Management of SchemeThe scheme is dual-managed, as the operation and management of the centralized scheme is beyond thecapability of farmers. A dual-managed irrigation system is divided into a main irrigation system and atertiary system. The main irrigation system comprises the main diversion structure, the primary andsecondary canals with their structures, including the tertiary offtakes. The main system is under thecontrol of a water committee and its general objective is to deliver water to the tertiary units. Thisdelivery has to be with sufficient head, a reliable and flexible supply of water, in an assured way. Thetertiary system, which is under the control of either one individual farmer or a number of farmersgrouped in a water users association, and which includes all tertiary, quaternary irrigation canals withtheir structures (Ankum, 1995).
Scheme management is the coordinated approach of all parties on the implementation of the schemeobjectives. Scheme management of a dual-managed irrigation scheme requires the following entities(Ankum, 1995):
1. highest authority;2. operation and maintenance agency;3. water users association;
The highest authority in this system is a water committee. The water committee is responsible for thetreatment system as well as the irrigation scheme. This in order to guarantee a reliable supply of waterfor the irrigation scheme, and a certain disposition of the water for the treatment system. The watercommittee is headed by the head of the CVC, the regional water board. Its members are representativesof the water users, a representative of the O&M agency, and officials of EMC ALI, CENICAÑA, thecity council of Cali, and the city council of Palmira. The water committee is headed by somebody of theCVC to avoid tension between the city councils of Palmira and Cali.
The operation and maintenance (O&M) agency is the executive (technical) body between the highestauthority and the field, and is responsible for implementing the operation an maintenance of the mainirrigation and drainage schemes. The operation and maintenance agency is located at the treatment site.There is a close cooperation between the O&M of the treatment system, and the O&M of the irrigationscheme.
Water users associations manage the irrigation scheme within the tertiary units. Farmers in the Valle deCauca are already organized in ingenios, and in ASOCAÑA, the national sugarcane grower society.These manners of organization should be further developed to manage the tertiary control systems, andto increase participation of farmers in the water committee.
An interesting form of farmers participation is described by Van Immerzeel (1991). He describes apeasant-to-peasant irrigation training scheme in Peru. The first part of the training consist of teaching in
65

a particular practical situation, followed by discussion of the theory behind it. In the second part groupsof farmers, representing different communities, prepare a field for irrigation. During the last two days ajury judges the different parcels. Prizes include a trophy and money, besides each participant receives adiploma and a set of tools. Participation of women is stimulated by granting them extra rewards. Thebest students are incorporated into the teaching program. This program is self-sustainable and has lowrecurrent costs, which are regained by the increase in irrigation efficiencies. The success of the programis shown by the fact that the local community continued the program, with an annual irrigationcompetition after the outside teachers had left.
In order to monitor the functioning of the reuse schemes, a multi-institutional environment monitoringprogram should be established. The program should cover, wastewater treatment and storage, irrigation,aquifers, crops, soil, geography and meteorology. Juanico (1989) describes how a monitoring programand the institute carrying it out were established in Israel, a country with a lot of experience in reuse ofwastewater for irrigation.
5.2.5 Water Delivery ScheduleWater delivery is proportional: farmers get a share of the water, proportional to the surface area of thierland . An proportional delivery schedule guarantees a balance between cost and flexibility for theCañaveralejo reuse scheme. Water-delivery scheduling refers to the frequency, rate, duration, andtimeliness by which water is allocated to the various users (Brouwer, 1993; Plusquellec et al., 1994;Ankum, 1995).
Proportonal delivery guarantees farmers a large, secure, but inflexible flow of irrigation water. Aconstant flow of water is allocated to each fanner at all times. This garantuees a fair division of thewater. In the reuse scheme water supply is constant and water demand is unpredictable. The pondsystem, which is the resource of the irrigation water, provides a continuous flow over the year. Yetsugarcane does accept short term water stress, and does not require a special scheduling system.
The water distribution authority maintains a constantly available supply in the primary irrigation canal,which is operated on full discharge permanently. Proportional delivery scheduling does not require ahigh management security, nor laborious in operation and maintenance. The costs of operating aproportional delivery system are low, as the water distribution authority does not administrate orallocate water deliveries. Proportional delivery incorporates low investment and operation costs. It doesrequire the construction of canals to drain excess and tail-end water.
5.2.6 OperationThe structures in the irrigation scheme are fixed and no operation is necessary. This offers a reliablesupply as farmers in the study area are not experienced with automatic structures.
5.2.7 Control SystemThe system uses upstream control, as the structures are fixed. Downstream control requires automaticstructures in order to function well.
The term upstream control describes a control method that maintains a constant water level upstream ofa check structure. Upstream control is usually associated with rigid top-down water delivery, but whenproperly operated and when allowing some tail-end losses it can provide flexible water deliveries.Upstream control is self-regulating for flood control and can be implemented with fixed, manual andautomatically operated structures (Plusquellec, 1994).
66

5.2.8 EfficienciesEfficiency of an irrigation scheme refers to the ratio between the total quantity of water delivered to allfarms and the quantity of water actually available for plants in the rootzone. Recent evaluation reportsof irrigation schemes note a substantial gap between actual and expected performance. The system ofwater distribution can be split into the four successive stages: water requirement of crop, fieldapplication, farm supply and project supply. The overall efficiency of a project combines theefficiencies of each stage in which water is lost. The factors that influence water losses on variouslevels have to be known to improve overall efficiency. (UN Economic and Social Commission for Asiaand the Pacific, 1985; Plusquellec et al , 1994).
The field water application efficiency is estimated to be 60%. Field water application efficiency (ej isdefined as the average depth of water stored in the rootzone divided by the average depth of waterapplied to a field. Field water application efficiencies depend on the field application system, on soilcharacteristics (finer texture means a higher efficiency), and on management. Literature estimates offield water application efficiencies for furrow irrigation vary between 40 and 75% (UN Economic andSocial Commission for Asia and the Pacific, 1985; Asano et al., 1985; Brouwer, 1993). Present fieldwater application efficiencies of furrow systems in the Valle de Cauca vary between 20 and 60%, thelargest gain in efficiency is obtained by using alternating furrow irrigation. Although efficiency can beraised by improving the application systemjt is not plausible to expect a tremendous rise if the systemis managed by the same farmers: CENICAÑA expects that the maximum field application efficiencyfeasible with furrows, is 70%.
The distribution efficiency of the irrigation scheme is 90%, as flexitubes are used in tertiary canals. Thedistribution efficiency (ed) is the ratio between the quantity of water applied from the tertiary canals andthe total quantity supplied to the irrigated area, and refers to the water distribution within the tertiaryunit. Distribution efficiency depends on the length and the type of canals, on operation andmaintenance and on the water-delivery scheduling. In a 150 ha tertiary unit lined canals can achieveefficiencies of 95%; well maintained unlined canals with regulators can achieve 80%; and unimproved,poorly maintained watercourses only achieve a 55% efficiency (UN Economic and Social Commissionfor Asia and the Pacific, 1985). Distribution efficiencies in the Valle de Cauca are in the range of 50 to90%.
The conveyance efficiency is estimated at 90% in an 1,000 ha irrigated area, and 70% at a 10,000 haarea. The conveyance efficiency (ec) is the ratio between the total quantity of water delivered to all farmor group inlets through the water course in the area and the total quantity of water supplied into tertiarycanals. Conveyance efficiency depends on the size of the irrigation scheme and the operation andmaintenance of the canals. Efficiency of schemes smaller than 10,000 ha, like the Juanchito-Guanabanal-Palmaseca scheme can achieve an efficiency of 85% (UN Economic and SocialCommission for Asia and the Pacific, 1985). Brouwer (1993) estimates a conveyance efficiency of90%. A survey (Caraval and Marmolejo, 1989) showed that the conveyance efficiency in the Palmiraregion of both primary and secondary canals is only just over 50%. Water losses in unlined canals arehard to predict in the Juanchito-Guanabanal-Palmaseca area as soil permeability varies. CENICAÑAadvises farmers to line their canals, either with plastic or with concrete, as a 95% efficiency can bereached that way.
The overall efficiency (ep) of an irrigation project is the product of the three efficiencies mentionedabove. Scarcity of water, or price increases raises awareness and are the most effective means of risingirrigation efficiencies. The overall efficiency is 49% for a 936 ha irrigation scheme (see equation 27).
ep = e» * ed * ec = 6 0 % * 9 0 % * 9 0 % = 4 9 % (27)
67
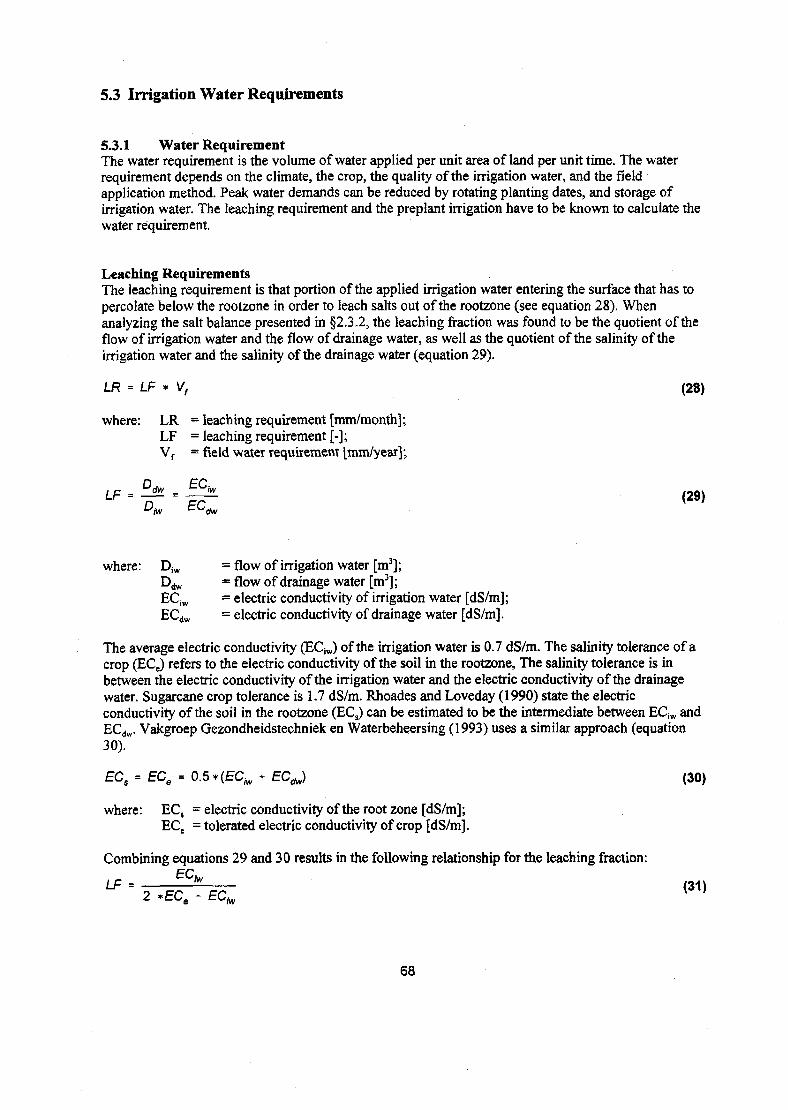
5.3 Irrigation Water Requirements
5.3.1 Water RequirementThe water requirement is the volume of water applied per unit area of land per unit time. The waterrequirement depends on the climate, the crop, the quality of the irrigation water, and the fieldapplication method. Peak water demands can be reduced by rotating planting dates, and storage ofirrigation water. The leaching requirement and the preplant irrigation have to be known to calculate thewater requirement.
Leaching RequirementsThe leaching requirement is that portion of the applied irrigation water entering the surface that has topercolate below the rootzone in order to leach salts out of the rootzone (see equation 28). Whenanalyzing the salt balance presented in §2.3.2, the leaching fraction was found to be the quotient of theflow of irrigation water and the flow of drainage water, as well as the quotient of the salinity of theirrigation water and the salinity of the drainage water (equation 29).
LR * LF * Vf (28)
where: LR - leaching requirement [mm/month];LF = leaching requirement [-];Vf = field water requirement [mm/year];
where: D iw = flow of irrigation water [m3];Ddw ~ flow of drainage water [m3] ;EC jw = electric conductivity of irrigation water [dS/m];ECdw = electric conductivity of drainage water [dS/m].
The average electric conductivity (EC iw) of the irrigation water is 0.7 dS/m. The salinity tolerance of acrop (ECe) refers to the electric conductivity of the soil in the rootzone, The salinity tolerance is inbetween the electric conductivity of the irrigation water and the electric conductivity of the drainagewater. Sugarcane crop tolerance is 1.7 dS/m. Rhoades and Loveday (1990) state the electricconductivity of the soil in the rootzone (ECS) can be estimated to be the intermediate between EC iw andECdw. Vakgroep Gezondheidstechniek en Waterbeheersing (1993) uses a similar approach (equation30).
ECS = ECg = 0.5 «(EC* + ECJ (30)
where: ECS = electric conductivity of the root zone [dS/m];EC e = tolerated electric conductivity of crop [dS/m].
Combining equations 29 and 30 results in the following relationship for the leaching fraction:
68
Ayers and Westcot (1985) suggest another relationship for the leaching fraction, based on the idea thatthe water uptake of the crop is not linear, and therefore the soil water salinity is not the intermediatebetween ECiw and ECdw (equation 32).
ECmLF = 5 *ECe - EC^ <32>
According to the Rhoades and Loveday relationship (equation 31) the leaching fraction is 0.26, whichmeans that 26% of the irrigation water should percolate beyond the rootzone. The Ayers and Westcotrelationship (equation 32) results in a leaching fraction at 0.08.
The usual inefficiencies of water application satisfy this leaching requirement. The field waterapplication efficiency (e j of this irrigation system is 0.6, this means an extra 63% of the croprequirement is applied to account for losses, part of which is deep percolation. Furthermore rainfallapplies a large quantity of low-salinity water. It can be safely assumed that this percolation can satisfythe leaching fraction of 26%, calculated above, so no extra leaching requirement has to be accountedfor (Ayers and Westcot, 1985).
Preplant irrigationPreplant irrigation is not practiced in sugarcane cultivation in the Valle de Cauca.
Field Water RequirementThe field water requirement is calculated using equation 33 (Brouwer, 1993). Open pan evaporation is1627 mm for an average year (Granja ICA station), average rainfall is 1033 mm (Planta Rio Caucastation), of which 80% (is 827 mm) is the effective precipitation. The average crop coefficient for acomplete grow cycle is 0.42 (see §5.1.3 and §5.3.2). Preplant irrigation and the leaching requirementare both 0. The field water application efficiency is 0.6. The water requirement for several typical yearsare presented in table 18. This table shows that in wet years hardly any water has to be irrigated.Further monthly rates are discussed in the next paragraph on the capacity line, which is based on a 80%dry year.
V, * E ° -*° P "^ L * ,33,
where Eo = evaporation [mm/year];k,, = crop coefficient [-];Peff = effective precipitation [mm/year];V, = volume required for preplant irrigation [mm/year];
Nitrogen Leaching ControlThe design of the reuse system should avoid nitrogen percolating into potable groundwater aquifers.The procedure to estimate the percolation of nitrogen is based on a procedure presented in the EPAProcess Design Manual for Land Treatment of Municipal Wastewater (USEPA, 1977) and presented inSmith et al. (1985). Nitrogen concentration in the percolate should not exceed 10 mg/1 annually. Thenitrogen uptake by crop is 10 g/m2per year for a first crop and higher for ratoon crops (see table 16,§1.1.3). The fraction f can be estimated to be 0.2. In table 18 the maximum irrigated volume fornitrogen control are calculated for primary effluent (26 mg N/l) and pond effluent (15 mgN/1). Thetable shows that nitrogen percolation problems do not occur, as the water requirement is always lowerthan the maximum irrigated volume for nitrogen control.
69
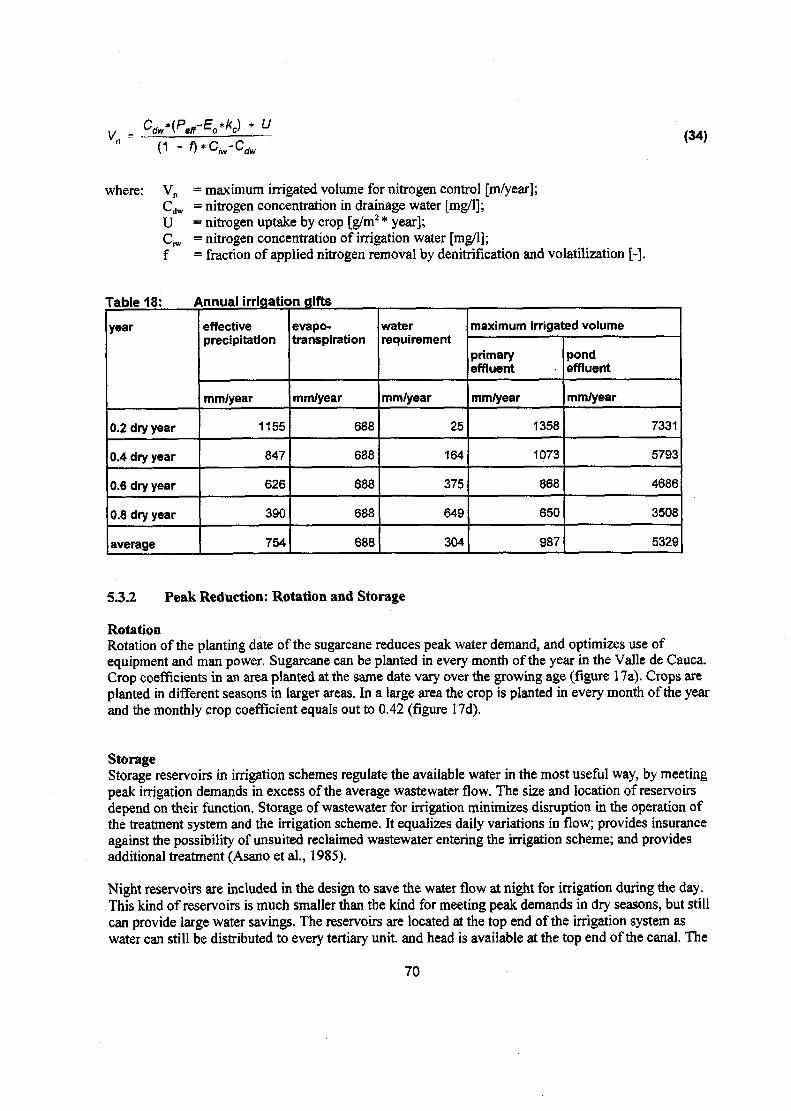
u(34)
where: Vn = maximum irrigated volume for nitrogen control [m/year];Cdw = nitrogen concentration in drainage water [mg/1];U = nitrogen uptake by crop [g/m2* year];Cjw = nitrogen concentration of irrigation water [mg/1];f = fraction of applied nitrogen removal by denitrification and volatilization [-].
Table 18:
year
0.2 dry year
0.4 dry year
0.6 dry year
0.8 dry year
average
Annual irrigation gifts
effectiveprecipitation
mm/year
1155
847
626
390
754
evapo-transpiration
mm/year
688
688
688
688
688
waterrequirement
mm/year
25
164
375
649
304
maximum
primaryeffluent
mm/year
irrigated volume
1358
1073
868
650
987
pondeffluent
mm/year
7331
5793
4686
3508
5329
5.3.2 Peak Reduction: Rotation and Storage
RotationRotation of the planting date of the sugarcane reduces peak water demand, and optimizes use ofequipment and man power. Sugarcane can be planted in every month of the year in the Valle de Cauca.Crop coefficients in an area planted at the same date vary over the growing age (figure 17a). Crops areplanted in different seasons in larger areas. In a large area the crop is planted in every month of the yearand the monthly crop coefficient equals out to 0.42 (figure 17d).
StorageStorage reservoirs in irrigation schemes regulate the available water in the most useful way, by meetingpeak irrigation demands in excess of the average wastewater flow. The size and location of reservoirsdepend on their function. Storage of wastewater for irrigation minimizes disruption in the operation ofthe treatment system and the irrigation scheme. It equalizes daily variations in flow; provides insuranceagainst the possibility of unsuited reclaimed wastewater entering the irrigation scheme; and providesadditional treatment (Asano et al., 1985).
Night reservoirs are included in the design to save the water flow at night for irrigation during the day.This kind of reservoirs is much smaller than the kind for meeting peak demands in dry seasons, but stillcan provide large water savings. The reservoirs are located at the top end of the irrigation system aswater can still be distributed to every tertiary unit, and head is available at the top end of the canal. The
70

night reservoirs are designed to store the treatment discharge during 12 hours at night. Farmers do notirrigate on Sunday. Storage on Sundays requires large reservoirs, which induce large investments butsmall water savings.
Reservoirs for meeting peak irrigation demands in dry seasons are expensive to construct and hard tooperate in the unpredictable climate in the Valle de Cauca. This type of reservoirs is therefore notincluded in the design.
In this reuse scheme, where only part of the effluent of the Cañaveralejo plant is reused, the wastewaterflow does not fluctuate. The retention time of the pond system provides insurance against the possibilityof unsuited reclaimed wastewater entering the irrigation scheme.
ou
u0.2-
0-
Í0.8-
ou
o0,2-
0-
(a) one planting date
1 2 3'4 5 V 7' 8' 9'101112 13growing month
(c) four planting dates
1 2 3 4 5 6 7 8 9 10111213growing month
1 -
%0,6-
8
0,2-
0 -
f _
^0 8 ~
Í0,6:80J>4 •I'
0,2
0-
(b) two planting dates
:—i
—;
—
1 2 3 4 5 6 7 8 9 10111213growing month
(d) complete rotation
1 2 3 4 5 6 78 9 10111213growing month
Figure 17: crop coefficients with rotation
5.3.3 Capacity LineThe capacity line (figure 1S) estimates the water requirement per hectare necessary for a certain area ofland taking into account peak reduction by crop rotation and losses in the distribution and conveyancesystem. In a large area the average water requirement decreases due to crop rotation, but increases dueto operational and leakage losses. The discharge necessary to irrigate a certain area can be determinedby multiplying the discharge per hectare by the amount of hectares.
The capacity line in figure 18 shows the discharge needed to irrigate an area of 936 ha is 384 1/s, 24hours per day, 7 days per week. A surface area of 13,300 hectares could be irrigated with the availabledischarge of the Cañaveralejo plant (7.6 m3/s).
71
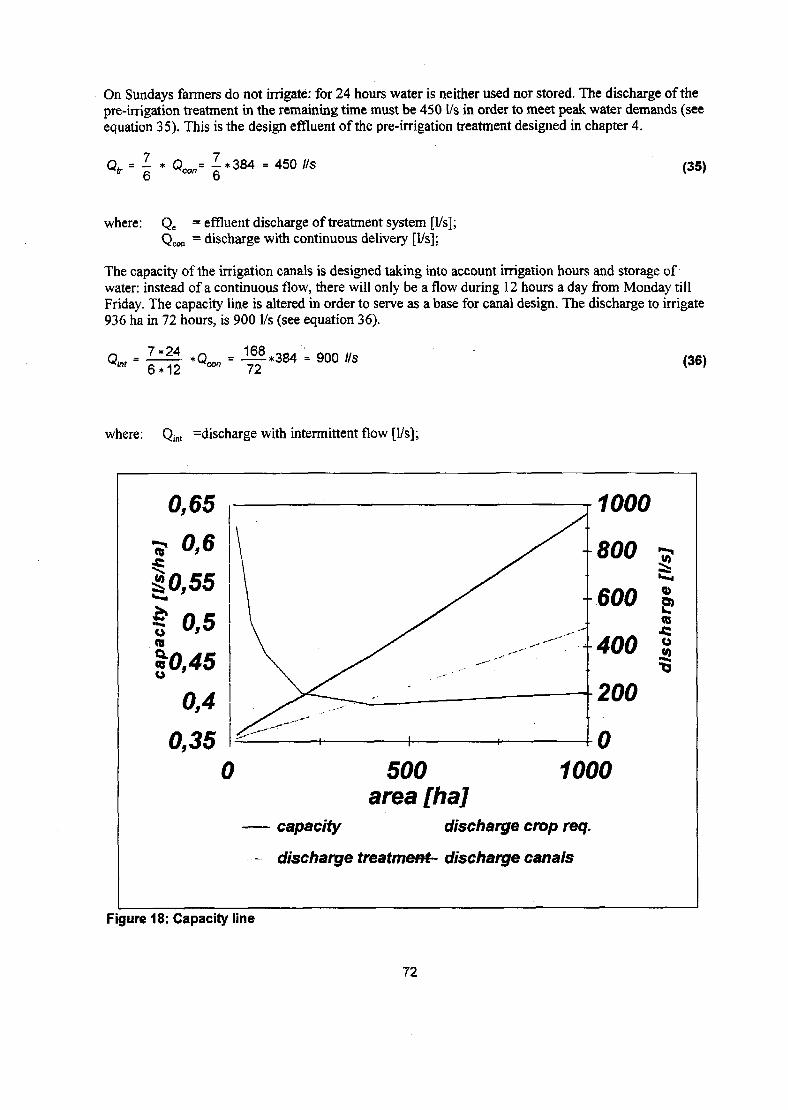
On Sundays fanners do not irrigate: for 24 hours water is neither used nor stored. The discharge of thepre-irrigation treatment in the remaining time must be 450 1/s in order to meet peak water demands (seeequation 35). This is the design effluent of the pre-irrigation treatment designed in chapter 4.
7- *Qeon=Z*384=450//s (35)
where: Qe = effluent discharge of treatment system [1/s];Qcon = discharge with continuous delivery [1/s];
The capacity of the irrigation canals is designed taking into account irrigation hours and storage ofwater: instead of a continuous flow, there will only be a flow during 12 hours a day from Monday tillFriday. The capacity line is altered in order to serve as a base for canal design. The discharge to irrigate936 ha in 72 hours, is 900 1/s (see equation 36).
7*246*12
*Q 16872
*384 = 900 1/s (36)
where: Qint =discharge with intermittent flow [1/s];
0,65
I °>6
Í0,55è 0,5
«0,450,4
0,35C
y
s^^—-^ "•"•'••" 1 1 1
innni i/i/i/
600 |n
400 t
200
n
) 500 1000area [ha]
capacity discharge crop req.
- discharge treatment- discharge canals
Figure 18: Capacity line
72

5.4 Layout of Irrigated Field Area
5.4.1 Grouping in Tertiary UnitsThe layout of the tertiary units is based on hydrological considerations, as the explicit microrelief in thestudy area would cause a very complex and expensive per-farm distribution system. The study area isdivided into 10 tertiary units, which cover between 35 and 157 ha (see table 19). A tertiary unit isdefined as that part of a dual-managed irrigation scheme that is managed by the water users associationand not by the O&M agency. Water is delivered proportionally to tertiary units at a central inlet, withinthe tertiary unit farmers manage the water.
The study area is divided into several dales draining either to the Rio Fraile or to the Rio Cauca. Farmsoften cross ridges and dales. A per-farm distribution system would imply an extensive main irrigationsystem and would not allow gravity flow in all irrigation ditches (see figure 27, appendix V). Tertiaryunits based on hydrological considerations ease the construction of the main irrigation system. Ahydrology-based layout of the irrigated field area has the disadvantage that farmers have to share waterwithin tertiary units, which complicates the management of the scheme and decreases efficiencies. Asmost farmland is rented to the ingenios, which cultivate vast areas of sugarcane, this problem isovercome.
Table 19: Tertiary unitsunit
01
02
03
O4
E1
E2
E3
E4
E5
E6
area [ha]
100
138
157
156
109
47
68
57
69
35
discharge [l/s]
98
130
142
141
105
49
69
59
70
37
5.4.2 Layout of Distribution SystemThe primary canal of the irrigation system follows the central rim situated North-South in the studyarea. The primary canal is 5050 m long, and serves the ten offtakes to tertiary units (see figure 20).
5.5 Design of Irrigation System
The design of the irrigation system is an iterative process between the design of reservoirs, the designof canals, and the design of structures.
73

5.5.1 Design of ReservoirsIn a pond system the final pond can function as a reservoir by varying the water level. Primary effluentcannot be stored without prior treatment.
The volume of a reservoir with a 12 hours storage capacity is 20,000 m3 (equation 37).
V= 12 * 3600 * — î - = 12 * 3600* - ^ - = 20,000 m3 (37)1000 1000 l '
where: Vr = Volume of the reservoir [m3];Qe = effluent discharge of treatment system [1/s];
In a duckweed pond system the storage capacity can be provided by varying the water level in the finalpond. The final pond designed in chapter 4 is 4.5 ha. An extra water depth of 0.45 m should be allowedfor to store a volume of 20,000 m3.
Primary effluent requires additional treatment prior to storage, to prevent reservoirs from becomingseptic (Smith et al., 1985). Night reservoirs cannot be used. The discharge of the influent must beintermittent, which means that at night and in weekends no water is transported across the river.
5.5.2 Canal DesignThe primary canal delivers water to the tertiary offtakes. The canal has to deliver water to tertiary unitsproportionally to the surface area of the unit.
The requirements for the primary canal are:1. The capacity at the head end has to be 900 1/s and diminishes along the canal;2. Freeboard of all canals is 0.20 m;3. The water level at the top end must be below 954.53 m+, in order to allow free flow over the
outlet structures of the waste stabilization system;4. The inlets of the tertiary units must be served to allow for free flow till the field in the
complete tertiary unit;5. The water level upstream of the structures must allow for free flow over the structure and in
the ongoing canal;6. Net excavation must be kept to a minimum;
The hydraulic radius in a trapezoidal canal depends on the width of the canal, the slope of the sides,and the depth of the canal, and is given by equation 38. Dimensions of open canals are calculated withthe formula of Strickler (equation 39), and presented in table 21, 22. The roughness coefficient is 75ml/3/s, the side slope of the canals is 1:1, the ratio between depth and width is 1.5.
R = A ¿>*y + n*y2
where: R = hydraulic radius [m];A = surface area [m2];PCan = wetted perimeter [m];b = bed width [m];y = water depth [m];n = side slope [-];
74
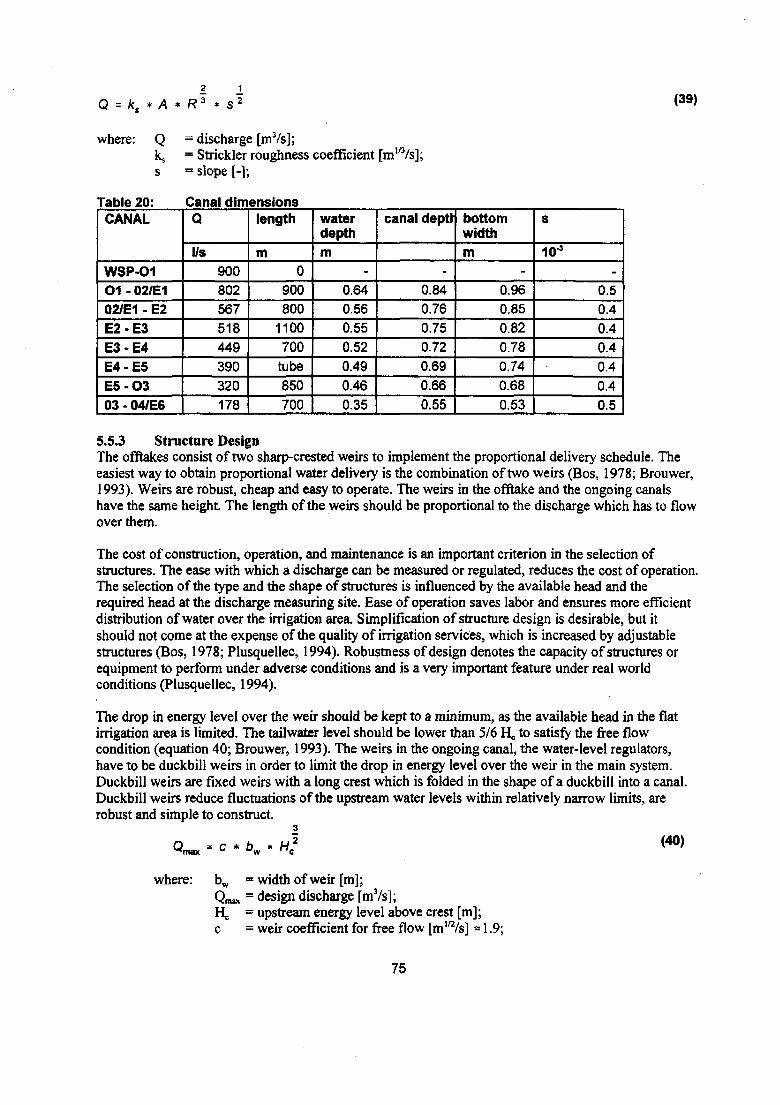
Q = ks * A * R3 * s 2
where: Q = discharge [mVs];kg = Strickler roughness coefficient [m1/3/s];s = slope [-];
(39)
Table 20:CANAL
WSP-0101 - 02/E102/E1 - E2E2-E3E3-E4E4-E5E5-O303 • 04/E6
Canal dimensionsQ
l/s900802567
518449390320178
length
m0
900800
1100700
tube850700
waterdepthm
-0.640.560.550.52
0.490.460.35
canal depti
-0.840.760.750.720.690.660.55
bottomwidthm
-0.960.850.820.780.740.68
0.53
S
10^-
0.50.40.40.40.40.40.5
5.5.3 Structure DesignThe offtakes consist of two sharp-crested weirs to implement the proportional delivery schedule. Theeasiest way to obtain proportional water delivery is the combination of two weirs (Bos, 1978; Brouwer,1993). Weirs are robust, cheap and easy to operate. The weirs in the offtake and the ongoing canalshave the same height. The length of the weirs should be proportional to the discharge which has to flowover them.
The cost of construction, operation, and maintenance is an important criterion in the selection ofstructures. The ease with which a discharge can be measured or regulated, reduces the cost of operation.The selection of the type and the shape of structures is influenced by the available head and therequired head at the discharge measuring site. Ease of operation saves labor and ensures more efficientdistribution of water over the irrigation area. Simplification of structure design is desirable, but itshould not come at the expense of the quality of irrigation services, which is increased by adjustablestructures (Bos, 1978; Plusquellec, 1994). Robustness of design denotes the capacity of structures orequipment to perform under adverse conditions and is a very important feature under real worldconditions (Plusquellec, 1994).
The drop in energy level over the weir should be kept to a minimum, as the available head in the flatirrigation area is limited. The tailwater level should be lower than 5/6 H,. to satisfy the free flowcondition (equation 40; Brouwer, 1993). The weirs in the ongoing canal, the water-level regulators,have to be duckbill weirs in order to limit the drop in energy level over the weir in the main system.Duckbill weirs are fixed weirs with a long crest which is folded in the shape of a duckbill into a canal.Duckbill weirs reduce fluctuations of the upstream water levels within relatively narrow limits, arerobust and simple to construct.
Qmax = C * K * Hç m
where: bw = width of weir [m];Qnax = design discharge [mVs];H,. = upstream energy level above crest [m];c = weir coefficient for free flow [m1/2/s] = 1.9;
75
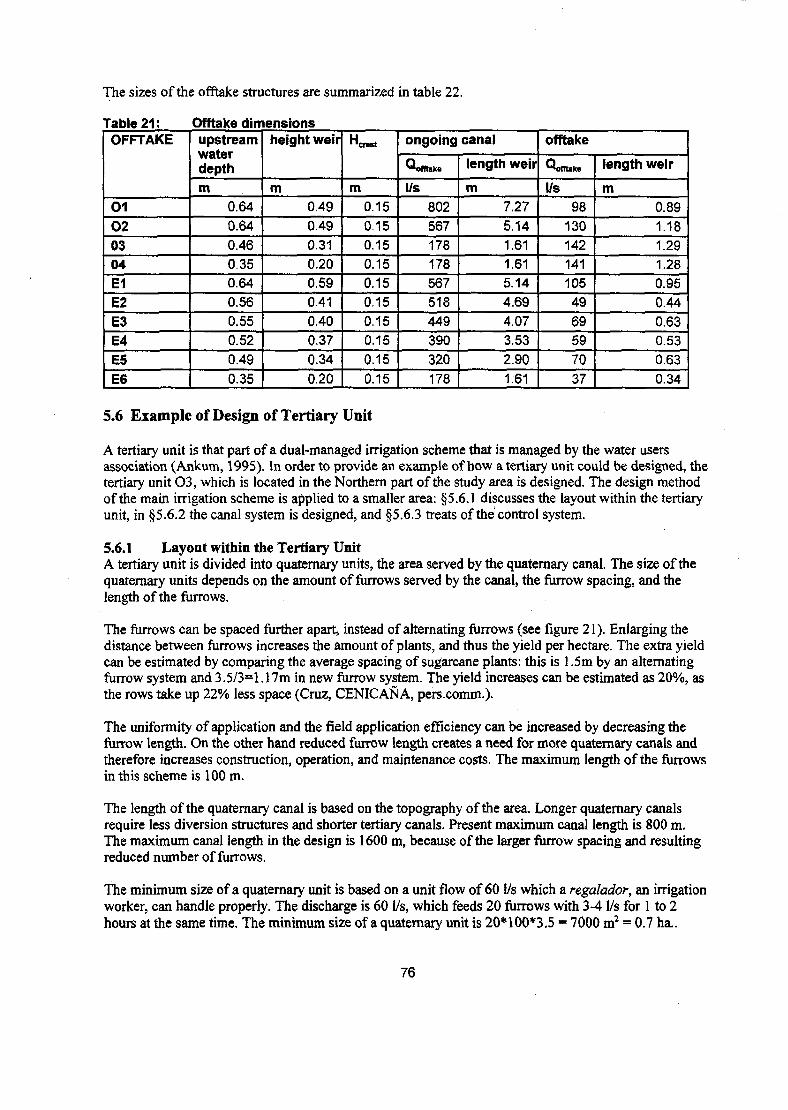
The sizes of the offtake structures are summarized in table 22.
Table 21:OFFTAKE
01
020304E1E2E3E4E5E6
Offtake dimensionsupstreamwaterdepth
m0.640.64
0.460.350.640.560.550.520.49
0.35
height weir
m0.49
0.490.310.200.590.410.400.370.340.20
m
0.150.150.150.150.150.150.150.150.150.15
ongoing canal
Qoffiake
l/s
802567178178567518449390320
178
length weir
m7.275.141.611.615.144.694.073.53
2.901.61
offtake
I/S
9813014214110549
69597037
length weir
m0.89
1.181.291.280.950.440.630.530.630.34
5.6 Example of Design of Tertiary Unit
A tertiary unit is that part of a dual-managed irrigation scheme that is managed by the water usersassociation (Ankum, 1995). In order to provide an example of how a tertiary unit could be designed, thetertiary unit 03 , which is located in the Northern part of the study area is designed. The design methodof the main irrigation scheme is applied to a smaller area: §5.6.1 discusses the layout within the tertiaryunit, in §5.6.2 the canal system is designed, and §5.6.3 treats of the control system.
5.6.1 Layout within the Tertiary UnitA tertiary unit is divided into quaternary units, the area served by the quaternary canal. The size of thequaternary units depends on the amount of furrows served by the canal, the furrow spacing, and thelength of the furrows.
The furrows can be spaced further apart, instead of alternating furrows (see figure 21). Enlarging thedistance between furrows increases the amount of plants, and thus the yield per hectare. The extra yieldcan be estimated by comparing the average spacing of sugarcane plants: this is 1.5m by an alternatingfurrow system and 3.5/3=1.17m in new furrow system. The yield increases can be estimated as 20%, asthe rows take up 22% less space (Cruz, CENICAÑA, pers.comm.).
The uniformity of application and the field application efficiency can be increased by decreasing thefurrow length. On the other hand reduced furrow length creates a need for more quaternary canals andtherefore increases construction, operation, and maintenance costs. The maximum length of the furrowsin this scheme is 100 m.
The length of the quaternary canal is based on the topography of the area. Longer quaternary canalsrequire less diversion structures and shorter tertiary canals. Present maximum canal length is 800 m.The maximum canal length in the design is 1600 m, because of the larger furrow spacing and resultingreduced number of furrows.
The minimum size of a quaternary unit is based on a unit flow of 60 l/s which a regalador, an irrigationworker, can handle properly. The discharge is 60 l/s, which feeds 20 furrows with 3-4 l/s for 1 to 2hours at the same time. The minimum size of a quaternary unit is 20*100*3.5 - 7000 m2 = 0.7 ha..
76

LEGEND:
Main Irrigation CanalTertiary Inlet
O1 Tertiary Unit
Figure 20
Layout of Irrigation Scheme j
Cañaveralejo Reuse Scheme I
Meike van Ginneken :
Date: 8 - 96 Scale 1 :15,000 J

Figure 21 : furrow spacing
5.6.2 Canals
Tertiary Canals: Open Lined CanalsThe tertiary canals are open lined canals. The canals are designed using the Strickler formula (equation39). Minimum slope is 2 %o. Freeboard is 0.20 m. The 03 tertiary canal has a slope of 2 %o, a depth of0.42 m and a width of 0.62 m.
Quaternary Canals: FlexitubesFlexitubes are flexible polyethylene tubes, with openings at regular spacings along the pipeline. Thespacing of these openings correspond with the furrow spacing. The benefits of the use of flexitubes are(1) water savings by increasing efficiency, (2) labor savings, (3) increase of the effective crop area, and(4) possibilities for mechanization of yield (Cruz et al., 1995). Smith (1990) states that outflow alongthe pipe (and so the variation in the inflows to each furrow) varies up to 40% from the mean average.Benitez (1994) found that the uniformity of application with flexitubes is better than with open tertiarycanals.
The Strickler formula for tubes (with R - 1/4*D and A = l/4*rc*D2) is given in equation 41. Flexitubesneed a fairly constant slope to function properly. A cautious roughness coefficient estimate forpolyethylene is 91 m1/3/s. A flexitube with a slope of 296o, and a discharge of 60 1/s, should have adiameter of 0.32 m.
. 2 1
Q = 0.312* k * D 3 * s : (41)
5.6.3 Tertiary Control SystemStructures within the tertiary unit are operated and maintained by the water users association, andshould be simple and robust. The tertiary control system consist of water-level regulators in the tertiaryongoing canal, in combination with offtake structures in the quaternary canals (flexitubes).
The inlet of the flexitubes can easily be provided by a piece of steel piping perforating the side of thecanal, which is provided with an on/off gate. The top of these orifices is placed well below theupstream water level. The head loss at the inlet can be calculated with the formula for local head losses,with u=0.82 (King et al, 1990).
78
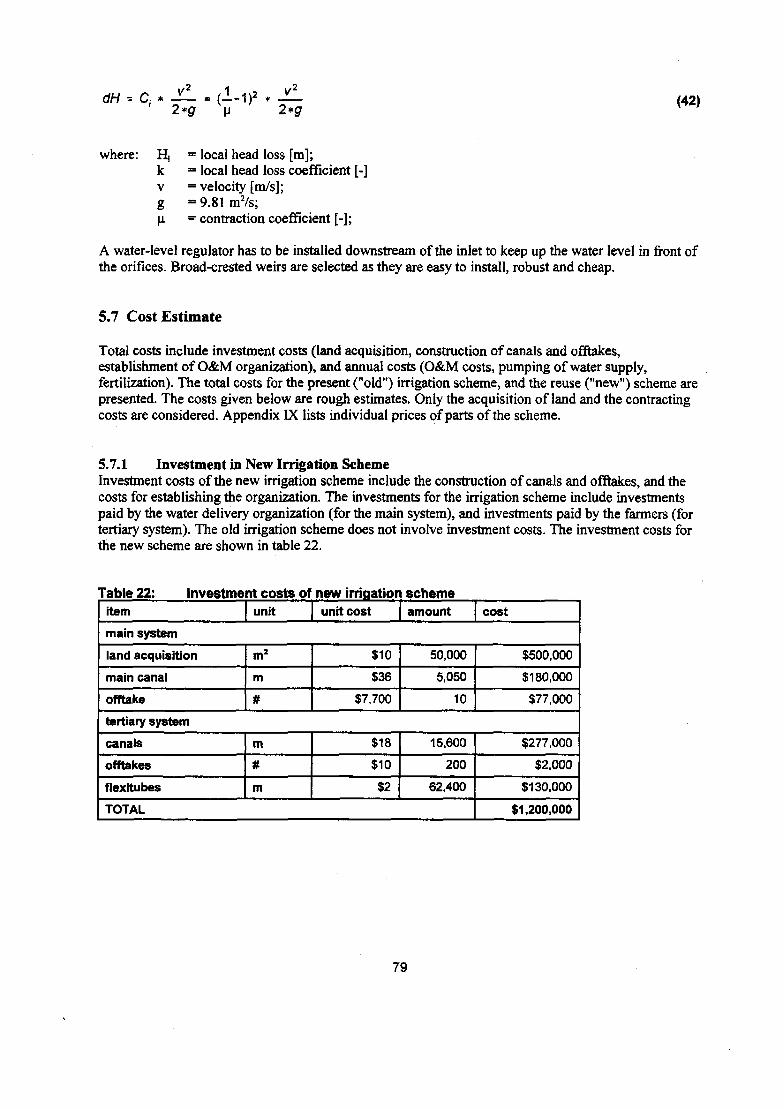
dH * (--D2
2*g(42)
where: H, = local head loss [m];k = local head loss coefficient [-]v = velocity [m/s];g =9.81 m2/s;u = contraction coefficient [-];
A water-level regulator has to be installed downstream of the inlet to keep up the water level in front ofthe orifices. Broad-crested weirs are selected as they are easy to install, robust and cheap.
5.7 Cost Estimate
Total costs include investment costs (land acquisition, construction of canals and offtakes,establishment of O&M organization), and annual costs (O&M costs, pumping of water supply,fertilization). The total costs for the present ("old") irrigation scheme, and the reuse ("new") scheme arepresented. The costs given below are rough estimates. Only the acquisition of land and the contractingcosts are considered. Appendix IX lists individual prices of parts of the scheme.
5.7.1 Investment in New Irrigation SchemeInvestment costs of the new irrigation scheme include the construction of canals and offtakes, and thecosts for establishing the organization. The investments for the irrigation scheme include investmentspaid by the water delivery organization (for the main system), and investments paid by the farmers (fortertiary system). The old irrigation scheme does not involve investment costs. The investment costs forthe new scheme are shown in table 22.
Table 22: Investment costs of new irrigation schemeitem unit unit cost amount cost
main system
land acquisition
main canal
offtake
m2
m
#
$10
$36
$7,700
50,000
5,050
10
$500,000
$180,000
$77,000
tertiary system
canals
offtakes
flexituoes
m
#
m
$18
$10
$2
15,600
200
62,400
TOTAL
$277,000
$2,000
$130.000
$1,200,000
79

Main SystemThe investment costs for the main system are US$800,000. Costs include land acquisition, costs ofconstruction of canals, and costs of construction of offtakes.
The cost of purchasing 5 ha of land is US$500,000. These five hectares of land must be purchased forthe construction of the main irrigation system. This figure is based on a strip of 10 m wide for the 5050m long primary canal.
The costs of construction the main canal is US$36 per meter length (see table 23). The cost ofconstruction per unit length of the primary canal are based on the cross-sections presented in figure 20and table 21, 22. The costs consists of excavation, concrete for lining, and labor for lining.CENICAÑA estimates the costs of construction of primary canals at US$17 per meter (Cruz,CENICAÑA, pers.comm.).
Table 23: Costs of primary canal per m lengthitem
excavation
concrete (1500 psi)
labor
TOTAL
unit
m3
m3
day
unit cost amount
$3.44
$81
$5
cost
3
0.3
0.2
$10
$24
$1
$36
The costs of construction of an offtake are US$7,700 (see table 24). These costs are based ondimensions of the offtake 03 (see figure 23). Offtake 03 is a fairly large offtake, it is presumed thatother offtakes have the same costs.
Table 24: Costs of primary canal per m lenqthitem
excavation
concrete (2000 psi)
reinforcement e16
formwork
distributors
labor
unit
m3
m3
m
m2
m
day
unit cost
$3.44
$32
$0.5
$1
$8,000
$5.40
amount
5
3
100
25
0.9
25
TOTAL
cost
$17
$250
$50
$25
$7,200
$135
$7,700
Tertiary SystemThe total investment for farmers to implement the new scheme are US$400,000. These costs includethe construction of canals, and offtakes, and the purchase of flexitubes.
Secondary canals are two to four times smaller than the primary canal. Construction costs are estimatedat US$18, which is half of the costs of the primary canal. Seventeen meters of secondary canal isconstructed per hectare.
Quaternary offtakes consist of a piece of steel piping in the site of the canal, which is supplied with anon/off gate. The costs of an offtake are $10, (US$4 for material, and US$6 for labor; Benitez, 1994).Flexitubes cost US$2 per meter; 67 m of flexitube is provided to irrigate one hectare.
80

5.7.2 Annual CostsThe annual costs of the new irrigation scheme (US$1,250,000) equal those of the old scheme.Operation and maintenance costs are higher for the new scheme. Costs of water supply and fertilizationare lower for the new scheme. The other categories of costs for the old and the new irrigation arepresumed to be the same. The costs for these categories are based on unpublished figures fromCENICAÑA. These categories include: drainage; clearing and grubbing; soil preparation; weed control;and miscellaneous. The annual costs are presented in table 25.
Table 25: Annual costs of old irrigation schemeitem
operation and maintenance
water supply
fertilization
drainage
clearing and grubbing
sowing
weed control
harvesting
miscellaneous
TOTAL
unit
ha/year
ha/year
ha/year
ha/year
ha/5 years
ha/ year
ha/year
ha/year
old irrigation scheme
unit cost
$110
$150
$106
$493
$383
$60
$35
$95
annual cost
$200,000
$100,000
$140,000
$100,000
$460,000
$70,000
$60,000
$40,000
$90,000
$1,250,000
new irrigation scheme
unit cost
$0
$123
$106
$460
$383
$60
$35
$95
annual cost
$390,000
$0
$110,000*
$100,000
$460,000
$70,000
$60,000
$40,000
$90,000
$1,250,000
* $90,000 for reuse scheme with primary effluent
Operation and MaintenanceThe annual costs of a centralized irrigation scheme using reclaimed wastewater include the costs for theoperation and maintenance center, the actual operation of the main system, and the maintenance ofcanals and offtakes. The costs of the operation and maintenance center are the sum of two salaries: onesupervisor and one laborer. The costs for O&M of the new system are based on the presumption thatoperation and maintenance takes twice as much time in the more elaborate new canal system.
Water SupplyThe costs of water supply for the old system US$100,000 for 2.9 * 106 m3 water. Presumptions onwhich this estimate is based, are: (1) 20% of this water is derived from groundwater and 80% fromsurface water; (2) an average overall efficiency of 30%; and (3) a crop coefficient of 0.42 after rotation.The pumped discharge per year is 2.9*10* m3. This is the average water requirement (304 mm, see table18), times the surface area (936 ha).
CENICAÑA estimates the cost of pumping of groundwater from wells to be US$0.07 per m3 inFebruary 1996. Ingenio Mayagüez, a sugarcane factory that cultivates several farms in the survey areastates a price of US$0.084 in March 1996. The CVC established taxes on the use of groundwater in1995, at present they range from 0.07 to 0.1 dollarcents per m3 (CVC, 1995; Cruz, pers.comm.;Medina, pers.comm).
81
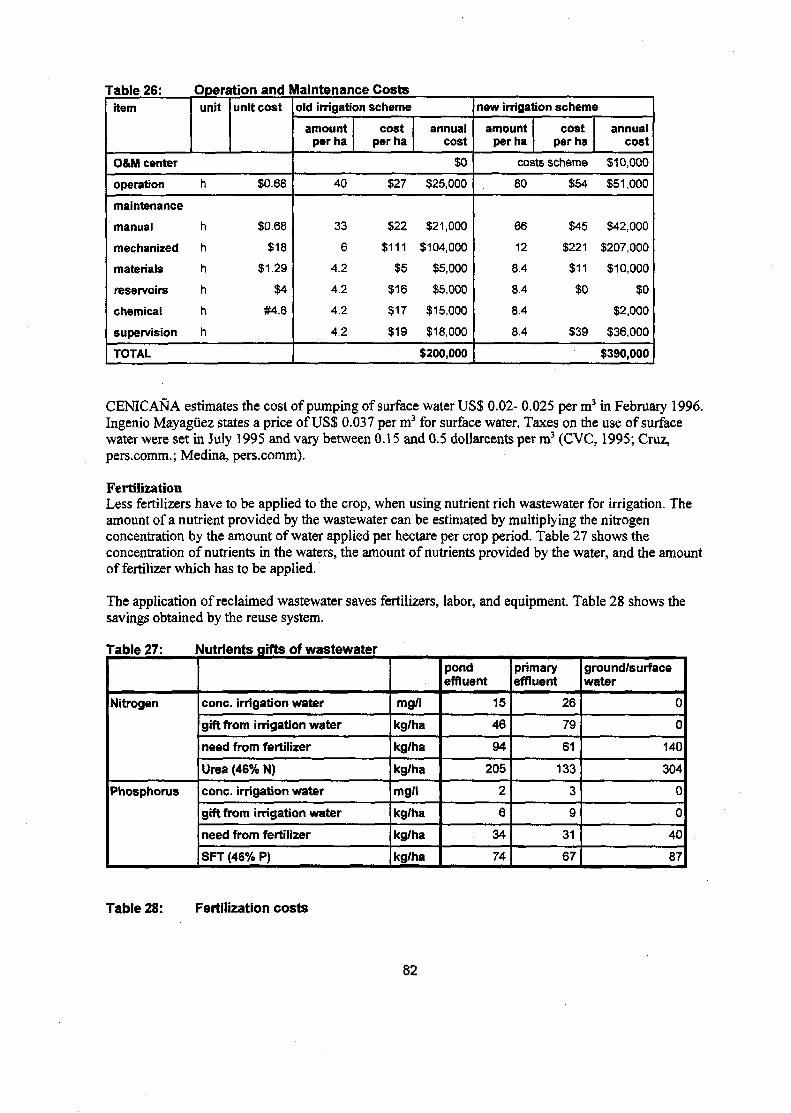
Table 26:item
Operation and Maintenance Costsunit unit cost
O&M center
operation
maintenance
manual
mechanized
materials
reservoirs
chemical
supervision
h
h
h
h
h
h
h
$0.68
$0.68
$18
$1.29
$4
#4.6
TOTAL
old irrigation scheme
amountper ha
costper ha
annualcost
$0
40
33
6
4.2
4.2
4.2
4.2
$27
$22
$111
$5
$16
$17
$19
$25,000
$21,000
$104,000
$5,000
$5,000
$15,000
$18,000
$200,000
now irrigation scheme
amountper ha
costper ha
costs scheme
80
66
12
8.4
8.4
8.4
8.4
$54
$45
$221
$11
$0
$39
annualcost
$10,000
$51,000
$42,000
$207,000
$10,000
$0
$2,000
$36,000
$390,000
CENICAÑA estimates the cost of pumping of surface water US$ 0.02- 0.025 per m3 in February 1996.Ingenio Mayagüez states a price of US$ 0.037 per m3 for surface water. Taxes on the use of surfacewater were set in July 1995 and vary between 0.15 and 0.5 dollarcents per m3 (CVC, 1995; Cruz,pers.comm.; Medina, pers.comm).
FertilizationLess fertilizers have to be applied to the crop, when using nutrient rich wastewater for irrigation. Theamount of a nutrient provided by the wastewater can be estimated by multiplying the nitrogenconcentration by the amount of water applied per hectare per crop period. Table 27 shows theconcentration of nutrients in the waters, the amount of nutrients provided by the water, and the amountof fertilizer which has to be applied.
The application of reclaimed wastewater saves fertilizers, labor, and equipment. Table 28 shows thesavings obtained by the reuse system.
Table 27: Nutrients gifts of wastewater
Nitrogen
Phosphorus
cone, irrigation water
gift from irrigation water
need from fertilizer
Urea (46% N)
cone, irrigation water
gift from irrigation water
need from fertilizer
SFT (46% P)
mg/l
kg/ha
kg/ha
kg/ha
mg/l
kg/ha
kg/ha
kg/ha
pondeffluent
15
46
94
205
2
6
34
74
primaryeffluent
26
79
61
133
3
9
31
67
ground/surfacewater
0
0
140
304
0
0
40
87
Table 28: Fertilization costs
82
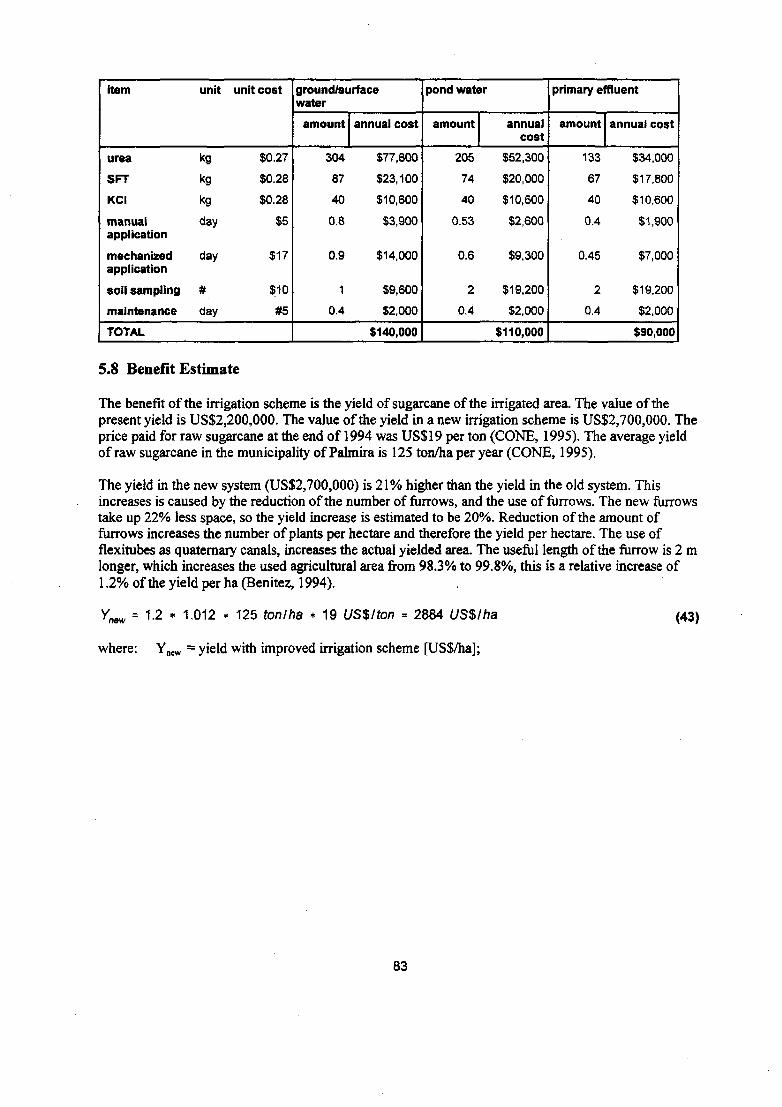
item
urea
SFT
KCI
manualapplication
mechanizedapplication
soil sampling
maintenance
TOTAL
unit
kg
kg
kg
day
day
#
day
unit cost
$0.27
$0.28
$0.28
$5
$17
$10
#5
ground/surfacewater
amount
304
87
40
0.8
0.9
1
0.4
annual cost
$77,600
$23,100
$10,600
$3,900
$14,000
$9,600
$2,000
$140,000
pond water
amount
205
74
40
0.53
0.6
2
0.4
annualcost
$52,300
$20,000
$10,600
$2,600
$9,300
$19,200
$2,000
$110,000
primary effluent
amount
133
67
40
0.4
0.45
2
0.4
annual cost
$34,000
$17,800
$10,600
$1,900
$7,000
$19,200
$2,000
$90,000
5.8 Benefit Estimate
The benefit of the irrigation scheme is the yield of sugarcane of the irrigated area. The value of thepresent yield is US$2,200,000. The value of the yield in a new irrigation scheme is US$2,700,000. Theprice paid for raw sugarcane at the end of 1994 was US$19 per ton (CONE, 1995). The average yieldof raw sugarcane in the municipality of Palmira is 125 ton/ha per year (CONE, 1995).
The yield in the new system (US$2,700,000) is 21% higher than the yield in the old system. Thisincreases is caused by the reduction of the number of furrows, and the use of furrows. The new furrowstake up 22% less space, so the yield increase is estimated to be 20%. Reduction of the amount offurrows increases the number of plants per hectare and therefore the yield per hectare. The use offlexitubes as quaternary canals, increases the actual yielded area. The useful length of the furrow is 2 mlonger, which increases the used agricultural area from 98.3% to 99.8%, this is a relative increase of1.2% of the yield per ha (Benitez, 1994).
Ymw = 1.2 * 1.012 * 125 tonlha * 19 US$/ton = 2884 US$1 ha
where: Ynew = yield with improved irrigation scheme [US$/ha];
(43)
83

84
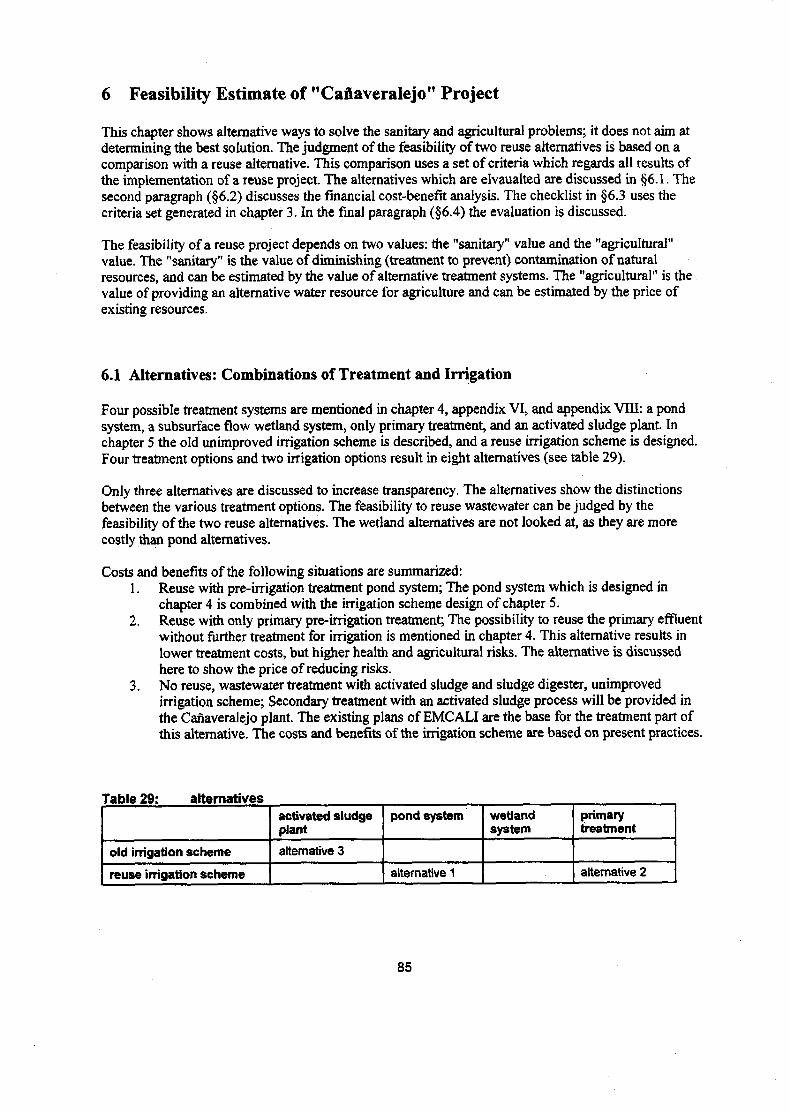
6 Feasibility Estimate of "Cañaveralejo" Project
This chapter shows alternative ways to solve the sanitary and agricultural problems; it does not aim atdetermining the best solution. The judgment of the feasibility of two reuse alternatives is based on acomparison with a reuse alternative. This comparison uses a set of criteria which regards all results ofthe implementation of a reuse project. The alternatives which are elvaualted are discussed in §6.1. Thesecond paragraph (§6.2) discusses the financial cost-benefit analysis. The checklist in §6.3 uses thecriteria set generated in chapter 3. In the final paragraph (§6.4) the evaluation is discussed.
The feasibility of a reuse project depends on two values: the "sanitary" value and the "agricultural"value. The "sanitary" is the value of diminishing (treatment to prevent) contamination of naturalresources, and can be estimated by the value of alternative treatment systems. The "agricultural" is thevalue of providing an alternative water resource for agriculture and can be estimated by the price ofexisting resources.
6.1 Alternatives: Combinations of Treatment and Irrigation
Four possible treatment systems are mentioned in chapter 4, appendix VI, and appendix VIII: a pondsystem, a subsurface flow wetland system, only primary treatment, and an activated sludge plant. Inchapter 5 the old unimproved irrigation scheme is described, and a reuse irrigation scheme is designed.Four treatment options and two irrigation options result in eight alternatives (see table 29).
Only three alternatives are discussed to increase transparency. The alternatives show the distinctionsbetween the various treatment options. The feasibility to reuse wastewater can be judged by thefeasibility of the two reuse alternatives. The wetland alternatives are not looked at, as they are morecostly than pond alternatives.
Costs and benefits of the following situations are summarized:1. Reuse with pre-irrigation treatment pond system; The pond system which is designed in
chapter 4 is combined with the irrigation scheme design of chapter 5.2. Reuse with only primary pre-irrigation treatment; The possibility to reuse the primary effluent
without further treatment for irrigation is mentioned in chapter 4. This alternative results inlower treatment costs, but higher health and agricultural risks. The alternative is discussedhere to show the price of reducing risks.
3. No reuse, wastewater treatment with activated sludge and sludge digester, unimprovedirrigation scheme; Secondary treatment with an activated sludge process will be provided inthe Cañaveralejo plant. The existing plans of EMCALI are the base for the treatment part ofthis alternative. The costs and benefits of the irrigation scheme are based on present practices.
Table 29: alternatives
old irrigation scheme
reuse irrigation scheme
activated sludgeplant
alternative 3
pond system
alternative 1
wetlandsystem
primarytreatment
alternative 2
85
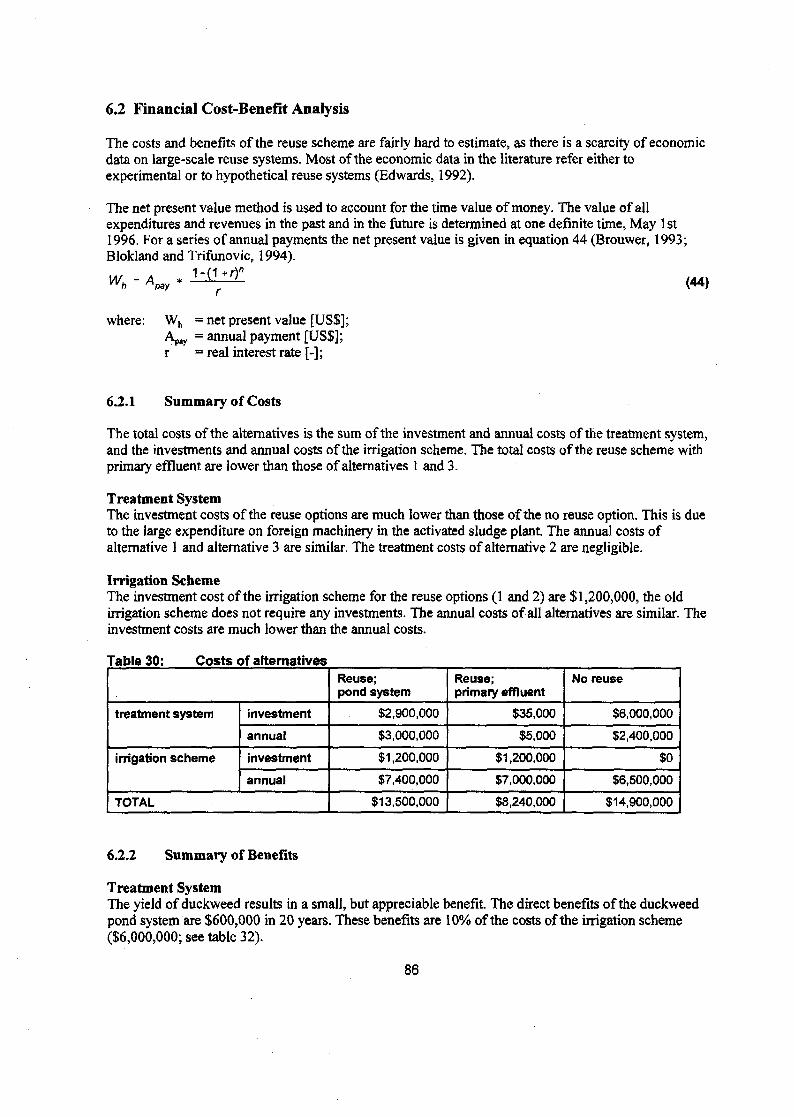
6.2 Financial Cost-Benefit Analysis
The costs and benefits of the reuse scheme are fairly hard to estimate, as there is a scarcity of economicdata on large-scale reuse systems. Most of the economic data in the literature refer either toexperimental or to hypothetical reuse systems (Edwards, 1992).
The net present value method is used to account for the time value of money. The value of allexpenditures and revenues in the past and in the future is determined at one definite time, May 1st1996. For a series of annual payments the net present value is given in equation 44 (Brouwer, 1993;Blokland and Trifunovic, 1994).
= \*y * (44)
where: Wh = net present value [US$];Apay = annual payment [US$];r = real interest rate [-];
6.2.1 Summary of Costs
The total costs of the alternatives is the sum of the investment and annual costs of the treatment system,and the investments and annual costs of the irrigation scheme. The total costs of the reuse scheme withprimary effluent are lower than those of alternatives 1 and 3.
Treatment SystemThe investment costs of the reuse options are much lower than those of the no reuse option. This is dueto the large expenditure on foreign machinery in the activated sludge plant. The annual costs ofalternative 1 and alternative 3 are similar. The treatment costs of alternative 2 are negligible.
Irrigation SchemeThe investment cost of the irrigation scheme for the reuse options (1 and 2) are $1,200,000, the oldirrigation scheme does not require any investments. The annual costs of all alternatives are similar. Theinvestment costs are much lower than the annual costs.
Table 30: Costs of alternatives
treatment system
irrigation scheme
investment
annual
investment
annual
TOTAL
Reuse;pond system
$2,900,000
$3,000,000
$1,200,000
$7,400,000
$13,500,000
Reuse;primary effluent
$35,000
$5,000
$1,200,000
$7,000,000
$8,240,000
No reuse
$6,000,000
$2,400,000
$0
$6,500,000
$14,900,000
6.2.2 Summary of Benefits
Treatment SystemThe yield of duckweed results in a small, but appreciable benefit. The direct benefits of the duckweedpond system are $600,000 in 20 years. These benefits are 10% of the costs of the irrigation scheme($6,000,000; see table 32).
86
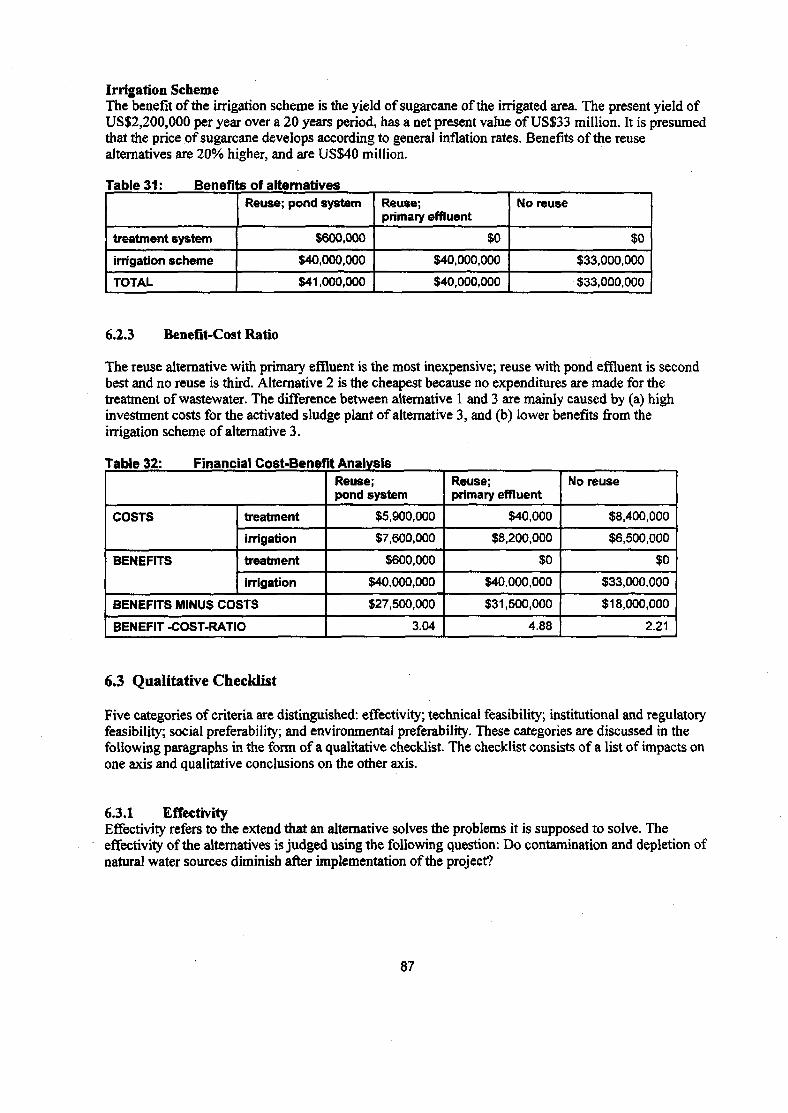
Irrigation SchemeThe benefit of the irrigation scheme is the yield of sugarcane of the irrigated area. The present yield ofUS$2,200,000 per year over a 20 years period, has a net present value of US$33 million. It is presumedthat the price of sugarcane develops according to general inflation rates. Benefits of the reusealternatives are 20% higher, and are US$40 million.
Table 31 : Benefls of alternatives
treatment system
irrigation scheme
TOTAL
Reuse; pond system
$600,000
$40,000,000
$41,000,000
Reuse;primary effluent
$0
$40,000,000
$40,000,000
No reuse
$0
$33,000,000
$33,000,000
6.2.3 Benefit-Cost Ratio
The reuse alternative with primary effluent is the most inexpensive; reuse with pond effluent is secondbest and no reuse is third. Alternative 2 is the cheapest because no expenditures are made for thetreatment of wastewater. The difference between alternative 1 and 3 are mainly caused by (a) highinvestment costs for the activated sludge plant of alternative 3, and (b) lower benefits from theirrigation scheme of alternative 3.
Table 32: Financial Cost-Benefit Analysis
COSTS
BENEFITS
treatment
irrigation
treatment
irrigation
BENEFITS MINUS COSTS
BENEFIT -COST-RATIO
Reuse;pond system
$5,900,000
$7,600,000
$600,000
$40,000,000
$27,500,000
3.04
Reuse;primary effluent
$40,000
$8,200,000
$0
$40,000,000
$31,500,000
4.88
No reuse
$8,400,000
$6,500,000
$0
$33,000,000
$18,000,000
2.21
6.3 Qualitative Checklist
Five categories of criteria are distinguished: effectiviry; technical feasibility; institutional and regulatoryfeasibility; social preferability; and environmental preferability. These categories are discussed in thefollowing paragraphs in the form of a qualitative checklist. The checklist consists of a list of impacts onone axis and qualitative conclusions on the other axis.
6.3.1 EffectiviryEffectiviry refers to the extend that an alternative solves the problems it is supposed to solve. Theeffectiviry of the alternatives is judged using the following question: Do contamination and depletion ofnatural water sources diminish after implementation of the project?
87
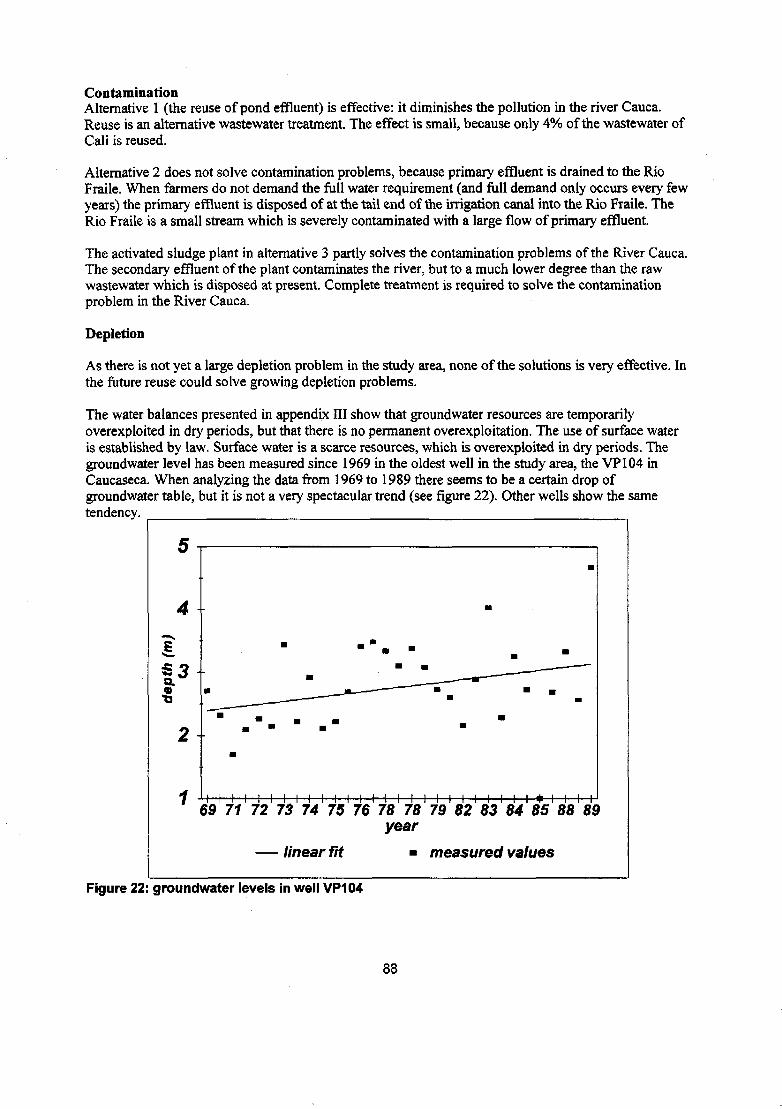
ContaminationAlternative 1 (the reuse of pond effluent) is effective: it diminishes the pollution in the river Cauca.Reuse is an alternative wastewater treatment. The effect is small, because only 4% of the wastewater ofCali is reused.
Alternative 2 does not solve contamination problems, because primary effluent is drained to the RioFraile. When farmers do not demand the full water requirement (and full demand only occurs every fewyears) the primary effluent is disposed of at the tail end of the irrigation canal into the Rio Fraile. TheRio Fraile is a small stream which is severely contaminated with a large flow of primary effluent.
The activated sludge plant in alternative 3 partly solves the contamination problems of the River Cauca.The secondary effluent of the plant contaminates the river, but to a much lower degree than the rawwastewater which is disposed at present. Complete treatment is required to solve the contaminationproblem in the River Cauca.
Depletion
As there is not yet a large depletion problem in the study area, none of the solutions is very effective. Inthe future reuse could solve growing depletion problems.
The water balances presented in appendix III show that groundwater resources are temporarilyoverexploited in dry periods, but that there is no permanent overexploitation. The use of surface wateris established by law. Surface water is a scarce resources, which is overexploited in dry periods. Thegroundwater level has been measured since 1969 in the oldest well in the study area, the VP104 inCaucaseca. When analyzing the data from 1969 to 1989 there seems to be a certain drop ofgroundwater table, but it is not a very spectacular trend (see figure 22). Other wells show the sametendency.
1 4 - f h i I I I I I I I I I I I I I I I I I I I I I I » I I I I '
69 71 72 73 74 75 76 78 78 79 82 83 84 85 88 89year
— linear fit • measured values
Figure 22: groundwater levels in well VP104
88

Data on water depletion in the study area are hard to interpret because precipitation (and therefore bothuse of resources and natural replenishment) varies greatly over the year. Farmers in the study area usemainly surface water for irrigation. Eight groundwater wells exploit the most superficial aquifer.Regulators and users disagree on the level of depletion of natural resources: disputes between thevarious users of surface water are on the increase; users of surface water say the discharges of the riversin the Valle de Cauca have dropped over the last 30 years; the official opinion of the CVC is thatdischarges have not decreased, but only demand has increased. Reality is most probably somewhere inbetween these extremes.
Table 33: Effectivitv checklist
Does contamination of natural water sources diminish after implementation of the project?
Does depletion of natural water sources diminish after implementation of the project?
1
+
0
2
-
0
3
±
0
6.3.2 Technical FeasibilityTechnical feasibility refers to the availability of resources that are necessary for the implementation ofthe project, like materials, man power, and skills. The theoretical basis for the treatment system, theintegration of wastewater considerations in the irrigation scheme, and the availability of labor andmaterials are discussed in this paragraph.
Theoretical basis of TreatmentThe duckweed pond system is a technical acceptable treatment option. The theoretical basis for thedesign of pond systems is quite strong, and there is experience of full-scale operational systems intropical conditions. The duckweed pond system is an upgraded waste stabilization pond system. Wastestabilization pond systems have been applied locally with satisfying results. The duckweed is a mostinsecure component of the system, but it only removes nutrients. The duckweed pond system, althoughit is a new system, does not create a public health risks. Research and demonstration projects haveshown that macrophyte-based systems can provide effective wastewater treatment, but full-scalesystems have not often met the expectations.
The theoretical basis for the design and implementation of an activated sludge treatment system isstrong. There is a lot of experience with activated sludge plants all over the world. Experience inColombia is limited.
Integration of wastewater in irrigation systemThe integration of wastewater in the irrigation scheme does not cause any problems. The salinity of thewastewater is low, so the leaching fraction can be low. Nutrients in the wastewater decrease the need toapply fertilizers. The nitrogen concentration does not pollute the groundwater.
Availability of laborPond systems require low-skilled personnel for operation and maintenance, and are easy to construct.Operators have to be trained in some basic skills. The implementation of an activated sludge plant isproblematic in Colombia, where skilled manpower is scarce.
The implementation of an irrigation scheme using reclaimed wastewater requires some extra skills fromoperators and farmers of the area. They should be taught what risk the contact with the water implies,and which measures can be taken to lower risks. Farmers have to be taught that they can save fertilizers.
89

The implementation of a centralized irrigation scheme, in which farmers have to share water requires achange in attitude as well as new skills of the water users. The extra technical skills required for theoperation and maintenance of the system consist of the operation of adjustable structures, and themeasurements of discharges. The change in attitude is discussed in the paragraph on social impacts.
Availability of materialsAll materials for the construction of the pond system can be locally obtained. One of the advantages ofnatural treatment systems is that they do not require expensive, imported parts. The irrigation system isalso designed to be implemented with local materials: structures are simple and straight-forwardlydesigned. Construction of an activated sludge plant involves large expenditure to import materials.
Table 34: Technical feasibility checklist
Does the treatment concept have a solid theoretical basis which guarantees a secureconstruction and operation?
Can the wastewater considerations be integrated into a distribution system in a secure way?
Are skilled labor and manpower available for the implementation of the project?
Are all materials for the construction of the system present or obtainable in Cali region?
1
0
+
+
+
2
-
0
+
+
3
+
+
0
-
6.3.3 Institutional and Legal Aspects
Laws and regulationsColombian law does not state special requirements for reuse of wastewater. However, two articles oflaw 1594 apply to reuse: Article 40 which presents rules for the use of water resources for agricultureand article 72, which specifies the requirements for discharge of sewerage on water bodies (Republicade Colombia, 1984). It is not clear whether reuse, the discharge of wastewater into irrigation canals,must comply with the rules set for discharges of wastewater into water bodies, which are presented inarticle 72. The law has not been enforced up till now.
Legislative unitsThe reuse project is situated in two legislative units: the municipality of Cali and the municipality ofPalmira. This causes large problems for the implementation of the project. The activated sludge planttreats the wastewater in the same municipality as it derives from.
In general the institutional sector is weak and not satisfactory organized to fulfill the demands ofwastewater treatment plants. The administrative decentralization process, undertaken by the centralgovernment since 1986, leaves responsibilities for sanitation at a local level, at city councils. Councilsof small municipalities often do not have the know-how to carry out their sanitation tasks. Sanitationused to be the responsibility of the Ministry of Transport but is now assigned to the Ministry ofEconomic Development, Section of Urban Development, Housing and Potable Water. In March 1995the National Planning Department in cooperation with the National Council of Social and EconomicPolicy launched the Water Plan for the period of 1995-1998. The main objective of the plan is toprovide the majority of Colombians with water supply and sewerage, wastewater treatment is of minorimportance in the plan (Peña, 1995).
90

Institutional FrameworkAn institutional framework has to be set up to implement the reuse project. This will not be an easytask. The cooperation between the various legislative units can be expected to be difficult ASOCÁÑAand CENICAÑA can serve as a base for lhe water delivery organization of the irrigation scheme.
Table 35: Institutional and legal checklist
Which laws and regulations exist, that the project has to obey? Do any of them forbid orcomplicate the implementation of the project?
In which legislative units is the projects located and does the project cross legislativeborders?
Does an institutional framework exist, which can implement the project? Or how can theinstitutional framework be established?
1
0
-
-
2
-
-
-
3
+
+
0
6.3.4 Social AspectsThe social aspects of the reuse scheme include public health risks, the acceptance of reuse in the Vallede Cauca, and the participation of farmers in the centralization of the irrigation system.
Public Health RisksThe public health risks of the use of pond effluent are low: the water quality meets the strict guidelinesof the WHO. The use of primary effluent does create public health risks.
Public health risk of the reuse of wastewater in sugarcane irrigation can be controlled because (1)sugarcane is not eaten raw, (2) irrigation stops three month before harvesting, and (3) sugarcaneconsumes a vast part of the nitrogen in the irrigation water.
The public health risks of the use of primary effluent include:Exposure of workers to the helminth eggs;Breeding places for mosquitos in the septic water in the intermittent irrigation scheme;Exposure of consumers, when farmers irrigate other crops than sugarcane;
Acceptance of ReuseReuse is accepted if it is an economical alternative. Cultural prejudice against reuse does not exist. Onthe other hand people are hardly conscious of a need to achieve ecologically sound farming practicesand patterns of human existence. The awareness of the undesirability of polluting rivers with untreatedor inadequately treated sewage is low. Farmers are willing to look for substitutes for expensivefertilizers that are required in large volumes in sugarcane cultivation. Policymakers have prejudicesregarding reuse and natural treatment systems.
In large parts of the world the transformation of values has now proceeded to the point that constraintsupon effective reuse are more a question of cost and technical feasibility (particularly the problem ofmixing domestic and industrial wastewater in most urban systems), than a question of culturalpredisposition (Feachem et al, 1983).
Centralization of the Irrigation SchemeThe centralization of the irrigation scheme involves the education of farmers, as farmers are use toirrigation per farm. The organization of the farmers is strong, so the educational problems can beovercome.
91
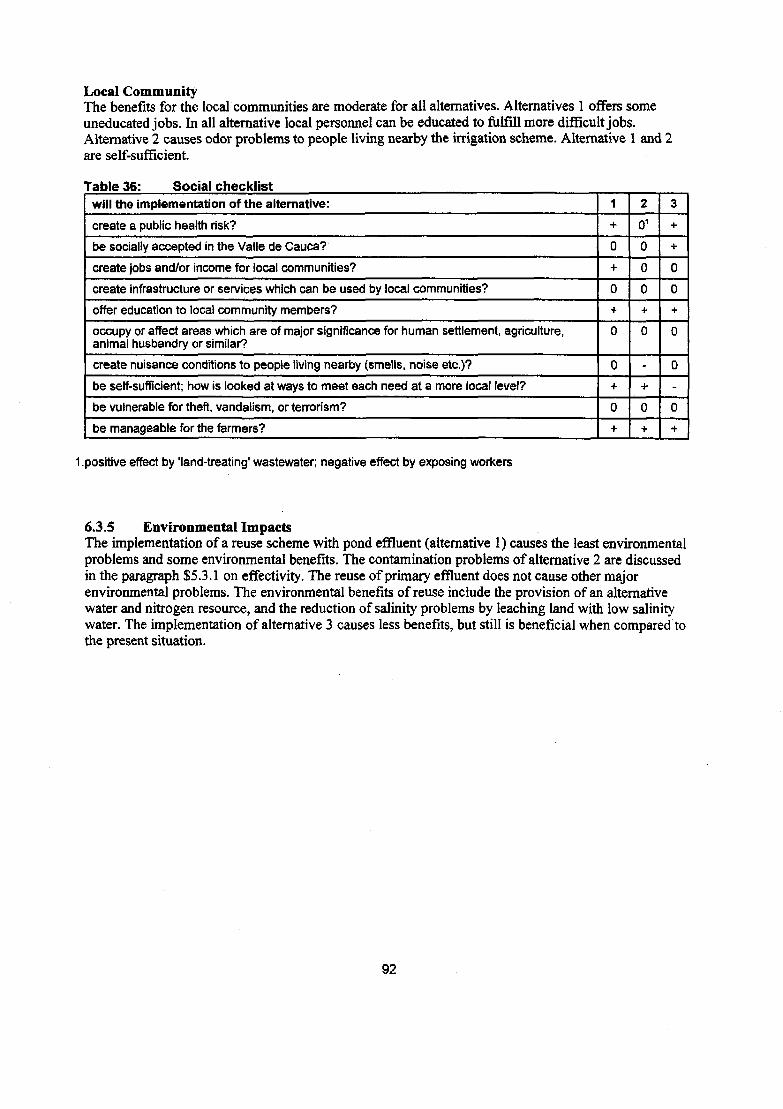
Local CommunityThe benefits for the local communities are moderate for all alternatives. Alternatives 1 offers someuneducated jobs. In all alternative local personnel can be educated to fulfill more difficult jobs.Alternative 2 causes odor problems to people living nearby the irrigation scheme. Alternative 1 and 2are self-sufficient.
Table 36: Social checklistwill the implementation of the alternative:
create a public health risk?
be socially accepted in the Valle de Cauca?
create jobs and/or income for local communities?
create infrastructure or services which can be used by local communities?
offer education to local community members?
occupy or affect areas which are of major significance for human settlement, agriculture,animal husbandry or similar?
create nuisance conditions to people living nearby (smells, noise etc.)?
be self-sufficient; how is looked at ways to meet each need at a more local level?
be vulnerable for theft, vandalism, or terrorism?
be manageable for the farmers?
1
+
0
+
0
+
0
0
+
0
+
2
o1
0
0
0
+
0
-
+
0
+
3
+
+
0
0
+
0
0
-
0
+
1.positive effect by 'land-treating' wastewater; negative effect by exposing workers
6.3.5 Environmental ImpactsThe implementation of a reuse scheme with pond effluent (alternative 1) causes the least environmentalproblems and some environmental benefits. The contamination problems of alternative 2 are discussedin the paragraph $5.3.1 on effectivity. The reuse of primary effluent does not cause other majorenvironmental problems. The environmental benefits of reuse include the provision of an alternativewater and nitrogen resource, and the reduction of salinity problems by leaching land with low salinitywater. The implementation of alternative 3 causes less benefits, but still is beneficial when compared tothe present situation.
92
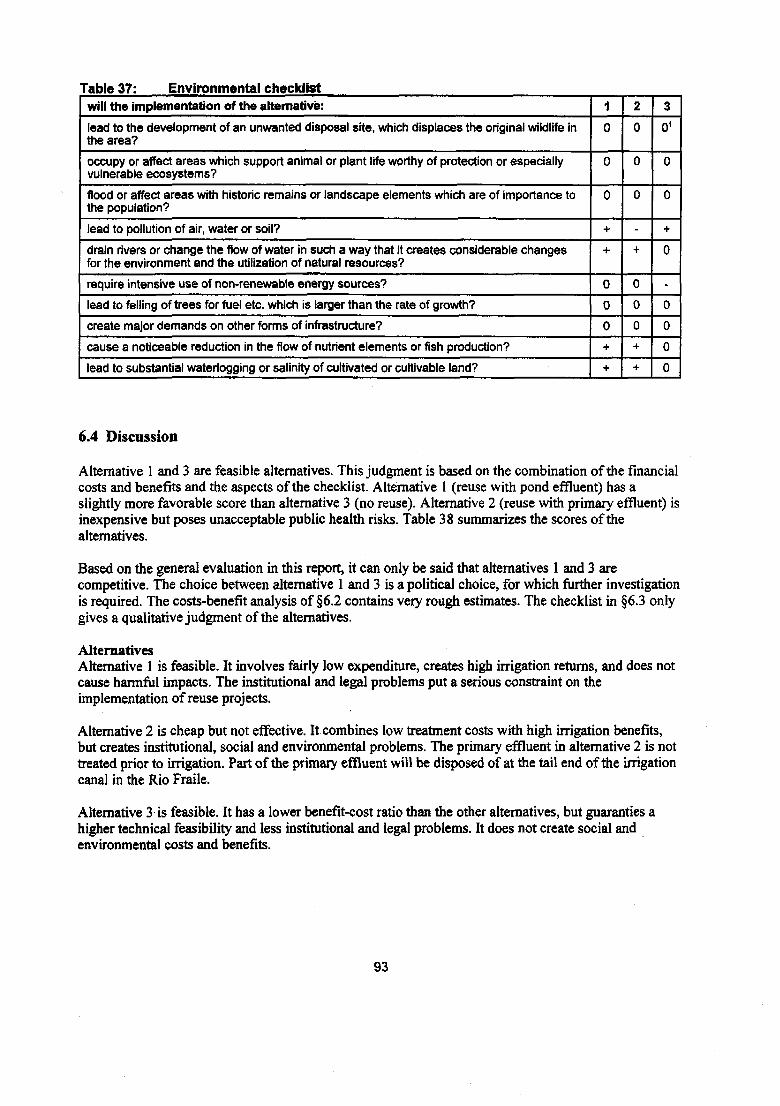
Table 37: Environmental checklistwill the implementation of the alternative:
lead to the development of an unwanted disposal site, which displaces the original wildlife inthe area?
occupy or affect areas which support animal or plant life worthy of protection or especiallyvulnerable ecosystems?
flood or affect areas with historic remains or landscape elements which are of importance tothe population?
lead to pollution of air, water or soil?
drain rivers or change the flow of water in such a way that it creates considerable changesfor the environment and the utilization of natural resources?
require intensive use of non-renewable energy sources?
lead to felling of trees for fuel etc. which is larger than the rate of growth?
create major demands on other forms of Infrastructure?
cause a noticeable reduction in the flow of nutrient elements or fish production?
lead to substantial waterlogging or salinity of cultivated or cultivable land?
1
0
0
0
+
+
0
0
0
+
+
2
0
0
0
-
+
0
0
0
+
+
3
o1
0
0
+
0
-
0
0
0
0
6.4 Discussion
Alternative 1 and 3 are feasible alternatives. This judgment is based on the combination of the financialcosts and benefits and the aspects of the checklist. Alternative 1 (reuse with pond effluent) has aslightly more favorable score than alternative 3 (no reuse). Alternative 2 (reuse with primary effluent) isinexpensive but poses unacceptable public health risks. Table 38 summarizes the scores of thealternatives.
Based on the general evaluation in this report, it can only be said that alternatives 1 and 3 arecompetitive. The choice between alternative 1 and 3 is a political choice, for which further investigationis required. The costs-benefit analysis of §6.2 contains very rough estimates. The checklist in §6.3 onlygives a qualitative judgment of the alternatives.
AlternativesAlternative 1 is feasible. It involves fairly low expenditure, creates high irrigation returns, and does notcause harmful impacts. The institutional and legal problems put a serious constraint on theimplementation of reuse projects.
Alternative 2 is cheap but not effective. It combines low treatment costs with high irrigation benefits,but creates institutional, social and environmental problems. The primary effluent in alternative 2 is nottreated prior to irrigation. Part of the primary effluent will be disposed of at the tail end of the irrigationcanal in the Rio Fraile.
Alternative 3 is feasible. It has a lower benefit-cost ratio than the other alternatives, but guaranties ahigher technical feasibility and less institutional and legal problems. It does not create social andenvironmental costs and benefits.
93
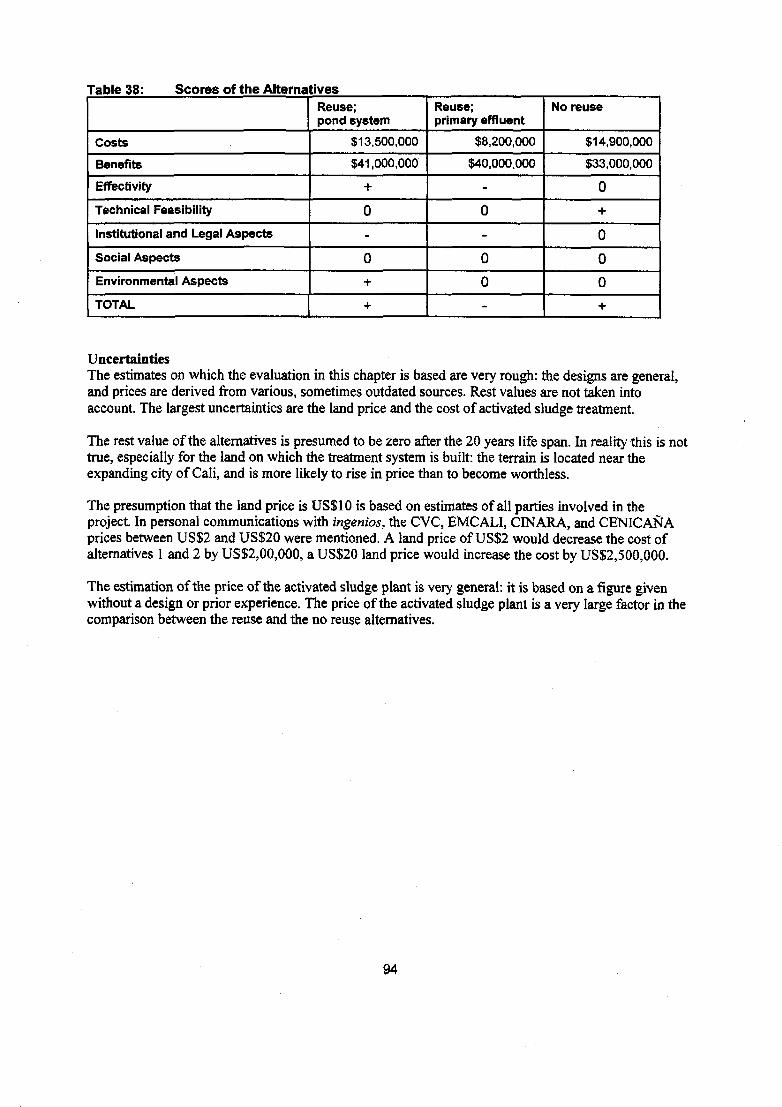
Table 38: Scores of the Alternatives
Costs
Benefits
Effectivity
Technical Feasibility
Institutional and Legal Aspects
Social Aspects
Environmental Aspects
TOTAL
Reuse;pond system
$13,500,000
$41,000,000
+
0
-
0
+
+
Reuse;primary effluent
$8,200,000
$40,000,000
-
0
0
0
-
No reuse
$14,900,000
$33,000,000
0
+
0
0
0
+
UncertaintiesThe estimates on which the evaluation in this chapter is based are very rough: the designs are general,and prices are derived from various, sometimes outdated sources. Rest values are not taken intoaccount. The largest uncertainties are the land price and the cost of activated sludge treatment.
The rest value of the alternatives is presumed to be zero after the 20 years life span. In reality this is nottrue, especially for the land on which the treatment system is built: the terrain is located near theexpanding city of Cali, and is more likely to rise in price than to become worthless.
The presumption that the land price is US$10 is based on estimates of all parties involved in theproject. In personal communications with ingenios, the CVC, EMC ALI, CINARA, and CENICAÑAprices between US$2 and US$20 were mentioned. A land price of US$2 would decrease the cost ofalternatives 1 and 2 by US$2,00,000, a US$20 land price would increase the cost by US$2,500,000.
The estimation of the price of the activated sludge plant is very general: it is based on a figure givenwithout a design or prior experience. The price of the activated sludge plant is a very large factor in thecomparison between the reuse and the no reuse alternatives.
94

7 Conclusions and Recommendations
7.1 Results
Water balances for surface water and groundwater of the Valle de Cauca are made.
A design for a reuse scheme of the effluent of the Cañaveralejo plant is made. This design includes aduckweed pond system for a flow of 475 1/s, which is 4% of the wastewater of Cali. An alternativeirrigation scheme which uses the duckweed pond effluent is made with a size of 936 ha, which is 0.5%of the agricultural area of the Valle de Cauca.
An evaluation is made of the three alternatives:1. Reuse with pond system;2. Reuse with primary effluent;3. Nor reuse, activated sludge treatment, present unimproved irrigation scheme;
The evaluation consists of a cost-benefit analysis, and a qualitative checklist, which judges effectivity;technical feasibility; institutional and regulatory feasibility; social preferability; and environmentalpreferability.
7.2 Conclusions
The contamination of the River Cauca creates serious public health and environmental risks. Thecontamination is largely caused by the disposal of raw wastewater of Cali into the River Cauca.Depletion problems do not yet occur at present in the Cali region.
The need for reuse of wastewater in the Valle de Cauca will increase in the coming years.Contamination will increase due to population growth and the rise of the standard of living. Depletionof groundwater and surface water will occur in certain areas at certain times, as water demand foragriculture, human use and industry increases. Reuse of domestic wastewater is a moderate factor insolving depletion problems: 6% of the water use in the Valle de Cauca is used for domestic uses.
The primary effluent of Cañaveralejo plant can serve as a reliable water source for irrigation aftertreatment with a duckweed pond system. Reuse does not put at risk public health, crops or soils.
Reuse of part of the Cañaveralejo effluent for the irrigation of sugarcane of the area between the RioCauca and Rio Fraile is an economically feasible and sustainable alternative to decrease effluentdisposal problems of Cali. The Cañaveralejo reuse scheme is cheaper to construct, operate and maintainthan the combination of an activated sludge treatment and the old irrigation scheme. The majordifficulty for implementation of the project is the institutional organization. Reuse projects involve thecooperation of several organizations with split interests. The project crosses municipal borders.
Duckweed pond systems are technical feasible for large flows of domestic wastewater. The use ofsubsurface flow wetlands for the treatment of large urban wastewater flow is not yet a feasible option,as knowledge and experience are limited. Especially experience under tropical conditions withfunctioning, design, operation and maintenance of subsurface flow wetlands is very scarce. Thesubsurface flow wetland concept is promising for small treatment systems in Colombia, wheretemperature is constant and high year-round.
95

The effluent of a duckweed pond system influences sugarcane irrigation by providing nutrients. Thewastewater provides part of the nutrient demand of the sugarcane, so less fertilizer has to be applied;but maintenance of canals and structures increases due to weeds.
Reuse projects are more attractive in areas where presently groundwater is used for irrigation. In thesearea the depletion of natural water sources is severe and pumping costs are higher.
An improved centralized irrigation scheme is more economical than unimproved individual farmirrigation schemes, with or without wastewater reuse. An improved furrow irrigation system withflexitubes as tertiary canals, larger furrow spacing, and lined canals can halve water demand.
7.3 Recommendations
The disposal of the raw wastewater into the River Cauca should be put to an end as soon as possible.Every effort should be taken to put the various wastewater treatment plants in the Valle de Cauca intooperation shortly. Further measures to reduce contamination should be planned and implemented. TheCVC should enforce the regulations on disposal of wastewaters.
Measurements should be better documented by the various responsible organizations. A centralizeddatabase system should be established, in which all data on quantitative and qualitative watermanagement are collected.
Pilot plants for macrophyte-based treatment systems should be established. These systems should alsobe implemented in small communities. Performance should be monitored and documented.
Reuse possibilities in other areas in the Valle de Cauca, where more groundwater is used should beinvestigated. An example of an area that suffers from depletion is the community of Candelaria.
A water and chloride balance should be made for the Valle de Cauca. These balances could be the startof an integral water management system for the entire basin.
ASOCAÑA/CENICAÑA should investigate possibilities for centralized irrigation schemes. In thisstudy a centralized irrigation scheme turned out to be more economical, regardless of the water source.
More knowledge about the influent and the effluent of future wastewater treatment plants ease furtherplanning of treatment or reuse options. EMC ALI should execute a research project into the quality ofraw wastewater. Measurements should include discharges, BOD, TSS, nutrients, electric conductivity,SAR, chloride, and heavy metals.
All parties, involved in reuse in the Valle de Cauca, should establish an organization to investigate andimplement reuse possibilities. These parties include EMCALI, ACUA VALLE, CVC, municipalities,and CENICAÑA/ASOCAÑA. These organizations could be supported by research institutes, like theUniversity del Valle, CINARA, and CIPAV.
96

LiteratureAl-Nozaily, Duckweed-based Lagooningfor Wastewater Treatment in the Republic of Yemen,PhD research proposal, Delft, The Netherlands: IHE, unpublished, 1995.Álzate, H., Patromonio y Deterioro Ambiental 1994 (in Spanish), Cali, Colombia: Controloria delValle, Division de Recursos Naturales y Medio Ambiente, 1994.Ankum, P., Flow Control in Irrigation and Drainage; Communications of the Water ManagementDepartment, Delft, The Netherlands: TU Delft, 1995.Aristazabal, H.F. and H. Zambrano, Estudio agroclimatico de la zona Juanchito -Guanabanal -Palmaseca (Thesis in Spanish), Cali, Colombia: Universidad del Valle, 1993.Arthur, J.P., Notes on the Design and Operation of Waste Stabilization Ponds in Warm Climatesof Developing Countries, Washington DC, USA: The World Bank, 1983.Asano, T., R.G. Smith and G. Tchobanoglous, "Municipal Wastewater: Treatment and ReclaimedWater Characteristics" in Irrigation with Reclaimed Municipal Wastewater - A Guidance Manual,pp 2.1-2.26, eds G.S. Pettygrove and T. Asano, Chelsea, USA: Lewis Publishers, Inc., 1985.Ayers, R.S. and D.W. Westcot, Water Quality for Agriculture; FAO Irrigation and DrainagePaper, no. 29, Rome, Italy: Food and Agriculture Organization of the United Nations, 1985.Banguero, H. and C. Castellar, La Población de Colombia 1938-2025 (in Spanish), Cali,Colombia: Centro Editorial Universidad del Valle, 1993.Benitez, E., Evaluación hidráulica y económica de politubulares con orifices para riego porsurcos en caña de azúcar (Thesis in Spanish), Palmira, Colombia: Universidad del Valle/Universidad Nacional, 1994.Bergmann, H. and J.M. Boussard, Guide to the Economie Evaluation of Irrigation Projects, Paris,France: Organisation of Ecomonic Cooperation and Development, 1976.Bocanegra, L.F., and J.C. Giraldo, Disponibilidad de aguapara riego y lavado de suelos en elsector Frayle -Amaine (Thesis in Spanish), Palmira, Colombia: Universidad del Valle, 1989.Bos, M.G., Discharge Measurement Structures, Wageningen, The Netherlands, ILRI, 1978.Brix, H., "Wastewater Treatment in Constructed Wetlands: System Design, Removal Processes,and Treatment Performance", in Constructed Wetlands for Water Quality Improvement, pp 9-21,ed G.A. Moshiri, Boca Raton, USA: Lewis Publishers, 1993.Brix, H., "Functions of Macrophytes in Constructed Wetlands", in IA WQ Water Science andtechnology, Volume 29, no.4, pp 71-78,1994.Broadbent, F.A., and H.M. Reisenauer, "Fate of Constituents in Soil and Groundwater: Nitrogenand Phosphorus", in Irrigation with Reclaimed Municipal Wastewater - A Guidance Manual, pp12.1-12.16, eds G.S. Pettygrove and T. Asano, Chelsea, USA: Lewis Publishers, Inc., 1985.Brouwer, R., F18 Irrigatie (Lecture Notes in Dutch), Delft, The Netherlands: Delft University ofTechnology, 1993.Brown, D.S., "Constructed wetlands in the USA", in Water Quality International, Volume 4-1994,pp 24-28, 1994.Brown, D.S. and S.C Reed, "Inventory of Constructed Wetlands in the United States", in IA WQWater Science and technology, Volume 29, no.4, pp 309-318, 1994.Caraval. Y., and D. Marmolejo, Evaluación de la efficiencia de almacenamiento y conducción deagua para fines de riego en la zona Palmira - Bolo - Fraille (Thesis in Spanish), Cali, Colombia:Universidad del Valle, Facultad de Ingeniería, 1989.Carter, CE., and C.R. Camp, "Yield increase needed to justify subsurface drainage in sugarcanefields", In Journal of the American Society of Sugarcane Technologists, Florida and LouisianaDivisions, Volume 14, pp 25-32, 1994.Castaño, F., "La Silvicultura de la Guadua en Colombia; Reforestacion - Aprovechamiento", inMemorias del primero congreso mundial de bambú/guadua (in Spanish), pp 69-72, Pereira,Colombia: CARDER, 1993.Chambers, J.M. and A. J. McComb, "Establishing wetlands plants in artificial systems", ialAWQWater Science and technology, Volume 29, no.4, pp 79-84, 1994.CONE (Consejo Departamental de Estadistica), Anuario Estadístico del Valle de Cauca 1994
97

(statisticalyearbook in Spanish), Cali, Colombia: CONE, 1995.Cooper, P.F., " The use of Reed Bed systems to treat domestic sewage: The European Design andOperation Guidelines for Reed Bed Treatment Systems.", in Constructed Wetlands for WaterQuality Improvement, pp 203-217, ed G.A. Moshiri, Boca Raton, USA: Lewis Publishers, 1993.Crítes, R.W., "Design Criteria and Practice for Constructed Wetlands", in IA WQ Water Scienceand technology, Volume 29, no.4, pp 1-6, 1994.Crook, J., "Health and Regulatory Considerations", in Irrigation with Reclaimed MunicipalWastewater - A Guidance Manual, pp 10.1-10.49, eds G.S. Pettygrove and T. Asano, Chelsea,USA: Lewis Publishers, Inc., 1985.Craickshank, J.G., Soil Geography, Newto Abbot, Great Brittain: David and Charles Ltd, 1972.Cruz Rios, H., La Guadua: nuestro bambú (in Spanish), Armenia, Colombia: CRQ/CentroNacional para el estudio del bambú/guadua, 1994.Cruz, R., R.D. Lemos, and A. Valdes, Uso de Politubulares en riego por Surcos en Caña deAzúcar (in Spanish), Cali, Colombia: CENICAÑA, 1995.Cruz, R., "Drenajes", in El cultivo de la Caña en la zona azucarera de Colombia (in Spanish), pp211-233, Cali, Colombia: CENICAÑA, 1995.Culp, G., and D. Hinrichs, "Design factors for the rapid infiltration, overland flow, and slow rateirrigation wastewater land application systems, in Municipal Wastewater in Agriculture, pp 389-426, eds: D'Itri, F.M., J.A. Martinez and M.A. Lámbarri, New York, USA: Academic Press, 1981.CVC (Corporation Autónoma Regional del Valle de Cauca), Estudio Semi Detallado de suelos delValle geográfico del rio Cauca (in Spanish), Bogota, Colombia: CVC, 1980.CVC (Corporation Autónoma Regional del Valle de Cauca), Acuerdo numero CD. 16 de 1995 (inSpanish), Cali, Colombia: CVC, 1995.CVC (Corporation Autónoma Regional del Valle de Cauca), Acuerdo numero 14 de 23 Noviembre1976 (in Spanish), Càli, Colombia: CVC, 1976.D'Itri, F.M., J.A. Martínez and M.A. Lámbarri (eds), Municipal Wastewater in Agriculture, NewYork, USA: Academic Press, 1981.Dean, R.B. and E. Lund, Water Reuse; Problems and Solutions, Copenhagen, Denmark:Academic Press, 1981.Departemento Nacional de Planeacion, Plan de Agua 1995-1998; Acueducto y Alcantarillado,documento CONFES 2767 (in Spanish), Bogota, Colombia: Ministerio de Desarollo Económico,1995.DGIS, Environmental Impact Assessment in Developing Cooperation, The Hague, TheNetherlands: Ministery of Foreign Affairs of the Netherlands, Directorate General of InternationCooperation, 1990.DICWSD, "The Dublin Statement on Water and Sustainable Development" in Waterlines, Volume10, no 4, pp 3-5, 1992.Doorenbos, J. and A.H. Kassam, Yield Response to Water, Rome, Italy: Food and AgriculturalOrganization of the United Nations, 1986.Edwards, P., Reuse of Human Wastes in Aquaculture; A technical Review, Washington DC, USA,The World Bank, 1992.Eger, P., "Wetland treatment for trace metal removal from mine drainage: the importance ofaerobic and anaerobic processes", in IA WQ Water Science and technology, Volume 29, no.4, pp249-256, 1994.FAO/UNESCO, Irrigation, drainage and salinity, Rome, Italy: United Nations Food andAgricultural Organization, 1973.Feachem, R.G., D. J. Bradley, H. Garelick and D.D. Mara, Sanitation and Disease; Health Aspectsof Excreta and Wastewater Management, World Bank Studies in Water Supply and Sanitation,no.3, World Bank, 1983.Foth, H.D., Fundamentals of Soil Science (sixth edtion), New York, USA: John Willey and Sons,Inc, 1978.Gonzales, C.A., R.E. Mora and L.E. Narvaez, Evaluación de un sistema de drenaje internoentubado en la hacienda "La Italia" (Thesis in Spanish), Palmira, Colombia: Universidad delValle, 1982.
98

Guzman, M., Cali en chifras 1995; documento 11-95 (in Spanish), Cali, Colombia: Departamentode Publicaciones, Municipio de Cali, 1995.Hammer, D.A. and R.K. Bastían, "Wetlands Ecosystems: Natural Water Purifiers?", inConstructed Wetlands for Wastewater Treatment; Municipal, Industrial and Agricultural, pp 5-19,ed. D.A. Hammer, Chelsea, Michigan, USA: Lewis Publishers, 1989.Hespanhol, I., and A.M.E. Prost, "WHO guidelines and National Standards for reuse and WaterQuality", Water Resources, Volume 28, No. 1, pp 119-124,1994.Hillel, D. The efficient use of water in irrigation: principles and practices for the improvingirrigation in arid and semiarid regions, Washington DC, USA: The World Bank, 1987.Hillman, W.S., and D.D. Culley, "The uses of duckweed" in American Scientist, 66-442-51, 1978.Huckin, T.N., Technical Writing and Professional Communication for Nonnative Speakers ofEnglish, New York, USA: McGraw-Hill, 1991.Immerzeel, W.H.M. van, "Field irrigation training in the Peruvian Andes", in Waterlines, Vol. 9,no. 4, pp 17-18, 1991.Ingenieros Consultaros Ltda and Incol Ltda, Diseño de la planta de tratamiento piloto del lasaguas residuales de Ginebra - Valle, II etapa (Design in Spanish), Cali, Colombia: unpublished,1990.IRC (International reference centre for community water supply and sanitation), Slow sandfiltration for community water supply: planning, design, construction, operation andmaintenance, technical paper no.24, The Hague, The Netherlands: IRC, 1987.Jones, C.A., L.T. Santo, G. Kingston and G.J. Gascho, "Sugarcane" in Irrigation of AgriculturalCrops, pp 835-858, eds B.A. Stewart and D.R. Nielsen, Madison, WI, USA: American Society ofAgronomy Inc, 1990.Juanico, M., "A database for a multi-institutional environment monitoring program" inEnvironmental Monitoring and Assessment, Volume 12, pp 181-190, 1989.Kadlec, R.H., "Hydrologie factors in wetland water treatment", in Constructed WestlandsforWastewater Treatment; Municipal, Industrial and Agricultural, pp 21-39, ed. D.A. Hammer,Chelsea, Michigan, USA: Lewis Publishers, 1989.Kadlec, R.H., and J.T. Watson, "Hydraulics and Solids accumulation in a gravel bed treatmentwetland", in Constructed Wetlands for Water Quality Improvement, pp 227-236, ed G.A. Moshiri,Boca Raton, USA: Lewis Publishers, 1993.King, H.C., CO. Wisler, and J.G. Woodburn, Hidráulica (in Spanish), Mexico D.F., Mexico:Trillas, 1980.Koles, S.M., R.J. Petrell and L.O. Bagnal, "Duckweed, culture for reduction of ammonia,phosphorus and suspended solids from algal rich water" in Aquatic Plants for water treatment andresource recovery, pp 18-12, eds. K.R. Reddy and W.H. Smith, Wahington, USA: MagnoliaPublishing Inc, 1987.Liese, W., Bamboos; Biology, silvics, properties, utilization, Eschborn, Germany: DeutscherGesellschaft fur Technische Zusammenarbeit GmbH, 1985.Lloyd, R.P., The Recovery of Helminth Eggs from Wastewater Using the Modified BailengerMethod (thesis), Leeds, GB: University of Leeds, Department of Civil Engineering, 1995.Londoño, X., "Taxonomía de los Bambúes del nuevo mundo con énfasis en el género guadua", inMemorias del primero congreso mundial de bambú/guadua; pereira, agosto 8-15 de 1992 (inSpanish), pp31-34, Pereira, Colombia: CARDER, 1993.Mara,D., and S.W. Mills, "Who's afraid of anaerobic ponds?", in Water Quality International, 2-1994, pp 34-37, 1994.Mara, D., "Faecal Coliforms - everywhere (but not a cell to drink)", in Water Quality International,3-1995, pp 29-30, 1995.Mara, D.D., G.P. Albaster, H.W. Pearson and S.W. Mills, Wastewater stabilisation ponds; adesign manual for Eastern Africa, Leeds, GB: Lagoon Technology International Ltd, 1992.Metcalf & Eddy: Wastewater Engineering: Treatment, Disposal, and Reuse. New York, USA:McGraw-Hill, Inc., 1991.Moshiri, G.A., Constructed Wetlands for Water Quality Improvement, Boca Raton, USA: LewisPublishers, 1993.
99

National Technical Advisory Commitee to the Secretary of the Interior, Water Quality Criteria,Washington, USA: US Environmental Protection Agency, 1972.Nitogoi, Preliminar Design Report for Cañaveralejo Wastewater Treatment Plant; Activity no. 3,Cali, Colombia: Nitogoi, 1990.Nouer, B.N., P.H. Woods, and B.J. Ross, "Case studies of wetland filtration of mine waste waterin constructed and naturally occurring systems in Northern Australia" in IAWQ Water Science andtechnology, Volume 29, no.4, pp 257-265, 1994.Ortegon, A., Estudio de Salinidad y Drenaje Agrícola (in Spanish), Cali, Colombia: CVC, 1986.Osborne, P.L. and R.G. Tptome, "Long-term impacts of sewage effluent disposal on a tropicalwetland", in JAWQ Water Science and technology, Volume 29, no.4, pp 111-117, 1994.Oster, J.D. and J.D. Rhoades, "Water Management for Salinity and Sodicity Control" in Irrigationwith Reclaimed Municipal Wastewater-A Guidance Manual, pp 7.1-7.19, eds G.S. Pettygroveand T. Asano, Chelsea, USA: Lewis Publishers, Inc., 1985.Page, A.L. and A.C. Chang, "Fate or Wastewater Constituents in Soil and Groundwater: TraceElements", in Irrigation with Reclaimed Municipal Wastewater - A Guidance Manual, pp 13.1-13.16, eds G.S. Pettygrove and T. Asano, Chelsea, USA: Lewis Publishers, Inc., 1985a.Page, A.L. and A.C. Chang, "Fate or Wastewater Constituents in Soil and Groundwater: TraceOrganics", in Irrigation with Reclaimed Municipal Wastewater - A Guidance Manual, pp 15.1 -15.20, eds G.S. Pettygrove and T. Asano, Chelsea, USA: Lewis Publishers, Inc., 1985b.Peña, M.R., Waste stabilization ponds for small urban communities in Colombia (Thesis), Leeds,GB: University of Leeds, Department of Civil Engineering, 1995.Pescod, M.B., and D.D. Mara, "Design, operation and maintenance of wastewater stabilizationponds", in Treatment and Use of Sewage Effluent for Irrigation, Eds M.B. Pescod and A. Arar, pp93-115, London, UK: Butterworths, 1988.Pescod, M.B., and A. Arar (eds.): Treatment and Use of Sewage Effluent for Irrigation. London,UK: Butterworths, 1988.Pettygrove, G.S., and T.Asano (eds): Irrigation with Reclaimed Municipal Wastewater-AGuidance Manual. Chelsea, USA: Lewis Publishers, Inc., 1985.Philipp, O., W. Koch and H. Kõsser, Utilization and control of water hyacinth in Sudan,Eschborn, Germany: Deutsche Gesellschaft fîir Technische Zusammenarbeit GmbH, 1983.Plusquellec, H., C. Burt and H.W. Wolter, Modern water control in irrigation; concepts, issuesand applications, Washington DC, USA: The World Bank, 1994.Reddy, K.R. and W.F. De Busk, "Nutrient removal potential of selected aquatic macrophytes", inJournal of Environmental Quality, Volume 14, no.4, pp 459-462, 1985.Reed, S.C., R.W. Crites and E.J. Middlebrooks, Natural Systems for Waste Management anTreatment (second edition), New York, USA: McGraw-Hill, Inc., 1995.Reed, S.C. Natural systems for Wastewater Treatment, Manual of Practice FD-16, Alexandria,USA: Water Pollution Control Federation, 1990.Republica de Colombia Ministerio de Salud, Disposiciones Sanitarias Sobre Agua; Discreto 1594del 26 Junio de 1984 (in Spanish), Bogota, Colombia: Ministerio de Salud, 1984.Rhoades, J.D. and J. Loveday, "Salinity in Irrigated Agriculture" in Irrigation of AgriculturalCrops, pp 1089-1142, eds B.A. Stewart and D.R. Nielsen, Madison, WI, USA: American Societyof Agronomy Inc, 1990.Rivera, F., A. Warren, E. Ramirez, O.Decamp, P.Bonilla, E.Gallegos, A. Calderón and J.Trinidad,"Removal of pathogens from wastewaters by the root zone method (RZM)", m IAWQ WaterScience and Technology, Volume 32, no.3, pp 211-218, 1995.Rumney, G.R., Climatology and the World's Climates, Toronto, Canada: The MacmillanCompany, 1967.Sapkota, D.P., and H.J. Bavor, "Gravel media filtration as a constructed wetland component forthe reduction of suspended solids from maturation pond effluent", in IAWQ Water Science andtechnology, Volume 29, no.4, pp 55-66, 1994.Serageldin, I., Water Supply, Sanitation and Environmental sustainability; The financingchallenge, Washington DC, USA: The World Bank, 1994.Shainberg, I., and J.D. Oster, Quality of Irrigation Water, Bet Dagan, Israel: International
100

Irrigation Information Center, 1978.Shelef, G., M. Juanico, and M. Vikinsky, "Reuse of Stabilization Pond Effluent for Agriculturalirrigation in Israel", in IAWQ Water Science and technology, Volume 19, no. 12, pp 299-305,1987.Smith, R.G., J.L. Meyer, G.L. Dickey and B.R. Hanson, "Irrigation System Design", in Irrigationwith Reclaimed Municipal Wastewater ~ A Guidance Manual, pp 8.1-8.61, eds G.S. Pettygroveand T. Asano, Chelsea, USA: Lewis Publishers, Inc., 1985.Smith, R.J. "The distribution of Water from Rigid and layflat gated pipe", in Proceedings of the1990 Conference of the Australian Society of Sugarcane Technologists, pp 57-64, Brisbane,Australia: Watson Ferguson and Company, 1990.State of California Department of Health Services Sanitary Engineering Section, WastewaterReclamation Criteria, California Adminstrative Code Title 22, Division 4, Berkeley, USA: Stateof California, 1978.Telsch, B., M. Juanico, Y. Azov, I. Ben Harim and G. Shelef, "The clogging capacity of reclaimedwastewater: A new quality criterion for drip irrigation", va. IAWQ Water Science and Technology,Volume 24, no. 9, pp 123-131, 1991.Torres, J.S., Villegas, F., and R. Cruz, Alternative-furrow irrigation of sugarcane (manuscript),Cali, Colombia: CENICAÑA, 1995.Torres, J.S., and R. Cruz, El aforador RBC, una estructura sencilla para canales de riego, SerieDivilgativa no. 4 (in Spanish), Cali, Colombia: CENICAÑA, 1993.Torres, J.S., Villegas, F., and G. Ramirez, "Influencia de la Profundidad del nivel freactico en laproducción de Caña de Azúcar", en Congreso de la Sociedad Colombiana de técnico de la Cañade Azúcar, Memorias tomo 1 (in Spanish), pp 315-321, Cali, Colombia: Tecnicafla, 1990.Torres, J., "Riegos", in El cultivo de la Caña en la zona azucarera de Colombia (in Spanish), pp193-210, Cali, Colombia: CENICAÑA, 1995.Umali, D.L., Irrigation-induced Salinity; A growing problem for Development and theEnvironment; World Bank Technical Paper 215, Wahington DC, USA: The World Bank, 1993.United Nations Economic and Social Commission for Asia and the Pacific, Proceedings of thetenth Session of the Committee on Natural Resources, Water Resources Series No. 59, New York,USA: UN Publications, 1985.US Department of the interior, Conference in the matter of pollution of the South Plate RiverBasin in the State of Colorado, Proceedings Volume 1, Washington DC, USA: US Department ofthe Interior, 1966.Vakgroep Gezondheidstechniek en Waterbeheersing, Waterbeheersing (Lecture Notes in Dutch),Delft, The Netherlands: Delft University of Technology, 1993.Van der Graaf, J.H.J.M., N50; Behandeling van Afvalwater I (Lecture Notes in Dutch), Delft, TheNetherlands: Delft University of Technology, 1995a.Vroon, R. and B. Weller, Treatment of Domestic Wastewater in a Combined UASB-reactorDuckweed Pond System, Thesis 95-07 of Department of Environmental Technology, Wageningen,The Netherlands: Wageningen Agricultural University, 1995.Watson, J.T. and A. Hobson, "Hydraulic Design Considerations and Control structures forconstructed wetlands for wastewater treatment", in Constructed Westlandsfor WastewaterTreatment; Municipal, Industrial and Agricultural, pp 379-391, ed. D.A. Hammer, Chelsea,Michigan, USA: Lewis Publishers, 1989.Watson, J.T., S.C. Reed, R.H. Kadlec, R.L. Knight, and A.E. Whitehead, "PerformanceExpectations and loading rates for constructed wetlands" in Constructed Westlandsfor WastewaterTreatment; Municipal, Industrial and Agricultural, pp 319-351, ed. D.A. Hammer, Chelsea,Michigan, USA: Lewis Publishers, 1989.Whitehead, A.J., K.V. Lo and N.R. Bulley, "The effect of hydraulic retention time and duckweedcropping rate on nutrient removal from dairy barn wastewater", in Aquatic Plants for watertreatment and resource recovery, pp 12-18, eds. K.R. Reddy and W.H. Smith, Wahington, USA:Magnolia Publishing Inc, 1987.
101


APPENDICES

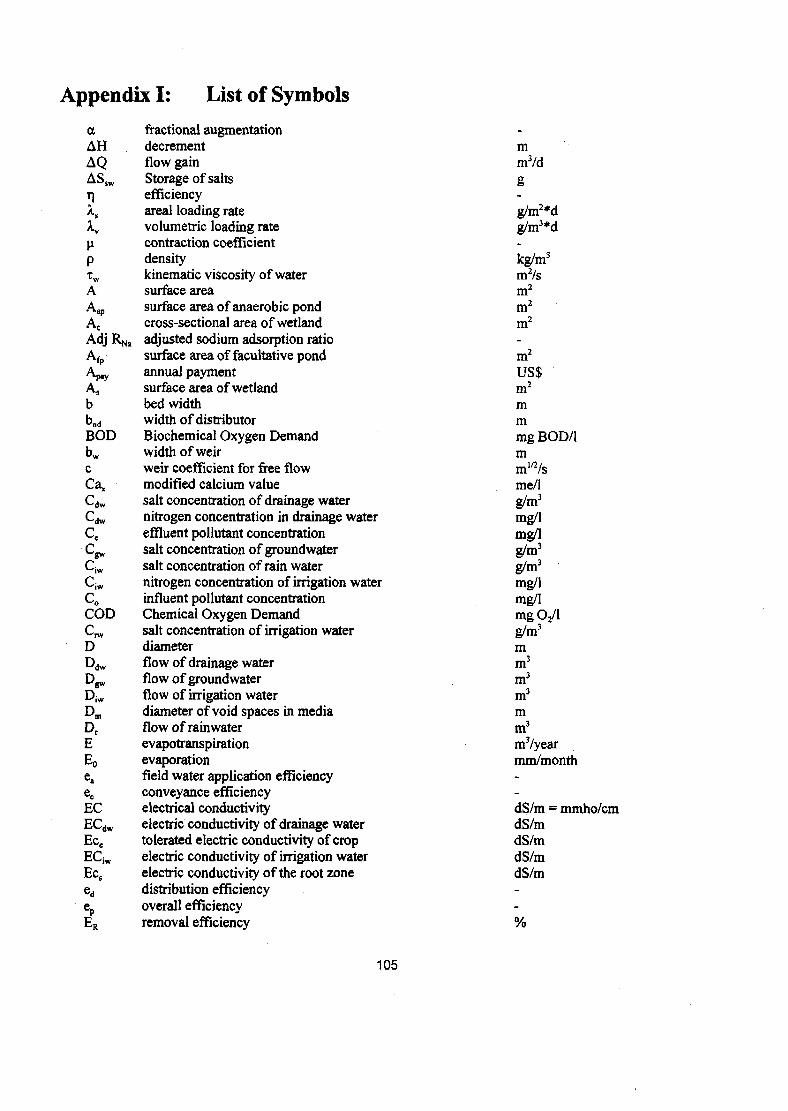
Appendix I: List of Symbols
oc fractional augmentationAH decrementAQ flow gainA S S W Storage of saltsX] efficiencyAs areal loading rateAv volumetr ic loading rateH contraction coefficientp densityTW kinematic viscosity of waterA surface areaA i p surface area of anaerobic pondAc cross-sectional area of wetlandAdj RNa adjusted sodium adsorption ratioAfp surface area of facultative pondAp,y annual paymentA s surface area of wetlandb bed widthbnd width of distributorB O D Biochemical Oxygen Demandbw width of weirc weir coefficient for free flowCa, modified calcium valueCdw salt concentration of drainage waterCdw nitrogen concentration in drainage waterCe effluent pollutant concentrationCg» salt concentration of groundwaterC iw salt concentration of rain water
nitrogen concentration of irrigation waterinfluent pollutant concentrationChemical Oxygen Demandsalt concentration of irrigation waterdiameterflow of drainage water
Dg,, flow of groundwaterD i w flow of irrigation waterDm diameter of void spaces in mediaD r flow of rainwaterE evapotranspirationEo evaporationea field water application efficiencyec conveyance efficiencyE C electrical conductivityECd w electric conductivity of drainage waterEc e tolerated electric conductivity of cropEC i w electric conductivity of irrigation waterEc s electric conductivity of the root zoneed distribution efficiencyep overall efficiencyER removal efficiency
C i w
CoCOD
DD,
dw
mm3/d
g
g/m2*dg/m3*d
kg/m3
m2/sm2
m2
m2
m2
US$ 'm2
mmmg BOD/1mm1/2/sme/lg/m3
mg/lmg/lg/m3
g/m3
mg/lmg/Img O2/lg/m3
mm3
m3
m3
mm3
m3/yearmm/month
dS/nrdS/mdS/mdS/mdS/m
: mmho/cm
105
fgHHDH,H,HLRH,HU^H U S W
k
k.
KKTLLFLRMgnNanp
NRNRPPosP™P e f f
"ower
QQoQcon
Qe
QinQin,
Q™'"tinin
QoU,Q,rRrzsSARSeSfSF in
S F 0 U t
s^s mS P
fraction of applied nitrogen removalgravityheadhuman dischargefriction head losslocal head losshydraulic loading ratetotal head losshuman use of groundwaterhuman use of surface waterlocal head loss coefficientfirst-order reaction rate constant at 20 °Ccrop coefficientnitrification rate constant at 20 °CStrickler roughness coefficienttemperature-dependent first-order reaction rate constantlengthleaching fractionleaching requirementmagnesium concentrationside slopesodium concentrationporosityReynolds numbernatural recharge of groundwaterprecipitation80% dependapble percipitationwetted perimetereffective percipitationpowerdischargeinfluent flowdischarge with continuous deliveryeffluent flowwater entering form other aquifersdischarge with intermittent flowdesign dischargeminimum dischargewater exiting to other aquifersdischarge of treatment systemreal interest ratehydraulic radiuspercent of bed depth occupied by root zonehydraulic gradientSodium Adsorption Rateamount of salt removed through cropsamount of salt added by agricultural chemicalssurface flow insurface water flow outstorage of groundwateramount of salt dissolved from minerals in the soilsamount of salt precipating into the soil after irrigationstorage of surface water
-9.81 m2/smmVyearmmm/daymmVyearmVyear-d"1
-d"1
m1/3/sd"1
m-mm/monthme/1-me/1--mVyearm3/yearmm/month
mmm/month
JmVsmVd1/smVdm3/year1/smVsmVsm3/year1/s.m-m/m
ggmVyearmVyearmVyear
ggmVyear
106
t hydraulic residence timeT temperaturet8 actual residence timeTDS Total Dissolved SolidsTN Total NitrogenTP Total PhosphorusTSS Total Suspended SolidsU nitrogen uptake by cropv velocityV i p volume of anaerobic pondVf field water requirementVn maximum irrigated volume for nitrogen controlVr volume of reservoirV, volume required for preplant irrigationW width of wetland cellWh net present valuey depthYold yield with unimproved irrigation scheme
d°Cdmg/1mg/1mg/1mg/1g/m2 * yearm/sm3
mm/yearm/yearm3
mm/monthmUS$mUS$/ha
107

108

Appendix II:ACUAVALLE
ASOCAÑACENICAÑACINARA
cvcIGACINGENIOEMCALINITOGOI
UNIVERSIDAD DEL VALLE
Organizations and AddressesRegional Public Works Department, responsible for wastewater treatment in theurban areas in the Valle de Cauca (except Cali)Columbian National Association of Sugarcane ProducersColumbian National Sugarcane Research InstituteInterregional Research Institute for Sanitary Engineering, attached to theUniversidad del ValleRegional Natural Resources BodyNational Topographic InstituteSugarcane factory, which also cultivates sugarcanePublic Works Department of Cali, responsible for wastewater treatmentConsortium of Engineering Consultancy, which made the design of theCañaveralejo plantState University of the Valle de Cauca Province
ADDRESSES
ASOCAÑATel. 6647902
CENICAÑATel. 6648025Fax. 6641936
CINARAUniversidad del Valle,A.A. 25157, CALITel: 3392345Fax: 3393289
CVCCarrera 56 con calle 10,CALITel. 3313737
EMCALITel. 883401 ext 1700Tel. 6637476 or 6637477
IGACCarrera 13 con calle 6,CALI
INGENIO MANUELITATel. 4443852
INGENIO TOMACOTel.(922)756951
INGENIO MAYAGÜEZTeL (922)648325 or 648262
NITOGOITeL 6684563
Ing. Jorge Torres PhD (Head Irrigation Department)Ing. Ricardo Cruz (Irrigation Engineer)
Ms. Ing. Inez Restrepo (Sanitary Engineer)Ing. Miguel Peia (Sanitary Engineer)
Ing. Carlos Escobar (Water Resources)Ing. Omar AKunttr, Ing. Guillermo Medina (Croimdwater)Ing. Alvaro Calero (Salinity)Dr Wiliam Ospina (Climatology)Ms. Amparo Duque (Environmental Issues)
Ms. Ing. Elizabeth Mesa (Wastewater Treatment Planning)Ms. Ing. Yolanda Arboleda (Cañaveralejo Plant)
Dr. Jaime Gomez (Head Irrigation Department)
Ing. José Lara (Irrigation Engineer)
lug. Gustavo Medina (Irrigation Engineer)
Ing. Gilberto Sepulbeda (Sanitary Engineer)
UNIVERSIDAD DEL VALLEFacultad de Ingeniería,A.A. 25157, CALITel: 3392345
Ing Henry Jimenez, Ing Hernán Materon (Hydrologiste)
109

110

Appendix III: Water balance of the Valle de CaucaThe general forni of a water balance is "IN = OUT + STORAGE". By estimating all inward andoutward factors of a water balance, the storage can be calculated. Two water balances are made: asurface water balance and a groundwater balance for the most superficial aquifer.
Surface Water balance of the Valle de CaucaThe inflows in the Valle de Cauca are precipitation, surface flow, and human discharges. The outwardflow consists of evapotranspiration, surface flow, human use, and the natural recharge of groundwater.The storage should equal zero for an average year. The surface water balance can be written as:
P +. SFin + HD = E + SF0Ut + HUSW + NR ± Ssw
where: P - Precipitation [mVyear];Sfjn = Surface flow in [mVyear];HD = Human discharge [mVyear];E = Evapotranspiration [mVyear];Sfout = Surface water flow out [mVyear];HUSW - H u m a n use of surface water [mVyear] ;N R = Natural recharge o f groundwater [mVyear];Ssw = Storage o f surface water [mVyear];
Precipitation (P) varies greatly with alti tude, between 1000 and 4000 m m per year. By multiplyingprecipitation data o f the various altitudes with the surface areas the annual vo lume of rainfall can becalculated. In the low value average rainfall is 1200mm, on the med ium slopes o f the mounta ins it is1800 m m , the higher slopes 2 5 0 0 m m and at the tops 3000 mm.
I * A ) = 1 . 2 x 4 . 1 * 109 + 1.8 x 7.1 * 109 + 2.5 x 2.3 * 1 0 9 + 3 . 0 x 1.1 * 1 0 9 = 26.8 * 1 0 9 m 3
The inward surface flow (SFin) only consists of the discharge of the Cauca river where it enters thegeographical Valle de Cauca at Balsa, because no water enters through the orders borders of thegeographical Valle de Cauca, which is the basin of the Cauca rivers. Average discharge is 193 mVs, soSFin = 6.1 * 109m3.
Human discharge (HD) is the domestic, industrial and agricultural wastewater drained to surface water.The domestic discharges can be estimated from the installed and planned wastewater treatmentcapacity: in Cali this is nearly 10 mVs, this accounts for more than half of the population in the Valle deCauca, estimate for the complete population is 18 mVs. Industrial are partly taken into account in thedomestic resources, but there are industries with there own water supply and discharge. Industrial wateris in the Valle de Cauca is 12 mVs, of which probably 30% will be discharged into municipal sewersystems. It is assumed here that all irrigation water either evapotranspirates or percolates to thegroundwater. The human discharge is the discharge available for reuse.HD = 5.68 * 108 + 3.78 * 10s x 0.7 = 0.83 * 109 m3
Evapotranspiration (E) can be calculated using evaporation (1300 mm/year) and crop factors forvarious land uses. Meadows (1^=0.8), woods (k,. = 0.86), cafe cultivation (k̂ - 0.80), sugarcanecultivation (k, = 0.8), other crops (1^=0.8), urban development (k,. =1) and open water surface make upmost of the surface area of the Valle de Cauca. Evapotranspiration is calculated by adding up themultiplications of crop factors, surface areas and evaporation:E = y k*A)*E
= (0-8 * Aroeid0Ts + 0.86 * Awoods + 0.80 • ASUfmtat + 0.8 * Aottocrops + 1.0 • A ^ + A ^ ) * 1,300= (0.8 *1.56 + 0.86 * 7.19 + 0.80 * 1.63 + 0.8 * 4.10 + 1.0 * 0.20 + 0.03) * 109 *1.300= 12.25 * 109 *1.300 = 15.9 * 109 m3.
111
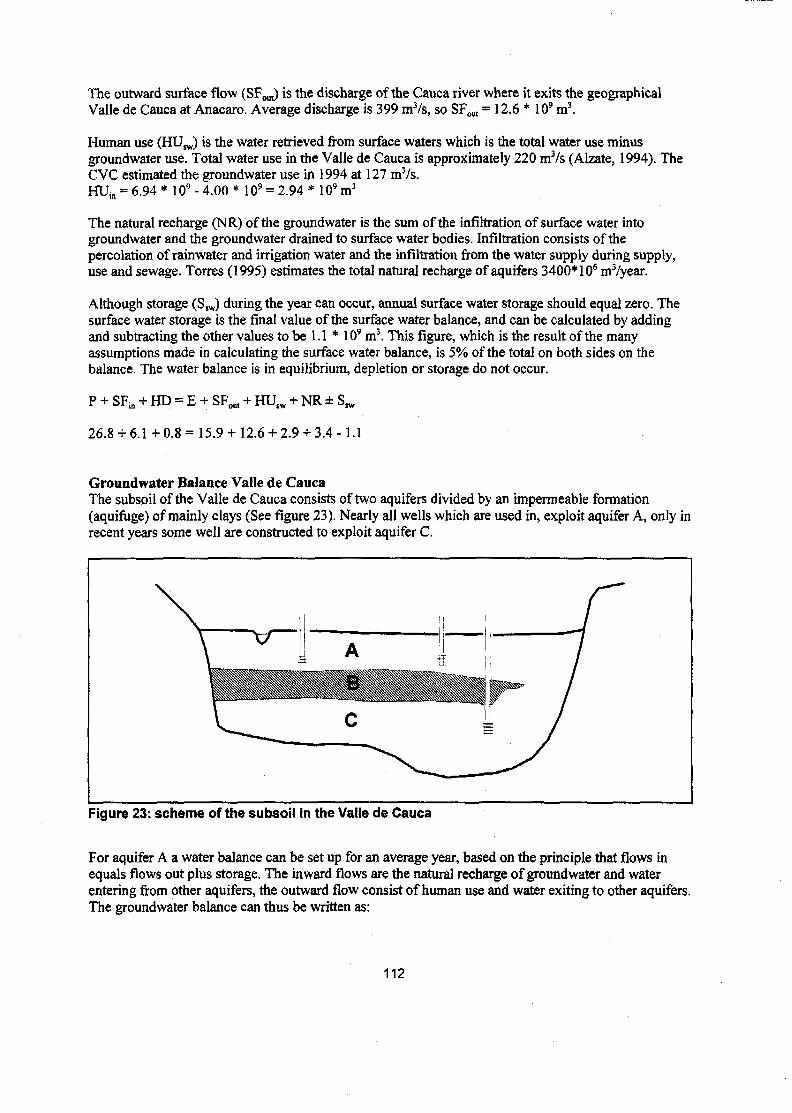
The outward surface flow (SFout) is the discharge of the Cauca river where it exits the geographicalValle de Cauca at Anacaro. Average discharge is 399 mVs, so SF0Ut = 12.6 * 10* m3.
Human use (HUSW) is the water retrieved from surface waters which is the total water use minusgroundwater use. Total water use in the Valle de Cauca is approximately 220 mVs (Álzate, 1994). TheCVC estimated the groundwater use in 1994 at 127 mVs.HUm - 6.94 * 109 - 4.00 * 109 = 2.94 * 109 m3
The natural recharge (NR) of the groundwater is the sum of the infiltration of surface water intogroundwater and the groundwater drained to surface water bodies. Infiltration consists of thepercolation of rainwater and irrigation water and the infiltration from the water supply during supply,use and sewage. Torres (1995) estimates the total natural recharge of aquifers 3400* 106 m3/year.
Although storage (Ssw) during the year can occur, annual surface water storage should equal zero. Thesurface water storage is the final value of the surface water balance, and can be calculated by addingand subtracting the other values to be 1.1 * 109 m3. This figure, which is the result of the manyassumptions made in calculating the surface water balance, is 5% of the total on both sides on thebalance. The water balance is in equilibrium, depletion or storage do not occur.
P + SFto + HD = E + SF0Ut + HUSW + NR ± Sm
26.8 + 6.1+0.8=15.9 + 12.6 + 2.9 + 3.4-1.1
Groundwater Balance Valle de CaucaThe subsoil of the Valle de Cauca consists of two aquifers divided by an impermeable formation(aquifiige) of mainly clays (See figure 23). Nearly all wells which are used in, exploit aquifer A, only inrecent years some well are constructed to exploit aquifer C.
Figure 23: scheme of the subsoil in the Valle de Cauca
For aquifer A a water balance can be set up for an average year, based on the principle that flows inequals flows out plus storage. The inward flows are the natural recharge of groundwater and waterentering from other aquifers, the outward flow consist of human use and water exiting to other aquifers.The groundwater balance can thus be written as:
112

where: NR = Natural recharge of groundwater [mVyear];Qin = water entering form other aquifers [mVyear];Qout = water exiting to other aquifers [mVyear];HU^ = human use of groundwater [mVyear];Sg», = storage of groundwater [mVyear];
The natural recharge (NR) of the groundwater is the sum of the infiltration of surface water intogroundwater and the groundwater drained to surface water bodies. This is approximately 3.4 * 109 m3>
which is estimated for the surface water balance.
The water entering from other aquifers (Q¡J is negligible on an annual base (Martinez 1989).
The water exiting to other aquifers (Q¡J is negligible on an annual base (Martinez 1989).
The human use of groundwater (HUgJ is the amount of water pumped from wells. The CVC estimateda well capacity of 126,886 1/s in December 1994, so HU^ is 4.00 * 109 m3 per year.
In a system that is in balance the groundwater storage (SgJ should equal zero. The storage in thisgroundwater balance equals 0.4 * 109 m3 per year, which is 10% of the total at both sides. This caneither be a calculation error or a real negative groundwater storage factor, which indicates a slowdepletion of the groundwater resource.
3.4* 109 = 4.0*109 + 0.4* 109
There is a discussion whether aquifer A is in balance or overexploited. In dry years groundwater tablesdrop considerably, but in wet years most of this drop is compensated for. Data on groundwater tablesare only available from commercial wells, and records are especially short in water-plentiful lower partsof the Valle de Cauca. Based on the fairly short data series one can come to the following tentativeconclusions:
groundwater levels show a slight drop in the Valle de Cauca over the past 30 years;during dry years aquifer A are overexploited but most of the groundwater table drop iscompensated for in the wet years;the area of mayor concern is the area around Candelaria, where near all irrigation watercomes from wells. In this area there is a serious drop in groundwater tables.
113

LEGEND:
RISE OF GROUND WATER TABLE
FALL OF GROUND WATER TABLE
STUDY AREA
NOT TO SCALE
Figure 24: map of groundwater tables 87-94
114
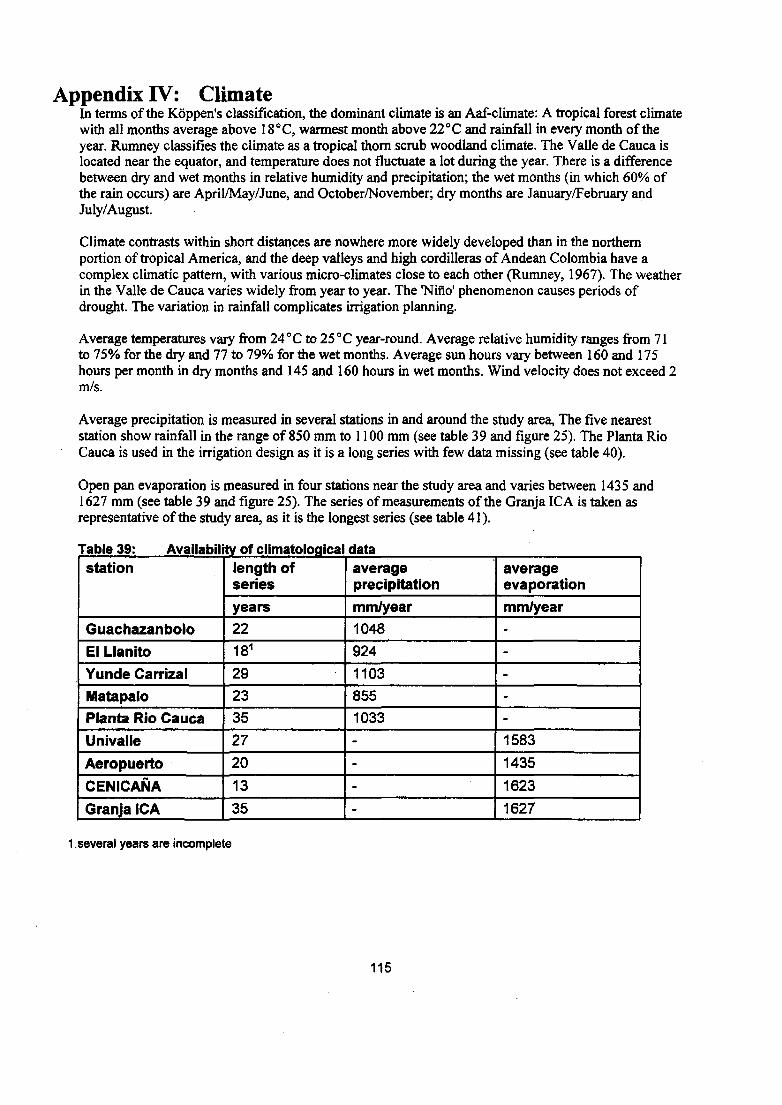
Appendix IV: ClimateIn terms of the Koppen's classification, the dominant climate is an Aaf-climate: A tropical forest climatewith all months average above 18°C, wannest month above 22°C and rainfall in every month of theyear. Rumney classifies the climate as a tropical thorn scrub woodland climate. The Valle de Cauca islocated near the equator, and temperature does not fluctuate a lot during the year. There is a differencebetween dry and wet months in relative humidity and precipitation; the wet months (in which 60% ofthe rain occurs) are April/May/June, and October/November; dry months are January/February andJuly/August.
Climate contrasts within short distances are nowhere more widely developed than in the northernportion of tropical America, and the deep valleys and high cordilleras of Andean Colombia have acomplex climatic pattern, with various micro-climates close to each other (Rumney, 1967). The weatherin the Valle de Cauca varies widely from year to year. The "Niño" phenomenon causes periods ofdrought. The variation in rainfall complicates irrigation planning.
Average temperatures vary from 24°C to 25°C year-round. Average relative humidity ranges from 71to 75% for the dry and 77 to 79% for the wet months. Average sun hours vary between 160 and 175hours per month in dry months and 145 and 160 hours in wet months. Wind velocity does not exceed 2m/s.
Average precipitation is measured in several stations in and around the study area, The five neareststation show rainfall in the range of 850 mm to 1100 mm (see table 39 and figure 25). The Planta RioCauca is used in the irrigation design as it is a long series with few data missing (see table 40).
Open pan evaporation is measured in four stations near the study area and varies between 1435 and1627 mm (see table 39 and figure 25). The series of measurements of the Granja ICA is taken asrepresentative of the study area, as it is the longest series (see table 41).
Table 39: Availability of climatological datastation
GuachazanboloEl Llanito
Yunde Carrizal
MatapaloPlanta Rio Cauca
Univalie
Aeropuerto
CENICAÑA
Granja ICA
length ofseries
years22
181
29
23
35
2720
13
35
averageprecipitation
mm/year
1048
924
1103855
1033-
-
-
-
averageevaporation
mm/year-
-
-
--
1583
1435
1623
1627
1 .several years are incomplete
115
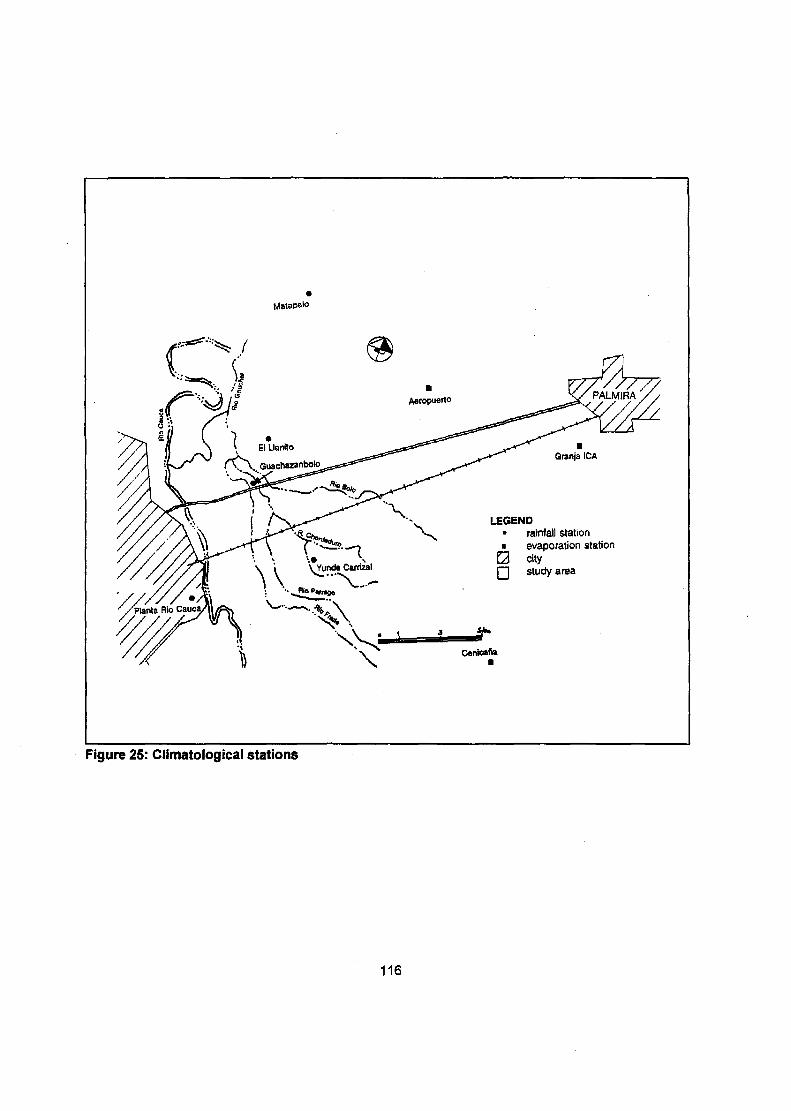
' • • •
\ V \Yunde Carrizal
LEGEND* rainfall station
evaporation stationcitystudy area
Cenicafla
Figure 25: Climatological stations
116
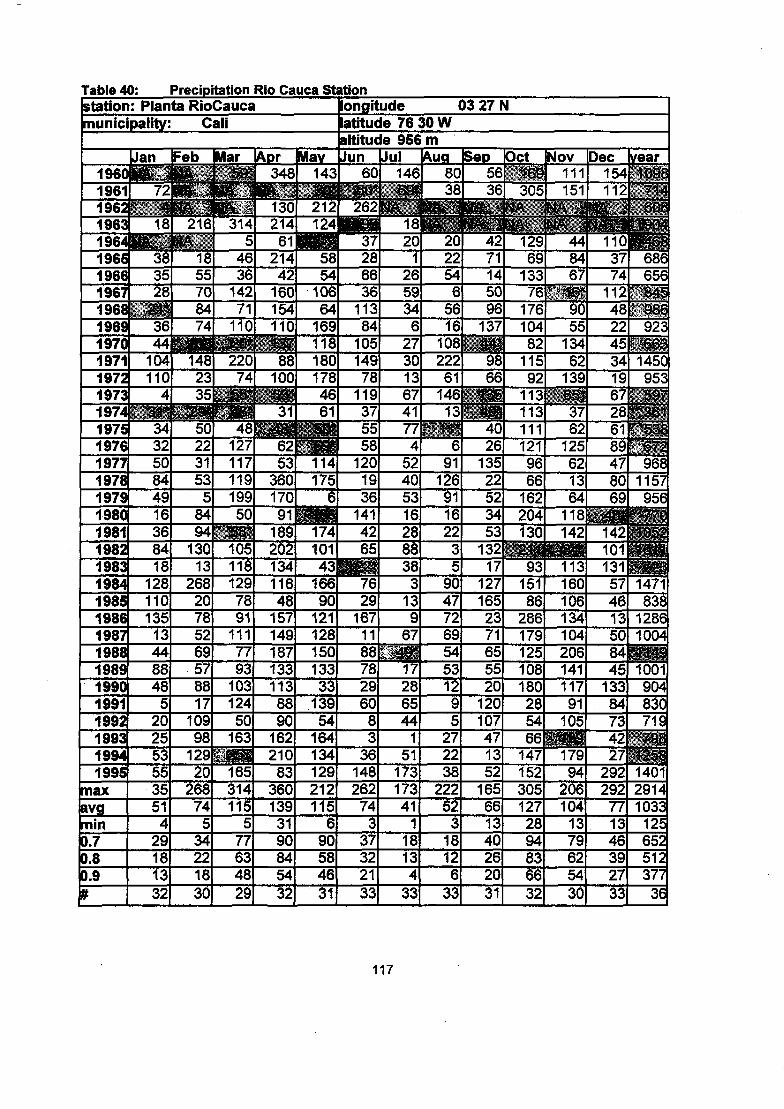
Table 40:station
Precipitation: Planta RioCauca
municipality: Cali
Rio Cauca Station
1960196119621963
1965196619671968196S19701971197;19731974197Í19761977197819791980198119821983198419851986198719881989199019911992199319941995
maxavgmm9.79.89.9*
Uan
| 72
18
383528
3644
104110
4
Hi343250844916368418
128110135
13448848
52025535535514
29181332
Feb21111
2161•¿ummm
1855708474
1482335
50223153
58494
13013
26820785269578817
10998
129120
26874
534221830
Mar
lEü
3145
4636
14271
ml220
74
4812711711919950
ÜÉÉI1051181297891
1117793
10312450
163Ü&HÉ
165314115
577634829
AprI 348
^ 3 0214
61214
42160154110
Ellis88
100
BUSH31
6253
36017091
18920213411648
1571491871331138890
162210
833601393190845432
May| 143
[212M24¿KM
5854
10664
1691181801784661
PiiSi114175
6
17410143
16690
12112815013333
13954
164134129212115
690584631
ongitude 03 27 Isiatitude 76 30 Waltitude 956 mlun
60Jul
146Aun ISep
80 56¡iifcKii Ills e,: ; ̂ B&] ^K>r 262
37286636
11384
10514978
119375558
1201936
1414265
7629
1671188782960
83
36148262
743
37322133
M2ÈÊÊMÉÊÊ1ÍSÊ
20 201 22
265934
6273013674177
452405316288838
3139
67
546
5616
4271145096
1371081;.. M5222 98
61 66
i3niiIHO 40
6 2691
126911622
35
90477269
Ü É 5417 53286544
151
17317341
118134
33
1295
272238
22252
318126
33
13522523453
13217
1271652371655520
120107471352
165661340262031
üc t
305N A ••
12969
13376
17610482
11592
1131131111219666
162204130
Mê93
15186
286179125108180285466
1471523051272894836632
slov111151
MA -Mv . . . . • • • • £NA ;;
448467
9055
13462
139
3762
125621364
118142
11316010613410420614111791
105
17994
206104
1379625430
Dec154112
1103774
¡year
7ÍÈ[;. Dlfl
M686656
112MK482245341967286189478069
142101131574613508445
13384734227
292292
771346392733
\ 923itÉÉB
145C953
PB968
1157956
WÈBBillSEP
1471838
12861004
100190483C71Î
liu14012914103c
12'652512377
36
117
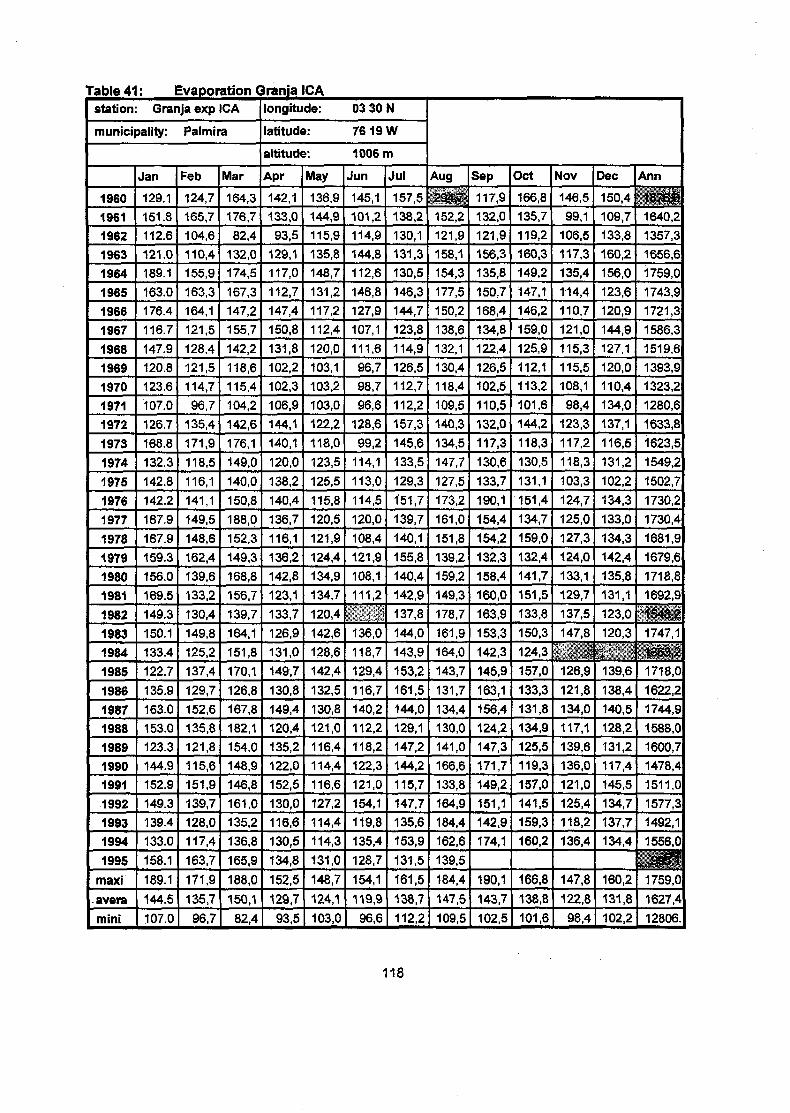
Table 4'station
: Evaporation GranjaGranja exp
municipality:
ICA
Palmira
1960
1961
1962
1963
1964
1965
1966
1967
1968
1969
1970
1971
1972
1973
1974
1975
1976
1977
1978
1979
1980
1981
1982
1983
1984
1985
1986
1987
1988
1989
1990
1991
1992
1993
1994
1995
maxiavera
mini
Jan
129.1
151.8
112.6
121.0
189.1
163.0
176.4
116.7
147.9
120.8
123.6
107.0
126.7
168.8
132.3
142.8
142.2
167.9
167.9
159.3
156.0
169.5
149.3
150.1
133.4
122.7
135.9
163.0
153.0
123.3
144.9
152.9
149.3
139.4
133.0
158.1
189.1
144.5
107.0
Feb
124,7
165,7
104,6
110,4
155,9
163,3
164,1
121,5
128,4
121,5
114,7
96,7
135,4
171,9
118,5
116,1
141,1
149,5
148,6
162,4
139,6
133,2
130,4
149,8
125,2
137,4
129,7
152,6
135,8
121,8
115,6
151,9
139,7
128,0
117,4
163,7
171,9
135,7
96,7
Mar
164,3
176,7
82,4
132,0
174,5
167,3
147,2
155,7
142,2
118,6
115,4
104,2
142,6
176,1
149,0
140,0
150,8
188,0
152,3
149,3
168,8
156,7
139,7
164,1
151,8
170,1
126,8
167,8
182,1
154,0
148,9
146,8
161,0
135,2
136,8
165,9
188,0
150,1
82,4
CAlongitude:
latitude:
altitude:
Apr
142,1
133,0
93,5
129,1
117,0
112,7
147,4
150,8
131,8
102,2
102,3
106,9
144,1
140,1
120,0
138,2
140,4
136,7
116,1
136,2
142,8
123,1
133,7
126,9
131,0
149,7
130,8
149,4
120,4
135,2
122,0
152,5
130,0
116,6
130,5
134,8
152,5
129,7
93,5
May
136,9
144,9
115,9
135,8
148,7
131,2
117,2
112,4
120,0
103,1
103,2
103,0
122,2
118,0
123,5
125,5
115,8
120,5
121,9
124,4
134,9
134,7
120,4
142,6
128,6
142,4
132,5
130,8
121,0
116,4
114,4
116,6
127,2
114,4
114,3
131,0
148,7
124,1
103,0
03 30
7619
N
W
1006 m
Jun
145,1
101,2
114,9
144,8
112,6
146,8
127,9
107,1
111,6
96,7
98,7
96,6
128,6
99,2
114,1
113,0
114,5
120,0
108,4
121,9
108,1
111,2
ii3136,0
118,7
129,4
116,7
140,2
112,2
118,2
122,3
121,0
154,1
119,8
135,4
128,7
154,1
119,9
96,6
Jul
157,5
138,2
130,1
131,3
130,5
146,3
144,7
123,8
114,9
126,5
112,7
112,2
157,3
145,6
133,5
129,3
151,7
139,7
140,1
155,8
140,4
142,9
137,8
144,0
143.9
153,2
161,5
144,0
129,1
147,2
144,2
115,7
147,7
135,6
153,9
131,5
161,5
138,7
112,2
Aug:2ÉÉf152,2
121,9
158,1
154,3
177,5
150,2
138,6
132,1
130,4
118,4
J09.5140,3
134,5
147,7
127,5
173,2
161,0
151,8
139,2
159,2
149,3
178,7
161,9
164,0
143,7
131,7
134,4
130,0
141,0
166,6
133,8
164,9
184,4
162,6
139,5
184,4
147,5
109,5
Sep
117,9
132,0
121,9
156,3
135,8
150,7
168,4
134,8
122,4
126,5
102.5
110,5
132,0
117,3
130,6
133,7
190,1
154,4
154,2
132,3
158,4
160,0
163,9
153,3
142,3
145,9
163,1
156,4
124,2
147,3
171,7
149,2
151,1
142,9
174,1
190,1
143,7
102,5
Oct
166,8
135,7
119,2
160,3
149,2
147,1
146,2
159,0
125,9
112,1
113,2
101,6
144,2
118,3
130,5
131,1
151,4
134,7
159,0
132,4
141,7
151,5
133,8
150.3
124,3
157,0
133,3
131,8
134,9
125,5
119,3
157,0
141,5
159,3
160,2
166,8
138,8
101,6
Nov
146,5
99,1
106,5
117,3
135,4
114,4
110,7
121,0
115,3
115,5
108,1
98,4
123,3
117,2
118,3
103,3
124,7
125,0
127,3
124,0
133,1
129,7
137,5
147,8
* .«2a126,9
121,8
134,0
117,1
139,6
136,0
121,0
125,4
118,2
136,4
147,8
122,8
98,4
Dec
150,4
109,7
133,8
160,2
156,0
123,6
120,9
144,9
127,1
120,0
110,4
134,0
137,1
116,5
131,2
102,2
134,3
133,0
134,3
142,4
135,8
131,1
123,0
120,3
§<!:!139,6
138,4
140,5
128,2
131,2
117,4
145,5
134,7
137,7
134,4
160,2
131,8
102,2
Ann
1640,2
1357,3
1656,6
1759,0
1743,9
1721,3
1586,3
1519,6
1393,9
1323,2
1280,6
L L 6 3 3 , 8
1623,5
1549,2
1502,7
1730,2
1730,4
1681,9
1679.6
1718,8
1692,9
1747,1
SUP1718,0
1622,2
1744,9
1588,0
1600,7
1478,4
1511,0
1577,3
1492,1
1556,0
iSii1759,0
1627,4
12806.
118

Appendix V: Soils and Land CapabilityIn the Valle de Cauca alluvial deposits are scattered in narrow, irregular strips bordering the riverCauca and other streams. Four soil types (Juanchito soils, Marruecos soils, Gudualito soils, andCorintias soils) dominate the Juanchito-Guanabanal-Palmaseca area, they can be classified in threeorders, according to the USDA soil taxonomy: mollisols, vertisols, entisols (see table 42 and figure 26).Juanchito and Corintias soils are located in the fioodplains, the lower areas in which the silt settles, withpoor natural drainage. The ridges formed along river banks, consist of coarser textured parentalmaterial, like Marruecos and Gudualito soils (Cruickshank, 1972; Foth, 1978; CVC, 1980; Aristazabal,1993). The area is flat, slopes are between 0 and 3%. There are no erosion problems. The depth of thegroundwater table ranges from 50 cm to 200 cm.
Table 42: Soil types
JuanchitoCorintias
soil type
Marruecos
order
entisols
vertisols
mollisols
mollisols
basic infiltration rate (mm/hour)4.611.1
1.12
LEGEND:JNa = JuanchitoMNa = MarruecosGUa - GuchualitoJNaNaS = Juanchito affected by salts & sodiumGUaS = Guachualito affected by salts
n soo 1000 1500 2000 m
scale 1 :50,000
Figure 26: Soil types in Juanchito-Guanabanal-Palmaseca area
119
Juanchito soils are superficial to very superficial soils which can be classified as entisols. Entisols arerecent mineral soils, with no distinct horizons within 1 meter of the soil surface, consisting of sedimentsstaying behind after flooding. The Juanchito soils are found in the floodplains of the various rivers, theytend to be coarser textured (clay loam) near a stream and finer textured (loam) near the outer edges ofthe floodplain. Total saturation is very high, natural drainage is poor to very poor. Juanchito soils aremoderately acid to lightly alkaline. Cations exchange capacity is normal to very high, SAR is high,although some areas are sodic and/or saline. Juanchito soils are used for sugarcane, sorghum, and soyacultivation and meadows.
Corintias soils are moderately deep soils of the vertisols class. Vertisols are inverted soils that are over50 cm thick, containing over 30% of clay. Due to wetting and drying the clay cracks widely and surfaceparticles fall into the dried-out cracks, thus inverting soil characteristics. Vertisols have a high naturalfertility level and have great agricultural potential where power tools, fertilizers and irrigation areavailable. Corintias soils are moderately structured, consisting mainly of clay. Total saturation is veryhigh, drainage is poor to fair. Cation exchange capacity is high to very high; carbonates are present inthe upper layers. The soils are alkaline to very alkaline. Corintias soils are mainly used for sugarcanecultivation.
Marruecos are superficial to moderately deep soils, which can be classified as mollisols. Mollisols aresoft soils that combine high soil fertility and fair-to-adequate rainfall. Features of mollic horizonsinclude a thickness of 25 cm or more, dark color and at least 1% organic matter and over 50% basesaturation. In the Valle de Cauca mollisols are present in dikes along the Cauca rivers and formed byrecent and older sediments of this flow. Texture of the upper horizon is clay loam to sandy loam; in therest of the profile it is clay to silty clay loam. Total saturation is high, drainage is poor to very poor.Marruecos soils are very acid to moderately acid. Cation exchange capacity is normal to very high.Marruecos soils are used for meadows, sorghum and soya cultivation.
Gudualito soils are moderately deep to deep soils of the mollisol class. Mollisols are soft soils thatcombine high soil fertility and fair-to-adequate rainfall. They have a well-textured upper layer of clayloam to sand. Total saturation is very high, natural drainage is fair to moderately good. Cation exchangecapacity is low to very high. They are high in CaCo3, and sometimes sodic. The soils are neutral to veryalkaline. Land is used for cattle-breeding and sugarcane, cotton, corn and yucca cultivation.
The Valle de Cauca is a rich agricultural area. Climatológica] conditions are ideal for a year round useof the land, soils are fertile. In the design area sugarcane is the predominai crop grown, other cropsinclude sorghum, meadows and annual crops (see figure 27), Due to poor irrigation practices,salinization has occurred in the drier parts of the Valle de Cauca, and some parts are not cultivatedbecause of high salinity.
120
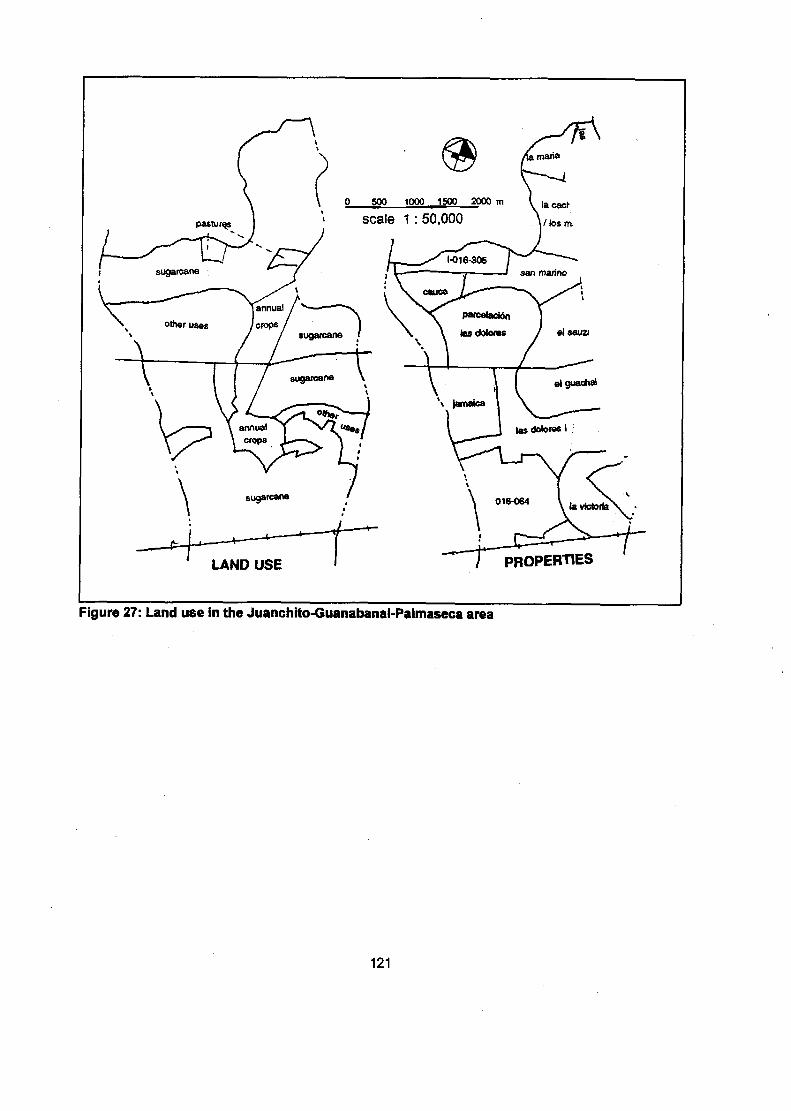
500 1000 1500 2000 m
LAND USE PROPERTIES
Figure 27: Land use in the Juanchito-Guanabanal-Palmaseca area
121

122

Appendix VI: Present and Planned Wastewater TreatmentThe wastewater of Cali city will in the future be treated in four wastewater treatment plants: the "PlantaUASB Vivero Municipal", the "Planta Cafiaveralejo", the "Planta UASB Rio Cali, and "the "PlantaUASB Sur". The wastewater of Cali is nearly completely of domestic sources, as most industry of thecity is located in Yumbo an industrial zone which is a separate community. Yumbo wastewater is notincluded in this study.
The Planta Cañaveralejo will collect and treat 76% of the wastewater of Cali. Planned final capacity in2015 is 7.6 m3/s for preliminary and primary treatment and 3.8 mVs for secondary treatment. TheCañaveralejo plant will be built in the Alfonso Lopez neighborhood, adjacent to the Cauca river. Thesurface area available for the plant is 23 ha. The treatment plant will contain a conventional aerobicactivated sludge system; the reactor is an aerated tank or basin containing a suspension of thewastewater and microorganisms (see figure 31). The content of the aeration tank are mixed vigorouslyby aeration devices that also supply oxygen to the biological suspension. Following the aeration step,the microorganisms are separated from the liquid by sedimentation (Asano et al, 1985). The design wasmade in 1990 by two Japanese and two Colombian consultancy agencies, working under the name ofNITOGOI. Process parameters are presented in table 43.
The total costs to built the plant are estimated to be US$ 117.5 million, of which US$75 million will beused to construct preliminary and primary treatment and US$42.5 million to build secondary treatment.The construction of the plant is financed by the Overseas Economic Cooperation Fund of Japan, whichprovided a loan of US$167.5 million to EMCALI, aimed for programming of improvement of watersupply and sewage systems in Cali. From this loan 80% will be used for the Cañaveralejo plant.Condition of the loan is that construction is carried out before 1998. The bidding for the construction ofthe plant started in December 1995, construction will start in the fall of 1996.
The influent of the Cañaveralejo plant is collected in three pumping stations and a main sewer. Thethree pumping stations (Cañaveralejo and Navarro, which are in operation and Aguablanca which isplanned) transport pure domestic wastewater. The water in the main sewer (Colector General) is mixeddomestic and industrial wastewater.
Table 43: Design parameters of Cañaveralejo plant (Nitogoi, 1990)parameter
BOD total
BOD dissolved
Total Suspended Solids
Votile Suspended Solids
Total Kjeldahl Nitrogen
Total Phosphorus
primary influent
mg/l
167
71
224
165
-
-
primary effluent
mg/l
106
41
129
93
26
3
The Vivero plant is the only wastewater treatment plant in operation in Cali. It treats a wastewater flowof 20.000 habitants equivalents, design discharge is 45 1/s. It uses two upflow anaerobic sludge blankettanks, with a volume of 500 m3 each. In an UASB reactor treatment occurs as wastewater, flowingupward through a sludge blanket, comes in contact with the sludge granules.
The Rio Cali will use an upflow anaerobic sludge blanket system. The capacity of the plant will be 2.0m3/s when completed in 2015 and 0.9 mVs initially after construction, which is planned to be completedin 1999. BOD-load will be 12.83 ton BOD/day. EMCALI is at present looking into post-treatmentoptions for the Rio Cali plant, including aerated lagooning, rotating bio disks, and filter columns.
123
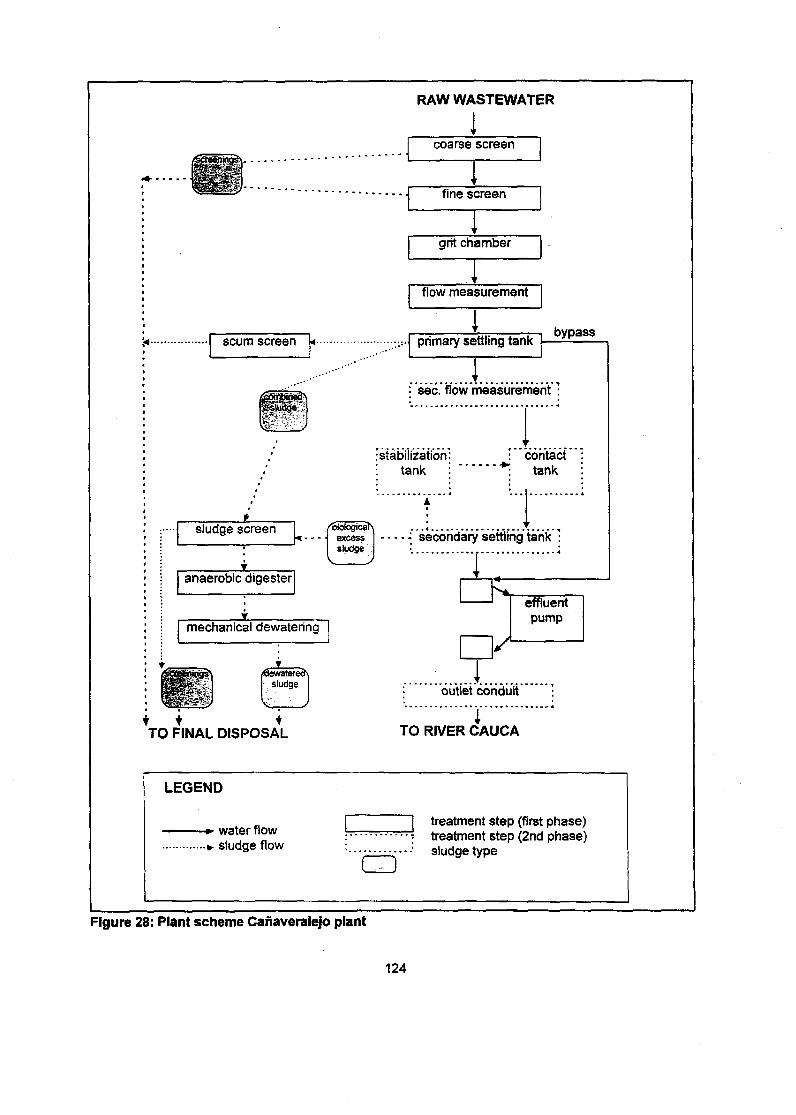
RAWWASTEWATER
coarse screen
fine screen
grit chamber
flow measurement
scum screen « primary settling tankbypass
: sec. flow measurement :
[stabilization:; tank :
contacttank
sludge screen
anaerobic digester
/BiologicaTN • ,« - - - f excess secondary settling tank ;
sludge I :. ;
mechanical dewatering
effluentpump
TO FINAL DISPOSAL
•; "outlet conduit
TO RIVER CAUCA
LEGEND
-•• water flow•-• sludge flow
GD
treatment step (first phase)treatment step (2nd phase)sludge type
Figure 28: Plant scheme Cañaveralejo plant
124
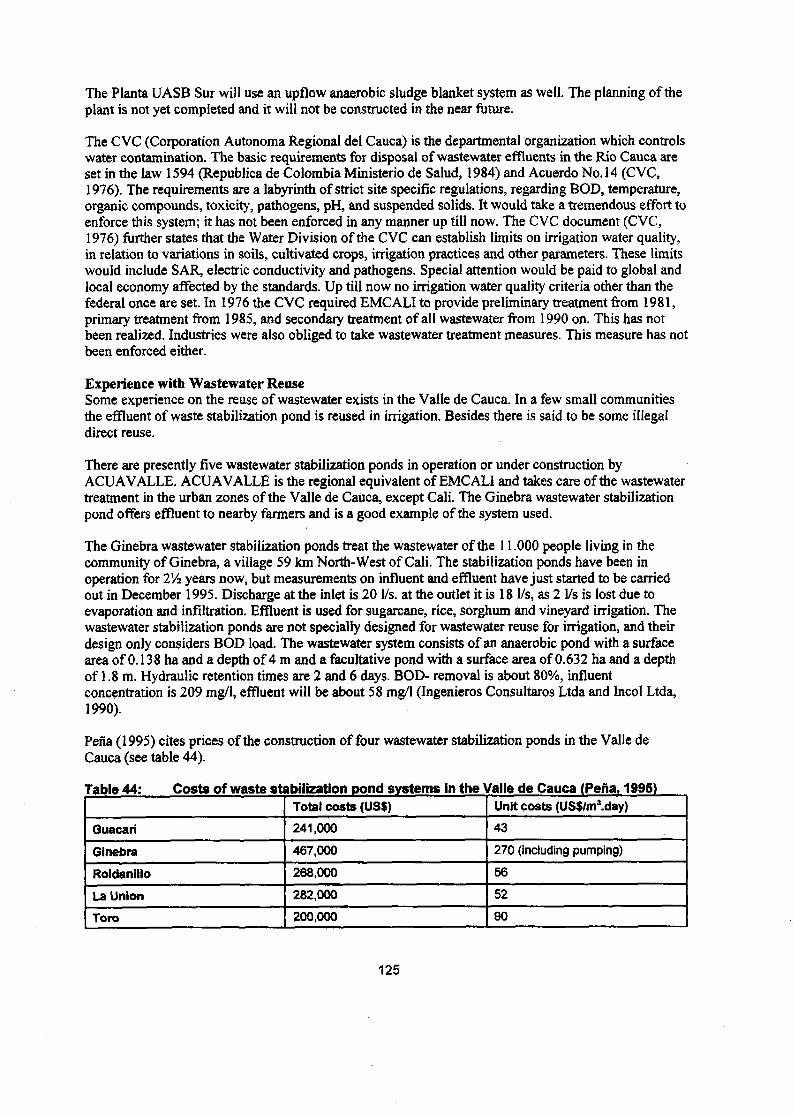
The Planta UASB Sur will use an upflow anaerobic sludge blanket system as well. The planning of theplant is not yet completed and it will not be constructed in the near future.
The CVC (Corporation Autónoma Regional del Cauca) is the departmental organization which controlswater contamination. The basic requirements for disposal of wastewater effluents in the Rio Cauca areset in the law 1594 (Republica de Colombia Ministerio de Salud, 1984) and Acuerdo No. 14 (CVC,1976). The requirements are a labyrinth of strict site specific regulations, regarding BOD, temperature,organic compounds, toxicity, pathogens, pH, and suspended solids. It would take a tremendous effort toenforce this system; it has not been enforced in any manner up till now. The CVC document (CVC,1976) further states that the Water Division of the CVC can establish limits on irrigation water quality,in relation to variations in soils, cultivated crops, irrigation practices and other parameters. These limitswould include SAR, electric conductivity and pathogens. Special attention would be paid to global andlocal economy affected by the standards. Up till now no irrigation water quality criteria other than thefederal once are set. In 1976 the CVC required EMCALI to provide preliminary treatment from 1981,primary treatment from 1985, and secondary treatment of all wastewater from 1990 on. This has notbeen realized. Industries were also obliged to take wastewater treatment measures. This measure has notbeen enforced either.
Experience with Wastewater ReuseSome experience on the reuse of wastewater exists in the Valle de Cauca. In a few small communitiesthe effluent of waste stabilization pond is reused in irrigation. Besides there is said to be some illegaldirect reuse.
There are presently five wastewater stabilization ponds in operation or under construction byACUA VALLE. ACUA VALLE is the regional equivalent of EMCALI and takes care of the wastewatertreatment in the urban zones of the Valle de Caúca, except Cali. The Ginebra wastewater stabilizationpond offers effluent to nearby farmers and is a good example of the system used.
The Ginebra wastewater stabilization ponds treat the wastewater of the 11.000 people living in thecommunity of Ginebra, a village 59 km North-West of Cali. The stabilization ponds have been inoperation for 2/4 years now, but measurements on influent and effluent have just started to be carriedout in December 1995. Discharge at the inlet is 20 1/s. at the outlet it is 18 1/s, as 2 1/s is lost due toevaporation and infiltration. Effluent is used for sugarcane, rice, sorghum and vineyard irrigation. Thewastewater stabilization ponds are not specially designed for wastewater reuse for irrigation, and theirdesign only considers BOD load. The wastewater system consists of an anaerobic pond with a surfacearea of 0.138 ha and a depth of 4 m and a facultative pond with a surface area of 0.632 ha and a depthof 1.8 m. Hydraulic retention times are 2 and 6 days. BOD- removal is about 80%, influentconcentration is 209 mg/1, effluent will be about 58 mg/I (Ingenieros Consultaros Ltda and Incol Ltda,1990).
Peña (1995) cites prices of the construction of four wastewater stabilization ponds in the Valle deCauca (see table 44).
Table 44: Costs of waste stabilization pond systems In the Valle de Cauca (Peña, 1995)
Guacarí
Ginebra
Roldanillo
La Union
Toro
Total costs (US$)
241,000
467,000
268,000
282,000
200,000
Unit costs (US$/m3.day)
43
270 (including pumping)
56
52
90
125
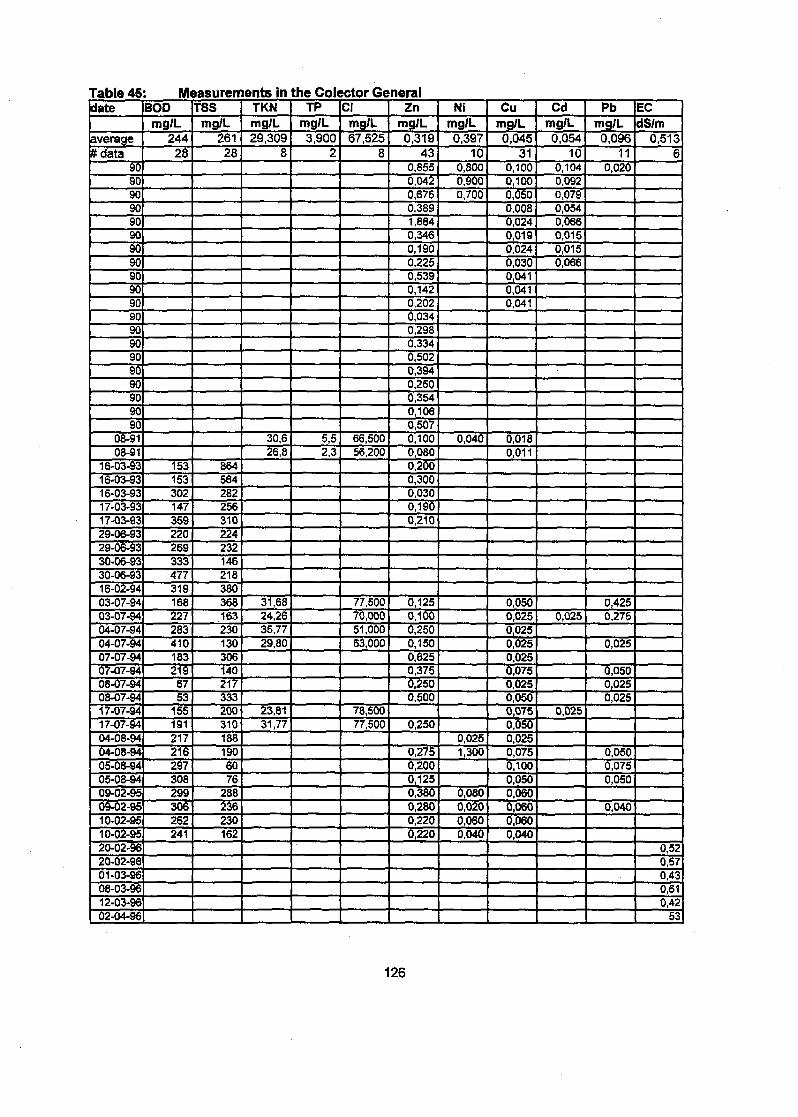
Table 45: Measurements indate
average¥data
9090909090909090909090909090909090909090
08-9108-91
16-03-9316-03-9316-03-9317-03-9317-03-9329-06-9329-06-9330-06-9330-06-9316-02-9403-07-9403-07-9404-07-9404-07-9407-07-9407-07-9408-07-9408-07-9417-07-9417-07-9404-08-9404-08-9405-08-9405-08-9409-02-9509-02-9510-02-9510-02-9520-02-9620-02-9601-03-9608-03-9612-03-9602-04-96
BODmg/L
24428
153153302147359220269333477319168227283410183219
6753
155191217216297308299306262241
TSSmg/L
26128
8645642822563102242321462183803681632301303061402173332003101881906076
288236230162
TKNmg/L
^29,3098
30,626,8
31,6824,2635,7729,80
23,8131,77
the Colector GeneralTP
mg/L3,900
2
5,52,3
CImg/L67,525
8
66,50056,200
77,50070,00051,00063,000
78,50077,500
Znmg/L0,319
430,8550,0420,6760,3891,8840,3460,1900,2250,5390,1420,2020,0340,2980,3340,5020,3940,2500,3540,1060,5070,1000,0800,2000,3000,0300,1900,210
0,1250,1000,2500,1500,6250,3750,2500,500
0,250
0,2750,2000,1250,3800,2800,2200,220
Nimg/L0,397
100,8000,9000,700
0,040
0,0251,300
0,0800,0200,0600,040
Cumg/L0,045
310,1000,1000,0500,0080,0240,0190,0240,0300,0410,0410,041
0,0180,011
0,0500,0250,0250,0250,0250,0750,0250,0500,0750,0500,0250,0750,1000,0500,0600,0600,0600,040
Cdmg/L0,054
100,1040,0920,0790,0540,0660,0150,0150,066
0,025
0,025
Pbmg/L0,096
110,020
0,4250,275
0,025
0,0500,0250,025
0,0500,0750,050
0,040
ECdS/m
0,5136
0,520,570,430,610,42
53
126
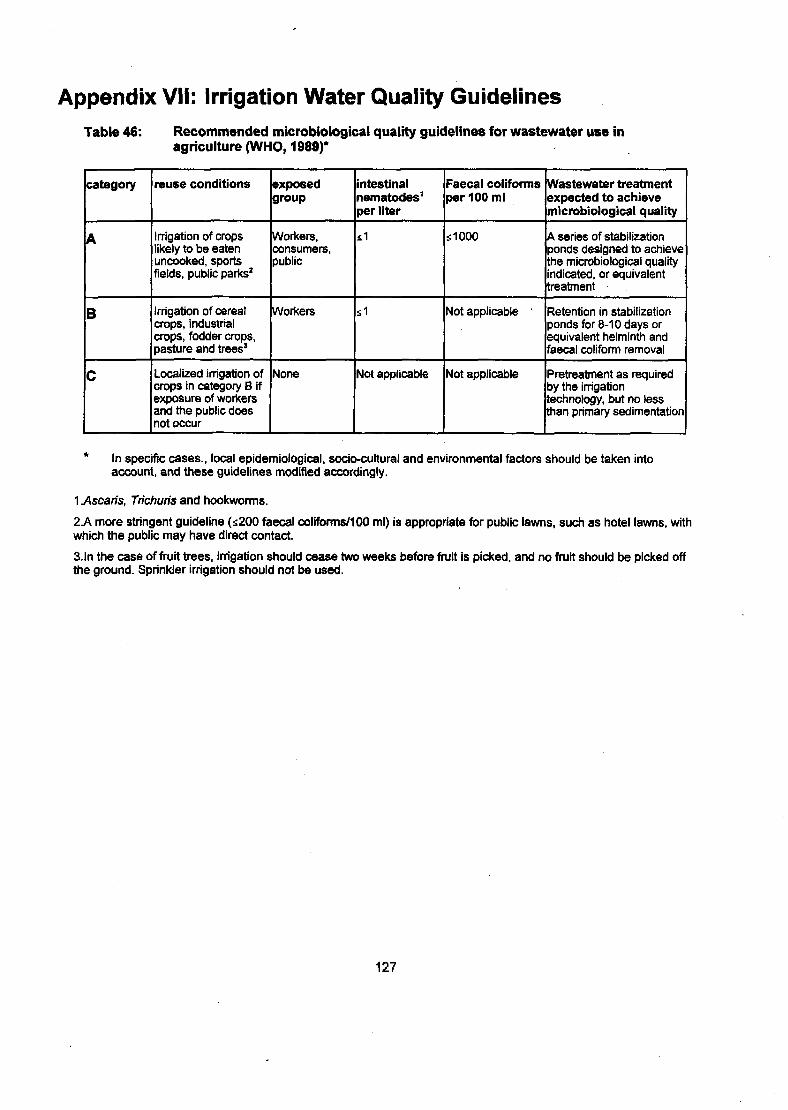
Appendix VII: Irrigation Water Quality GuidelinesTable 46: Recommended microbiological quality guidelines for wastewater use in
agriculture (WHO, 1989)*
category
A
B
C
reuse conditions
Irrigation of cropslikely to be eatenuncooked, sportsfields, public parks2
Irrigation of cerealcrops, industrialcrops, fodder crops,pasture and trees'
Localized irrigation ofcrops in category B ifexposure of workersand the public doesnot occur
exposedgroup
Workers,consumers,public
Workers
None
intestinalnematodes1
per liter
s1
s1
Not applicable
Faecal conformsper 100 ml
s 1000
Not applicable '
Not applicable
Wastewater treatmentexpected to achievemicrobiological quality
A series of stabilizationponds designed to achievethe microbiological qualityindicated, or equivalenttreatment
Retention in stabilizationponds for 8-10 days orequivalent helminth andfaecal coliform removal
Pretreatment as requiredby the irrigationtechnology, but no lessthan primary sedimentation
* In specific cases., local epidemiological, socio-cultural and environmental factors should be taken intoaccount, and these guidelines modified accordingly.
1 Ascaris, Trichuris and hookworms.
2.A more stringent guideline (¿200 faecal coliforms/100 ml) is appropriate for public lawns, such as hotel lawns, withwhich the public may have direct contact.
3.ln the case of fruit trees, irrigation should cease two weeks before fruit is picked, and no fruit should be picked offthe ground. Sprinkler irrigation should not be used.
127
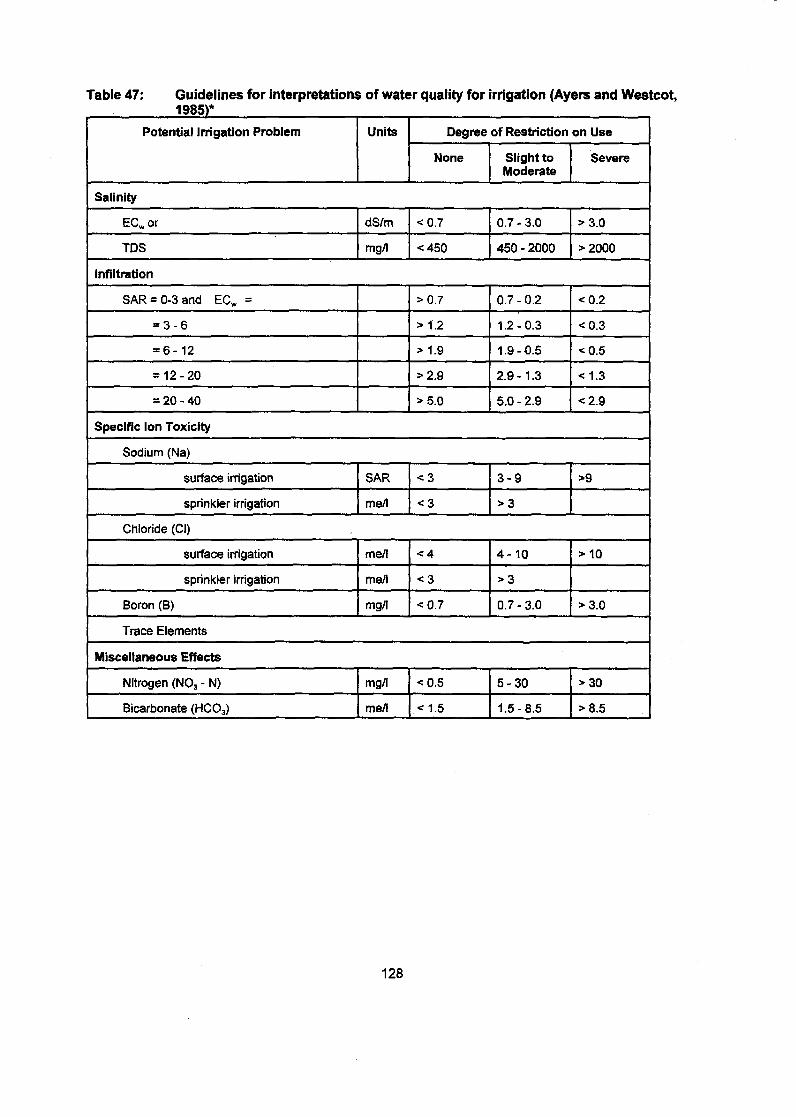
Table 47: Guidelines for interpretations of water quality for irrigation (Ayers and Westcot,1985)*
Potential Irrigation Problem Units Degree
None
of Restriction
Slight toModerate
on Use
Severe
Salinity
ECwor
TDS
dS/m
mg/l
<0.7
<450
0.7-3.0
450 - 2000
>3.0
>2000
Infiltration
SAR = 0-3and ECW =
= 3 -6
= 6-12
= 12-20
= 20-40
>0.7
>1.2
>1.9
>2.9
>5.0
0.7-0.2
1.2-0.3
1.9-0.5
2.9-1.3
5.0 - 2.9
<0.2
<0.3
<0.5
<1.3
<2.9
Specific Ion Toxicity
Sodium (Na)
surface irrigation
sprinkler irrigation
SAR
me/I
< 3
<3
3 - 9
> 3
>9
Chloride (CI)
surface irrigation
sprinkler irrigation
Boron (B)
me/I
me/I
mg/l
<4
< 3
<0.7
4-10
> 3
0.7-3.0
>10
>3.0
Trace Elements
Miscellaneous Effects
Nitrogen (NO3 - N)
Bicarbonate (HCO3)
mg/l
me/I
<0.5
<1.5
5-30
1.5-8.5
>30
>8.5
128
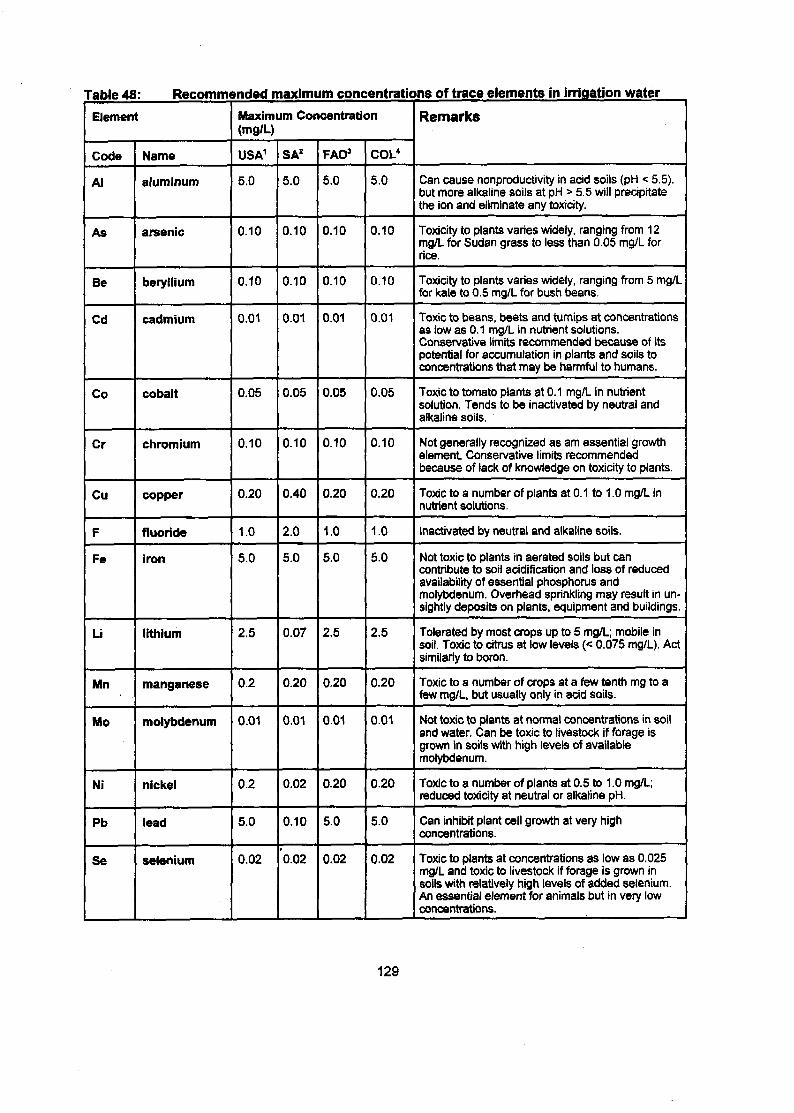
Table 4fi : Recommended maximum concentrations of trace elements in irrigation water
Element
Code
AI
As
Be
Cd
Co
Cr
Cu
F
Fe
Li
Mn
Mo
Ni
Pb
Se
Name
aluminum
arsenic
beryllium
cadmium
cobalt
chromium
copper
fluoride
iron
lithium
manganese
molybdenum
nickel
lead
selenium
Maximum Concentration(mg/L)
USA1
5.0
0.10
0.10
0.01
0.05
0.10
0.20
1.0
5.0
2.5
0.2
0.01
0.2
5.0
0.02
SA2
5.0
0.10
0.10
0.01
0.05
0.10
0.40
2.0
5.0
0.07
0.20
0.01
0.02
0.10
0.02
FAO*
5.0
0.10
0.10
0.01
0.05
0.10
0.20
1.0
5.0
2.5
0.20
0.01
0.20
5.0
0.02
COL4
5.0
0.10
0.10
0.01
0.05
0.10
0.20
1.0
5.0
2.5
0.20
0.01
020
5.0
0.02
Remarks
Can cause nonproductive in acid soils (pH < 5.5).but more alkaline soils at pH > 5.5 will precipitatethe ion and eliminate any toxicity.
Toxicity to plants varies widely, ranging from 12mg/L for Sudan grass to less than 0.05 mg/L forrice.
Toxicity to plants varies widely, ranging from 5 mg/Lfor kale to 0.5 mg/L for bush beans.
Toxic to beans, beets and turnips at concentrationsas low as 0.1 mg/L in nutrient solutions.Conservative limits recommended because of itspotential for accumulation in plants and soils toconcentrations that may be harmful to humans.
Toxic to tomato plants at 0.1 mg/L in nutrientsolution. Tends to be inactivated by neutral andalkaline soils.
Not generally recognized as am essential growthelement. Conservative limits recommendedbecause of lack of knowledge on toxicity to plants.
Toxic to a number of plants at 0.1 to 1.0 mg/L innutrient solutions.
Inactivated by neutral and alkaline soils.
Not toxic to plants in aerated soils but cancontribute to soil acidification and loss of reducedavailability of essential phosphorus andmolybdenum. Overhead sprinkling may result in un-sightly deposits on plants, equipment and buildings.
Tolerated by most crops up to 5 mg/L; mobile insoil. Toxic to citrus at low levels (< 0.075 mg/L). Actsimilarly to boron.
Toxic to a number of crops at a few tenth mg to afew mg/L, but usually only in acid soils.
Not toxic to plants at normal concentrations in soiland water. Can be toxic to livestock if forage isgrown in soils with high levels of availablemolybdenum.
Toxic to a number of plants at 0.5 to 1.0 mg/L;reduced toxicity at neutral or alkaline pH.
Can inhibit plant cell growth at very highconcentrations!
Toxic to plants at concentrations as low as 0.025mg/L and toxic to livestock if forage is grown insoils with relatively high levels of added selenium.An essential element for animals but in very lowconcentrations.
129
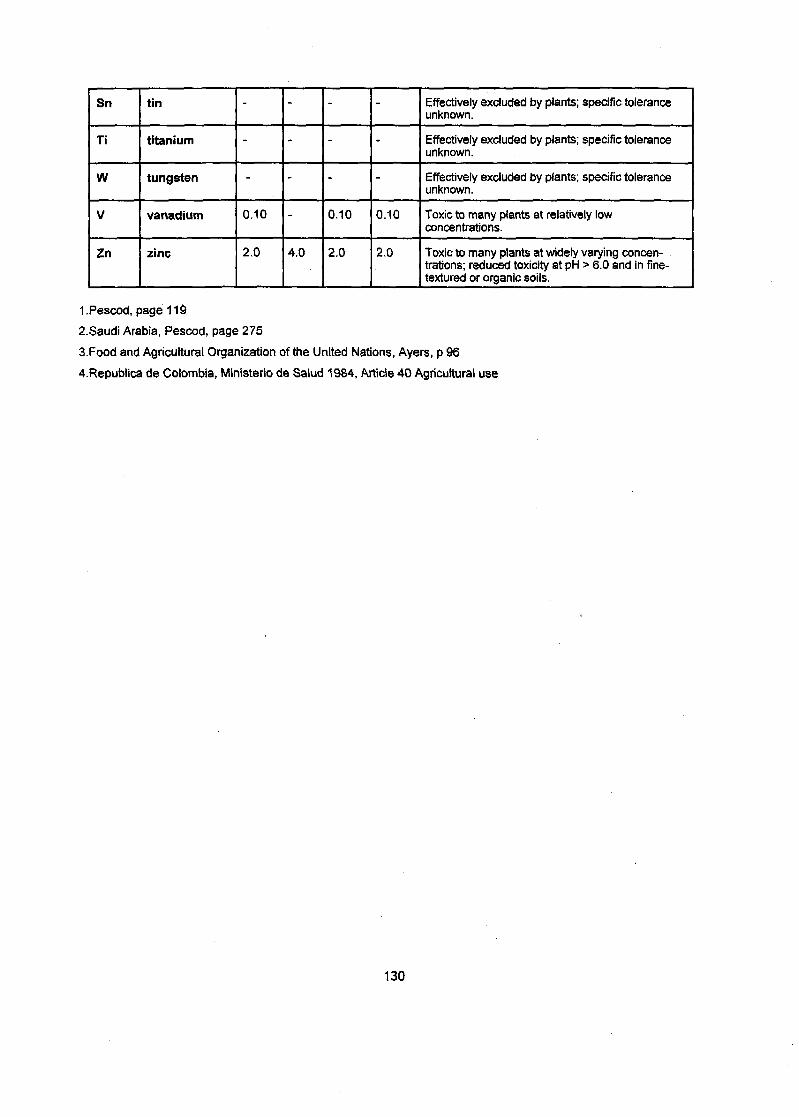
Sn
Ti
W
V
Zn
tin
titanium
tungsten
vanadium
zinc
-
-
-
0.10
2.0
-
-
-
-
4.0
-
-
0.10
2.0
-
-
-
0.10
2.0
Effectively excluded by plants; specific toleranceunknown.
Effectively excluded by plants; specific toleranceunknown.
Effectively excluded by plants; specific toleranceunknown.
Toxic to many plants at relatively lowconcentrations.
Toxic to many plants at widely varying concen-trations; reduced toxiclty at pH > 6.0 and in fine-textured or organic soils.
LPescod, page 119
2.Saudi Arabia, Pescod, page 275
3Food and Agricultural Organization of the United Nations, Ayers, p 96
4.Republica de Colombia, Ministerio de Salud 1984, Article 40 Agricultural use
130
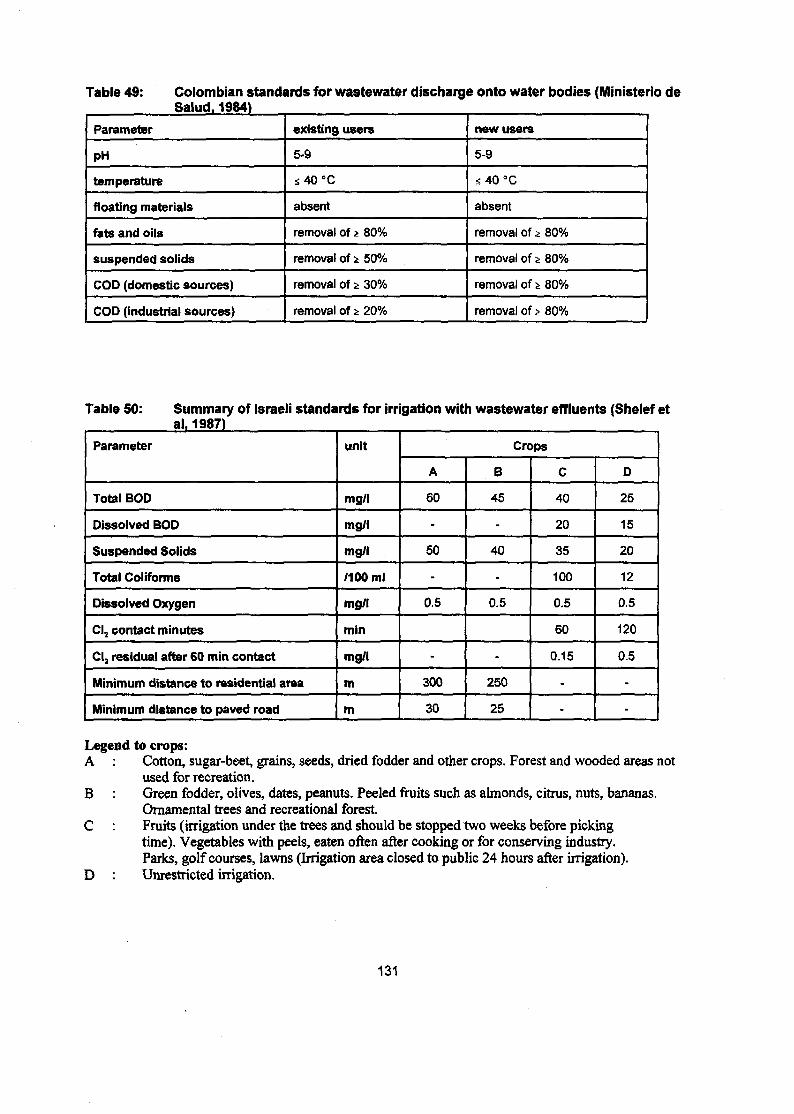
Table 49: Colombian standards for wastewater discharge onto water bodies (Ministerio deSalud. 1984)
Parameter
PH
temperature
floating materials
fats and oils
suspended solids
COD (domestic sources)
COD (industrial sources)
existing users
5-9
¿40°C
absent
removal of a 80%
removal of k 50%
removal of 2 30%
removal of 2 20%
new users
5-9
s40°C
absent
removal of ¿ 80%
removal of s 80%
removal of Ï 80%
removal of s 80%
Table 50: Summary of Israeli standards for irrigation with wastewater effluents (Shelef etal, 1987)
Parameter
Total BOD
Dissolved BOD
Suspended Solids
Total Conforms
Dissolved Oxygen
Cl2 contact minutes
Cl2 residual after 60 min contact
Minimum distance to residential area
Minimum distance to paved road
unit
mg/l
mg/l
mg/l
M00 ml
mg/l
min
mg/l
m
m
Crops
A
60
-
50
-
0.5
-
300
30
B
45
-
40
-
0.5
-
250
25
C
40
20
35
100
0.5
60
0.15
-
-
D
25
15
20
12
0.5
120
0.5
-
-
Legend to crops:A : Cotton, sugar-beet, grains, seeds, dried fodder and other crops. Forest and wooded areas not
used for recreation.B : Green fodder, olives, dates, peanuts. Peeled fruits such as almonds, citrus, nuts, bananas.
Ornamental trees and recreational forest.C : Fruits (irrigation under the trees and should be stopped two weeks before picking
time). Vegetables with peels, eaten often after cooking or for conserving industry.Parks, golf courses, lawns (Irrigation area closed to public 24 hours after irrigation).
D : Unrestricted irrigation.
131

132
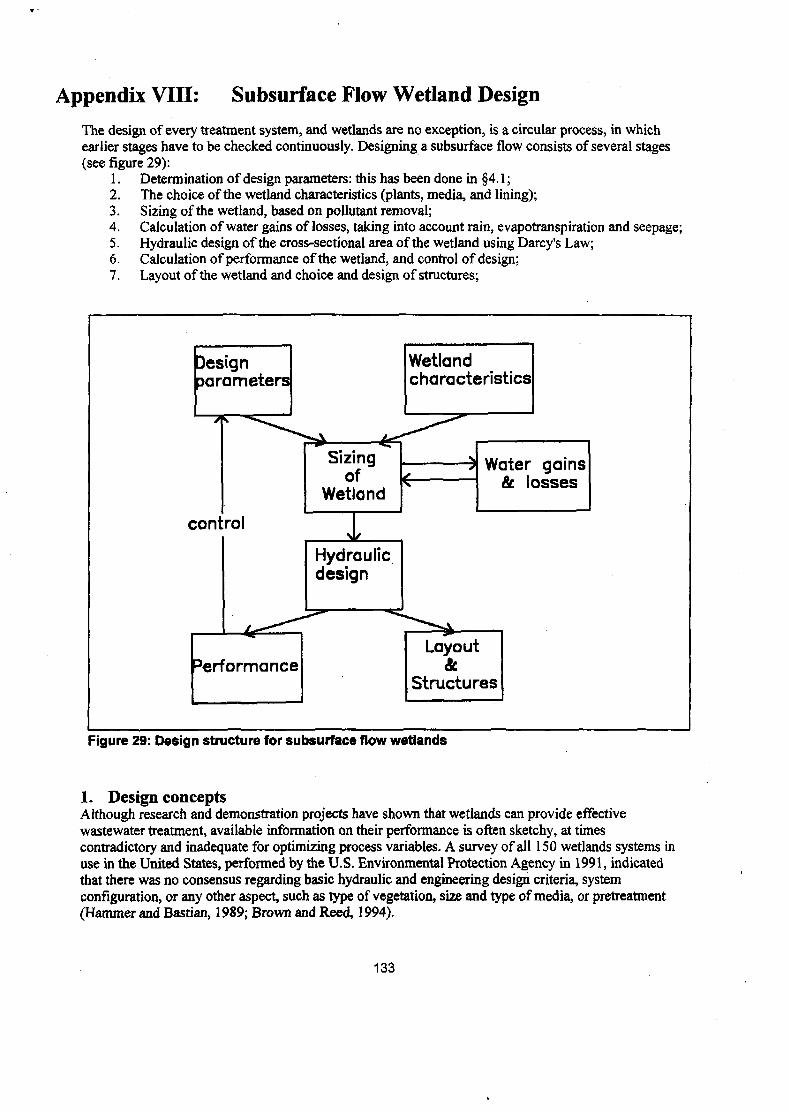
Appendix VIII: Subsurface Flow Wetland DesignThe design of every treatment system, and wetlands are no exception, is a circular process, in whichearlier stages have to be checked continuously. Designing a subsurface flow consists of several stages(see figure 29):
1. Determination of design parameters: this has been done in §4.1 ;2. The choice of the wetland characteristics (plants, media, and lining);3. Sizing of the wetland, based on pollutant removal;4. Calculation of water gains of losses, taking into account rain, evapotranspiration and seepage;5. Hydraulic design of the cross-sectional area of the wetland using Darcy's Law;6. Calculation of performance of the wetland, and control of design;7. Layout of the wetland and choice and design of structures;
Designparameters
7-̂ ,
control
.--
3erformance
Sizingof
Wetland
Hydraulicdesign
~~~~ ^•->
Wetlandcharacteristics
\J
fWater gains
& losses
Layout&
Structures
Figure 29: Design structure for subsurface flow wetlands
1. Design conceptsAlthough research and demonstration projects have shown that wetlands can provide effectivewastewater treatment, available information on their performance is often sketchy, at timescontradictory and inadequate for optimizing process variables. A survey of all 150 wetlands systems inuse in the United States, performed by the U.S. Environmental Protection Agency in 1991, indicatedthat there was no consensus regarding basic hydraulic and engineering design criteria, systemconfiguration, or any other aspect, such as type of vegetation, size and type of media, or pretreatment(Hammer and Bastían, 1989; Brown and Reed, 1994).
133
The sizing of the wetland is subject to an academic discussion: there is not yet a consensus amongexperts as to which approach is the most suitable approach for designing constructed wetlands. Existingdesign guidelines normally are black box models, in which no separate actions are distinguished, butthe result of the total concept is regarded. A number of different procedures for the design exist: designbased on analysis of operating systems, design based on areal loading and design based on attached-growth wastewater treatment processes (Reed et al., 1995).
Design based on analysis of performance data from operating systems and the prediction of systemperformance of the wetland to be constructed by multiple regression methods is only valid if enoughexperience with wetlands operating under similar circumstances does exist. Data on the functioning ofwetlands in tropical areas are even more scarce than on those functioning in moderate climates, as mostwetlands in operation are situated in the USA and Europe (Noller et al., 1994; Reed et al., 1995). Thisapproach is therefore not practicable in Cali.
The areal loading approach is similar to that used for land treatment systems. The validity of thismethod is limited: wastewater is not applied uniformly over the wetland, it does not take into accountthe depth of the wetland, and it does not recognize the influence of temperature on system performance(Reed et al., 1995). Another drawback of the areal loading approach is that it presumes set effluentconcentrations for discharge into rivers. This is a far lower BOD, TSS and TN concentrations than areallowed for agricultural reuse. Loading rates of a system for reuse will therefore be considerably higherthan literature values.
A first-order plug flow model assumes that the biological reactions which occur in wetlands are similarto those describing the same type of reactions in other attached-growth wastewater treatment processes.Although a wetland is not an ideal flow reactor and the actual flow regime is probably somewherebetween plugflow and complete-mix, there are insufficient data available for the definition of agenerally applicable and reasonably easy-to-use design model which takes into account the complicatedflow regime in wetlands. Kadlec (1993) states that flow pattern in a gravel bed is not close to plugflowand a more appropriate model would be a dead zone interchanging water with stirred tanks in seriescomprising the remaining void volume. The plug-flow design method is however the base for the onlymore or less complete, set of design criteria (Reed, 1990; further developed in Reed et al. 1995; cited inMetcalf and Eddy, 1991 and Kadlec, 1989; cited in Watson etal., 1989).
The plug-flow design method is the simplest adequate design method available. The used designguidelines follow a plugflow design approach and combine the routines developed by Reed and Kadlec.The design is based on BOD and nitrogen removal.
2. Characterization of Wetland
Choice of Macrophyte SpeciesWetland plants are generally considered an essential part of a subsurface flow wetland system. Thepresence of macrophytes stabilizes the bed surface and prevents the formation of erosion channels. Byreleasing oxygen into the rhizosphere from their roots, aquatic macrophytes create aerobic conditions inthe water-satured wetland basin. The roots of macrophytes further provide a huge surface area forattached microbial growth (Brix, 1994; Chamber and McComb, 1994; Reed et al., 1995). Sapkota andBavor (1994) state that wetland plants are not an indispensable part of subsurface wetland and advocateunplanted, horizontal flow gravel-based systems.
Additional functions not related to the treatment of wastewater have to be taken into account whenchoosing a species. Nice looking plants (like Yellow Flags and Canna-lilies) make sewage treatmentsystems aesthetically pleasing. Some species yield useful products (Brix, 1994).
134
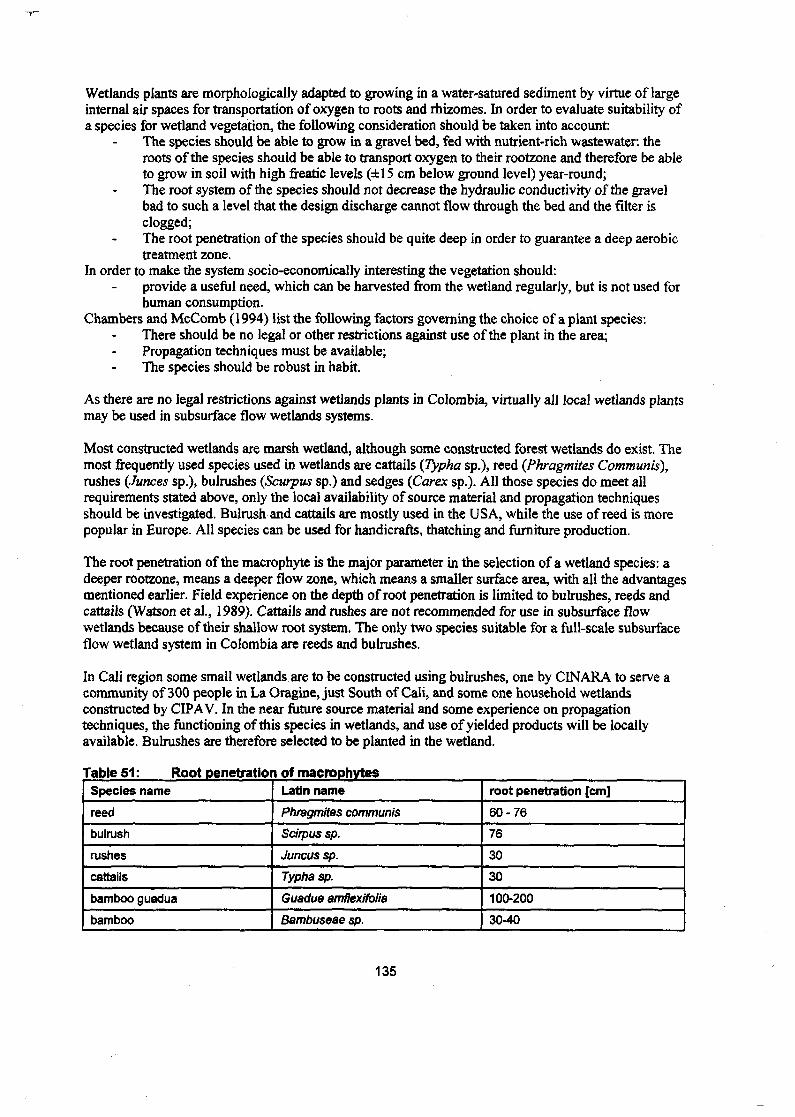
Wetlands plants are morphologically adapted to growing in a water-satured sediment by virtue of largeinternal air spaces for transportation of oxygen to roots and rhizomes. In order to evaluate suitability ofa species for wetland vegetation, the following consideration should be taken into account:
The species should be able to grow in a gravel bed, fed with nutrient-rich wastewater: theroots of the species should be able to transport oxygen to their rootzone and therefore be ableto grow in soil with high freatic levels (±15 cm below ground level) year-round;The root system of the species should not decrease the hydraulic conductivity of the gravelbad to such a level that the design discharge cannot flow through the bed and the filter isclogged;The root penetration of the species should be quite deep in order to guarantee a deep aerobictreatment zone.
In order to make the system socio-economically interesting the vegetation should:provide a useful need, which can be harvested from the wetland regularly, but is not used forhuman consumption.
Chambers and McComb (1994) list the following factors governing the choice of a plant species:There should be no legal or other restrictions against use of the plant in the area;Propagation techniques must be available;The species should be robust in habit.
As there are no legal restrictions against wetlands plants in Colombia, virtually all local wetlands plantsmay be used in subsurface flow wetlands systems-Most constructed wetlands are marsh wetland, although some constructed forest wetlands do exist. Themost frequently used species used in wetlands are cattails {Typha sp.)» reed (Phragmites Commuais),rushes (Junces sp.), bulrushes (Scurpus sp.) and sedges (Carex sp.). All those species do meet allrequirements stated above, only the local availability of source material and propagation techniquesshould be investigated. Bulrush and cattails are mostly used in the USA, while the use of reed is morepopular in Europe. All species can be used for handicrafts, thatching and furniture production.
The root penetration of the macrophyte is the major parameter in the selection of a wetland species: adeeper rootzone, means a deeper flow zone, which means a smaller surface area, with all the advantagesmentioned earlier. Field experience on the depth of root penetration is limited to bulrushes, reeds andcattails (Watson et al., 1989). Cattails and rushes are not recommended for use in subsurface flowwetlands because of their shallow root system. The only two species suitable for a full-scale subsurfaceflow wetland system in Colombia are reeds and bulrushes.
In Cali region some small wetlands are to be constructed using bulrushes, one by CINARA to serve acommunity of 300 people in La Oragine, just South of Cali, and some one household wetlandsconstructed by CIPAV. In the near future source material and some experience on propagationtechniques, the functioning of this species in wetlands, and use of yielded products will be locallyavailable. Bulrushes are therefore selected to be planted in the wetland.
Table 51 : Root penetration of macrophytesSpecies name
reed
bulrush
rushes
cattails
bamboo guadua
bamboo
Latin name
Phragmites commuais
Scirpus sp.
Juncus sp.
Typha sp.
Guadua amfíexifolia
Bambuseae sp.
root penetration [cm]
60-76
76
30
30
100-200
30-40
135
An interesting idea is to use guadua or other types of bamboo as wetland vegetation. Bamboo is apopular local material for handicrafts (bamboo and guaduilla), construction (guadua) and furnitureproduction. It is not clear whether guadua and other bamboo species can grow in gravel beds fed withwastewater. Although bamboo and guadua normally grow in locations near rivers and streams wheresoils are wet, their root penetration is said to be limited by high freatic levels, and guadua is said to beunfit to grow in fully satured soils, as their root will suffer from anaerobic circumstances (Cruz Rios,1994). Bamboo species generally prefer well-drained sandy loam to loamy-clay soils, although it cangrow on vastly different types of soil; guadua grows best in well-drained soils (Liese, 1985; Castaño,1993). Agronomic engineers of the Colombian National Institute of Bamboo and Guadua said bamboois not fit to grow in satured soils. There are some species of bamboo (for instance Guadua Amflexifolia,which grows in swamps flooded continuously in Campeche province of Mexico and also grows in theNorth of Colombia.
Bamboos, especially guadua, have a very big, strong root system. There are no data on the effect of theroot system on hydraulic conductivity of the gravel bed. The big roots of guadua could cause erosionchannels. Bamboo root penetration is 30-40 cm, guadua roots penetrate up till 200 cm into the soil.
The scarce information on the growing conditions guadua indicate inconsistent data on the suitability ofthe species for subsurface flow wetlands. Bamboo species are, based on the present knowledge, notsuited for the use as wetland vegetation in a full-scale project, as they are no wetland species and willprobably not survive in fully satured soils. After further study it will be interesting, however, to tryspecies of guadua or bamboo, which have shown ability to live in wetlands for small-scale projectswhich are monitored closely.
Choice of MediaCoarsely textured materials, such as gravel, are believed to be the only suitable media for subsurfaceflow wetlands. Common gravel media include washed and sized crushed limestone and river gravel(Steiner, 1989). In the past soil was used as a media, and plant roots and rhizomes were supposed tomaintain the hydraulic conductivity. This system, referred to as the root-zone system, have not showedthe desired treatment effectiveness and now function as undersize free water surface flow wetlands as aresult of clogging and low hydraulic conductivities.
A subsurface wetland typically contains 0.3 m to 0.7 m of the medium. This layer is sometimes overlainwith a layer of fine gravel 76-150 mm deep, which serves as an initial rooting media for the vegetationand is maintained in dry condition during normal operation (Reed et al., 1995).
Gravel and crushed rock are available locally in Cali; gravel is very expensive. Crushed rock ofmedium size (D= 10 mm) is selected here to serve as media for the wetland.
LiningOn permeable soils prevention of groundwater contamination and water losses can require installationof an impermeable liner below the media. The basic infiltration rate of the Juanchito soil at the wetlandsite is 4.6 mm/hour, Mara et al. (1992) advise lining if the basic infiltration rate of the soil is more than0.36 mm/hour. The liner must be strong, thick and smooth to prevent root penetration and attachment.Possible materials are compacted in situ soils (permeability less than 10"* cm/s); bentonite; asphalt;synthetic butyl rubber; or plastic membranes (Steiner, 1989). Geotextile, a sheet material that isavailable in Columbia, is selected to line the wetland.
136
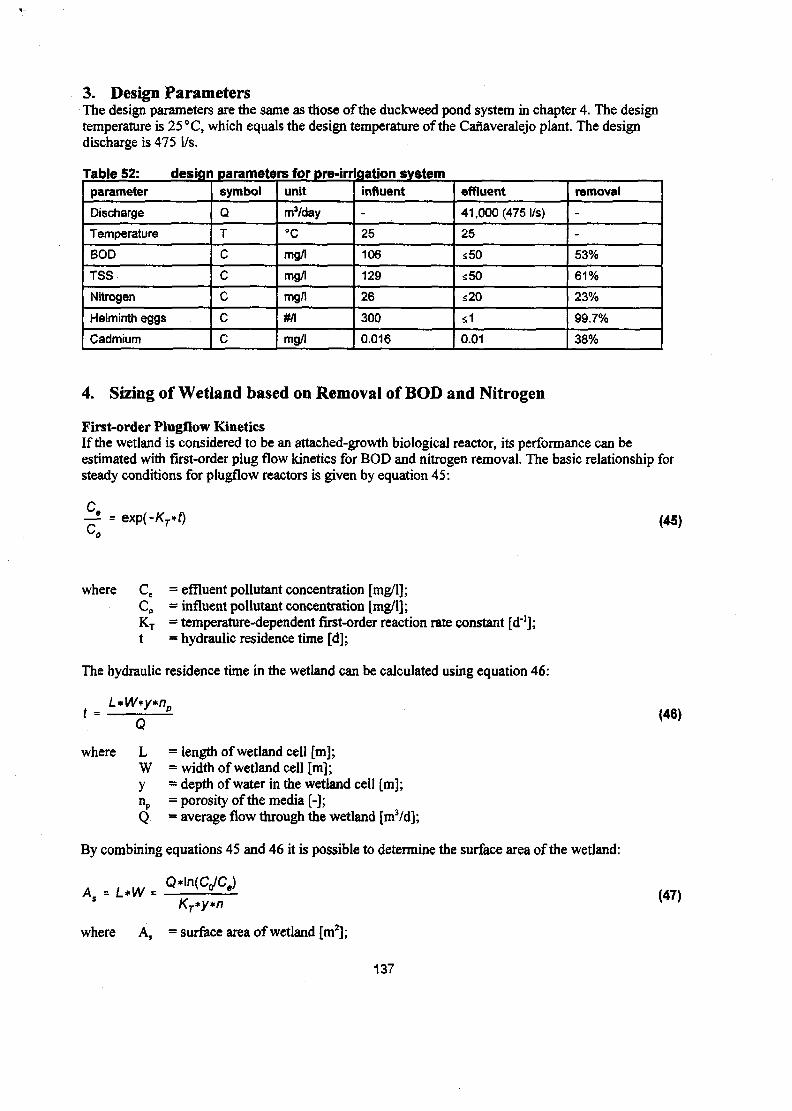
3. Design ParametersThe design parameters are the same as those of the duckweed pond system in chapter 4. The designtemperature is 25° C, which equals the design temperature of the Cañaveralejo plant. The designdischarge is 475 1/s.
Table 52: design parameters for pre-irrigation systemparameter
Discharge
Temperature
BODTSS
Nitrogen
Helminth eggs
Cadmium
symbol
Q
T
C
cccc
unit
ms/day
°C
mg/l
mg/l
mg/l
#/l
mg/l
influent
-
25
106
129
26
300
0.016
effluent
41,000 (475 l/s)
25
s50
s50
£20
s1
0.01
removal
-
-
53%
61%
23%
99.7%
38%
4. Sizing of Wetland based on Removal of BOD and Nitrogen
First-order Plugflow KineticsIf the wetland is considered to be an attached-growth biological reactor, its performance can beestimated with first-order plug flow kinetics for BOD and nitrogen removal. The basic relationship forsteady conditions for plugflow reactors is given by equation 45:
- i = exp(-Kr*f)
°(45)
where Ce = effluent pollutant concentration [mg/l];Co = influent pollutant concentration [mg/l];KT = temperature-dependent first-order reaction rate constant [d1];t - hydraulic residence time [d];
The hydraulic residence time in the wetland can be calculated using equation 46:
tQ
(46)
where L = length of wetland cell [m];W = width of wetland cell [m];y ~ depth of water in the wetland cell [m];np = porosity of the media [-];Q - average flow through the wetland [mVd];
By combining equations 45 and 46 it is possible to determine the surface area of the wetland:
As = L*W =Kr*y*n
where A, = surface area of wetland [m?];
(47)
137
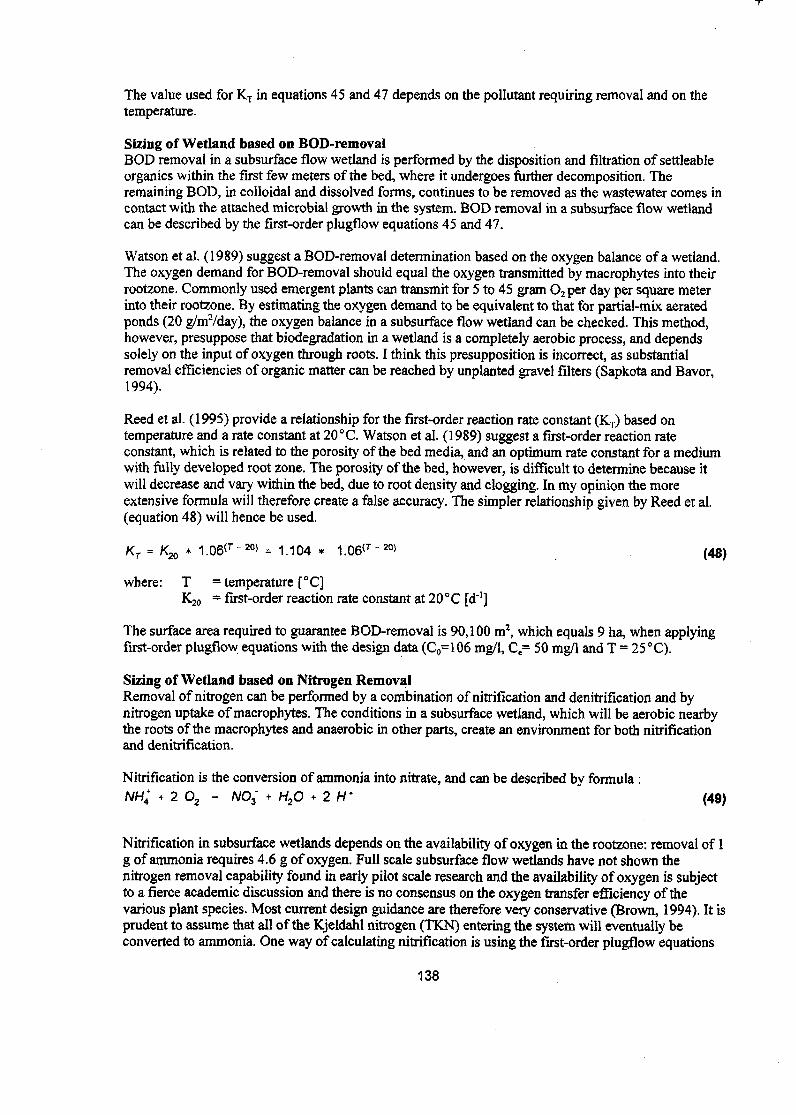
The value used for KT in equations 45 and 47 depends on the pollutant requiring removal and on thetemperature.
Sizing of Wetland based on BOD-removalBOD removal in a subsurface flow wetland is performed by the disposition and filtration of settleableorganics within the first few meters of the bed, where it undergoes further decomposition. Theremaining BOD, in colloidal and dissolved forms, continues to be removed as the wastewater comes incontact with the attached microbial growth in the system. BOD removal in a subsurface flow wetlandcan be described by the first-order plugflow equations 45 and 47.
Watson et al. (1989) suggest a BOD-removal determination based on the oxygen balance of a wetland.The oxygen demand for BOD-removal should equal the oxygen transmitted by macrophytes into theirrootzone. Commonly used emergent plants can transmit for 5 to 45 gram O2per day per square meterinto their rootzone. By estimating the oxygen demand to be equivalent to that for partial-mix aeratedponds (20 g/mVday), the oxygen balance in a subsurface flow wetland can be checked. This method,however, presuppose that biodégradation in a wetland is a completely aerobic process, and dependssolely on the input of oxygen through roots. I think this presupposition is incorrect, as substantialremoval efficiencies of organic matter can be reached by implanted gravel filters (Sapkota and Bavor,1994).
Reed et al. (1995) provide a relationship for the first-order reaction rate constant (KT) based ontemperature and a rate constant at 20 °C. Watson et al. (1989) suggest a first-order reaction rateconstant, which is related to the porosity of the bed media, and an optimum rate constant for a mediumwith fully developed root zone. The porosity of the bed, however, is difficult to determine because itwill decrease and vary within the bed, due to root density and clogging. In my opinion the moreextensive formula will therefore create a false accuracy. The simpler relationship given by Reed et al.(equation 48) will hence be used.
KT = K20 * 1.06(7-2°> = 1.104 * 1.06<7-20> (48)
where: T = temperature [°C]K20 - first-order reaction rate constant at 20°C [d'1]
The surface area required to guarantee BOD-removal is 90,100 m2, which equals 9 ha, when applyingfirst-order plugflow equations with the design data (C0=106 mg/1, Ce= 50 mg/1 and T = 25 °C).
Sizing of Wetland based on Nitrogen RemovalRemoval of nitrogen can be performed by a combination of nitrification and denitrification and bynitrogen uptake of macrophytes. The conditions in a subsurface wetland, which will be aerobic nearbythe roots of the macrophytes and anaerobic in other parts, create an environment for both nitrificationand denitrification.
Nitrification is the conversion of ammonia into nitrate, and can be described by formula :NH* + 2 O j - A/O3~ + H2O + 2 H* (49)
Nitrification in subsurface wetlands depends on the availability of oxygen in the rootzone: removal of 1g of ammonia requires 4.6 g of oxygen. Full scale subsurface flow wetlands have not shown thenitrogen removal capability found in early pilot scale research and the availability of oxygen is subjectto a fierce academic discussion and there is no consensus on the oxygen transfer efficiency of thevarious plant species. Most current design guidance are therefore very conservative (Brown, 1994). It isprudent to assume that all of the Kjeldahl nitrogen (TKN) entering the system will eventually beconverted to ammonia. One way of calculating nitrification is using the first-order plugflow equations
138

45 and 47, KT now being a temperature-dependent nitrification rate constant depending on the fractionof the depth actually occupied by rootzone (Reed et al., 1995).
KT = KWH*(1.048)<r-20> (50)
KNH = 0.01864 + 0.3922 *(rz)26077 (51)
where: KNH = nitrification rate constant at 20°C [d1];rz = percent of bed depth occupied by rootzone, a decimal fraction between 0 and 1 ;
For new wetland in which no measurements of the rootzone fraction (rz) can be taken, it is notacceptable to assume that the rootzone will automatically occupy the entire bed volume. The climateconditions in the Valle de Cauca, however, favors deep root penetration though, and an estimate of 0.8is used for the rootzone fraction. The temperature used is 25 °C. This results in the following equationfor nitrification:
_ Q«ln«yc.)A' " 0.300*y.n ( }
Equation 52 only accounts for nitrification, the conversion of ammonia to nitrate, and predict the arearequired for a given level of conversion. Actual removal of nitrogen is the requirement of the wetland,and it is necessary to consider the denitrification and size of the wetland accordingly. Denitrification isthe conversion of nitrate into oxygen and nitrogen. Denitrification requires anaerobic circumstances,these will occur in parts of the wetland. Denitrification can be described as:
2 NO3 + 2 W - N2 î +H2O + 5 O (53)
Once again the first-order plugflow equations 45 and 47 are used for describing denitrification. KT fordenitrification can be described using equation 54, 54:
KT = 1.000*(1.15)(r-2°> (54)
Given a water temperature of 25 °C, this results in the following first-order plugflow equation:
C- £ = exp(-2.01*i) (55)co
Total Kjeldahl nitrogen removal is the sum of the first-order plug flow equations for nitrification anddenitrification. The surface area required is determined by an iterative procedure, taking into accountnitrification and denitrification. The surface area of the wetland given the design parameters (Co - 26mg/1 and Ce = 20 mg/1) is 19,4 ha.
Nitrogen uptake by macrophytes is normally not taken into account when designing wetland. Onereason for this is that in most wetlands the macrophytes are not regularly yielded, and therefore removalis limited. Besides data on nitrogen removal are not readily available. Brix (1994) estimates between1000 and 2500 kg per hectare per year. A 1500 kg/ha*year removal would equal a 1.97 mg/1 nitrogenremoval.
139
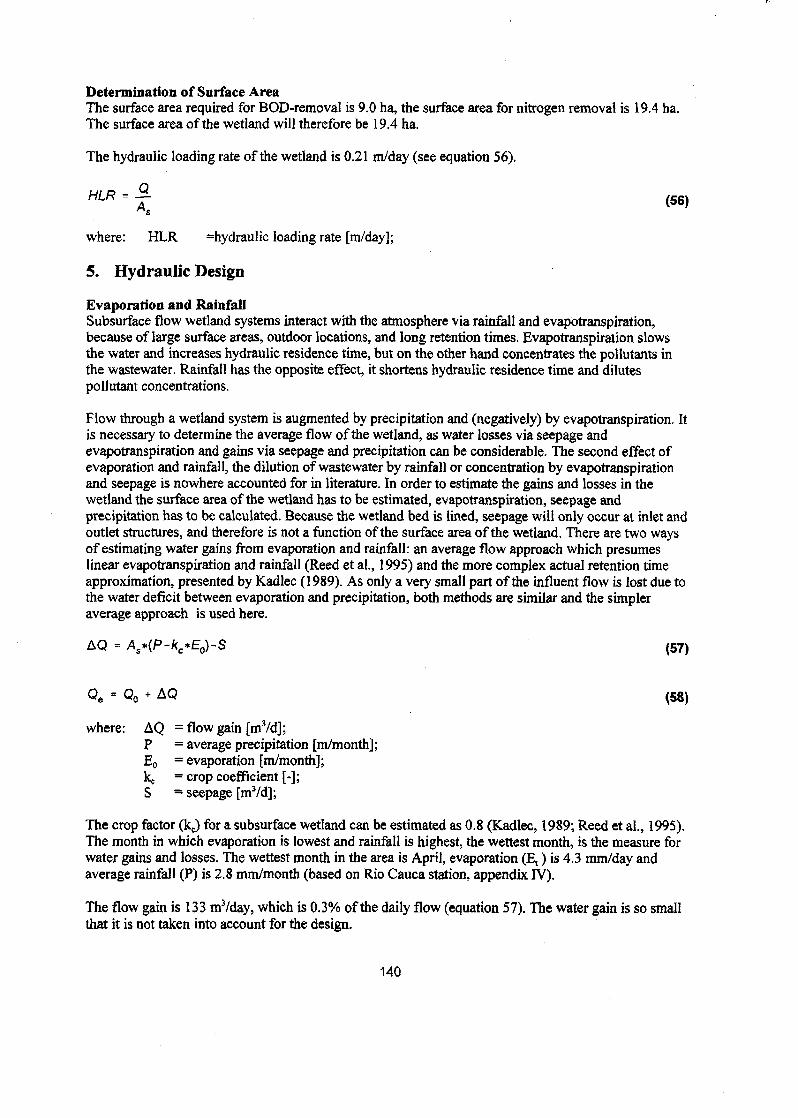
Determination of Surface AreaThe surface area required for BOD-removal is 9.0 ha, the surface area for nitrogen removal is 19.4 ha.The surface area of the wetland will therefore be 19.4 ha.
The hydraulic loading rate of the wetland is 0.21 m/day (see equation 56).
HLR = T (56)
where: HLR ^hydraulic loading rate [m/day];
5. Hydraulic Design
Evaporation and RainfallSubsurface flow wetland systems interact with the atmosphere via rainfall and evapotranspiration,because of large surface areas, outdoor locations, and long retention times. Evapotranspiration slowsthe water and increases hydraulic residence time, but on the other hand concentrates the pollutants inthe wastewater. Rainfall has the opposite effect, it shortens hydraulic residence time and dilutespollutant concentrations.
Flow through a wetland system is augmented by precipitation and (negatively) by evapotranspiration. Itis necessary to determine the average flow of the wetland, as water losses via seepage andevapotranspiration and gains via seepage and precipitation can be considerable. The second effect ofevaporation and rainfall, the dilution of wastewater by rainfall or concentration by evapotranspirationand seepage is nowhere accounted for in literature. In order to estimate the gains and losses in thewetland the surface area of the wetland has to be estimated, evapotranspiration, seepage andprecipitation has to be calculated. Because the wetland bed is lined, seepage will only occur at inlet andoutlet structures, and therefore is not a function of the surface area of the wetland. There are two waysof estimating water gains from evaporation and rainfall: an average flow approach which presumeslinear evapotranspiration and rainfall (Reed et al., 1995) and the more complex actual retention timeapproximation, presented by Kadlec (1989). As only a very small part of the influent flow is lost due tothe water deficit between evaporation and precipitation, both methods are similar and the simpleraverage approach is used here.
AQ = As*(P-kc*EoyS (57)
(58)Qe = Qo+ AQ
where: AQ = flow gain [mVdJ;P = average precipitation [m/month];Eo = evaporation [m/month];kj = crop coefficient [-];S ~ seepage [m3/d];
The crop factor (kc) for a subsurface wetland can be estimated as 0.8 (Kadlec, 1989; Reed et al., 1995).The month in which evaporation is lowest and rainfall is highest, the wettest month, is the measure forwater gains and losses. The wettest month in the area is April, evaporation (E, ) is 4.3 mm/day andaverage rainfall (P) is 2.8 mm/month (based on Rio Cauca station, appendix IV).
The flow gain is 133 nrVday, which is 0.3% of the daily flow (equation 57). The water gain is so smallthat it is not taken into account for the design.
140
Cross-Sectional AreaOne of the mayor problems of subsurface flow wetlands in operation is the occurrence of surface flow,which results in short circuiting and reduced retention times. This problem has been primarily blamedon plugging of the void spaces in within the media by wastewater solids, biomass and plant roots.Further investigation has revealed, however, that in many of the subsurface systems, inadequatelyhydraulic design wast the cause of the surface flow. In early design of wetland using soil as media,design is based on the assumption that the hydraulic conductivity would rise after the establishment, itis now generally accepted that the conductivity decreases (Brown, 1994).
Proper hydraulic design can solve clogging problems. Based on this surface area the width of wetlandcan be determined based on hydraulic consideration: in order to prevent clogging, the wetland has tohave a minimum cross-sectional area. The cross-sectional area is the product of the width of thewetland (W) and the depth of the wetland (y). In order to determine the cross-sectional area of thewetland, the flow through the wetland is described using Darcy's law.
Darcy's law (equation 59) describes the flow regime in a porous media and is generally accepted fordesign of subsurface flow wetlands, with a lateral flow in fully saturated, fine grained soils, sands andgravels (Kadlec, 1989).
Q = ks*Ae*s (59)
where: k, = hydraulic conductivity of a unit area of the wetland perpendicular to the flow direction[m3/m2/d];
Ac = total cross-sectional area perpendicular to flow [m2];s = hydraulic gradient, or "slope" of the water surface in the flow system [m/m].
Measured values and design estimates of hydraulic conductivity vary widely. The lowest valuemeasured in a gravel bed in England is 30 m/d (Watson and Hobson, 1989). Kadlec and Watson (1993)found that hydraulic conductivity of the inlet zone of a coarse gravel bed had been loweredsubstantially by the mud formation in the first year of operation; after that conductivity did not change.Bed average conductivities were lower in the plugged zone by a factor of 10. Appropriate values forhydraulic conductivity are likely between that of clean gravel (864 m/d) and the minimum measured inEngland. For design purposes the USA Environmental Protection Agency recommends that only 10%of the clean media hydraulic conductivity should be used in calculations (cited in Brown, 1994). Reedet al. (1995) recommend to use one third of the actual hydraulic conductivity of the clear media fordesign purposes. Watson and Hobson (1989) state that a permeability of 260 mVm2/d is stabilized in thelong-term for gravel-bed systems with roots, regardless the initial conductivity. This value will be usedhere.
By introducing a factor which indicates the increment in depth serving as head differential, Darcy's lawcan be rewritten as:
w. i ^
where: m = increment of depth serving as head differential [-] = s*L/y;
The m value will typically be between 5 and 20% of the head available (which equals the water depthy), to provide a large safety factor against potential clogging, viscosity effect and other contingenciesthat may be unknown at the time of design. A value of 0.2 is used here. Given the bed depth (y=0.6m),average discharge (Q=41,000 mVd), and surface area of the wetland (19.4 ha), the width (W) can becalculated using equation 60, and is 20,472 m. Length is calculated by dividing the surface area by the
141
width, and is 7.5 m.
Darcy's law assumes laminar flow. In order to check if the subsurface flow in the wetland is laminar theReynolds number can be calculated using equation 61. For laminar flow the Reynolds number has to beless than 10.
NR = — £ (61)w
where: N R = Reynolds number [-];v = Darcy's velocity [m/s] = ks * s;Dm = Diameter of void spaces in media, taken as the equal size of the media [m];TW = kinematic viscosity of water [m2/s];
The Reynolds number is 1.86, so the flow in the wetland is laminar.
6. Layout of WetlandIn the above the depth, the surface area, the width and the length of the wetland are determined. Inorder to guarantee enough freedom in operation of the wetland, the wetland has to be divided in severalparallel cells. Grouping is shown in figure 30. Storage is not designed in this study.
The strip of land between the River Cauca and the River Fraile 450m wide, the inlet of the wastewateris at the South-Western corner, near the railway bridge, the outlet at the South-Eastern corner.
In order to increase ease of operation of the wetland, the wetland will be divided in several parallelcells.
The wetland will divided into 170 wetland cells with a central 50 long inlet canal border by two stripsof 10m long planted gravel bed. A level surface allows flooding for weed control and a minimum slopefor the base allows the water to pass through the bed (Cooper, 1993).
The wetland cells are grouped in 17 parallel units of 10 cells, each of which is served by a secondarypipeline. The units are clustered in four groups, each served by one primary pipeline.
142
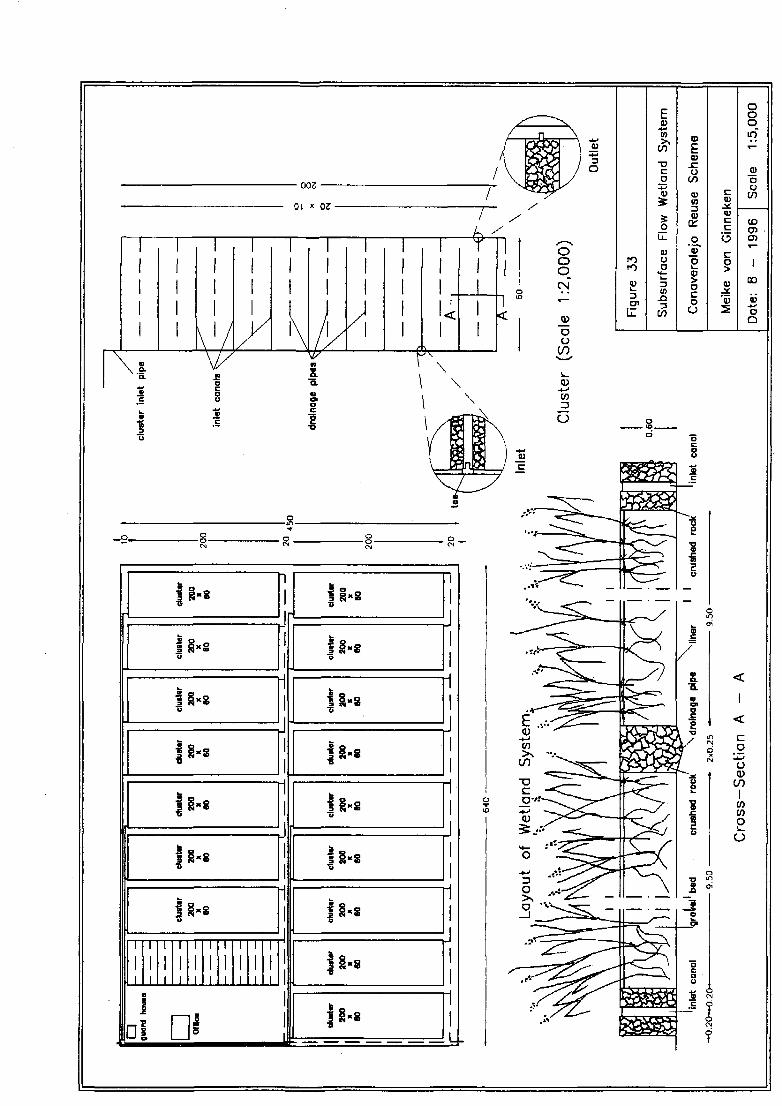
7. Structures and PipingSubsurface flow wetlands require uniform flow conditions through each cell to achieve the expectedperformance. A number of different inlet designs have been used.
A small to moderate-sized system can have manifold pipes, extending the full width of the cell, for bothinlet and outlets. In larger systems concrete inlet and outlet structures can be used.
An above-surface inlet manifold provides access for adjustment, cleaning, and control. This manifoldtypically consists of suitable-sized pipes 100-200 mm in diameter, with a "tee" placed in the line every3 meter. These "tees" are attached to the line with O-rings and area adjustable: the operator can moveeach "tee" through a vertical arc and thereby visually adjust and equalize the flow from each. Anotheralternative inlet arrangement is to pipe the feel into a "V-shaped" wedge formed by the sloping sidewall and the vertical wall of the gabion. Using a weir for flow distribution is not recommended, sincethese are expensive to construct and maldistribution of flow is often caused by material collecting onthe edges (Cooper, 1993; Reed, 1995).
The effluent manifold for a subsurface flow wetland is typically a perforated pipe laid on the bottom ofthe bed at the outlet end of the cell. In some cases this outlet manifold is laid in a shallow, rock filledtrench slightly below the bottom of the wetland cell to allow for complete drainage. Larger systemstypically have concrete outlet structures containing a weir or similar device; the devices should beadjustable, to permit control of the water level in the cell (Reed et al, 1995).
The design of inlet and outlet structures is based on local experience and varies from country tocountry. Some examples are shown in the following drawings, which are derived from the followingsources: Watson et al.(1989), Davies et al. (1993), Lekven et al.(1993), Cooper (1993), Brix (1993),and Reed et al. (1995).
8. Performance of Wetland
BOD removalThe BOD-concentration in the effluent is 9 mg/1. This concentration is obtained from the first-orderplugflow equations 45 and 47, using the reaction factor given in equation 48, and the surface areacalculated for nitrogen removal.
TSS removalThe removal of suspended solids (TSS) is not likely to be the limiting design parameter for sizing thewetland, since TSS removal is vary rapid as compared to removal of either BOD or nitrogen (Reed etal., 1995). The effluent TSS concentration of the wetland area is 14 mg/ (equation 62).
Ce = C0*(0.1058 + 1.1*10-s*AVLf?) (62)
Pathogen removalA four log removal of faecal coliforms results in an effluent concentration of 300 coli per liter.Complete removal of helminth eggs is achieved. Pathogen removal is based on removal in sandfiltration beds and waste stabilization ponds. Removal of pathogens in wetlands is based on filtration,sedimentation and die-off. The information on pathogens removal in wetlands is very limited, Rivera etal. (1995) observed varying pathogen removals, put the number of helminth eggs was below levels ofdetection in subsurface flow wetland effluent.
Reed et al. (1995) suggest using the pathogen removal equations of waste stabilization ponds. These
144
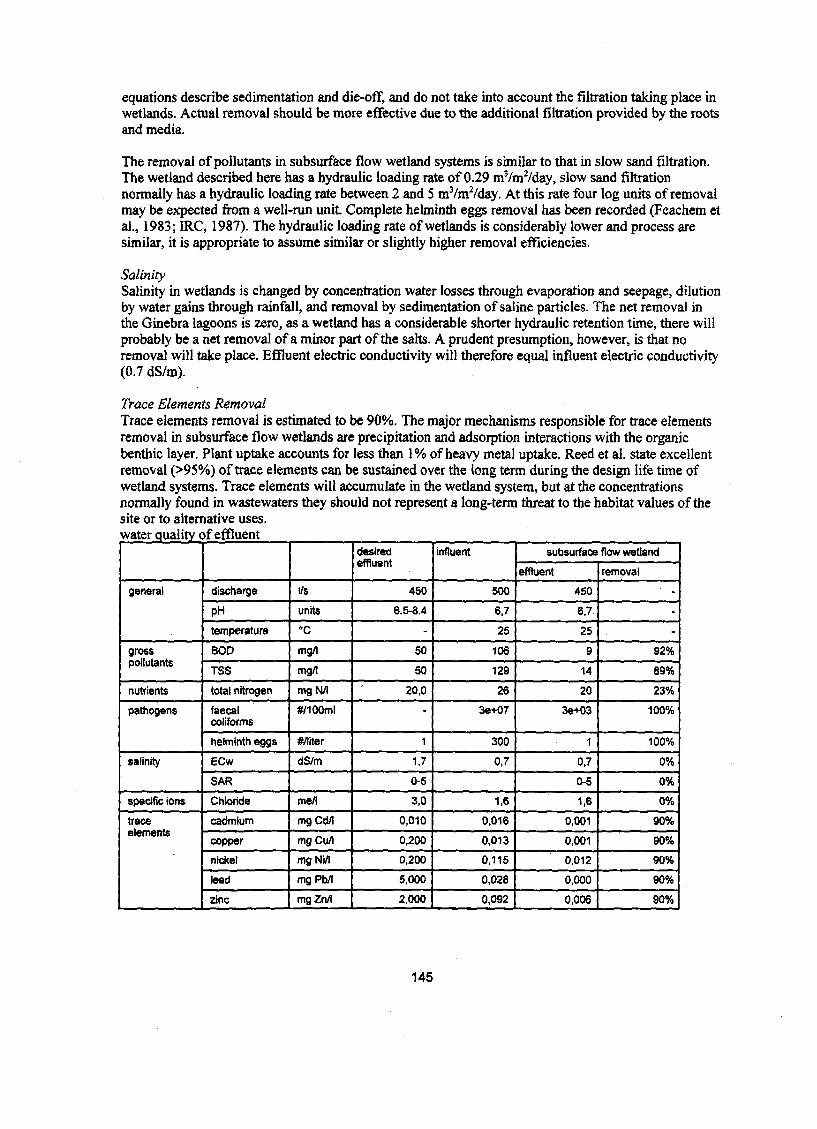
equations describe sedimentation and die-off, and do not take into account the filtration taking place inwetlands. Actual removal should be more effective due to the additional filtration provided by the rootsand media.
The removal of pollutants in subsurface flow wetland systems is similar to that in slow sand filtration.The wetland described here has a hydraulic loading rate of 0.29 m3/m2/day, slow sand filtrationnormally has a hydraulic loading rate between 2 and 5 m3/m2/day. At this rate four log units of removalmay be expected from a well-run unit Complete helminth eggs removal has been recorded (Feachem etal., 1983; IRC, 1987). The hydraulic loading rate of wetlands is considerably lower and process aresimilar, it is appropriate to assume similar or slightly higher removal efficiencies.
SalinitySalinity in wetlands is changed by concentration water losses through evaporation and seepage, dilutionby water gains through rainfall, and removal by sedimentation of saline particles. The net removal inthe Ginebra lagoons is zero, as a wetland has a considerable shorter hydraulic retention time, there willprobably be a net removal of a minor part of the salts. A prudent presumption, however, is that noremoval will take place. Effluent electric conductivity will therefore equal influent electric conductivity(0.7 dS/m).
Trace Elements RemovalTrace elements removal is estimated to be 90%. The major mechanisms responsible for trace elementsremoval in subsurface flow wetlands are precipitation and adsorption interactions with the organicbenthic layer. Plant uptake accounts for less than 1% of heavy metal uptake. Reed et al. state excellentremoval (>95%) of trace elements can be sustained over the long term during the design life time ofwetland systems. Trace elements will accumulate in the wetland system, but at the concentrationsnormally found in wastewaters they should not represent a long-term threat to the habitat values of thesite or to alternative uses.water quality of effluent
general
grosspollutants
nutrients
pathogens
salinity
specific ions
traceelements
discharge
PH
temperature
BOD
TSS
total nitrogen
faecalconforms
helminth eggs
ECw
SAR
Chloride
cadmium
copper
nickel
lead
zinc
l/s
units
°C
mg/l
mg/l
mg N/l
#/100ml
#/liter
dS/m
me/I
mgCd/l
mgCu/l
mgNi/1
mgPb/l
mgZn/l
desiredeffluent
450
6.5-8.4
-
50
50
20,0
-
1
1,7
0-5
3,0
0,010
0,200
0,200
5,000
2,000
influent
500
6.7
25
106
129
26
3e+07
300
0,7
1,6
0.016
0.013
0,115
0,028
0.092
subsurface flow wetland
effluent
450
6,7
25
9
14
20
3e+03
1
0,7
0-5
1,6
0,001
0,001
0,012
0,000
0,006
removal1 -
-
-
92%
89%
23%
100%
100%
0%
0%
0%
90%
90%
90%
90%
90%
145

9. Costs and Benefits
Investments costs of a subsurface flow wetland (US$4,400,000) are 50% higher than those of a pondsystem (US$2,900,0000). This is mainly due to the high price of gravel and the larger surface areaoccupied by the wetland. Table 53 presents a rough estimates of the investment costs of a subsurfaceflow wetland. The integration of storage reservoir, and resulting elevation of the complete system is nottaken into account. The costs for structures, piping, and facilities are presumed to be the same as thoseof the pond system.
Table 53: Investmentsitem
Land acquisition
Building of wetlands
excavation
liner
clearing and grubbing
gravel
Structures/piping
Facilities
TOTAL
of subsurface flowunit
m2
m3
m2
ha
m3
wetlandunit cost
$10
$3
$1
$493
$14
amount
230,000
50,000
160,000
20
100,000
price
$2,300,000
$150,000
$170,000
$10,000
$1,400,000
$180,000
$170,000
$4,400,000
146
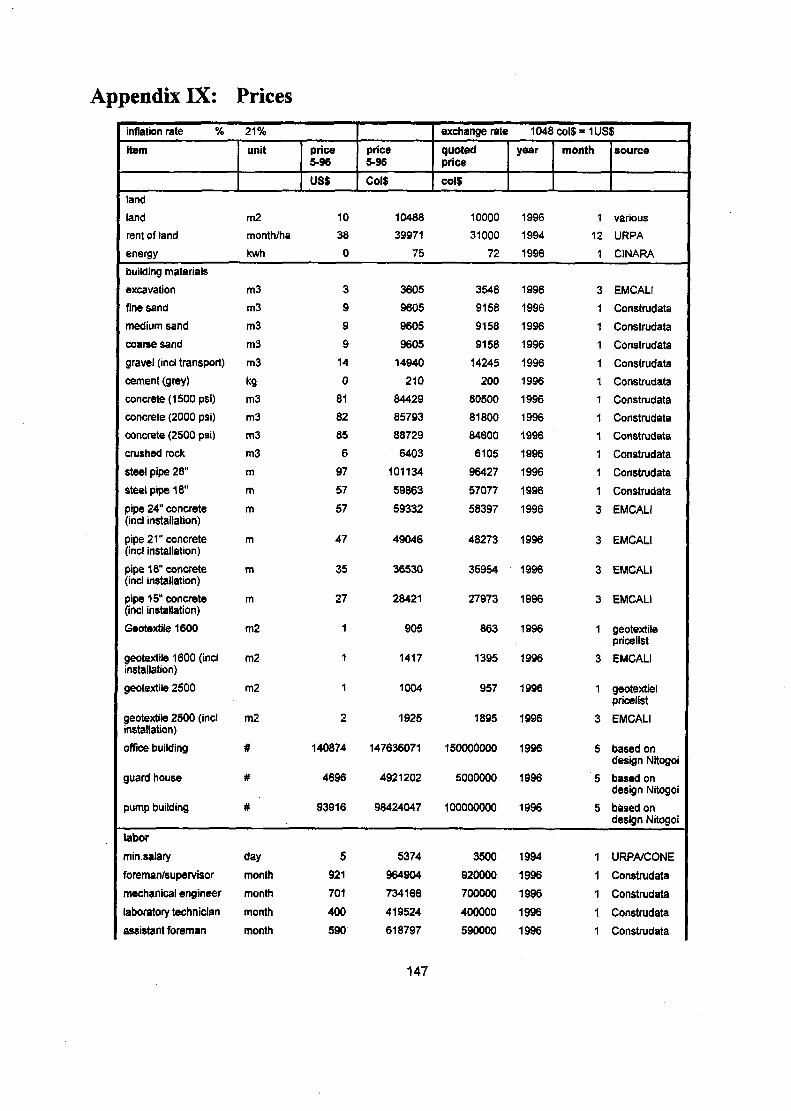
Appendix IX: Pricesinflation rate %
item
land
land
rent of land
energy
building materials
excavation
fine sand
medium sand
coarse sand
gravel (incl transport)
cement (grey)
concrete (1500 psi)
concrete (2000 psi)
concrete (2500 psi)
crushed rock
steel pipe 28"
steel pipe 18"
pipe 24" concrete(incl installation)
pipe 21" concrete(incl installation)
pipe 18" concrete(incl installation)
pipe 15" concrete(incl installation)
Geotextile 1600
geotextile 1600 (inclinstallation)
geotextile 2500
geotextile 2500 (inclinstallation)
office building
guard house
pump building
labor
min.salary
foreman/supervisor
mechanical engineer
laboratory technician
assistant foreman
21%
unit
m2
month/ha
kwh
m3
m3
m3
m3
m3
kgm3
m3
m3
m3
m
m
m
m
m
m
m2
m2
m2
m2
#
#
#
day
month
month
month
month
price5-96
US$
10
38
0
3
9
9
9
14
0
81
82
85
6
97
57
57
47
35
27
1
1
1
2
140874
4696
93916
5
921
701
400
590
price5-96
Col$
10488
39971
75
3605
9605
9605
9605
14940
210
84429
85793
88729
6403
101134
59863
59332
49046
36530
28421
905
1417
1004
1925
147636071
4921202
98424047
5374
964904
734166
419524
618797
exchange rate
quotedprice
col$
10000
31000
72
3548
9158
9158
9158
14245
200
80500
81800
84600
6105
96427
57077
58397
48273
35954
27973
863
1395
957
1895
150000000
5000000
100000000
3500
920000
700000
400000
590000
1048col$ = 1US5
year
1996
1994
1996
1996
1996
1996
1996
1996
1996
1996
1996
1996
1996
1996
1996
1996
1996
1996
1996
1996
1996
1996
1996
1996
1996
1996
1994
1996
1996
1996
1996
month
1
12
1
3
1
1
1
1
1
1
1
1
1
1
1
3
3
3
3
1
3
1
3
5
5
5
1
1
1
1
1
5
source
various
URPA
CINARA
EMCALI
Construdata
Construdata
Construdata
Construdata
Construdata
Construdata
Construdata
Construdata
Construdata
Construdata
Construdata
EMCALI
EMCALI
EMCALI
EMCALI
geotextilepricelist
EMCALI
geotextielpricelist
EMCALI
based ondesign Nitogoi
based ondesign Nitogoi
based ondesign Nitogoi
URPA/CONE
Construdata
Construdata
Construdata
Construdata
147
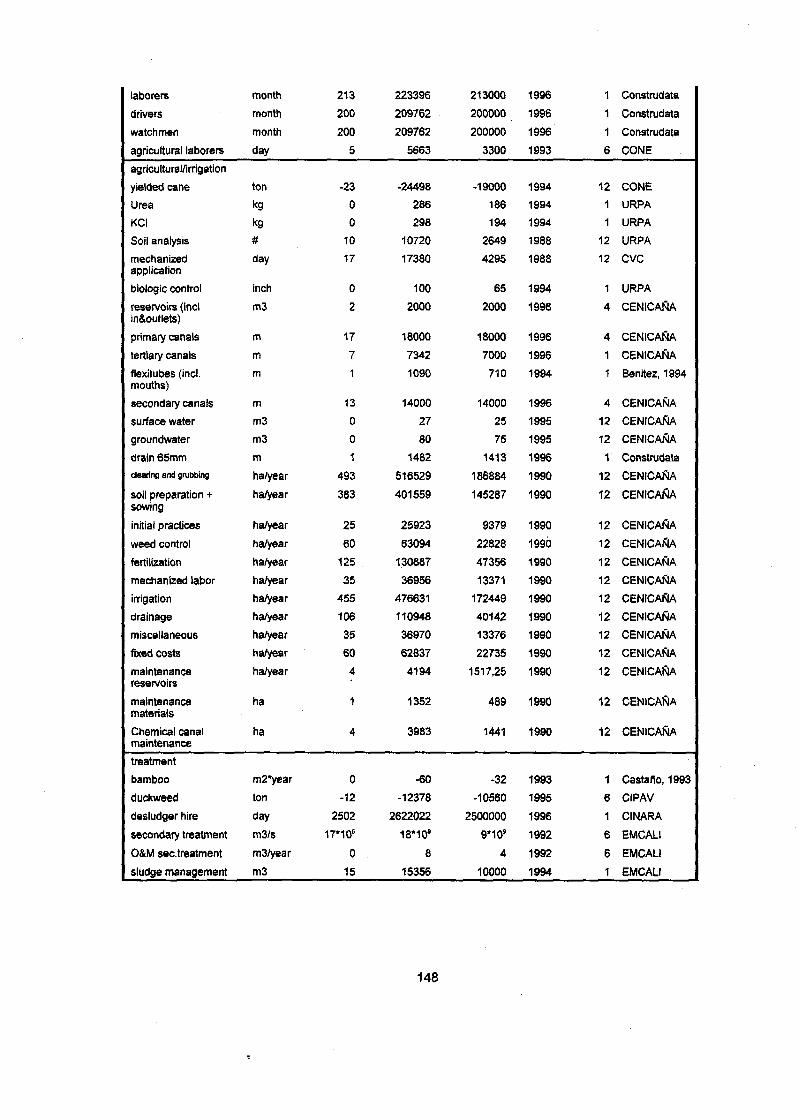
laborera
drivers
watchmen
agricultural laborers
agricultural/irrigation
yielded cane
Urea
KCI
Soil analysis
mechanizedapplication
biologic control
reservoirs (inclin&outlets)
primary canals
tertiary canals
flexitubes (inclmouths)
secondary canals
surface water
groundwater
drain 65mm
clearing and grubbing
soil preparation +sowing
initial practices
weed control
fertilization
mechanized labor
irrigation
drainage
miscellaneous
fixed costs
maintenancereservoirs
maintenancematerials
Chemical canalmaintenance
treatment
bamboo
duckweed
desludger hire
secondary treatment
O&M sec.treatment
sludge management
month
month
month
day
ton
kg
kg#
day
inch
m3
mmm
mm3
m3
mha/year
ha/year
ha/year
ha/year
ha/year
ha/year
ha/year
ha/year
ha/year
ha/year
ha/year
ha
ha
m2*year
ton
day
m3/s
m3/year
m3
213
200
200
5
-23
0
0
10
17
0
2
17
7
1
13
0
0
1
493
383
25
60
125
35
455
106
35
60
4
1
4
0
-12
2502
17*106
0
15
223396
209762
209762
5663
-24498
286
298
10720
17380
100
2000
18000
7342
1090
14000
27
80
1482
516529
401559
25923
63094
130887
36956
476631
110948
36970
62837
4194
1352
3983
-60
-12378
2622022
18*10'
8
15356
213000
200000
200000
3300
-19000
186
194
2649
4295
65
2000
18000
7000
710
14000
25
75
1413
186884
145287
9379
22828
47356
13371
172449
40142
13376
22735
1517,25
489
1441
-32
-10560
2500000
9*10s
4
10000
1996
1996
1996
1993
1994
1994
1994
1988
1988
1994
1996
1996
1996
1994
1996
1995
1995
1996
1990
1990
1990
1990
1990
1990
1990
1990
1990
1990
1990
1990
1990
1993
1995
1996
1992
1992
1994
1
1
1
6
12
1
1
12
12
1
4
4
1
1
4
12
12
1
12
12
12
12
12
12
12
12
12
12
12
12
12
1
6
1
6
6
1
Construdata
Construdata
Construdata
CONE
CONE
URPA
URPA
URPA
CVC
URPA
CENICAÑA
CENICAÑA
CENICAÑA
Benitez, 1994
CENICAÑA
CENICAÑA
CENICAÑA
Construdata
CENICAÑA
CENICAÑA
CENICAÑA
CENICAÑA
CENICAÑA
CENICAÑA
CENICAÑA
CENICAÑA
CENICAÑA
CENICAÑA
CENICAÑA
CENICAÑA
CENICAÑA
Castaño, 1993
CIPAV
CINARA
EMCALI
EMCALI
EMCALI
148

COMMUNICATION OF THE DEPARTMENT OF WATER MANAGEMENT, ENVIRONMENTAL ANDSANITARY ENGINEERING
In the series "Communication of the Department of Water Management, Environmental and Sanitary Engineering"aie edited:
1. Siebers, H.H.: Patterns and variability of phosphate and heavy metals in sediments of two shallow lakes.(November 1985)
2. Flipse, MJ. en Heide, J. van der: Ontwikkelingen met betrekking tot vaste afvalstoffen ex art. 4, 17, 25, 26van de Afvalstoffenwet in période van ca. 1980 tot 1985.
3. Kop, J.H.: Planvorming voor de drinkwatervooiziening. (februari 1986)
4. Blanken, J.G. den en Hoogh, M.P.AJ. de: Modellen voor desinfectie van gezuiverd afvalwater met chloor enozon.
5. Kop, J.H.: Het probleem van de wederzijdse afstemming van de belangen van drinkwatervooiziening enmilieubescherming bij de planning voor de winning van zoet grondwater. (augustus 1986)
6. Boekehnan, R.H. en Nîet, H. de: Het berekenen van modelkrommen voor Geo-ekktrische metingen.
7. Vos, W.L., Douze, M. and Buiteveld, H.: On the reflectance spectrum of algae in water: the nature of thepeak at 700 nm and its shift with varying algal concentration. (October 1986)
8. Sink, D., Mameren, HJ . van en Veldkamp, R.G.: De zuurstofhuishouding van de Utrechtse Vecht.(november 1986)
9. Heide, J. van der: Kinetische modellen voor ontwerp en beheer van actief-slib-installaties deel 1 en 2.(februari 1987)
10. Boulan, R.P., Douze, M. en Khpwjjk Sj.P.: Fosfaatbalans van de polder Reeuwijk en een aantaldeelgebieden. (maart 1987)
11. Groot, C.P.M. de en Breemen, A.N. van: Ontspanningsflotatie en de bereiding van drinkwater. (juli 1987)
12. Blanken, J.G. den en Hoogh, M.P.AJ. de: Modelvorming voor verwijdering van indicatororganismen in hetactief-slibproces.
13. Mishra, K.K. and Breemen, A.N. van: Gravel-bed flocculatjon.
14. VKs, E. van der: De filtratjetheorie. (maart 1988)
15. Koreman, E.A. en Breemen, A.N. van: Toepassing van het vrïesdooiproces bij de ontwatering vancoagulatieslib. (mei 1988)
16. Ganzevles, P.P.G., Kop, J.H. en Ywema, R.: Materiaalkeuze afvalwaterleidingcn. (juni 1988)
17. Nkwwenhuyze, R.F. van, Stokman, G.N.M., Kiujper, R., Gerritsen, J.J. en Donze, M.: Detectie vanproceswater met behulp van thennische remote-sensing, (juni 1988)
18. Blanken, J.G. den en Hoogh, M.P.AJ. de: Modelvorming voor een goede procesregeling van de desinfectiemet chloor c.q. ozon aan de hand van instelbare en/of direct meetbare variabelen. (augustus 1988)
19. Noppeney, R.M.: De invloed van stagnante zones op dispersie. (november 1988)
20. Noppeney, R.M.: Gevoeligheidsonderzoek Alannmodel Rijn; De invloedslengte van samenvloeiingen bijdispersie. (november 1988)
21. Noppeney, R.M.: De verspreiding van olie op rivieren benaderd met het Taylor-model, (november 1988)
22. Noppeney, R.M.: De invloed van near-field processen op een far-field dispersie beschrijving. (november 1988)
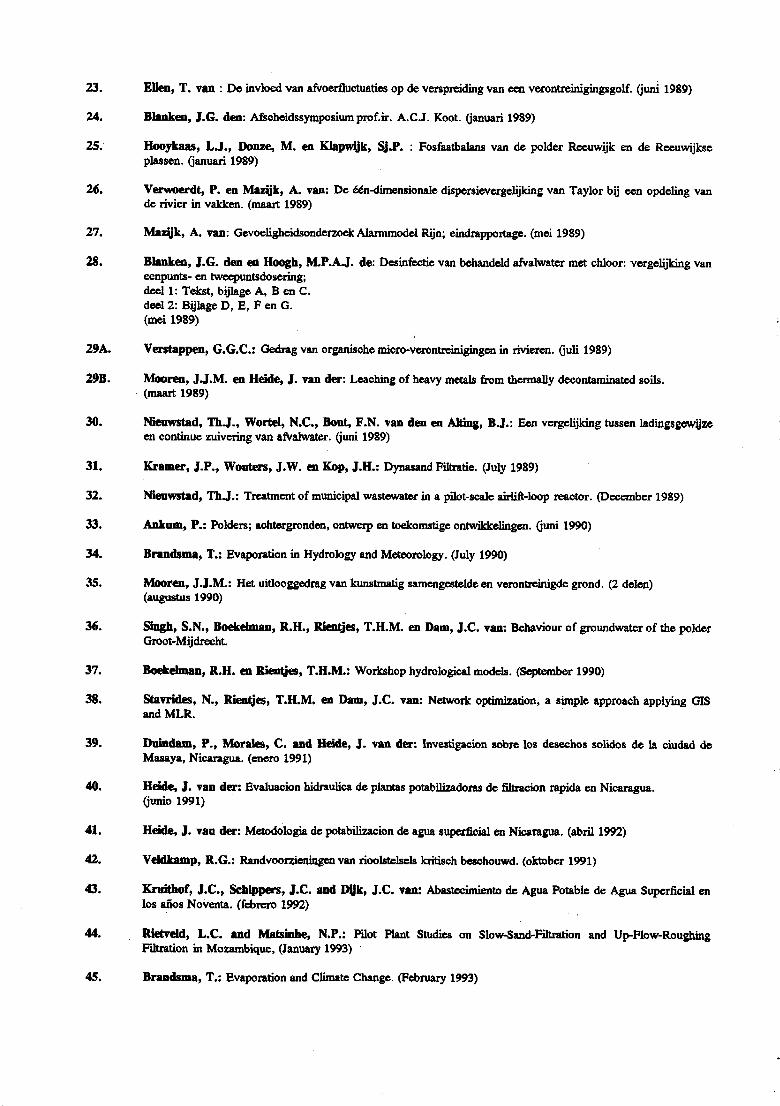
23. Ellen, T. van : De invloed van afvoerfluctuaties op de verspreiding van een verontreinigingsgolf. (juni 1989)
24. Blanken, J.G. den: Afscheidssymposium prof.ir. A.C.J. Koot. (januari 1989)
25. Hooykaas, L J . , Donze, M. en Klapwjjk, Sj.P. : Fosfaatbalans van de polder Recuwijk en de Reeuwijkscplassen. (januari 1989)
26. Verwoerdt, P. en Mazjjk, A. van: De éen-dimensionale dispersievergelijking van Taylor bij een opdeling vande rivier in vakken. (maart 1989)
27. Mazyk, A. van: Gevoeligheidsonderzoek Alarmmodel Rijn; eindrapportage. (mei 1989)
28. Blanken, J.G. den en Hoogb, M.P.AJ. de: Desinfectie van behandeld afvalwater met chloor: vergelijking vaneenpunts- en tweepuntsdosering;deel 1: Tekst, bijlage A, B en C.deel 2: Bijlage D, E, F en G.(mei 1989)
29A. Verstappen, G.G.C.: Gedrag van organische micro-verontreinigingen in rivieren. (juli 1989)
29B. Mooren, JJ.M. en Heide, J. van der: Leaching of heavy metals from thermally decontaminated soils,(maart 1989)
30. Nieuwstad, ThJ., Wortel, N.C., Bout, F.N. van den en Altíng, BJ.: Een vergelijking tussen ladingsgewijzeen continue zuivering van afvalwater. (juni 1989)
31. Kramer, J.P., Wouters, J.W. en Kop, J.H.: Dynasand Filtratie. (July 1989)
32. Nieuwstad, ThJ.: Treatment of municipal wastewater in a pilot-scale airlift-loop reactor. (December 1989)
33. Ankum, P.: Polders; achtergronden, ontwerp en toekomstige ontwikkelingen. (juni 1990)
34. Brandsma, T.: Evaporation in Hydrology and Meteorology. (July 1990)
35. Mooren, J.J.M.: Het uitlooggedrag van kunstmatig samengestelde en verontreinigde grond. (2 delen)(augustus 1990)
36. Singh, S.N., Boekehnan, R.H., Rienljes, T.H.M. en Dam, J.C. van: Behaviour of groundwater of the polderGroot-Mijdrecht.
37. Boekehnan, R.H. en Rienljes, T.H.M.: Workshop hydrological models. (September 1990)
38. Stavrides, N., Rienljes, T.H.M. en Dam, J.C. van: Network optimization, a simple approach applying GISand MLR.
39. Duindam, P., Morales, C. and Heide, J. van der: Investigación sobre los desechos solidos de la ciudad deMasaya, Nicaragua, (enero 1991)
40. Heide, J. van der: Evaluación hidráulica de plantas potabilizadoras de filtración rápida en Nicaragua,(junio 1991)
41. Heide, J. van der: Metodologia de potabilizacion de agua superficial en Nicaragua, (abril 1992)
42. YeUkamp, R.G.: Randvoorzieningen van rioolstelsels kritisch beschouwd. (oktober 1991)
43. Kruithof, J.C., Schippers, J.C. and Dyk, J.C. van: Abastecimiento de Agua Potable de Agua Superficial enlos años Noventa, (febrero 1992)
44. Rietvdd, L.C. and Matsinhe, N.P.: Pilot Plant Studies on Slow-Sand-Filtration and Up-Flow-RoughingFiltration in Mozambique, (January 1993)
45. Brandsma, T.: Evaporation and Climate Change. (February 1993)

46. Oude Essink, G.H.P.: Sea Level Rise: What are the causes of temperature changes and how is sea level riserelated to temperature rise both in the past and in the fiiture?; a literature survey. (July 1992)
47. Xbodi Hao and Nieuwstad, ThJ.: Feasibility of simultaneous nitrification and denitrification in a pilot-scaleairlift-loop reactor. (June 1993)
48. Brandsma, T.: Sewer Systems and Climate Change. (September 1993)
49. Ankum, P. and Brouwer, R.: Nevengeulen en Sedimentverdeling. (November 1993)
50. Brouwer, R.: Review of the water management systems in the Gujarat Medium Irrigation II Project. (August1993)
51. Hoornstra, J.S. and Jong, J. de: Water quality management in the Netherlands. (October 1993)
52. Jong, J. de: Third policy document on water management (June 1993)
53. Jong, J. de and Hoornstra, J.S.: Analyse der anforderungen im EG-bereich (October 1993)
54. Jong, J. de, Baarsma, J.P., Frintrop, P.C.M. and Mulder, W.H.: Screening strategies for organicmicropoUutants in context with water pollution control. (October 1993)
55. Jong, J. de: The method and mechanisms of establishing consensus on water management policy in theNetherlands. (October 1993)
56. Dtfk, M.J. van and Rienljes, T.H.M.: Geostatistics and Hydrology; part 1: Spatial and Temporal Variability.(September 1993)
57. Djjk, M J . van and Rienljes, T.H.M.: Geostatistics and Hydrology; part 2: Estimation Techniques. (November1993)
58. Dyk, M J . van and Rienljes, T.H.M.: Raingauge network optimization and GIS; a case study of the ManangaBasin. (October 1993)
59. Dtfk, M J . van and Rienljes, T.H.M.: Geostatistics and Hydrology; part 3: Hydro-Meteorological NetworkDesign. (May 1994)
60. Nieuwstad, ThJ.: Modellering van eco internal-loop airlift reactor Watersndheid en gas- en deeltjesfracties.(JuU 1994)
61. Koning, J. de: Cyaniden - eigenschappen, analyse en behandeling van cyanidehoudend afvahvater. (oktober1994)
62. Koning, J. de: Meetrapport bij bet onderzoek naar de gekombineeide behandeling van met hexacyanoferraatverontreinigd grondwater en stedelijk afvatwater. (oktober 1994)
63. Buuren, J.C.L. van and Hdde, J. van der: Abatement of the Water Pollution in the Inrulene Basin; FinalReport. (February 1995)
64. Blanken, J.G. den: Modellering (effluent)filtratie. (augustus 1995)
65. Ankum, P.: Flow Control in Irrigation and Drainage. (June 1995)
66. Leeflang, M J . and Monster, NJ.: On the design of percolation facilities. (June 1996)
67. Ankum, P.: Reference Evapo-transpiration. (June 1996)
68. Visser, S J . and Loog, ir. M.P.A.M. van de: Onderhoud-begrotingssystemen in het Nederlandse waterbeheer.(augustus 1996)
69. Ankum, P.: Polders, Drainage and Flood Control. (October 1996)