water in foods - courses server - penn state -water.pdf · water in foods 1. the structure of water...
TRANSCRIPT

13
Water in Foods 1. The structure of water and solutions
a) Bulk Properties of Solutions Probably the main bulk property of a solution we can readily vary in foods is pH (=-log10[H+]). The pH of most foods is in the range 3-7. The pH is important as it alters the structure of molecules present, by either protonating or deprotonating the ionizable groups. The main protonation/deprotonation reactions we are interested in involve carboxylic acid and amine groups:
R-COOH R-COO- + H+ R-NH3
+ R-NH2 + H+ As the reaction proceeds, the charge on the carboxylic acid will change from zero to -1 and the charge on the amine from +1 to zero. Qualitatively we can see that as the pH drops ([H+] increases) the reactions will be forced to the left hand side. However different functional groups have different affinity for protons that can be expressed quantitatively in terms of the equilibrium constant of the reaction. So for a general protonation reaction:
AH A- + H+
K= [A-][H+]/[AH] = [A-]/[AH] * [H+] Taking negative logs of both sides we get the Henderson Hasselbach equation:
pH=pKa+ log [A-]/[HA] The Henderson Hasselbach equation can tell us the ratio of protonated to deprotonated groups (i.e., -COOH and –COO- for a carboxylic acid or –NH3
+ and –NH2 for an amine) as a function of pH and the pK of that particular functional group. Plotting the concentration of both molecules as a function of pH we get a characteristic sigmoidal shape with [protonated]=[deprotonated] at pH=pK. The concentration ratio changes rapidly around the pK, but more than 2 pH units above and below changes in pH will not affect the ratio.

14
0%
50%
100%
0 2 4 6 8 10 12
pH
Per
cent
age
of c
ompo
nent Protonated form
Deprotonatedform
Figure 1: Characteristic acid-base dissociation for a pK=5 salt calculated using the Henderson-Hasselbach equation.
Example: Vinegar is acetic acid solution. It deprotonates according to the following reaction with a pK of 4.74
CH3-COOH = CH3-COO- + H+
If we made a meat sauce containing acetic acid and ended up with a 1 M solution at pH 5, what proportion of species would be present? Calculate the ratio of species using the Henderson Hasselbach equation:
5=4.74+ log [A-]/[HA]…A-/HA=100.26 = 1.81
Calculate the sum of the deprotonated and protonated forms equal to the total amount of acetic acid present:
[Acetic Acid] = {A-]+{HA]=1
Solve for the concentration of each species: 1.81 HA + HA =1 [HA]=1/2.81 = 0.35, 35% so [A-]=65%
15
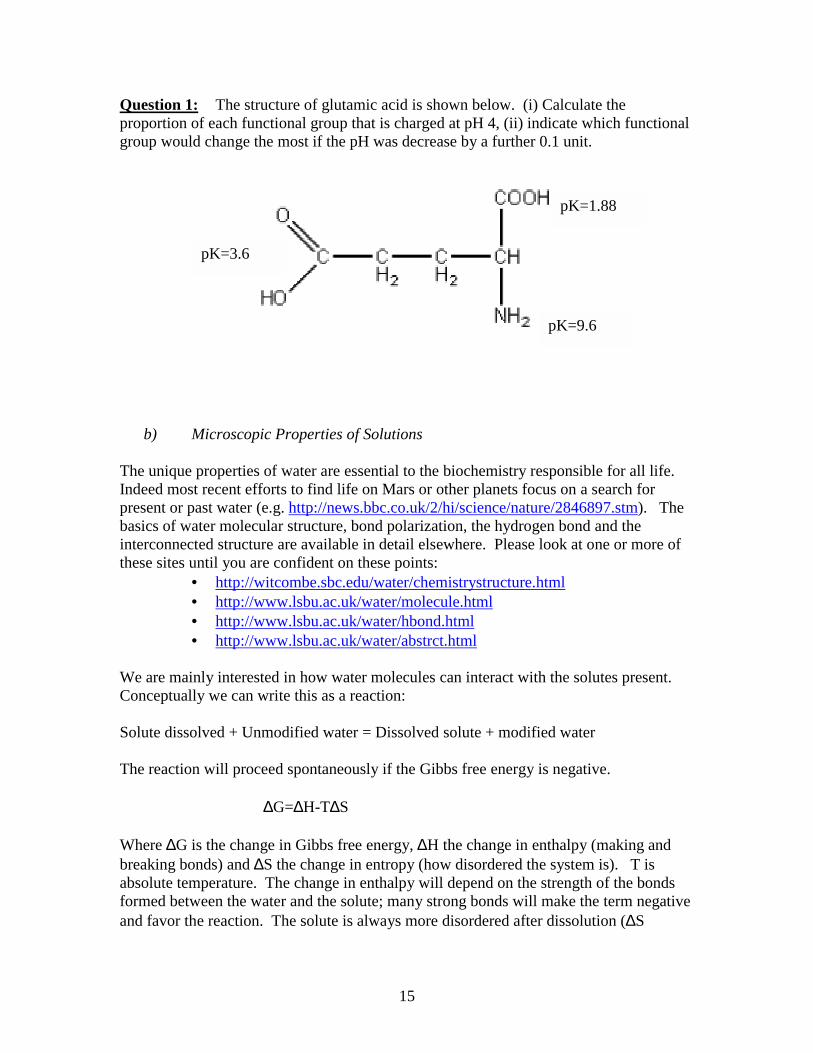
Question 1: The structure of glutamic acid is shown below. (i) Calculate the proportion of each functional group that is charged at pH 4, (ii) indicate which functional group would change the most if the pH was decrease by a further 0.1 unit.
b) Microscopic Properties of Solutions The unique properties of water are essential to the biochemistry responsible for all life. Indeed most recent efforts to find life on Mars or other planets focus on a search for present or past water (e.g. http://news.bbc.co.uk/2/hi/science/nature/2846897.stm). The basics of water molecular structure, bond polarization, the hydrogen bond and the interconnected structure are available in detail elsewhere. Please look at one or more of these sites until you are confident on these points:
• http://witcombe.sbc.edu/water/chemistrystructure.html • http://www.lsbu.ac.uk/water/molecule.html • http://www.lsbu.ac.uk/water/hbond.html • http://www.lsbu.ac.uk/water/abstrct.html
We are mainly interested in how water molecules can interact with the solutes present. Conceptually we can write this as a reaction: Solute dissolved + Unmodified water = Dissolved solute + modified water The reaction will proceed spontaneously if the Gibbs free energy is negative.
∆G=∆H-T∆S Where ∆G is the change in Gibbs free energy, ∆H the change in enthalpy (making and breaking bonds) and ∆S the change in entropy (how disordered the system is). T is absolute temperature. The change in enthalpy will depend on the strength of the bonds formed between the water and the solute; many strong bonds will make the term negative and favor the reaction. The solute is always more disordered after dissolution (∆S
pK=9.6
pK=1.88
pK=3.6

16
positive, -TDS negative, favoring the reaction) but the water molecules may sometimes be ordered around the solute so ∆Swater is negative and the reaction is opposed. For an ionic solute there is a strong electrostatic attraction between the permanent charge on the ion and dipole on the water molecule. The δ+ hydrogens will align towards the cations present and the δ+ oxygens towards the anions (Figure 2a). The binding of water by solutes in this way is not a permanent bond and many times weaker than a covalent linkage. An individual water molecule will diffuse in and out of proximity to the solute many times a second but there is a net accumulation as shown in the Figure. There is a limited amount of water that can bind to any charge present but there may also be a secondary alignment of water molecules bonded to the orientated dipoles of the first shell water. The ion-dipole attractions for an ionic solvent are very strong and allow most charged materials to readily interact with and dissolve in water. For a polar but uncharged solute the interactions are weaker. They may include hydrogen bonding to the water or dipole-dipole interactions (Figure 2b). Although relatively weak these interactions are usually enough to allow polar materials to dissolve in water
Figure 2a: Water molecules orientated in multilayers around a positive ion.
Figure 2b: Water molecules bound to an uncharged polar solvent by hydrogen bonds and dipole-dipole interactions.
Non-polar molecules can only weakly interact with water through dipole-induced dipole bonds. The water instead forms a tightly hydrogen-bonded cage (a clathrate cage) around the nonpolar molecule, bonding tightly to itself to avoid contact. The important net effect of dissolving a nonpolar molecule is to increase the organization of water molecules. This is an entropy cost for the water and means the dissolution reaction does not proceed. The “cost” of bringing a nonpolar molecule into solution is proportional to the number of water molecules ordered around it and hence the solute surface area. For example, small alcohols (e.g., ethanol) are very water soluble because the strong hydrogen bonding with the –OH group offsets the cost of forming a clathrate cage around the hydrocarbon portion of the molecule while larger alcohols (e.g., decanol) are water insoluble because many more water molecules must orientate around the long nonpolar portion of the molecule.

17
The drive to minimize the area of contact between nonpolar materials and water means they will tend to attract one another in solution and aggregate. Some examples are illustrated in Figure 3.
Figure 3: Examples of consequences of the hydrophobic effect (not to scale – a typical surfactant is in the order of 0.1 nm, a globular protein 2-3 nm, an oil droplet 1000 nm). (a) Oil droplets in water are spherical (minimize surface area) and will tend to coalesce if not prevented. (b) A protein is a chain or more or less polar amino acids. It will coil in solution to hide the less polar groups in the core out of contact with water. An amphiphile is a molecule with part of its structure polar and part non polar (e.g., lecithin, many proteins). (c) Some small molecules can form supramolecular assemblies in water (e.g., micelles or membranes). (d) Most amphiphiles will tend to align at surfaces (e.g., oil/water, air/water), again to bring their nonpolar portions out of contact with water.
18
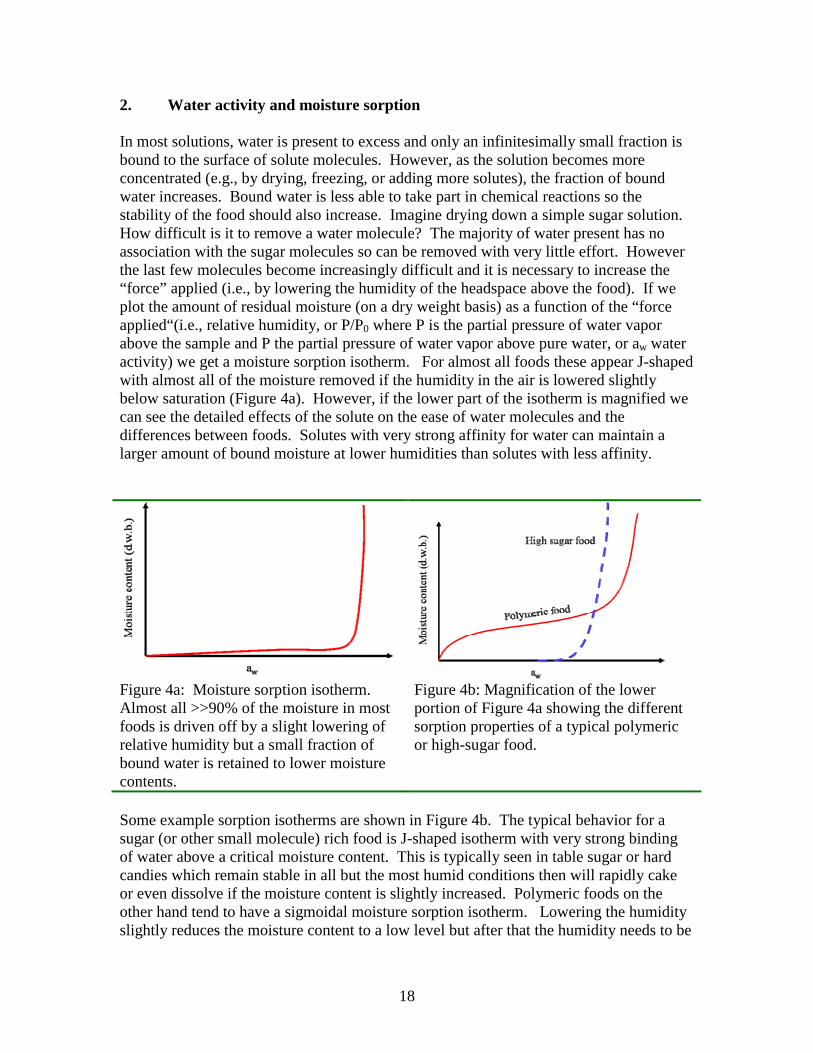
2. Water activity and moisture sorption In most solutions, water is present to excess and only an infinitesimally small fraction is bound to the surface of solute molecules. However, as the solution becomes more concentrated (e.g., by drying, freezing, or adding more solutes), the fraction of bound water increases. Bound water is less able to take part in chemical reactions so the stability of the food should also increase. Imagine drying down a simple sugar solution. How difficult is it to remove a water molecule? The majority of water present has no association with the sugar molecules so can be removed with very little effort. However the last few molecules become increasingly difficult and it is necessary to increase the “force” applied (i.e., by lowering the humidity of the headspace above the food). If we plot the amount of residual moisture (on a dry weight basis) as a function of the “force applied“(i.e., relative humidity, or P/P0 where P is the partial pressure of water vapor above the sample and P the partial pressure of water vapor above pure water, or aw water activity) we get a moisture sorption isotherm. For almost all foods these appear J-shaped with almost all of the moisture removed if the humidity in the air is lowered slightly below saturation (Figure 4a). However, if the lower part of the isotherm is magnified we can see the detailed effects of the solute on the ease of water molecules and the differences between foods. Solutes with very strong affinity for water can maintain a larger amount of bound moisture at lower humidities than solutes with less affinity.
Figure 4a: Moisture sorption isotherm. Almost all >>90% of the moisture in most foods is driven off by a slight lowering of relative humidity but a small fraction of bound water is retained to lower moisture contents.
Figure 4b: Magnification of the lower portion of Figure 4a showing the different sorption properties of a typical polymeric or high-sugar food.
Some example sorption isotherms are shown in Figure 4b. The typical behavior for a sugar (or other small molecule) rich food is J-shaped isotherm with very strong binding of water above a critical moisture content. This is typically seen in table sugar or hard candies which remain stable in all but the most humid conditions then will rapidly cake or even dissolve if the moisture content is slightly increased. Polymeric foods on the other hand tend to have a sigmoidal moisture sorption isotherm. Lowering the humidity slightly reduces the moisture content to a low level but after that the humidity needs to be
19
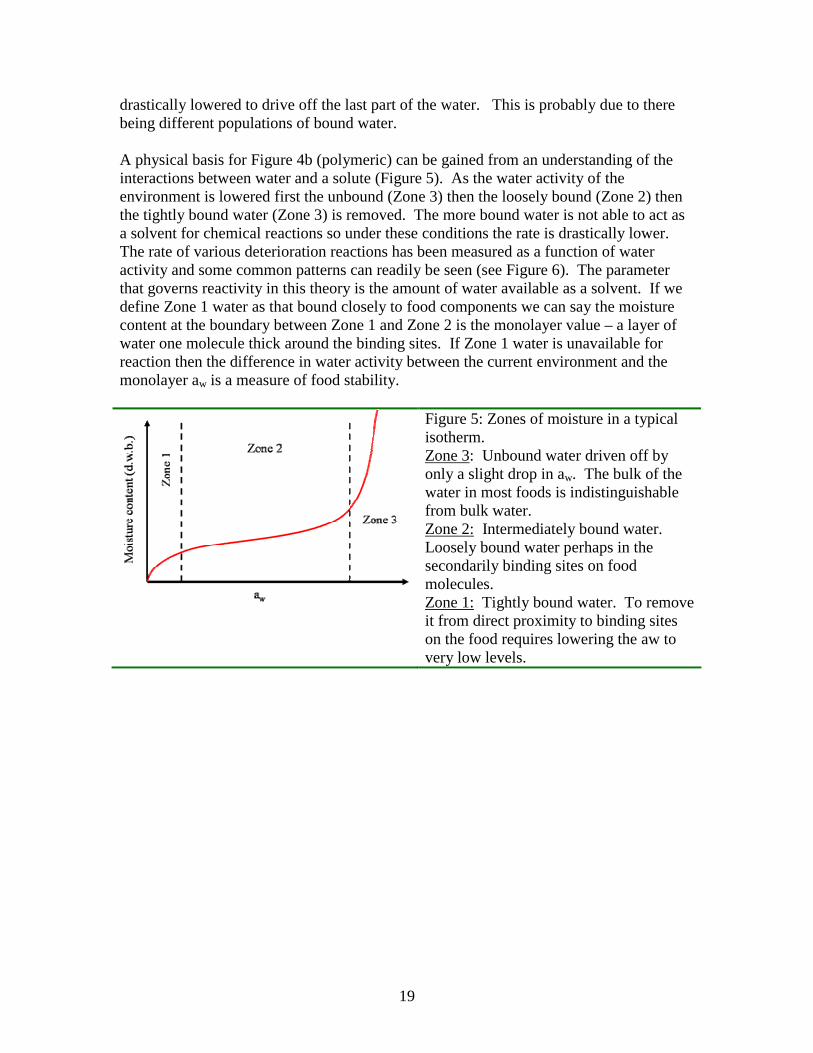
drastically lowered to drive off the last part of the water. This is probably due to there being different populations of bound water. A physical basis for Figure 4b (polymeric) can be gained from an understanding of the interactions between water and a solute (Figure 5). As the water activity of the environment is lowered first the unbound (Zone 3) then the loosely bound (Zone 2) then the tightly bound water (Zone 3) is removed. The more bound water is not able to act as a solvent for chemical reactions so under these conditions the rate is drastically lower. The rate of various deterioration reactions has been measured as a function of water activity and some common patterns can readily be seen (see Figure 6). The parameter that governs reactivity in this theory is the amount of water available as a solvent. If we define Zone 1 water as that bound closely to food components we can say the moisture content at the boundary between Zone 1 and Zone 2 is the monolayer value – a layer of water one molecule thick around the binding sites. If Zone 1 water is unavailable for reaction then the difference in water activity between the current environment and the monolayer aw is a measure of food stability.
Figure 5: Zones of moisture in a typical isotherm. Zone 3: Unbound water driven off by only a slight drop in aw. The bulk of the water in most foods is indistinguishable from bulk water. Zone 2: Intermediately bound water. Loosely bound water perhaps in the secondarily binding sites on food molecules. Zone 1: Tightly bound water. To remove it from direct proximity to binding sites on the food requires lowering the aw to very low levels.
20
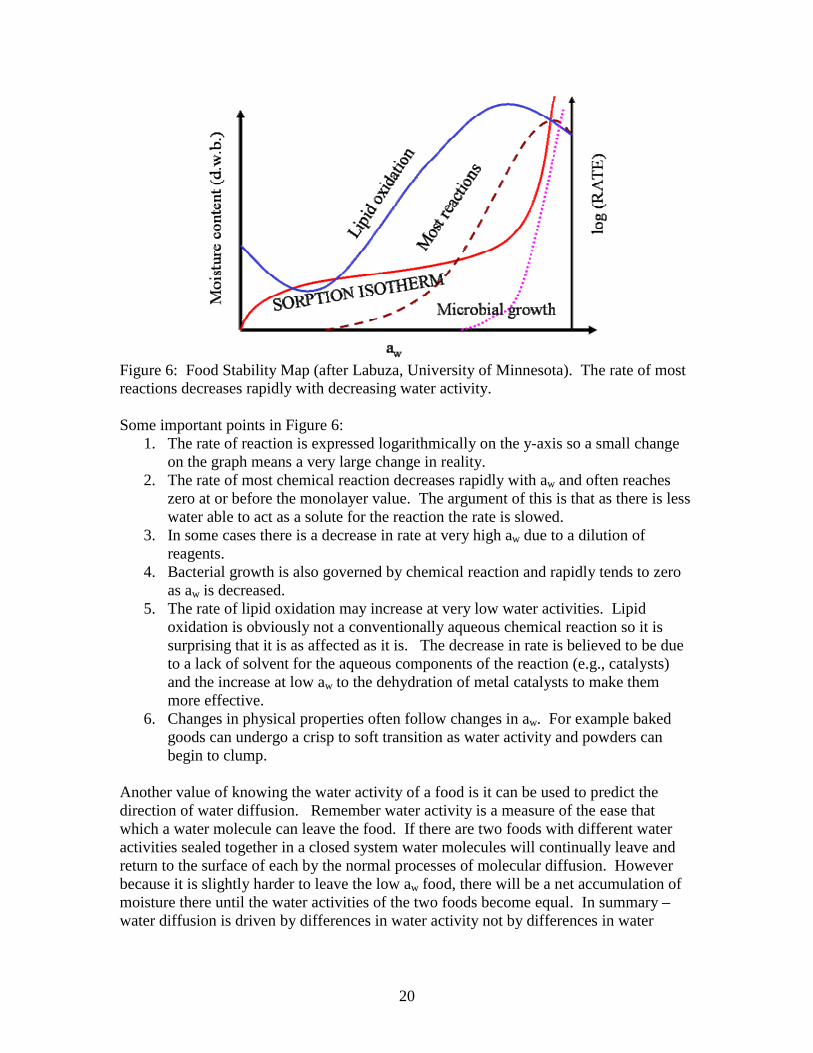
Figure 6: Food Stability Map (after Labuza, University of Minnesota). The rate of most reactions decreases rapidly with decreasing water activity. Some important points in Figure 6:
1. The rate of reaction is expressed logarithmically on the y-axis so a small change on the graph means a very large change in reality.
2. The rate of most chemical reaction decreases rapidly with aw and often reaches zero at or before the monolayer value. The argument of this is that as there is less water able to act as a solute for the reaction the rate is slowed.
3. In some cases there is a decrease in rate at very high aw due to a dilution of reagents.
4. Bacterial growth is also governed by chemical reaction and rapidly tends to zero as aw is decreased.
5. The rate of lipid oxidation may increase at very low water activities. Lipid oxidation is obviously not a conventionally aqueous chemical reaction so it is surprising that it is as affected as it is. The decrease in rate is believed to be due to a lack of solvent for the aqueous components of the reaction (e.g., catalysts) and the increase at low aw to the dehydration of metal catalysts to make them more effective.
6. Changes in physical properties often follow changes in aw. For example baked goods can undergo a crisp to soft transition as water activity and powders can begin to clump.
Another value of knowing the water activity of a food is it can be used to predict the direction of water diffusion. Remember water activity is a measure of the ease that which a water molecule can leave the food. If there are two foods with different water activities sealed together in a closed system water molecules will continually leave and return to the surface of each by the normal processes of molecular diffusion. However because it is slightly harder to leave the low aw food, there will be a net accumulation of moisture there until the water activities of the two foods become equal. In summary – water diffusion is driven by differences in water activity not by differences in water

21
content. Water diffusion in foods can limit the stability of packaged composite foods. For example moisture can diffuse between:
• a lettuce leaf and make bread in a sandwich soft • a frozen pizza topping into the crust. • The ice in ice cream and the crispy cone making it soft.
Moisture diffusion can be limited by either matching the water activities of the components of the food by adding humectants to lower the water activity of a moist component (e.g., glycerol). A good humectant should lower water activity without impacting flavor or safety of the product. It should be readily soluble and should not crystallize. Alternatively, the diffusion path can be blocked by packaging the food components separately or adding a moisture impermeable barrier between the components (e.g., cheese in a sandwich, a chocolate layer in a frozen ice cream cone). Question 2: Moisture Sorption. The moisture sorption data for pasta and pasta sauce are listed in the following table. Both materials were dried to 7% moisture and packed together (equal masses of each ingredient).
• Plot a moisture sorption isotherm for both materials on the same axis. • Would there be any moisture diffusion in this system? In which direction? Using
your sorption isotherm estimate the final moisture contents and water activities of each component?
Relative Humidity 0 0.112 0.226 0.438 0.518 0.577 0.660 0.753 0.843 0.903 Pasta (% moisture) 0 4.0 6.0 7.0 7.5 8.0 9.0 11.0 14.0 18.0 Sauce mix (% moisture) 0 1.0 3.0 14.0 18.0 23.0 28.0
22
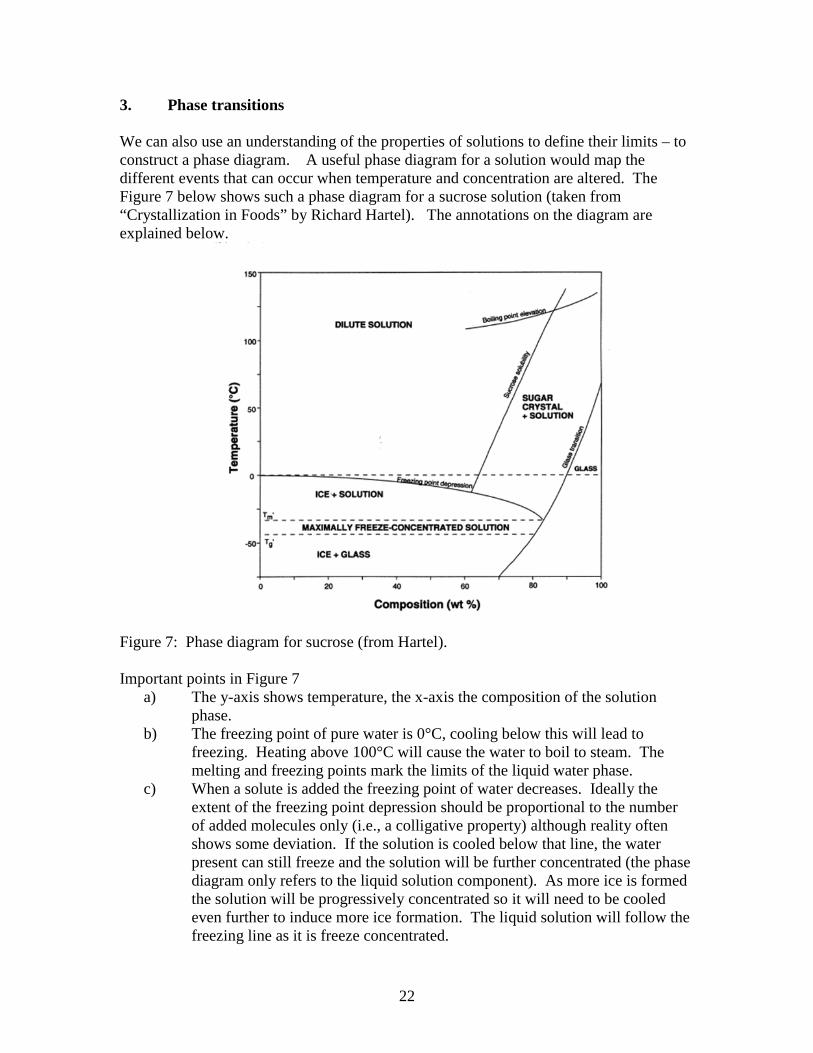
3. Phase transitions We can also use an understanding of the properties of solutions to define their limits – to construct a phase diagram. A useful phase diagram for a solution would map the different events that can occur when temperature and concentration are altered. The Figure 7 below shows such a phase diagram for a sucrose solution (taken from “Crystallization in Foods” by Richard Hartel). The annotations on the diagram are explained below.
Figure 7: Phase diagram for sucrose (from Hartel). Important points in Figure 7
a) The y-axis shows temperature, the x-axis the composition of the solution phase.
b) The freezing point of pure water is 0°C, cooling below this will lead to freezing. Heating above 100°C will cause the water to boil to steam. The melting and freezing points mark the limits of the liquid water phase.
c) When a solute is added the freezing point of water decreases. Ideally the extent of the freezing point depression should be proportional to the number of added molecules only (i.e., a colligative property) although reality often shows some deviation. If the solution is cooled below that line, the water present can still freeze and the solution will be further concentrated (the phase diagram only refers to the liquid solution component). As more ice is formed the solution will be progressively concentrated so it will need to be cooled even further to induce more ice formation. The liquid solution will follow the freezing line as it is freeze concentrated.
23
d) Similarly, when a solution is boiled only water will leave the system as pure steam. The residual solution will be progressively concentrated and the boiling point will further increase (again a colligative property). As a solution is boiled, its temperature will increase as it is concentrated.
e) Eventually both the boiling and freezing line will intersect with the saturation limit line of the solution. At a given temperature, the solubility of the solute reaches a limit and the solute will begin to crystallize. As more water is removed from the system (by boiling or freezing) the solute will simultaneously crystallize out of the solution and the net composition will not change. Generally more solute will dissolve at higher temperatures so there is a slope in the saturation line.
f) The intersection of the freezing and saturation lines is the eutectic point. g) The region bounded by the boiling, freezing, and saturation lines defines the
compositions possible for that solute-solvent mixture. However, in practice crystallization of either water or solute takes a finite time1 and it is possible on cooling or boiling to overshoot into the supercooled or supersaturated regions for extended periods of time before a phase transition begins. To form a crystal, the molecules in a liquid must arrange into a crystal lattice shape. This takes time, particularly if the solution is particularly viscous (or there isn’t much water present to act as a solvent). Furthermore the small crystals formed easily redissolved and it can take a long time to get one large enough that it can grow and act as a nucleus for complete crystallization. So when a solution is supersaturated or supercooled the further it is away (below or to the right) from the line bounding the solution region in the phase diagram – the greater the thermodynamic pressure to crystallize. However, the cooler the solution is the slower the molecules move and the time taken to form crystals is increased (similarly the more concentrated the solution the more viscous and again the slower the molecules move and the slower the crystallization rate). In principle in very cool/concentrated solutions the molecular mobility would tend to zero and therefore the rate of crystallization (and chemical reaction) would also tend to zero. If the cooling/concentrating rate is relatively fast it is possible to get a solution into this region where reactivity is effectively nil without crystallization occurring. When molecular mobility (=1/viscosity) of a solution approaches zero we say it has become glassy. The viscous supersaturated region prior to glass formation is the rubber state. The glassy and rubbery states are together described as amorphous and are not crystalline. Material in the rubbery state may crystallize if sufficient time is available but glassy material is too viscous to rearrange in to a crystalline form. The glass transition line is also shown in Figure 7. To form a glass it is necessary to either concentrate a solution to very high levels by removing water as ice or steam or by cooling a moderately concentrated solution to very low temperatures. In either case the concentration must often be quite fast to get to the glassy state before crystallization occurs. 1 The reasons for this are explained further in the lipids section.
24
TE
Tg
Conc. Solute, %0 100
Tem
p, o C
0
A
B
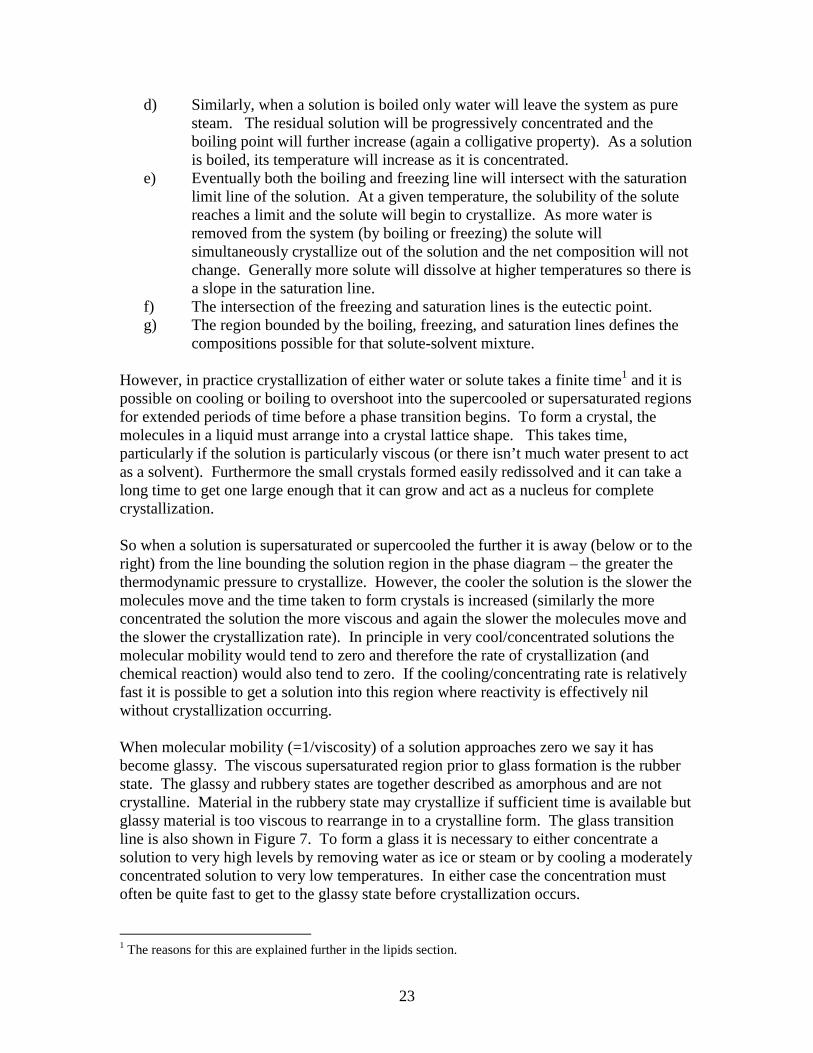
Example: As an illustration, consider how a phase diagram can be used to describe a freezing The food starts as a true solution (A), which is cooled until it reaches the melting point line (B). At this temperature (a little less than 0oC) crystals of pure ice form leaving the food material more concentrated. Further cooling concentrates the food more and more with little change in temperature until it reaches TE the eutectic point.
Thermodynamically the food solute would like to start crystallizing at this point but cannot. Instead the food continues along the line into the supersaturated region (a rubbery state forms) and mobility is rapidly reduced. At the glass transition temperature, the solute finally locks-up and forms a very low mobility glass and most diffusion limited food chemical reactions effectively stop. Cooling beyond this point causes no further change in composition, as even the crystallization process of water occurs too slowly in the viscous glass. At the bulk scale we see a glassy material as hard and brittle and a rubbery material is soft and pliable. While a glass is almost completely unreactive and (bio)chemically stable there can be some reactivity in a rubbery material. The key aspect limiting reactivity in both of these cases is the amount of molecular mobility available. One measurement of this is the amount a rubbery food must be cooled before it becomes a glass (i.e., T-Tg). A food can be made more stable by cooling (so T is lowered to closer to Tg) or drying (so Tg is raised closer to T). Question 3: Glass Transition. Use your knowledge of glass transition theory to briefly explain the following phenomenon. Wherever possible illustrate your answer with an annotated state diagram. (a) When you boil pasta it goes from brittle to soft. Why doesn't pasta soften with dry
heat (in an oven) or harden on cooling after cooking? (b) Hard candies left in a moist environment become sticky on the outside but stay
crunchy in the center (c) Freshly baked bread packed immediately in a plastic bag will develop a soft crust but
left in an open container will develop a crispy crust. (Hint: Freshly baked bread is still steaming).
(d) To prepare aqueous samples for visualization in an electron microscope it is
necessary to freeze them solid. This is often done by dripping the sample into a liquid nitrogen slush and cracking open the solid balls formed for imaging. Why does this process, known as vitrification, give better samples than simply putting them in a freezer overnight?

25
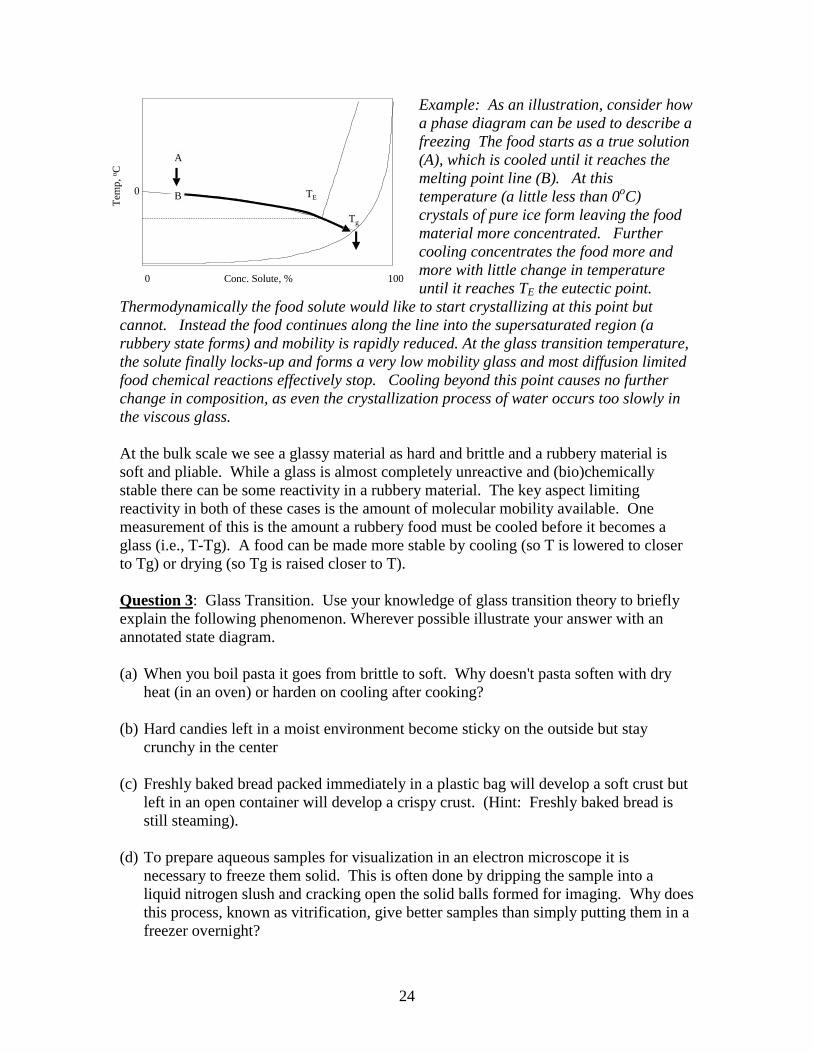
(e) Cotton candy is made by melting sucrose then spinning the liquid through narrow nozzles into thin strings. What state is the sucrose in cotton candy? How and why does it change when left in a moist environment for even a relatively short period of time?
Close up of the spinning head in a cotton candy machine. The center is filled with granular sugar which is heated to melt temperature then spun to force the melt out through narrow holes
(f) Dry corn is a hard brittle material (about 14% moisture) but it will pop when heated
above a critical temperature. What phase transitions are important in the formation of popcorn?