water issues in georgia
TRANSCRIPT
Water Issues in Georgia:
A Survey of Public Perceptions andAttitudes about Water
Prepared by
Jason Evans, Carl Vinson Institute of Government, University of Georgia
Jon Calabria, College of Environment and Design, University of Georgia
Warren Brown, Carl Vinson Institute of Government, University of Georgia
Alice Miller Keyes, Georgia Environmental Protection Division
Mark Risse, Department of Biological and Agricultural Engineering, College of Agricultural and Environmental Sciences, University of Georgia
Originally published by the Carl Vinson Institute of Government, The University of Georgia, Athens, April 2011
Contents
EXECUTIVE SUMMARY ...................................................................................................................................................................1
INTRODUCTION ................................................................................................................................................................................2
STATE WATER RESOURCES OVERVIEW......................................................................................................................................2
STATE DEMOGRAPHICS AND RESPONDENT CHARACTERISTICS ........................................................................4
FINDINGS .............................................................................................................................................................................................7
CONCLUSION .................................................................................................................................................................................. 20
APPENDIX A: Letter of Invitation ............................................................................................................................................ 21
APPENDIX B: Survey Questionnaire ...................................................................................................................................... 23
This project was funded by the U.S. Department of Agriculture National Institute of Food and Agriculture under agreement 2008-51130-19537, also known as the Southern Region Water Resource Project. The Southern Region Water Resource Project is a partnership of the University of Georgia Cooperative Extension, 21 collaborating land grant universities in the southern United States, and the USDA National Institute of Food and Agriculture. This survey is part of a national project conducted by Robert
Mahler, Professor of Soil and Environmental Sciences at the University of Idaho, under USDA project 2004-51130-02245.

Water Issues in Georgia: A Survey of Public Perceptions and Attitudes about Water
EXECUTIVE SUMMARY
This report summarizes the Georgia results of a survey project to gauge water resource awareness, attitudes, and behaviors among citizens across the country. These results reflect the opinions and perceptions of the survey respondents but should not necessarily be viewed as representative of the entire state’s population. The results provide useful information for water resource extension professionals and others to consider in developing con-tent and strategies for public education and outreach.
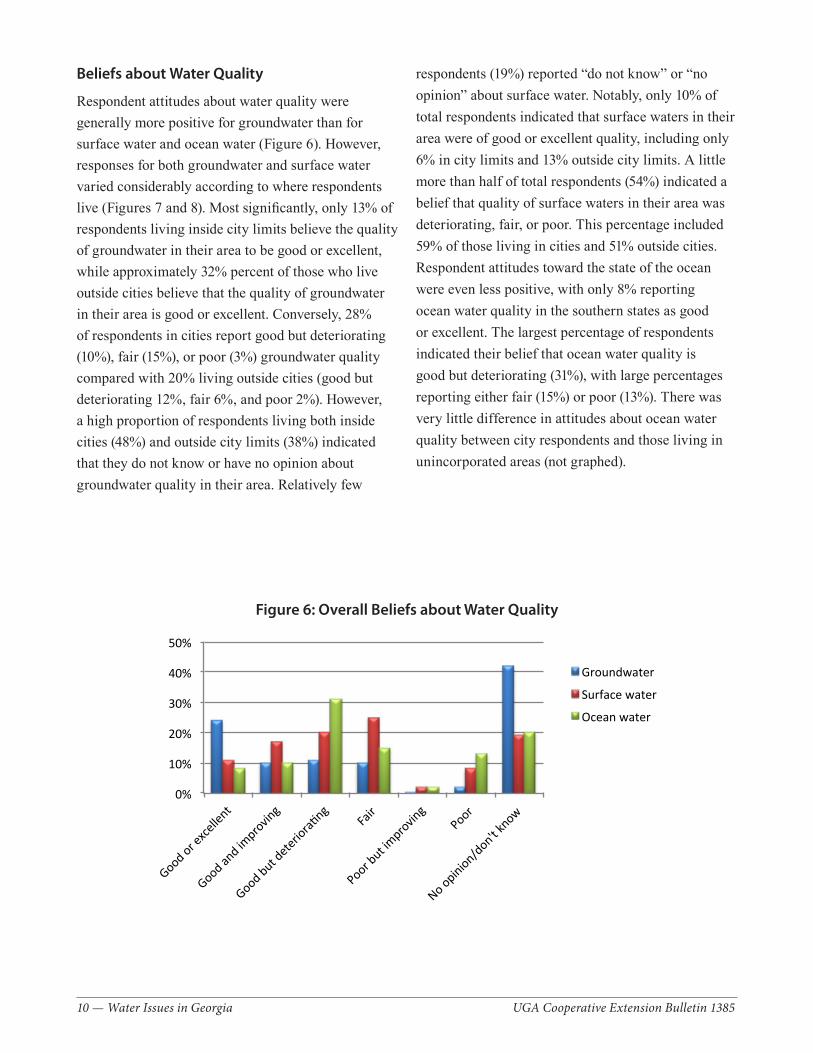
Beliefs about Water QualityA large majority of survey respondents consider clean drinking water (94%), clean rivers and lakes (76%), and clean groundwater (75%) as very important. Respondents have greater confidence in the quality of groundwater (24% believe it is good or excellent; 10% believe it is good and improving) than they do in the quality of surface waters (10% as good or excellent; 17% good and improving) and ocean waters (8% as good or excellent; 10% good and improving).
Conditions Perceived to Affect Local Water QualityThe sources respondents cited as most responsible for water pollution problems are industry (45%), erosion from roads and/or construction (39%), new suburban development (34%), and stormwater (29%). Fewer than 20% of respondents cited agriculture (whether crop-based or animal-based) as being most responsible for local water pollution. However, more than 35% of respondents either suspect or firmly believe that agricultural sources such as fertilizers and pesticides are having some impact on water resources in their local area.
Protecting Local WatersWith regard to the protection of local waters, respondents expressed the highest level of confidence in local gov-ernment officials, with 11% indicating that local government is performing this task very well and 43% reporting moderately well. State government performance received the next highest response ratings (6% very well; 38% moderately well). Somewhat less confidence was expressed in how the federal government (4% very well; 27% moderately well) and individual citizens (4% very well; 38% moderately well) are performing.
Water QuantityMany respondents believe that adequate water quantity is either definitely (22%) or probably (22%) a problem for their communities currently. Approximately 40% of respondents believe that there is a low likelihood of their community meeting all resource needs in 10 years. Only 16% believe that there is a high likelihood of these future needs being met.
Learning about Water IssuesThe most common source that respondents have relied upon to receive water resource information is local news-papers (65%). However, respondents indicated that they are more likely to use sources such as Web sites (46%); fact sheets, bulletins, or brochures (45%); or television (42%) than newspapers (38%) for learning about water resource issues in the future. Specific topics that relatively large numbers of respondents indicated an interest in learning more about included protecting public drinking water supplies (40%), water management in home and garden landscapes (28%), septic maintenance (26%), fish and wildlife water needs (26%), watershed management (25%), and well protection (21%).
2 — Water Issues in Georgia UGA Cooperative Extension Bulletin 1385
INTRODUCTIONThe critical need for better water stewardship in Georgia has been underscored in recent years by a succession of severe droughts and floods as well as ongoing legal disputes with adjacent states and federal agencies about the allocation of available water within shared watersheds. Recognizing this need, the Georgia State Assembly in 2008 established a regional framework for water resource planning through the enactment of the Georgia Comprehensive Statewide Water Management Plan. A series of additional statewide water conservation measures were then put into effect with passage of the Georgia Water Stewardship Act of 2010. The Water Plan and the Stewardship Act both notably call for significant outreach and extension to encourage the voluntary adoption of water conservation practices among water utilities, industry, farmers, and the general public to reduce water demand. To be effective in this role, outreach and extension professionals clearly can benefit from having a deep understanding of the existing attitudes about water issues among target stakeholder groups.
In 2009, a survey project to gauge general perceptions and attitudes about water resource issues was conducted in Georgia as part of a national water quality survey effort. The survey instrument contained 59 questions developed by state water quality coordinators under the leadership of Robert Mahler, Professor of Soil and Environmental Sciences at the University of Idaho. The survey in Georgia was mailed to 1,998 randomly selected Georgia citizens using a Dillman four-stage mail survey methodology. A first mailing included a cover letter (Appendix A), the survey (Appendix B), and a postage-paid return envelope. A reminder card was then sent as the second mailing. After 20 days, a second survey with cover
letter and a postage-paid return envelope were sent to those who had not yet responded. A final reminder card was then sent after 20 days to those who had still not responded. A total of 519 surveys were returned (a response rate of 26%) using this method. The survey distribution and response tabulation were also led by Professor Mahler.
This report summarizes key results from the survey for the purpose of assisting outreach professionals with their efforts to engage the public about critical water resource issues that face the state. The findings are reported as percentages of valid responses to each of the questions that are discussed (i.e., blank responses were not counted toward the total percentage for questions that required a response). Detailed analysis and interpretation of the Georgia responses were conducted collaboratively by faculty at the University of Georgia’s Carl Vinson Institute of Government, College of Environment and Design, and College of Agricultural and Environmental Sciences as well as staff from the Georgia Department of Natural Resources, Environmental Protection Division.
This survey project was conducted through the Southern Region Water Resources Project with funds provided by grant #2004-51330-02245 of the U.S. Department of Agriculture (USDA) 406 Water Quality Program. The project is a regional collaboration funded by the USDA National Institute for Food and Agriculture (NIFA) for the purpose of building partnerships to address water resource concerns among government agencies, business leaders, and other citizen stakeholders.
STATE WATER RESOURCES OVERVIEWGeorgia is drained by 14 major river basins (Map 1). The headwaters of all but 4 of these basins (Ochlockonee, Satilla, Suwannee, and St. Marys) are located in the Mountain, Valley and Ridge, and/
Water Issues in Georgia: A Survey of Public Perceptions and Attitudes about Water

UGA Cooperative Extension Bulletin 1385 Water Issues in Georgia— 3
Map 1: River Basins of Georgia
4 — Water Issues in Georgia UGA Cooperative Extension Bulletin 1385
or Piedmont physiographic provinces, flowing over into the Coastal Plain at the Fall Line (see Map 2). Importantly, many of Georgia’s river basins are shared with neighboring states, including large river basins such as the Chattahoochee, Savannah, and Tennessee.
Average annual rainfall for the entire state is approximately 51 inches. However, annual averages vary throughout the state, with some areas of the northern mountains receiving in excess of 60 inches, while Macon and Augusta receive only about 45 inches (Map 3). Water supply sources in Georgia also vary by region but are much more a function of differences in the underlying hydrogeology than in regional climate. The southern regions of the state located below the Fall Line obtain most of their supply from productive carbonate aquifers that contain high-quality groundwater. By contrast, the northern Piedmont and Mountain regions generally lack productive aquifers and therefore utilize surface waters such as rivers and man-made reservoirs as primary water supply sources.
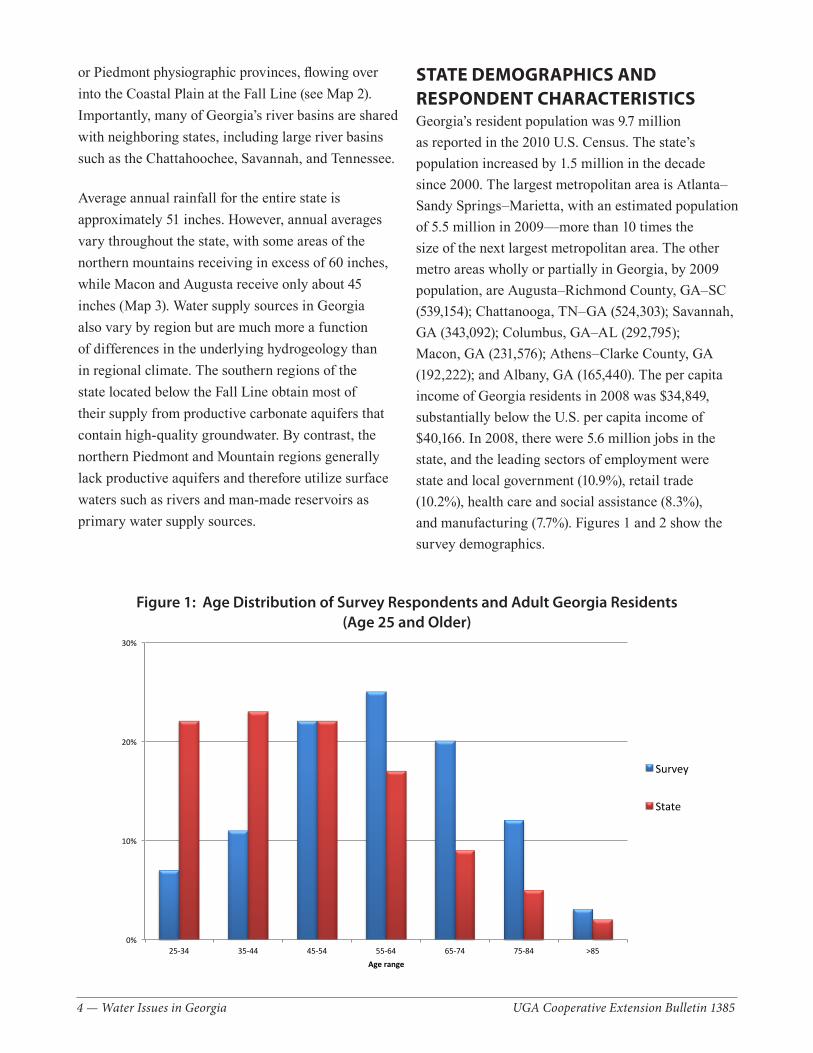
STATE DEMOGRAPHICS AND RESPONDENT CHARACTERISTICSGeorgia’s resident population was 9.7 million as reported in the 2010 U.S. Census. The state’s population increased by 1.5 million in the decade since 2000. The largest metropolitan area is Atlanta–Sandy Springs–Marietta, with an estimated population of 5.5 million in 2009—more than 10 times the size of the next largest metropolitan area. The other metro areas wholly or partially in Georgia, by 2009 population, are Augusta–Richmond County, GA–SC (539,154); Chattanooga, TN–GA (524,303); Savannah, GA (343,092); Columbus, GA–AL (292,795); Macon, GA (231,576); Athens–Clarke County, GA (192,222); and Albany, GA (165,440). The per capita income of Georgia residents in 2008 was $34,849, substantially below the U.S. per capita income of $40,166. In 2008, there were 5.6 million jobs in the state, and the leading sectors of employment were state and local government (10.9%), retail trade (10.2%), health care and social assistance (8.3%), and manufacturing (7.7%). Figures 1 and 2 show the survey demographics.
0%
10%
20%
30%
25-‐34 35-‐44 45-‐54 55-‐64 65-‐74 75-‐84 >85 Age range
Figure 1: Age Distribu1on of Survey Respondents and Adult Georgia Residents (Age 25 and Older)
Survey
State
Figure 1: Age Distribution of Survey Respondents and Adult Georgia Residents (Age 25 and Older)

UGA Cooperative Extension Bulletin 1385 Water Issues in Georgia— 5
Map 2: Physiographic Provinces of Georgia

6 — Water Issues in Georgia UGA Cooperative Extension Bulletin 1385
Map 3: Precipitation in Georgia

UGA Cooperative Extension Bulletin 1385 Water Issues in Georgia— 7
Survey respondents were somewhat older (Figure 1), much more likely to be male (64% male, 36% female versus state average of 48% male, 52% female), and more highly educated than the average adult population of Georgia (Figure 2). These significant differences indicate that the results from the survey should not be inferred to represent the opinions of the general population as a whole. About 41% of respondents live inside a town or city limits, with the remaining 59% living in unincorporated areas. Approximately 4% of respondents reported that they are actively engaged in farming. Relatively similar numbers of respondents reported living in cities with populations greater than 100,000 (32%), intermediate-sized communities of 25,000 to 100,000 (36%), and communities of fewer than 25,000 (32%). Most respondents can be categorized as long-term residents, having either lived in Georgia for their entire lives (39%) or resided in the state for more than 10 years (48%). Only 5% report having moved to the state in
the past 5 years, with another 8% indicating that they have lived in the state for 5 to 9 years.
0%
10%
20%
30%
< High school High school graduate Some college College degree Advanced college degree
Figure 2: Educa.onal A3ainment of Survey Respondents and Adult Georgia Residents (Age 25 and Older)
Survey
State
Figure 2: Educational Attainment of Survey Respondents and Adult Georgia Residents (Age 25 and Older)
FINDINGSWater QualityImportance of Water Issues
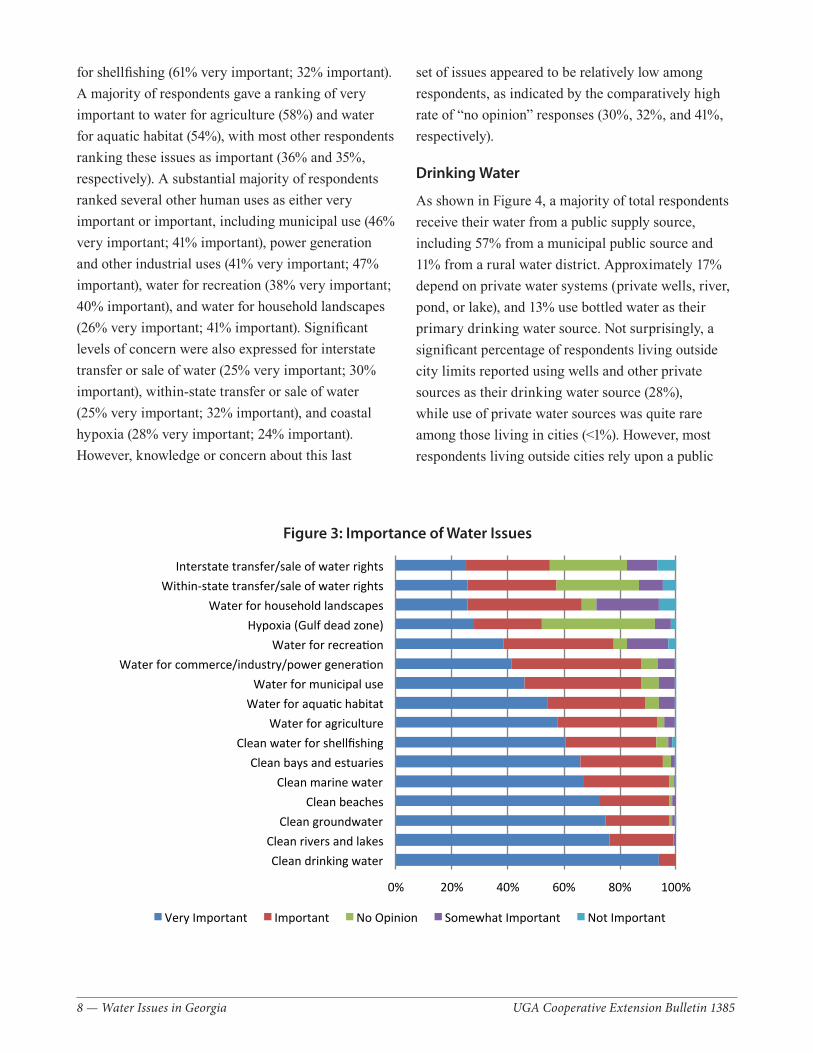
Respondents were given a list of water issues and asked to rate each according to its importance (Figure 3). All respondents reported that clean drinking water is either very important (94%) or important (6%). Similarly, there is a high level of concern for freshwater systems as indicated by attitudes toward clean rivers and lakes (76% very important; 23% important) and clean groundwater (75% very important; 23% important). Slightly lower, but still quite high, levels of concern were expressed for coastal issues such as clean marine water (67% very important; 31% important), clean bays and estuaries (66% very important; 30% important), and clean water
8 — Water Issues in Georgia UGA Cooperative Extension Bulletin 1385
for shellfishing (61% very important; 32% important). A majority of respondents gave a ranking of very important to water for agriculture (58%) and water for aquatic habitat (54%), with most other respondents ranking these issues as important (36% and 35%, respectively). A substantial majority of respondents ranked several other human uses as either very important or important, including municipal use (46% very important; 41% important), power generation and other industrial uses (41% very important; 47% important), water for recreation (38% very important; 40% important), and water for household landscapes (26% very important; 41% important). Significant levels of concern were also expressed for interstate transfer or sale of water (25% very important; 30% important), within-state transfer or sale of water (25% very important; 32% important), and coastal hypoxia (28% very important; 24% important). However, knowledge or concern about this last
Drinking Water
As shown in Figure 4, a majority of total respondents receive their water from a public supply source, including 57% from a municipal public source and 11% from a rural water district. Approximately 17% depend on private water systems (private wells, river, pond, or lake), and 13% use bottled water as their primary drinking water source. Not surprisingly, a significant percentage of respondents living outside city limits reported using wells and other private sources as their drinking water source (28%), while use of private water sources was quite rare among those living in cities (<1%). However, most respondents living outside cities rely upon a public
0% 20% 40% 60% 80% 100%
Clean drinking water Clean rivers and lakes Clean groundwater
Clean beaches Clean marine water
Clean bays and estuaries Clean water for shellfishing
Water for agriculture Water for aquaBc habitat Water for municipal use
Water for commerce/industry/power generaBon Water for recreaBon
Hypoxia (Gulf dead zone) Water for household landscapes
Within-‐state transfer/sale of water rights Interstate transfer/sale of water rights
Figure 3: Importance of Water Issues
Very Important Important No Opinion Somewhat Important Not Important
Figure 3: Importance of Water Issues
set of issues appeared to be relatively low among respondents, as indicated by the comparatively high rate of “no opinion” responses (30%, 32%, and 41%, respectively).

UGA Cooperative Extension Bulletin 1385 Water Issues in Georgia— 9
supply source, whether municipal (44%) or from a rural water district (15%). A slightly higher percentage of respondents living in cities (15%) use bottled water compared with those living in unincorporated areas (12%).
Approximately 88% of respondents believe that their home drinking water is safe to drink, and most (68%) report that they are satisfied with their drinking water (Figure 5). However, 16% report that they are not satisfied with their home drinking water. About 38% of respondents reported having a home water filter, and 5% have home water treatment systems. A little over half (51%) of respondents indicated that they often use bottled water for drinking purposes.
0% 20% 40% 60% 80% 100%
My drinking water is separate from my water supply system
I have a water treatment system
I purchase 5-‐gallon containers of drinking water
I never buy boCled water
I am not saDsfied with my current drinking water
I have a water filter
I oFen use boCled water for drinking purposes
I am saDsfied with my drinking water
I feel that my drinking water is safe to drink
Figure 5: Home Drinking Water Figure 5: Drinking Water Attitudes and Behaviors
0% 20% 40% 60% 80%
100%
Private supply
Public supply—
Public supply—rural
Purchase bo:led
I don't know
Figure 4: Drinking Water Sources
Overall
City limits
Outside city
Figure 4: Drinking Water Sources
Respondents served by private water supply sources gave their water somewhat higher ratings for safety (95%) and satisfaction (88%) than those who use public water supplies (92% safety; 77% satisfaction). Those respondents who use bottled water reported the lowest ratings for their home tap water (63% safety; 24% satisfaction). While only 12% of total respondents reported having their home drinking water tested, a relatively large percentage (40%) of those with private water supplies conduct tests. By way of comparison, only 5% of those living in cities and served by a public water supply source reported testing their water.
10 — Water Issues in Georgia UGA Cooperative Extension Bulletin 1385
Beliefs about Water Quality
Respondent attitudes about water quality were generally more positive for groundwater than for surface water and ocean water (Figure 6). However, responses for both groundwater and surface water varied considerably according to where respondents live (Figures 7 and 8). Most significantly, only 13% of respondents living inside city limits believe the quality of groundwater in their area to be good or excellent, while approximately 32% percent of those who live outside cities believe that the quality of groundwater in their area is good or excellent. Conversely, 28% of respondents in cities report good but deteriorating (10%), fair (15%), or poor (3%) groundwater quality compared with 20% living outside cities (good but deteriorating 12%, fair 6%, and poor 2%). However, a high proportion of respondents living both inside cities (48%) and outside city limits (38%) indicated that they do not know or have no opinion about groundwater quality in their area. Relatively few
respondents (19%) reported “do not know” or “no opinion” about surface water. Notably, only 10% of total respondents indicated that surface waters in their area were of good or excellent quality, including only 6% in city limits and 13% outside city limits. A little more than half of total respondents (54%) indicated a belief that quality of surface waters in their area was deteriorating, fair, or poor. This percentage included 59% of those living in cities and 51% outside cities. Respondent attitudes toward the state of the ocean were even less positive, with only 8% reporting ocean water quality in the southern states as good or excellent. The largest percentage of respondents indicated their belief that ocean water quality is good but deteriorating (31%), with large percentages reporting either fair (15%) or poor (13%). There was very little difference in attitudes about ocean water quality between city respondents and those living in unincorporated areas (not graphed).
0%
10%
20%
30%
40%
50%
Good or exce
llent
Good and improvin
g
Good but deterio
ra;ng Fa
ir
Poor but im
proving
Poor
No opinion/don't k
now
Figure 6: Water quality
Groundwater
Surface water
Ocean water
Figure 6: Overall Beliefs about Water Quality

UGA Cooperative Extension Bulletin 1385 Water Issues in Georgia— 11
Conditions Perceived to AffectLocal Water Quality
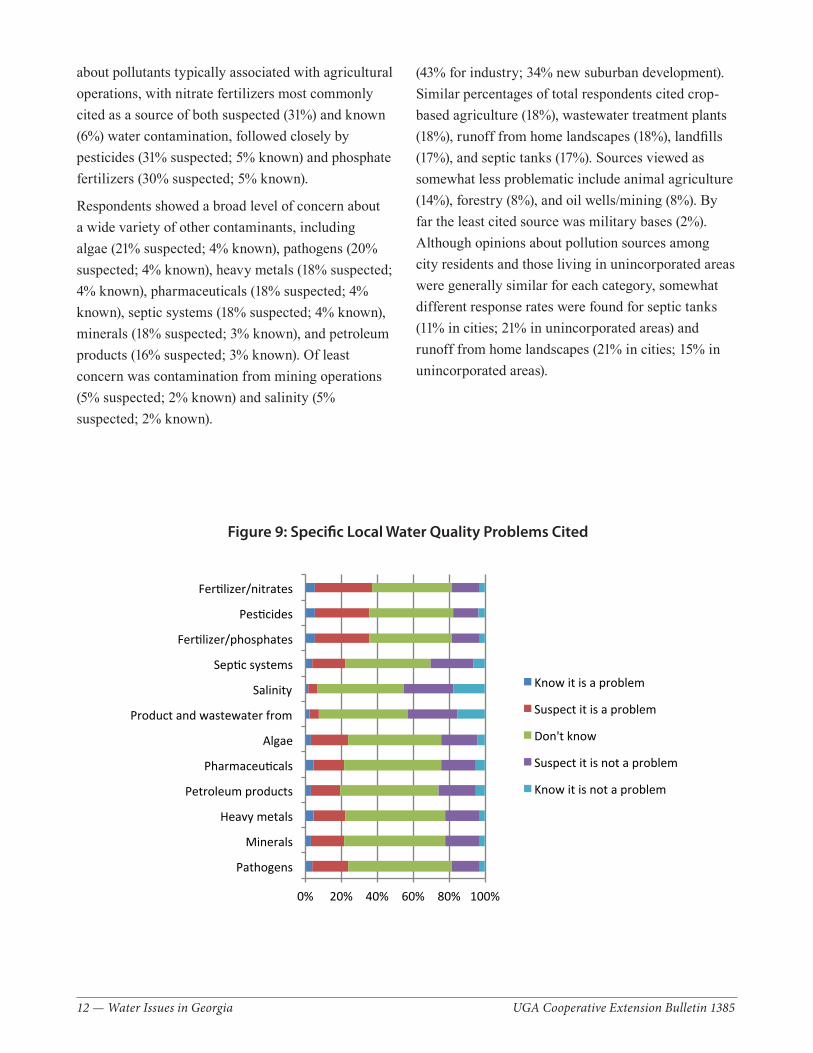
When asked about their knowledge or suspicions about how specific pollutant sources may be affecting local water quality, the largest percentage of respondents reported “do not know” for all categories (Figure 9). However, some general trends about the types of pollutant sources that respondents are concerned about can be discerned. For example, a comparatively large percentage of respondents reported having concerns
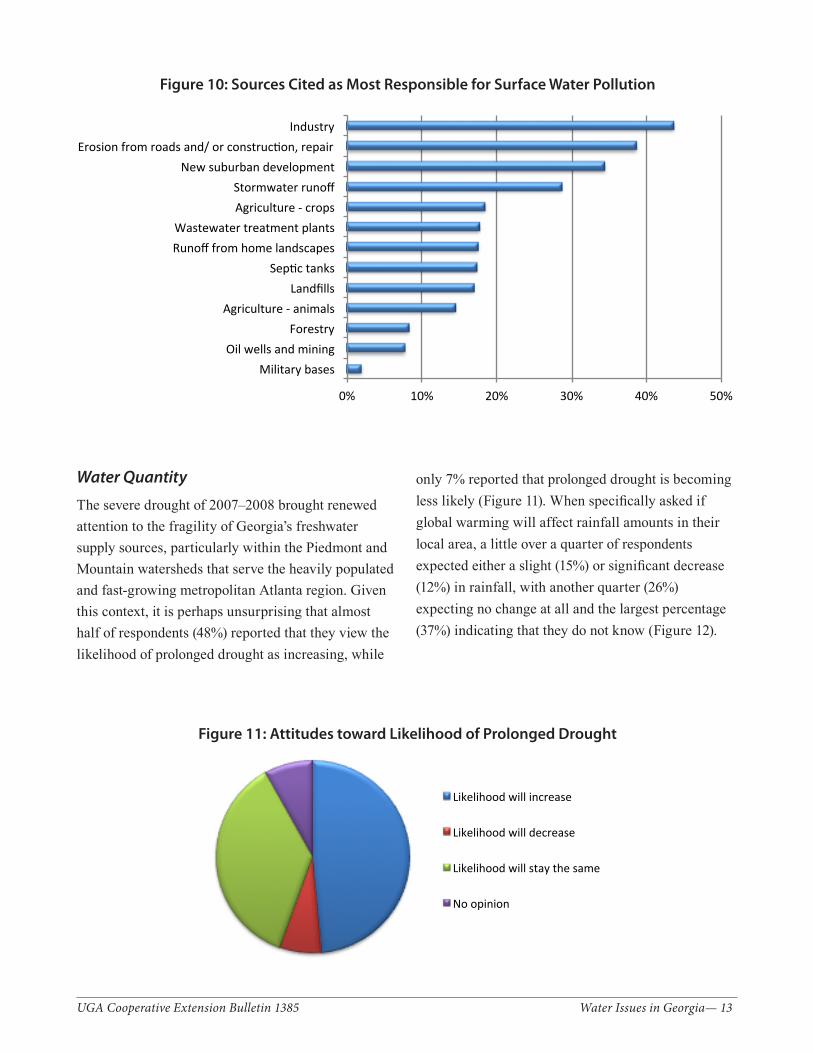
Respondents were also asked to indicate the top three sources of existing pollution problems for rivers and lakes in Georgia from a list of possible sources (Figure 10). The highest percentage (44%) cited industry, with erosion from roads and/or construction (39%), new suburban development (34%), and stormwater runoff (29%) also viewed as major problems. A somewhat greater percentage of those living in cities cited industry (47%) and new suburban development (37%) than did those living in unincorporated areas
0%
10%
20%
30%
Good or excellent
Good and
Good but
Fair
Poor but
Poor
No opinion/don't
Figure 8: Surface Water Quality Beliefs, by Residence
City
Outside city
Figure 8: Surface Water Quality Beliefs, by Residence
0%
20%
40%
60%
Good or
excellent
Good an
d imp
roving
Good bu
t dete
riora9
ng
Fair
Poor
but im
provin
g Poor
No op
inion/don't k
now
Figure 7: Groundwater Quality Beliefs, by Residence
City
Outside city
Figure 7: Groundwater Quality Beliefs, by Residence
12 — Water Issues in Georgia UGA Cooperative Extension Bulletin 1385
about pollutants typically associated with agricultural operations, with nitrate fertilizers most commonly cited as a source of both suspected (31%) and known (6%) water contamination, followed closely by pesticides (31% suspected; 5% known) and phosphate fertilizers (30% suspected; 5% known).
Respondents showed a broad level of concern about a wide variety of other contaminants, including algae (21% suspected; 4% known), pathogens (20% suspected; 4% known), heavy metals (18% suspected; 4% known), pharmaceuticals (18% suspected; 4% known), septic systems (18% suspected; 4% known), minerals (18% suspected; 3% known), and petroleum products (16% suspected; 3% known). Of least concern was contamination from mining operations (5% suspected; 2% known) and salinity (5% suspected; 2% known).
(43% for industry; 34% new suburban development). Similar percentages of total respondents cited crop-based agriculture (18%), wastewater treatment plants (18%), runoff from home landscapes (18%), landfills (17%), and septic tanks (17%). Sources viewed as somewhat less problematic include animal agriculture (14%), forestry (8%), and oil wells/mining (8%). By far the least cited source was military bases (2%). Although opinions about pollution sources among city residents and those living in unincorporated areas were generally similar for each category, somewhat different response rates were found for septic tanks (11% in cities; 21% in unincorporated areas) and runoff from home landscapes (21% in cities; 15% in unincorporated areas).
Figure 9: Specific Local Water Quality Problems Cited
0% 20% 40% 60% 80% 100%
Pathogens
Minerals
Heavy metals
Petroleum products
Pharmaceu>cals
Algae
Product and wastewater from
Salinity
Sep>c systems
Fer>lizer/phosphates
Pes>cides
Fer>lizer/nitrates
Know it is a problem
Suspect it is a problem
Don't know
Suspect it is not a problem
Know it is not a problem
UGA Cooperative Extension Bulletin 1385 Water Issues in Georgia— 13
Water Quantity
The severe drought of 2007–2008 brought renewed attention to the fragility of Georgia’s freshwater supply sources, particularly within the Piedmont and Mountain watersheds that serve the heavily populated and fast-growing metropolitan Atlanta region. Given this context, it is perhaps unsurprising that almost half of respondents (48%) reported that they view the likelihood of prolonged drought as increasing, while
only 7% reported that prolonged drought is becoming less likely (Figure 11). When specifically asked if global warming will affect rainfall amounts in their local area, a little over a quarter of respondents expected either a slight (15%) or significant decrease (12%) in rainfall, with another quarter (26%) expecting no change at all and the largest percentage (37%) indicating that they do not know (Figure 12).
Figure 11: A+tudes toward Likelihood of Prolonged Drought
Likelihood will increase
Likelihood will decrease
Likelihood will stay the same
No opinion
Figure 11: Attitudes toward Likelihood of Prolonged Drought
0% 10% 20% 30% 40% 50%
Military bases Oil wells and mining
Forestry Agriculture -‐ animals
Landfills SepCc tanks
Runoff from home landscapes Wastewater treatment plants
Agriculture -‐ crops Stormwater runoff
New suburban development Erosion from roads and/ or construcCon, repair
Industry
Figure 10: Sources Believed to be Responsible for Surface Water Pollu<on Figure 10: Sources Cited as Most Responsible for Surface Water Pollution

14 — Water Issues in Georgia UGA Cooperative Extension Bulletin 1385
Respondents were asked to rate the extent of water quantity concerns in their local area (Figure 13). Almost identical percentages of respondents believe water quantity is a problem (44% definitely or probably a problem) as do not believe it is a problem (44% definitely or probably not a problem). Confidence was, however, significantly stronger among respondents who believe water quantity is a problem, with 22% reporting “definitely.” By contrast, only 11% of those who do not believe water quantity is a problem reported “definitely.” Respondents living in cities showed significantly higher levels of concern about water quantity (26% probably; 25% definitely a problem) versus respondents living in unincorporated areas (20% probably; 20% definitely a problem).
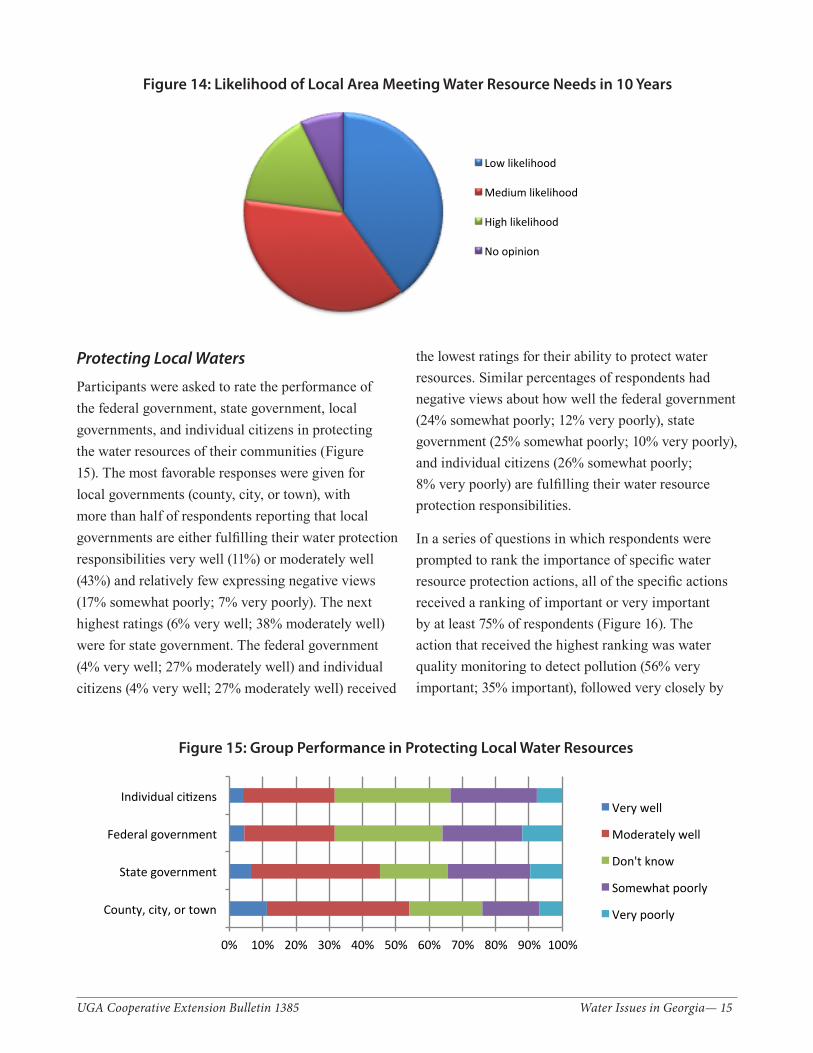
Future outlook regarding water resources was fairly pessimistic. The highest number (40%) of respondents reported that there was a low likelihood of their local area being able to meet all water resource needs in 10 years, while only 16% believe that there is a high likelihood of future water needs being met (Figure 14). Attitudes among respondents living in cities (13% high likelihood; 37% medium likelihood; 43% low likelihood) were somewhat more pessimistic than those of respondents living outside city limits (19% high likelihood; 36% medium likelihood; 38% low likelihood).
Figure 13: Extent of Water Quan4ty Concerns
Definitely not a problem
Probably not a problem
Don't know
Probably a problem
Definitely a problem
Figure 13: Extent of Water Quantity Concerns
0%
10%
20%
30%
40%
Significant increase
Slight increase
No change Slight decrease
Significant decrease
Don't know
Figure 12: A,tudes toward Effect of Global Warming on Rainfall Figure 12: Attitudes toward Effect of Global Warming on Rainfall
UGA Cooperative Extension Bulletin 1385 Water Issues in Georgia— 15
Protecting Local Waters
Participants were asked to rate the performance of the federal government, state government, local governments, and individual citizens in protecting the water resources of their communities (Figure 15). The most favorable responses were given for local governments (county, city, or town), with more than half of respondents reporting that local governments are either fulfilling their water protection responsibilities very well (11%) or moderately well (43%) and relatively few expressing negative views (17% somewhat poorly; 7% very poorly). The next highest ratings (6% very well; 38% moderately well) were for state government. The federal government (4% very well; 27% moderately well) and individual citizens (4% very well; 27% moderately well) received
the lowest ratings for their ability to protect water resources. Similar percentages of respondents had negative views about how well the federal government (24% somewhat poorly; 12% very poorly), state government (25% somewhat poorly; 10% very poorly), and individual citizens (26% somewhat poorly; 8% very poorly) are fulfilling their water resource protection responsibilities.
In a series of questions in which respondents were prompted to rank the importance of specific water resource protection actions, all of the specific actions received a ranking of important or very important by at least 75% of respondents (Figure 16). The action that received the highest ranking was water quality monitoring to detect pollution (56% very important; 35% important), followed very closely by
Figure 14: Likelihood of Local Area Meeting Water Resource Needs in 10 Years
0% 10% 20% 30% 40% 50% 60% 70% 80% 90% 100%
County, city, or town
State government
Federal government
Individual ciBzens
Figure 15: Group Performance in Protec5ng Local Water Resources
Very well
Moderately well
Don't know
Somewhat poorly
Very poorly
Figure 15: Group Performance in Protecting Local Water Resources
Low likelihood
Medium likelihood
High likelihood
No opinion

16 — Water Issues in Georgia UGA Cooperative Extension Bulletin 1385
Personal Natural Resource Ethics and ActionsSurvey participants were asked to chart their overall opinion about environmental issues on a scale ranging from total natural resource use to total environmental protection, with the middle point indicating an equal
balance between use and protection (see Question 46, Appendix B). While most respondents placed themselves in the equal balance category (57%), significantly more favored total environmental protection (27%) than supported total resource use (16%). Interestingly, slightly higher percentages of respondents living in cities identified themselves on the far ends of the spectrum (17% total use; 30% total environmental protection) compared with residents living in unincorporated areas (14% total use; 25% total environmental protection). However, the equal balance category still characterized the majority of respondents in both cities (53%) and outside cities (61%).
The survey contained a series of questions that explored the various sources of information that respondents use to form their beliefs about environmental issues (Figure 17). By far the most influential source in terms of changing respondent minds about the environment was news coverage (cited by 52%). Conversations with other people (32%), firsthand observations (28%), and financial
0% 10% 20% 30% 40% 50% 60% 70% 80% 90% 100%
Improving water quality monitoring to detect pollu@on
Improving wastewater treatment
Educa@ng municipal officials
Residen@al water conserva@on
Building new water storage structures (dams, reservoirs)
Making water quality and quan@ty data available to public
Preserving and restoring buffer zones and wetlands
Improving agricultural prac@ces
Preserving agricultural land and open space
BeOer management of shoreline access to prevent erosion
Improving home and garden prac@ces
BeOer management of recrea@onal ac@vi@es (boa@ng, fishing, ATVs)
Trea@ng stormwater runoff
Figure 16: Importance of Water Resource Protec8on Ac8ons
Very important
Important
No opinion
Somewhat Important
Not important
Figure 16: Importance of Water Resource Protection Actions
improved wastewater treatment (55% very important; 36% important). Other actions that respondents regarded as especially important included educating municipal officials (50% very important; 39% important), residential water conservation (48% very important; 40% important), and building new water storage structures (45% very important; 40% important). While still generally supportive of the actions, respondents were least concerned about the importance of improving home and garden practices (33% very important; 45% important), better management of recreation activities (33% very important; 43% important), and treatment of stormwater runoff (31% very important; 44% important).

UGA Cooperative Extension Bulletin 1385 Water Issues in Georgia— 17
considerations (18%) were the next most influential. Relatively few changed their minds because of classes or presentations (10%), attending public meetings or volunteer activities (8%), or hearing a speech by a public official (4%).
Participants were also asked about ways they may have adjusted their own behavior to conserve water or preserve water quality (Figure 18). The most cited action in the responses was changes in the frequency of watering yards (67%). Surprisingly little difference was found between the percentage of respondents living in a city (66%) and those living in
unincorporated areas (68%) who reported changing their yard-watering frequency. Adoption of new technologies such as low-flow toilets was cited by a relatively large number of respondents (40%), while somewhat lower percentages reported changing the use of pesticides, fertilizers, or other chemicals (28%) or changing the way their yard is landscaped (24%). The fewest reported having their septic tanks pumped (16%), although, as would be expected, response rates regarding septic tanks varied significantly between those who live in cities (8%) and those in unincorporated areas (21%).
0% 10% 20% 30% 40% 50% 60%
News coverage
Conversa6ons with other people
Firsthand observa6on
Financial considera6ons
Classes or presenta6ons
A@ending public mee6ngs or volunteer ac6vi6es
Speech by elected official
Figure 17: Influence of Informa3on Sources on Views toward Environmental Issues
Figure 17: Influence of Information Sources on Views toward Environmental Issues
0% 10% 20% 30% 40% 50% 60% 70% 80%
Changed how o5en yard is watered
Adopted new technologies (low-‐flow faucets, etc.)
Changed use of pesGcides, ferGlizers, or other chemicals
Changed the way yard is landscaped
Pumped sepGc system (if any)
Figure 18: Ac-ons Taken to Conserve Water or Preserve Water Quality Figure 18: Actions Taken to Conserve Water or Preserve Water Quality

18 — Water Issues in Georgia UGA Cooperative Extension Bulletin 1385
Learning about Water IssuesSurvey participants were given a detailed list of media options and communication networks and asked whether they have received water resource information from these sources (Figure 19). By far the most common source of information about water resources was local newspapers (56%). Network television (45%) and public television (43%) were the next most common sources of media information, with a similar percentage citing friends and family (43%). A little more than one-third listed radio (37%), approximately one-third included national media sources such as major newspapers (34%) and cable television (33%), and somewhat fewer cited magazines (29%). Environmental agencies (i.e., governments) were listed as an information source by approximately one-third of respondents (32%), while about a quarter cited nongovernmental environmental groups (25%).
The lowest percentage of respondents reported receiving water resource information from universities (20%), extension (19%), or schools (14%).
When asked about their desire to learn more about a variety of specific water resource topics (Figure 20), most respondents cited protecting public drinking water supplies (40%). A relatively large number of respondents desired having more information about household management issues such as home and garden landscaping (28%), septic system maintenance (26%), and private well protection (21%). Approximately a quarter cited a desire to learn about fish and wildlife water needs (26%) and watershed management (25%), while approximately 20% indicated an interest in water policy and economics. All other categories were cited by fewer than 20% of respondents, with the least amount of interest shown for farm-related issues such as landscape buffers (15%), irrigation management (13%), and animal waste management (10%).
Respondents also were asked to note the types of learning opportunities they would most likely utilize in the future (Figure 21). The most commonly cited opportunity was visiting a Web site (46%), followed closely by reading fact sheets, bulletins, or brochures (45%) and watching TV coverage (42%). A significant
0% 10% 20% 30% 40% 50% 60% 70%
Local newspapers Network television Public television
Friends and family Radio
Cable television Major newspapers
Environmental agencies Magazines
Environmental groups UniversiKes Extension Schools
Figure 19: Previous Sources of Water Resource Informa9on Figure 19: Previous Sources of Water Resource Information
Few respondents reported participation in various civic activities (not graphed). The highest number (9%) participated in county, municipal, or township meetings, with somewhat smaller percentages participating in lake, river, bay, wetland, or watershed protection groups (7%), volunteer water quality monitoring (6%), and the Master Gardener program (5%).

UGA Cooperative Extension Bulletin 1385 Water Issues in Georgia— 19
number also were likely to read a newspaper article or series (38%). There were fewer responses to all other categories (<15%). Respondent age had a strong effect on the likelihood of using various media sources. For example, only 26% of those over age 65 were likely to use the Internet, with a much higher relative percentage among this age group citing fact sheets
(51%) or newspaper articles (47%). Respondents under 50, by contrast, were much more likely to use a Web site (64%) while being somewhat less likely to use fact sheets (44%) and much less likely to use newspapers (32%).
0% 10% 20% 30% 40% 50%
Protec/ng public drinking water supplies Home and garden landscaping Fish and wildlife water needs Sep/c system management
Watershed management Private well protec/on
Water policy and economics Shoreline clean-‐up
Restoring fish and aqua/c habitat Community ac/ons concerning water issues
Nutrient and pes/cide management Watershed restora/on
Forest management and water issues Landscape buffers
Irriga/on management Animal waste management
Figure 20: Water Resource Areas of Interest Figure 20: Water Resource Areas of Interest
0% 10% 20% 30% 40% 50%
Visit a Web site
Read printed fact sheets, bulle<ns, or brochures
Watch TV coverage
Read a newspaper ar<cle or series
Watch an informa<onal video
Look at a demonstra<on or display
Learn how to conduct a home, farm, or workplace prac<ces
Take part in a one-‐<me volunteer ac<vity
AHend a fair or fes<val
AHend a short course or workshop
Take a course for cer<fica<on or credit
Get trained for a regular posi<on
Figure 21: Sources for Learning More about Water Quality Figure 21: Sources for Learning More about Water Quality
20 — Water Issues in Georgia UGA Cooperative Extension Bulletin 1385
CONCLUSIONRespondent answers indicated a broad level of concern and knowledge about water resource issues. Not surprisingly, maintaining abundant and clean drinking water clearly emerged as an imperative issue. Very high levels of concern were also expressed for protecting the water quality of streams, lakes, and coastal waters. While a large majority of respondents believe that their drinking water is safe, many believe that there are major problems with the state’s groundwater, surface waters, and coastal waters. Respondents also showed a high level of support for programs to protect these resources and expressed confidence in the ability of local governments in particular to carry out this mission.
The survey responses also can be used to help outreach and extension professionals target ways to educate the general public about less-known issues. For example, high percentages of respondents indicated that they had little to no knowledge of water transfers (whether in-state or among states). Because water transfers are likely to become increasingly important (and potentially controversial) in Georgia in the near to mid term, building public understanding may allow citizens to engage with community leaders in constructive decision making. Likewise, respondents showed little understanding about coastal hypoxia. In this case, outreach and extension professionals may give priority to educating citizens
on this phenomenon and the impact it can have on local communities and the state’s economy.
There is also significant potential for the survey results to be used as a basis for extension professionals to refine their communication strategies. Survey questions about media habits suggest the need for extension specialists to communicate important information about water resource conservation using a wide variety of media outlets, thus allowing for a larger percentage of the public to receive this information than can be achieved through traditional extension publications and activities alone.
Moving forward, it is clear that Georgia, like most other states and regions, will continue to face major water resource challenges over the coming years. Careful assessment of public knowledge and attitudes about water resource issues will remain critical as a mechanism for understanding new trends in opinions and perceptions as well as identifying areas in which outreach and extension professionals may be most needed to provide objective and trusted sources of information. We hope that the results of this study prove useful in serving these ends.
UGA Cooperative Extension Bulletin 1385 Water Issues in Georgia— 21
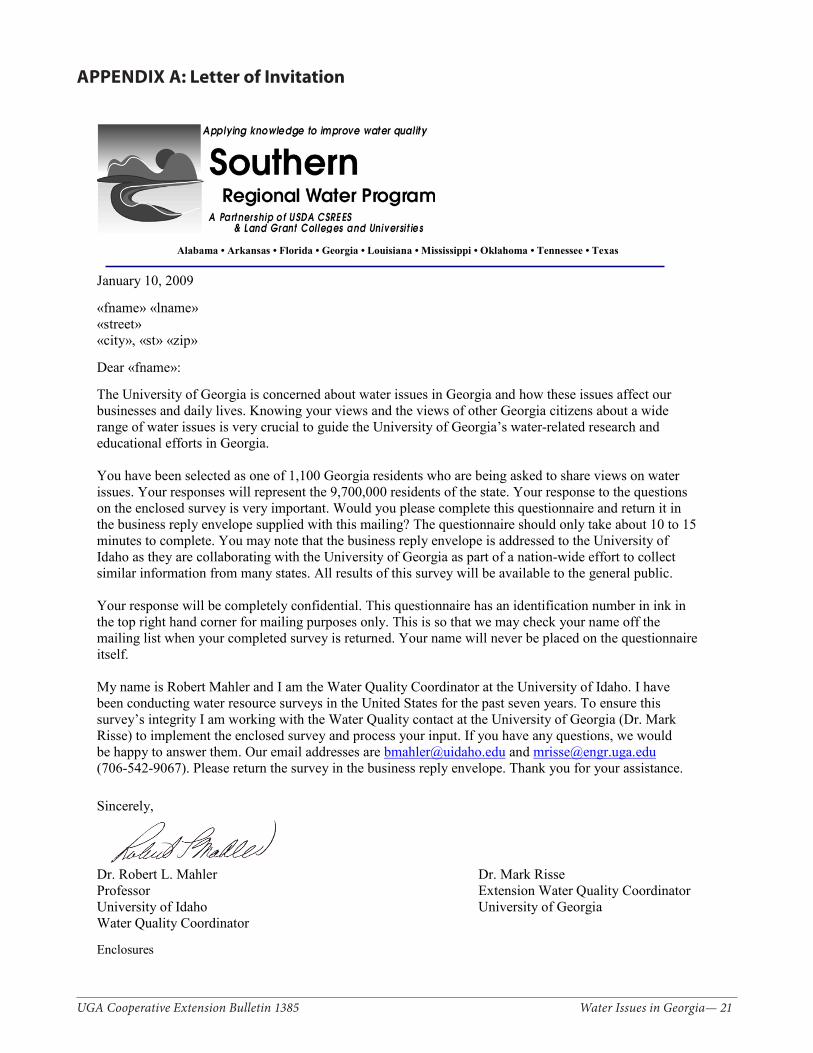
APPENDIX A: Letter of Invitation
Alabama • Arkansas • Florida • Georgia • Louisiana • Mississippi • Oklahoma • Tennessee • Texas
January 10, 2009
«fname» «lname»«street»«city», «st» «zip»
Dear «fname»:
The University of Georgia is concerned about water issues in Georgia and how these issues affect our businesses and daily lives. Knowing your views and the views of other Georgia citizens about a wide range of water issues is very crucial to guide the University of Georgia’s water-related research and educational efforts in Georgia.
You have been selected as one of 1,100 Georgia residents who are being asked to share views on water issues. Your responses will represent the 9,700,000 residents of the state. Your response to the questions on the enclosed survey is very important. Would you please complete this questionnaire and return it in the business reply envelope supplied with this mailing? The questionnaire should only take about 10 to 15 minutes to complete. You may note that the business reply envelope is addressed to the University of Idaho as they are collaborating with the University of Georgia as part of a nation-wide effort to collect similar information from many states. All results of this survey will be available to the general public.
Your response will be completely confidential. This questionnaire has an identification number in ink in the top right hand corner for mailing purposes only. This is so that we may check your name off the mailing list when your completed survey is returned. Your name will never be placed on the questionnaire itself.
My name is Robert Mahler and I am the Water Quality Coordinator at the University of Idaho. I have been conducting water resource surveys in the United States for the past seven years. To ensure this survey’s integrity I am working with the Water Quality contact at the University of Georgia (Dr. Mark Risse) to implement the enclosed survey and process your input. If you have any questions, we would be happy to answer them. Our email addresses are [email protected] and [email protected](706-542-9067). Please return the survey in the business reply envelope. Thank you for your assistance.
Sincerely,
Dr. Robert L. Mahler Dr. Mark RisseProfessor Extension Water Quality CoordinatorUniversity of Idaho University of GeorgiaWater Quality Coordinator
Enclosures

22 — Water Issues in Georgia UGA Cooperative Extension Bulletin 1385

UGA Cooperative Extension Bulletin 1385 Water Issues in Georgia— 23
Water Issues in Georgia:
A survey of public attitudes in Georgia
Sponsored by:
Southern RegionUniversity of Georgia
University of Idaho
January 2010
APPENDIX B: Survey Questionnaire

24 — Water Issues in Georgia UGA Cooperative Extension Bulletin 1385
WATER ISSUES IN GEORGIA
HOW DO YOU FEEL ABOUT THE ENVIRONMENT?
How important are each of the following water issues to you? (Circle one answer per question)
Not Somewhat No Very Issue important important opinion Important important
1. Clean rivers and lakes N S O I V 2. Clean marine water N S O I V 3. Clean bays and estuaries N S O I V 4. Clean water for N S O I V
shellfishing 5. Clean beaches N S O I V 6. Clean drinking water N S O I V 7. Clean groundwater N S O I V 8. Water for commerce/ N S O I V
industry/power generation 9. Water for household N S O I V
landscapes 10. Water for agriculture N S O I V 11. Water for aquatic N S O I V
habitat 12. Water for recreation N S O I V 13. Water for municipal use N S O I V14. Interstate transfer/sale N S O I V
of water rights15. Within state transfer/sale N S O I V
of water rights16. Hypoxia (Gulf dead zone) N S O I V
59. Where do you normally get your news? (Check all that apply) Local newspapers Major newspapers Radio Internet Local television National television Cable television Public television Magazines or newsletters
THANK YOU FOR YOUR HELP
UGA Cooperative Extension Bulletin 1385 Water Issues in Georgia— 25
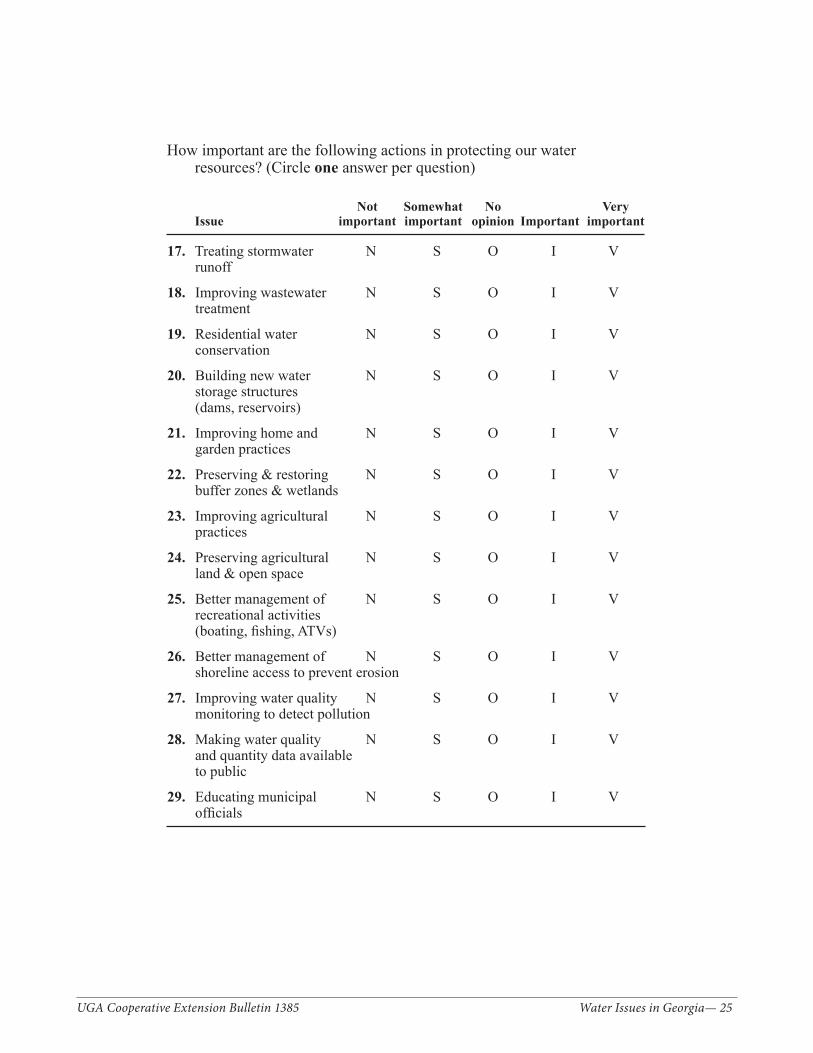
How important are the following actions in protecting our water resources? (Circle one answer per question)
Not Somewhat No Very Issue important important opinion Important important
17. Treating stormwater N S O I Vrunoff
18. Improving wastewater N S O I Vtreatment
19. Residential water N S O I Vconservation
20. Building new water N S O I Vstorage structures (dams, reservoirs)
21. Improving home and N S O I Vgarden practices
22. Preserving & restoring N S O I V buffer zones & wetlands
23. Improving agricultural N S O I V practices
24. Preserving agricultural N S O I V land & open space
25. Better management of N S O I V recreational activities
(boating, fishing, ATVs)
26. Better management of N S O I V shoreline access to prevent erosion
27. Improving water quality N S O I V monitoring to detect pollution
28. Making water quality N S O I V and quantity data available
to public
29. Educating municipal N S O I V officials
PLEASE ANSWER THE FOLLOWING AS THEY PERTAIN TO YOU
52. Where do you live?a. Inside city limitsb. Outside city limits, not engaged in farmingc. Outside city limits, currently engaged in farming
53. The population of the city/town in which you live is:a. More than 100,000 peopleb. 25,000 to 100,000 peoplec. 7,000 to 25,000 peopled. 3,500 to 7,000 peoplee. Less than 3,500 people
54. What is your zip code?
ZIP CODE ____________________
55. How long have you lived in Georgia?a. All my lifeb. More than 10 years, but not all my lifec. 5 to 9 yearsd. Less than 5 years
56. What is your gender?a. Maleb. Female
57. What is your age?
______ years old
58. What is the highest level of education you have completed?a. Less than high school or some high schoolb. High school graduatec. Some college or vocational trainingd. College graduatee. Advanced college or other professional degree

26 — Water Issues in Georgia UGA Cooperative Extension Bulletin 1385
DRINKING WATER ISSUES
30. Where do you primarily get your drinking water? (Circle one answer) a. Private supply (private well, river, pond, lake) b. Public supply – municipal c. Public supply – rural water district d. Purchase bottled water e. I don’t know31. Please check all of the boxes that apply to your home drinking water
system. I have a water treatment system (softener, etc.) I have a water filter I purchase 5 gallon containers of drinking water I often use bottled water for drinking purposes I never buy bottled water I am satisfied with my drinking water (piped in house) I am not satisfied with my current drinking water (piped in house) My drinking water is separate from my water supply system32. Do you feel that your home tap drinking water is safe to drink?
a. Yesb. No
33. Do you have your home drinking water tested?a. Yesb. No
PROTECTING AND PRESERVING WATER RESOURCES
34. In your opinion, what is the quality of groundwater (sources of well water) in your area?a. Good or excellentb. Good, and improvingc. Good, but deterioratingd. Faire. Poor, but improvingf. Poorg. No opinion / don’t know
49. If you had the following kinds of learning opportunities to learn more about water issues, which would you be most likely to take advantage of? (Check up to 3 items) Read printed fact sheets, bulletins, or brochures Visit a web site Attend a short course or workshop Look at a demonstration or display Read a newspaper article or series Watch TV coverage Watch a video of information Take part in a onetime volunteer activity (for example, water monitoring,
streamside restoration, or education) Take a course for certification or credit Get trained for a regular volunteer position (for example, as a watershed
steward or a water quality monitor) Learn how to conduct a home, farm, or workplace water practices
assessment Attend a fair or festival
50. Have you ever changed your mind about an environmental issue as a result of: (Check all that apply) News coverage (TV, newspapers, Internet, etc.) Conversations with other people Attending public meetings or participating in volunteer activities Classes or presentations Speech by an elected official Firsthand observation (field trips, etc.) Financial considerations
51. Do you think that the amount of rainfall in your area will change as a result of global warming?a. Yes, a significant increase in rainfallb. Yes, a slight increase in rainfallc. No, no change in rainfalld. Yes, a slight decrease in rainfalle. Yes, a significant decrease in rainfallf. I don’t know
UGA Cooperative Extension Bulletin 1385 Water Issues in Georgia— 27
35. In your opinion, what is the quality of surface waters (rivers, streams, lakes, channels, and wetlands) where you live?a. Good or excellentb. Good, and improvingc. Good, but deterioratingd. Faire. Poor, but improvingf. Poorg. No opinion / don’t know
36. Do you regard water quantity (having enough water) as a problem in the area where you live? (Circle one answer)a. Definitely notb. Probably notc. I don’t knowd. Probablye. Definitely yes
37. Do you know of or suspect that any of the following pollutants affect either surface or groundwater quality in your area?
Know it Suspect it Suspect it Know it is NOT a is NOT a Don’t IS a IS a Pollutant problem problem know problem problem
a. Pathogens (bacteria, 1 2 3 4 5 viruses, germs)b. Fertilizer/Nitrates 1 2 3 4 5c. Fertilizer/Phosphates 1 2 3 4 5d. Heavy metals 1 2 3 4 5 (lead, arsenic, mercury)e. Minerals (iron, 1 2 3 4 5 manganese, calcium)f. Pesticides 1 2 3 4 5g. Salinity (water too salty) 1 2 3 4 5h. Pharmaceuticals 1 2 3 4 5 (antibiotics, personal care products)i. Petroleum products 1 2 3 4 5j. Algae 1 2 3 4 5k. Product and waste water 1 2 3 4 5 from miningl. Septic systems 1 2 3 4 5
46. Please place an X on the line below to indicate how you see yourself on environmental issues:
Average American adult
FOR EQUAL FORTOTAL BALANCE TOTALNATURAL BETWEEN ENVIRONMENTALRESOURCE USE AND PROTECTIONUSE PROTECTION
47. Have you participated in any of the following activities? (Circle all that apply)a. Master Gardener programb. Volunteer water quality monitoringc. Lake, river, bay, wetland, or watershed protection groupsd. County, municipal, township or tribal commission meetings
48. Would you like to learn more about any of the following water quality issue areas? (Check all that interest you) Watershed management Watershed restoration Forest management and water issues Irrigation management Animal waste management Nutrient and pesticide management Private well protection Septic system management Protecting public drinking water supplies Water policy and economics Community actions concerning water issues Fish and wildlife water needs Home and garden landscaping Restoring fish and aquatic habitat Landscape buffers Shoreline clean-up
28 — Water Issues in Georgia UGA Cooperative Extension Bulletin 1385
38. In your opinion, what is the quality of ocean waters off the coast of the Southern states?a. Good or excellentb. Good, and improvingc. Good, but deterioratingd. Faire. Poor, but improvingf. Poorg. No opinion / don’t know
39. In your opinion, which of the following are most responsible for the existing pollution problems in rivers and lakes in your state? (Check up to 3 answers) Forestry (wood harvesting) Agriculture – crops Agriculture – animals Erosion from roads and/or construction, repair Industry Military bases Septic systems Runoff from home landscapes Stormwater runoff Landfills Wastewater treatment plants New suburban development Oil wells and mining
40. Do you know what a watershed is? (Check one box) Yes No
41. How well do you feel each one of these groups is fulfilling their responsibility for protecting water resources in your community? (Circle one answer per group)
Very Moderately Don’t Somewhat Very Group well well know poorly poorly
a. Federal government 1 2 3 4 5b. State government 1 2 3 4 5c. Your county, city, or town 1 2 3 4 5d. Individual citizens 1 2 3 4 5
42. The likelihood of your area suffering from a prolonged drought is:a. Increasingb. Decreasingc. Staying the samed. No opinion
43. The likelihood of your area having enough water resources to meet all of its needs 10 years from now is:a. High (likely enough water)b. Mediumc. Low (likely not enough water)d. No opinion
44. Have you or someone in your household done any of the following as part of an individual or community effort to conserve water or preserve water quality? (Check all that apply) Changed the way your yard is landscaped Changed how often you water your yard Changed your use of pesticides, fertilizers, or other chemicals Pumped your septic system (if you have one) Adopted new technologies (low flow faucets, etc.)
45. Have you received water resources information from the following sources? (Check one box per source) Yes Noa. Cable television b. Network television c. Public television d. Local newspapers e. Major newspapers f. Extension g. Universities h. Schools i. Environmental agencies j. Environmental groups k. Magazines l. Radio m. Friends and family

UGA Cooperative Extension Bulletin 1385 Water Issues in Georgia— 29
38. In your opinion, what is the quality of ocean waters off the coast of the Southern states?a. Good or excellentb. Good, and improvingc. Good, but deterioratingd. Faire. Poor, but improvingf. Poorg. No opinion / don’t know
39. In your opinion, which of the following are most responsible for the existing pollution problems in rivers and lakes in your state? (Check up to 3 answers) Forestry (wood harvesting) Agriculture – crops Agriculture – animals Erosion from roads and/or construction, repair Industry Military bases Septic systems Runoff from home landscapes Stormwater runoff Landfills Wastewater treatment plants New suburban development Oil wells and mining
40. Do you know what a watershed is? (Check one box) Yes No
41. How well do you feel each one of these groups is fulfilling their responsibility for protecting water resources in your community? (Circle one answer per group)
Very Moderately Don’t Somewhat Very Group well well know poorly poorly
a. Federal government 1 2 3 4 5b. State government 1 2 3 4 5c. Your county, city, or town 1 2 3 4 5d. Individual citizens 1 2 3 4 5
42. The likelihood of your area suffering from a prolonged drought is:a. Increasingb. Decreasingc. Staying the samed. No opinion
43. The likelihood of your area having enough water resources to meet all of its needs 10 years from now is:a. High (likely enough water)b. Mediumc. Low (likely not enough water)d. No opinion
44. Have you or someone in your household done any of the following as part of an individual or community effort to conserve water or preserve water quality? (Check all that apply) Changed the way your yard is landscaped Changed how often you water your yard Changed your use of pesticides, fertilizers, or other chemicals Pumped your septic system (if you have one) Adopted new technologies (low flow faucets, etc.)
45. Have you received water resources information from the following sources? (Check one box per source) Yes Noa. Cable television b. Network television c. Public television d. Local newspapers e. Major newspapers f. Extension g. Universities h. Schools i. Environmental agencies j. Environmental groups k. Magazines l. Radio m. Friends and family
30 — Water Issues in Georgia UGA Cooperative Extension Bulletin 1385
35. In your opinion, what is the quality of surface waters (rivers, streams, lakes, channels, and wetlands) where you live?a. Good or excellentb. Good, and improvingc. Good, but deterioratingd. Faire. Poor, but improvingf. Poorg. No opinion / don’t know
36. Do you regard water quantity (having enough water) as a problem in the area where you live? (Circle one answer)a. Definitely notb. Probably notc. I don’t knowd. Probablye. Definitely yes
37. Do you know of or suspect that any of the following pollutants affect either surface or groundwater quality in your area?
Know it Suspect it Suspect it Know it is NOT a is NOT a Don’t IS a IS a Pollutant problem problem know problem problem
a. Pathogens (bacteria, 1 2 3 4 5 viruses, germs)b. Fertilizer/Nitrates 1 2 3 4 5c. Fertilizer/Phosphates 1 2 3 4 5d. Heavy metals 1 2 3 4 5 (lead, arsenic, mercury)e. Minerals (iron, 1 2 3 4 5 manganese, calcium)f. Pesticides 1 2 3 4 5g. Salinity (water too salty) 1 2 3 4 5h. Pharmaceuticals 1 2 3 4 5 (antibiotics, personal care products)i. Petroleum products 1 2 3 4 5j. Algae 1 2 3 4 5k. Product and waste water 1 2 3 4 5 from miningl. Septic systems 1 2 3 4 5
46. Please place an X on the line below to indicate how you see yourself on environmental issues:
Average American adult
FOR EQUAL FORTOTAL BALANCE TOTALNATURAL BETWEEN ENVIRONMENTALRESOURCE USE AND PROTECTIONUSE PROTECTION
47. Have you participated in any of the following activities? (Circle all that apply)a. Master Gardener programb. Volunteer water quality monitoringc. Lake, river, bay, wetland, or watershed protection groupsd. County, municipal, township or tribal commission meetings
48. Would you like to learn more about any of the following water quality issue areas? (Check all that interest you) Watershed management Watershed restoration Forest management and water issues Irrigation management Animal waste management Nutrient and pesticide management Private well protection Septic system management Protecting public drinking water supplies Water policy and economics Community actions concerning water issues Fish and wildlife water needs Home and garden landscaping Restoring fish and aquatic habitat Landscape buffers Shoreline clean-up
UGA Cooperative Extension Bulletin 1385 Water Issues in Georgia— 31
DRINKING WATER ISSUES
30. Where do you primarily get your drinking water? (Circle one answer) a. Private supply (private well, river, pond, lake) b. Public supply – municipal c. Public supply – rural water district d. Purchase bottled water e. I don’t know31. Please check all of the boxes that apply to your home drinking water
system. I have a water treatment system (softener, etc.) I have a water filter I purchase 5 gallon containers of drinking water I often use bottled water for drinking purposes I never buy bottled water I am satisfied with my drinking water (piped in house) I am not satisfied with my current drinking water (piped in house) My drinking water is separate from my water supply system32. Do you feel that your home tap drinking water is safe to drink?
a. Yesb. No
33. Do you have your home drinking water tested?a. Yesb. No
PROTECTING AND PRESERVING WATER RESOURCES
34. In your opinion, what is the quality of groundwater (sources of well water) in your area?a. Good or excellentb. Good, and improvingc. Good, but deterioratingd. Faire. Poor, but improvingf. Poorg. No opinion / don’t know
49. If you had the following kinds of learning opportunities to learn more about water issues, which would you be most likely to take advantage of? (Check up to 3 items) Read printed fact sheets, bulletins, or brochures Visit a web site Attend a short course or workshop Look at a demonstration or display Read a newspaper article or series Watch TV coverage Watch a video of information Take part in a onetime volunteer activity (for example, water monitoring,
streamside restoration, or education) Take a course for certification or credit Get trained for a regular volunteer position (for example, as a watershed
steward or a water quality monitor) Learn how to conduct a home, farm, or workplace water practices
assessment Attend a fair or festival
50. Have you ever changed your mind about an environmental issue as a result of: (Check all that apply) News coverage (TV, newspapers, Internet, etc.) Conversations with other people Attending public meetings or participating in volunteer activities Classes or presentations Speech by an elected official Firsthand observation (field trips, etc.) Financial considerations
51. Do you think that the amount of rainfall in your area will change as a result of global warming?a. Yes, a significant increase in rainfallb. Yes, a slight increase in rainfallc. No, no change in rainfalld. Yes, a slight decrease in rainfalle. Yes, a significant decrease in rainfallf. I don’t know
32 — Water Issues in Georgia UGA Cooperative Extension Bulletin 1385
How important are the following actions in protecting our water resources? (Circle one answer per question)
Not Somewhat No Very Issue important important opinion Important important
17. Treating stormwater N S O I Vrunoff
18. Improving wastewater N S O I Vtreatment
19. Residential water N S O I Vconservation
20. Building new water N S O I Vstorage structures (dams, reservoirs)
21. Improving home and N S O I Vgarden practices
22. Preserving & restoring N S O I V buffer zones & wetlands
23. Improving agricultural N S O I V practices
24. Preserving agricultural N S O I V land & open space
25. Better management of N S O I V recreational activities
(boating, fishing, ATVs)
26. Better management of N S O I V shoreline access to prevent erosion
27. Improving water quality N S O I V monitoring to detect pollution
28. Making water quality N S O I V and quantity data available
to public
29. Educating municipal N S O I V officials
PLEASE ANSWER THE FOLLOWING AS THEY PERTAIN TO YOU
52. Where do you live?a. Inside city limitsb. Outside city limits, not engaged in farmingc. Outside city limits, currently engaged in farming
53. The population of the city/town in which you live is:a. More than 100,000 peopleb. 25,000 to 100,000 peoplec. 7,000 to 25,000 peopled. 3,500 to 7,000 peoplee. Less than 3,500 people
54. What is your zip code?
ZIP CODE ____________________
55. How long have you lived in Georgia?a. All my lifeb. More than 10 years, but not all my lifec. 5 to 9 yearsd. Less than 5 years
56. What is your gender?a. Maleb. Female
57. What is your age?
______ years old
58. What is the highest level of education you have completed?a. Less than high school or some high schoolb. High school graduatec. Some college or vocational trainingd. College graduatee. Advanced college or other professional degree
UGA Cooperative Extension Bulletin 1385 Water Issues in Georgia— 33
WATER ISSUES IN GEORGIA
HOW DO YOU FEEL ABOUT THE ENVIRONMENT?
How important are each of the following water issues to you? (Circle one answer per question)
Not Somewhat No Very Issue important important opinion Important important
1. Clean rivers and lakes N S O I V 2. Clean marine water N S O I V 3. Clean bays and estuaries N S O I V 4. Clean water for N S O I V
shellfishing 5. Clean beaches N S O I V 6. Clean drinking water N S O I V 7. Clean groundwater N S O I V 8. Water for commerce/ N S O I V
industry/power generation 9. Water for household N S O I V
landscapes 10. Water for agriculture N S O I V 11. Water for aquatic N S O I V
habitat 12. Water for recreation N S O I V 13. Water for municipal use N S O I V14. Interstate transfer/sale N S O I V
of water rights15. Within state transfer/sale N S O I V
of water rights16. Hypoxia (Gulf dead zone) N S O I V
59. Where do you normally get your news? (Check all that apply) Local newspapers Major newspapers Radio Internet Local television National television Cable television Public television Magazines or newsletters
THANK YOU FOR YOUR HELP

Bulletin 1385 Reviewed June 2014
The University of Georgia, Fort Valley State University, the U.S. Department of Agriculture and counties of the state cooperating. UGA Extension offers educational programs, assistance and materials to all people without regard to race, color, national origin, age, gender or disability.
The University of Georgia is committed to principles of equal opportunity and affirmative action.