waternatural resourcesenvironmentinfrastructureenergy north georgia agricultural water use study...
TRANSCRIPT
WATER NATURAL RESOURCES ENVIRONMENT INFRASTRUCTURE ENERGY
NORTH GEORGIA AGRICULTURAL WATER USE
STUDYNorth Georgia Water Resources Educational Seminar
Erin Lincoln, PHApril 22, 2015

Introduction
Introduction
• Determine existing permitted and non-permitted water use information available
• Determine water use needs for specific agricultural products– Crops (corn, apple orchards, etc.)– Poultry– Livestock (beef, dairy, swine, etc.)
• Determine gaps in existing data and plan to fill the gaps
Introduction
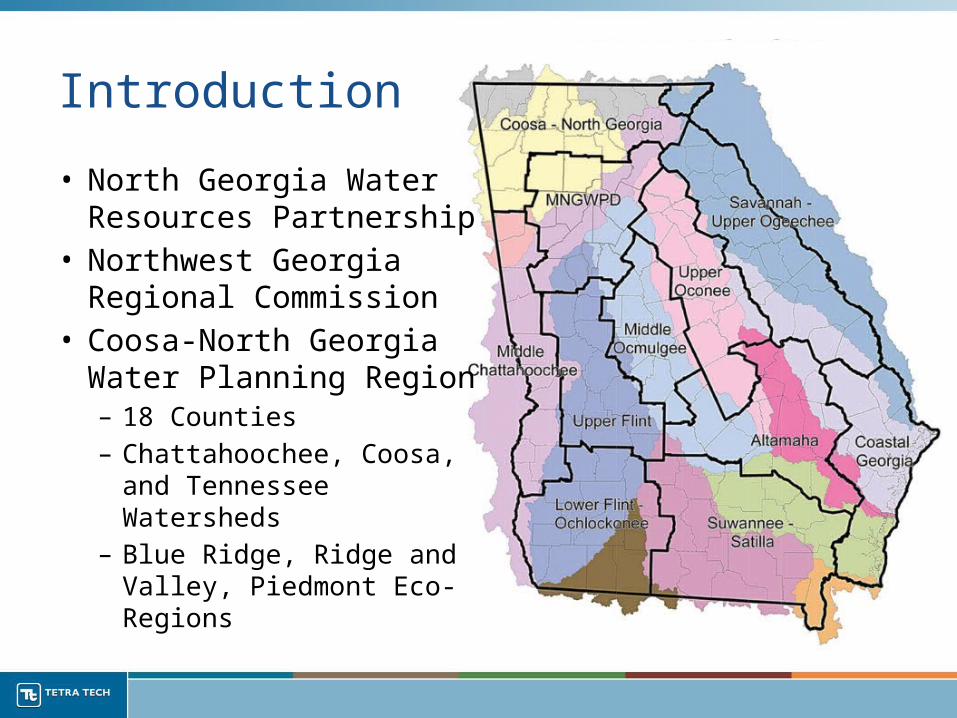
• North Georgia Water Resources Partnership
• Northwest Georgia Regional Commission
• Coosa-North Georgia Water Planning Region– 18 Counties– Chattahoochee, Coosa, and
Tennessee Watersheds– Blue Ridge, Ridge and
Valley, Piedmont Eco-Regions
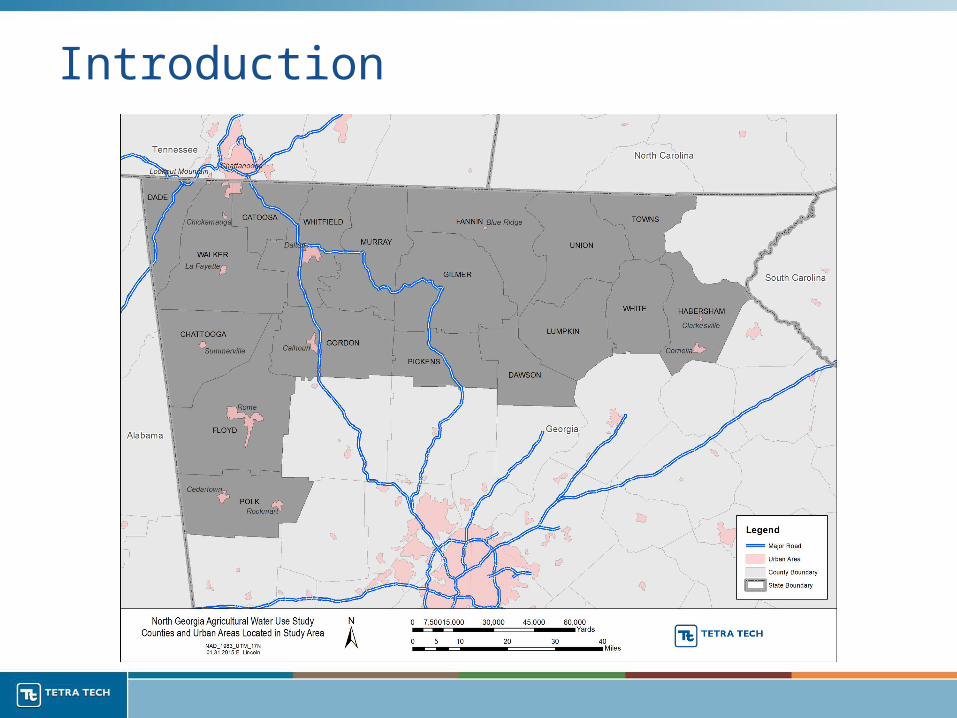
Introduction
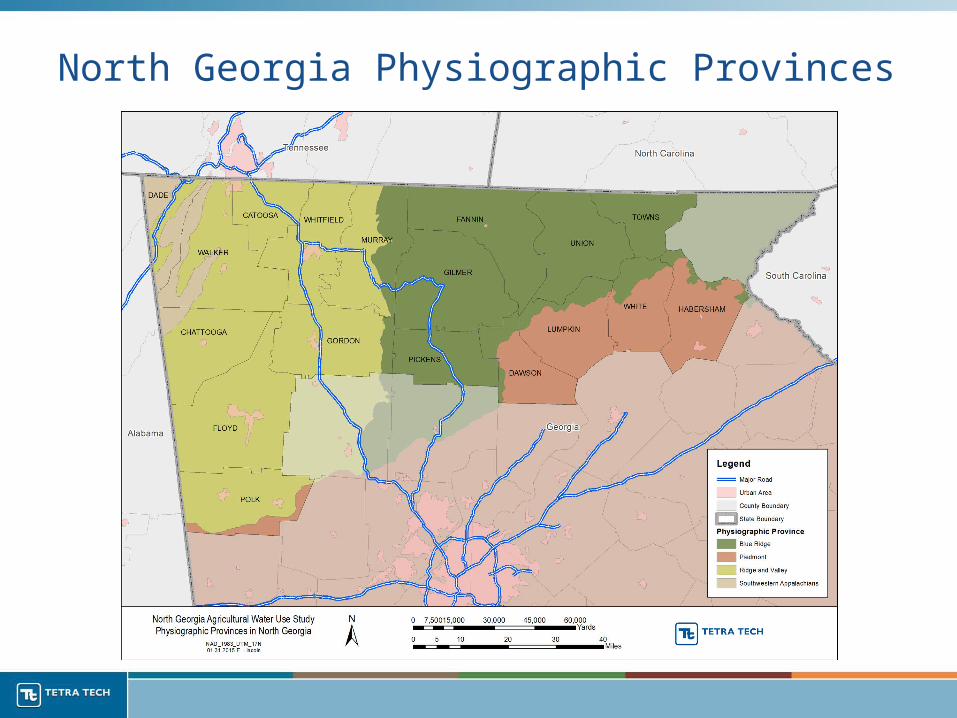
North Georgia Physiographic Provinces
North Georgia Crop Acreage
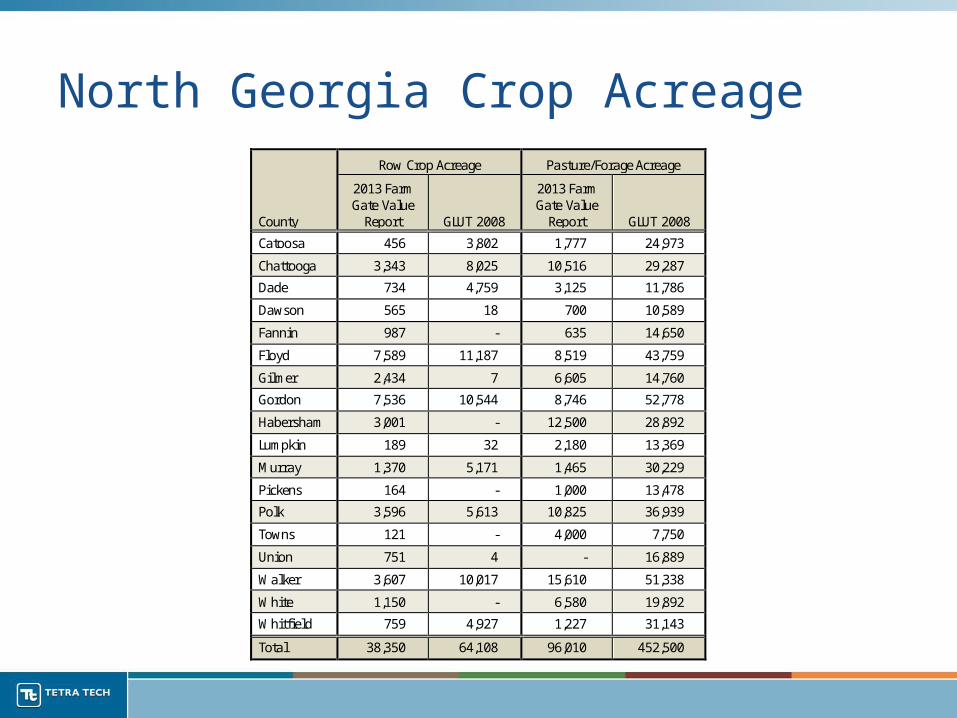
North Georgia Crop Acreage
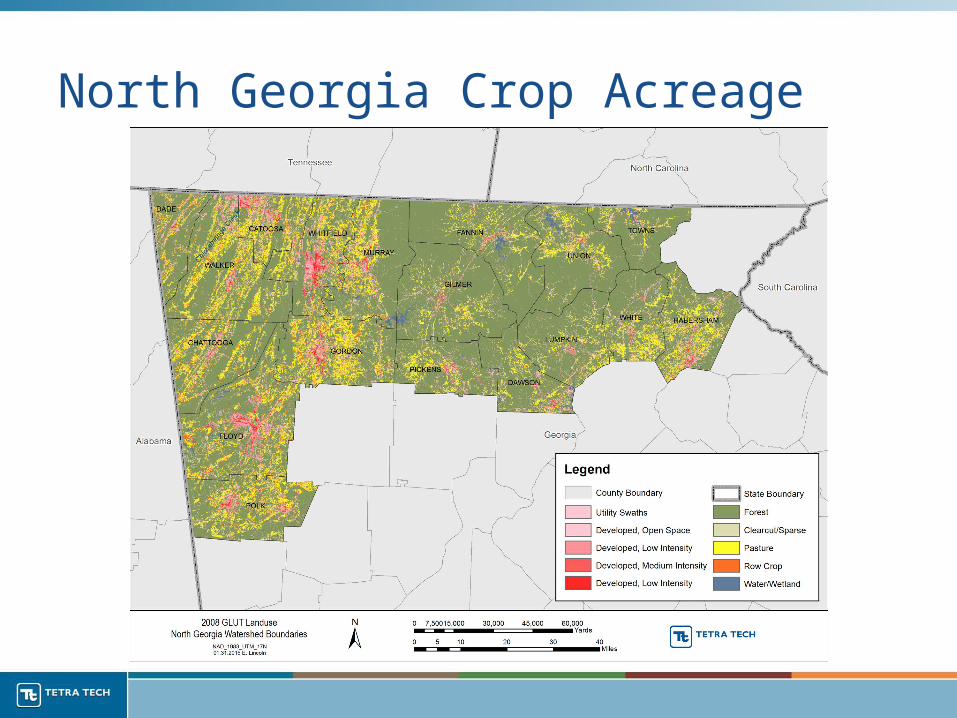
• 2008 Georgia Land Use Trend (GLUT) – Natural Resources Spatial Analyst Laboratory (NARSAL)– LANDSAT data
• 2014 Farm Gate Value Report – College of Education and Agricultural Sciences– County Extension Agents
North Georgia Crop Acreage
North Georgia Crop Acreage
County
Row Crop Acreage Pasture/Forage Acreage
2013 Farm Gate Value
Report GLUT 2008
2013 Farm Gate Value
Report GLUT 2008
Catoosa 456 3,802 1,777 24,973
Chattooga 3,343 8,025 10,516 29,287
Dade 734 4,759 3,125 11,786
Dawson 565 18 700 10,589
Fannin 987 - 635 14,650
Floyd 7,589 11,187 8,519 43,759
Gilmer 2,434 7 6,605 14,760
Gordon 7,536 10,544 8,746 52,778
Habersham 3,001 - 12,500 28,892
Lumpkin 189 32 2,180 13,369
Murray 1,370 5,171 1,465 30,229
Pickens 164 - 1,000 13,478
Polk 3,596 5,613 10,825 36,939
Towns 121 - 4,000 7,750
Union 751 4 - 16,889
Walker 3,607 10,017 15,610 51,338
White 1,150 - 6,580 19,892
Whitfield 759 4,927 1,227 31,143
Total 38,350 64,108 96,010 452,500
Estimated Irrigated Acreage
• Agricultural Permitting Unit of GAEPD– Permit required for withdrawals of 100,000 GPD– Small farms typically don’t need a permit
• National Environmentally Sound Production Agriculture Laboratory (NESPAL)– Agricultural Permitting Unit of GAEPD – Agricultural and Water Conservation and Metering
Program (GSWCC)– GIS Imagery
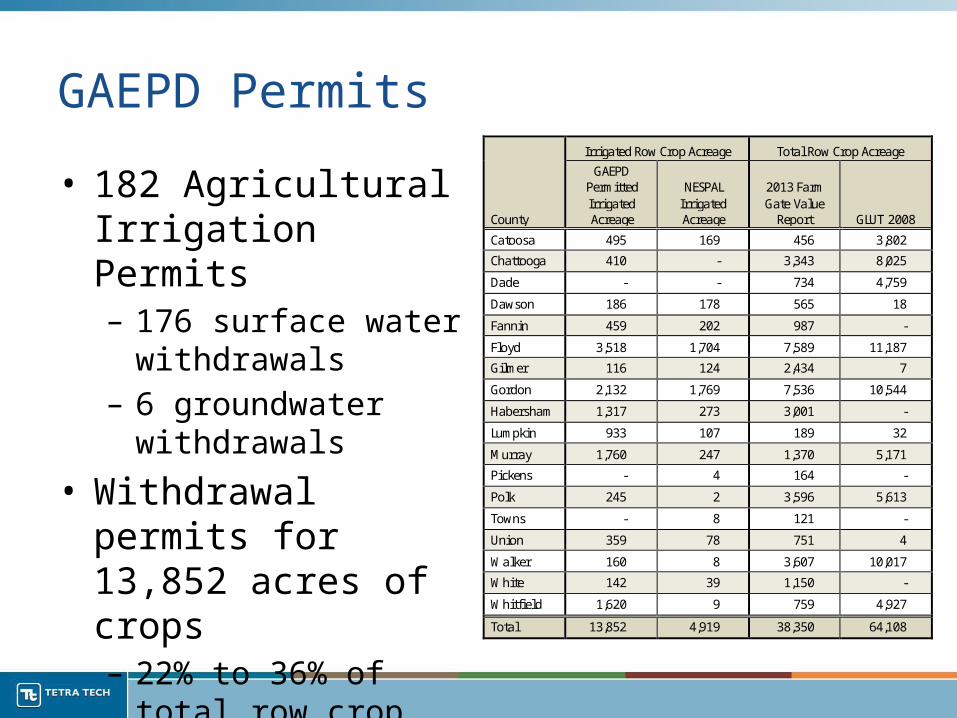
GAEPD Permits
• 182 Agricultural Irrigation Permits– 176 surface water
withdrawals– 6 groundwater
withdrawals
• Withdrawal permits for 13,852 acres of crops– 22% to 36% of total row
crop acreage
County
Irrigated Row Crop Acreage Total Row Crop Acreage
GAEPD Permitted Irrigated Acreage
NESPAL Irrigated Acreage
2013 Farm Gate Value
Report GLUT 2008
Catoosa 495 169 456 3,802
Chattooga 410 - 3,343 8,025
Dade - - 734 4,759
Dawson 186 178 565 18
Fannin 459 202 987 -
Floyd 3,518 1,704 7,589 11,187
Gilmer 116 124 2,434 7
Gordon 2,132 1,769 7,536 10,544
Habersham 1,317 273 3,001 -
Lumpkin 933 107 189 32
Murray 1,760 247 1,370 5,171
Pickens - 4 164 -
Polk 245 2 3,596 5,613
Towns - 8 121 -
Union 359 78 751 4
Walker 160 8 3,607 10,017
White 142 39 1,150 -
Whitfield 1,620 9 759 4,927
Total 13,852 4,919 38,350 64,108
Estimated Crop Irrigation Requirements
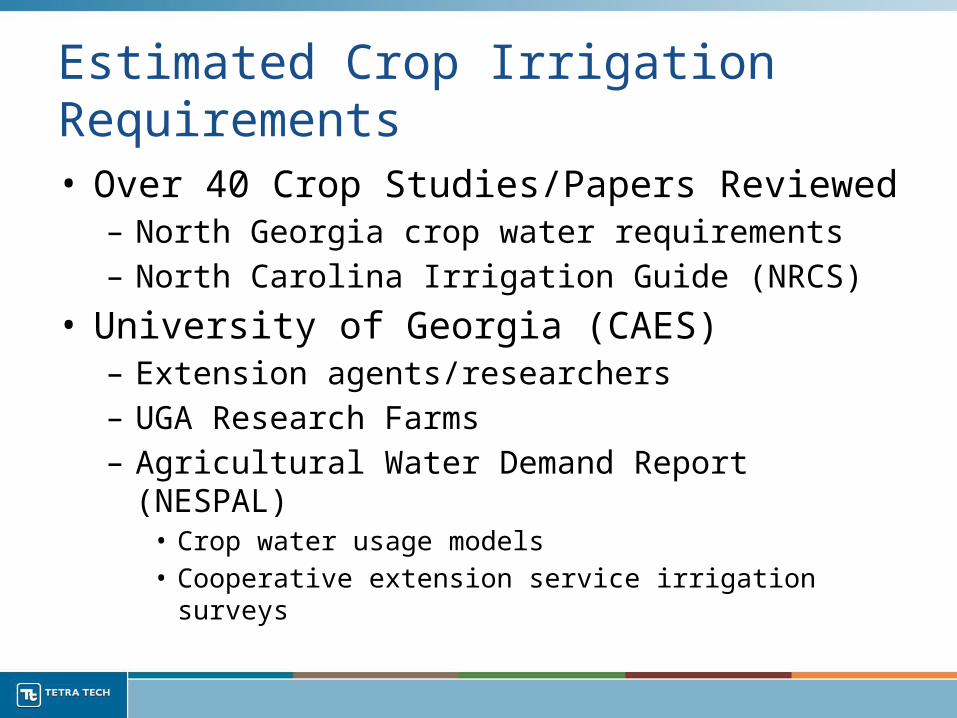
Estimated Crop Irrigation Requirements• Over 40 Crop Studies/Papers Reviewed
– North Georgia crop water requirements– North Carolina Irrigation Guide (NRCS)
• University of Georgia (CAES)– Extension agents/researchers– UGA Research Farms– Agricultural Water Demand Report (NESPAL)
• Crop water usage models• Cooperative extension service irrigation surveys
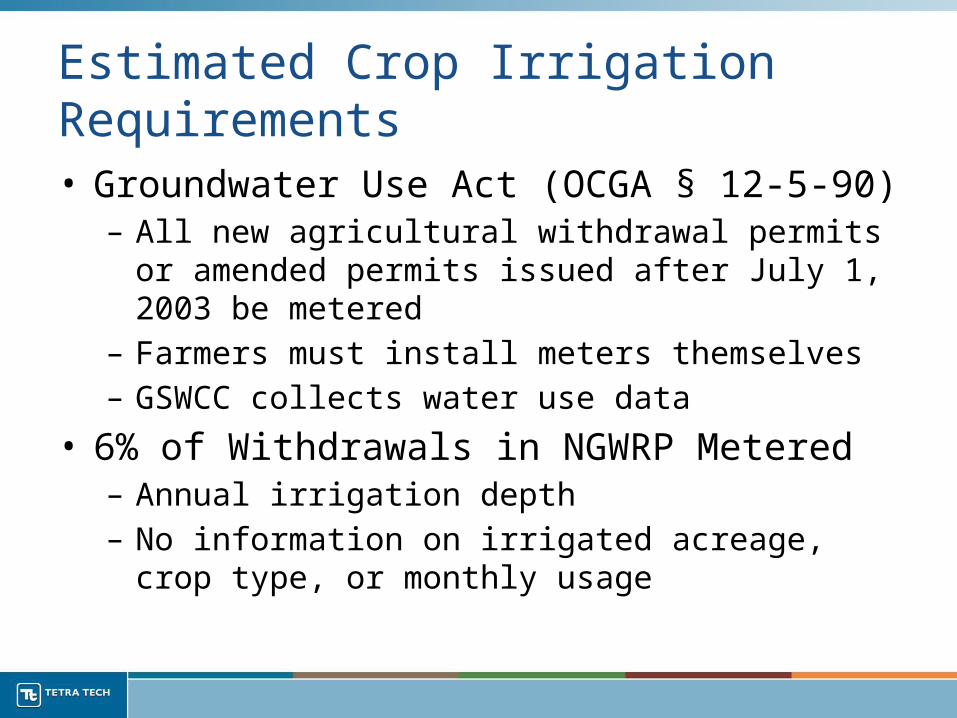
Estimated Crop Irrigation Requirements• Groundwater Use Act (OCGA § 12-5-90)
– All new agricultural withdrawal permits or amended permits issued after July 1, 2003 be metered
– Farmers must install meters themselves– GSWCC collects water use data
• 6% of Withdrawals in NGWRP Metered– Annual irrigation depth– No information on irrigated acreage, crop type, or monthly
usage

Estimated Crop Irrigation Requirements• Irrigation amounts extremely variable between
farmers– Desired yields/personal preference– Soil/topography– Irrigation system efficiency rates
• On average, crops typically need 1 in/week– Fruit, vegetables, and ornamentals need more– 1.1 to 1.3 in/week due to irrigation efficiencies– No irrigation during wet years
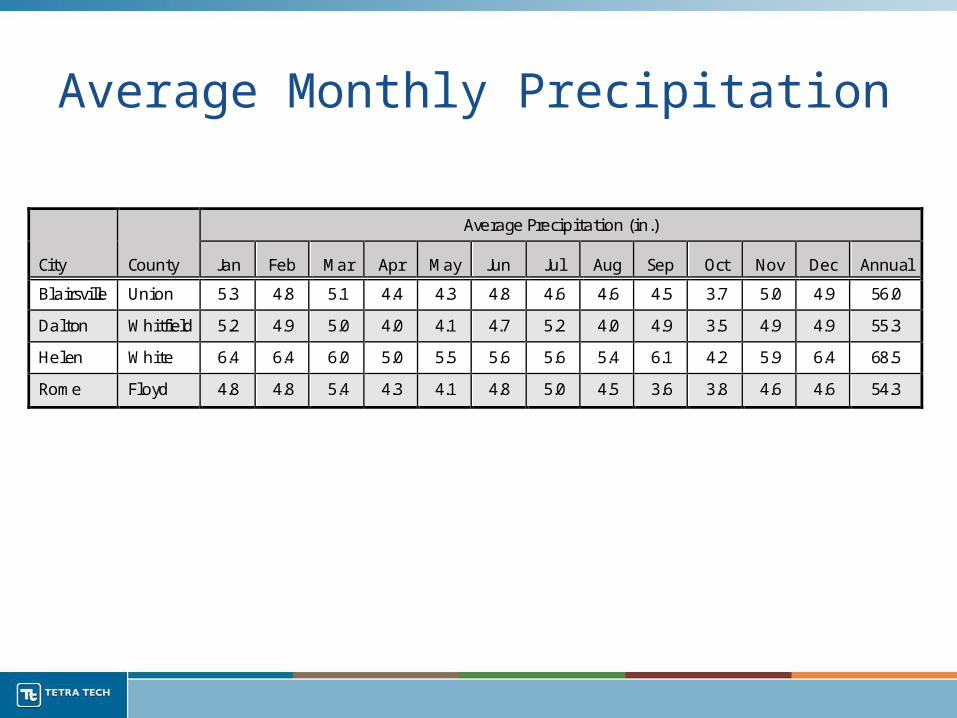
Average Monthly Precipitation
City County
Average Precipi tation (in.)
Jan Feb Mar Apr May Jun Jul Aug Sep Oct Nov Dec Annual
Bla irsville Union 5.3 4.8 5.1 4.4 4.3 4.8 4.6 4.6 4.5 3.7 5.0 4.9 56.0
Da l ton Whitfield 5.2 4.9 5.0 4.0 4.1 4.7 5.2 4.0 4.9 3.5 4.9 4.9 55.3
Helen White 6.4 6.4 6.0 5.0 5.5 5.6 5.6 5.4 6.1 4.2 5.9 6.4 68.5
Rome Floyd 4.8 4.8 5.4 4.3 4.1 4.8 5.0 4.5 3.6 3.8 4.6 4.6 54.3
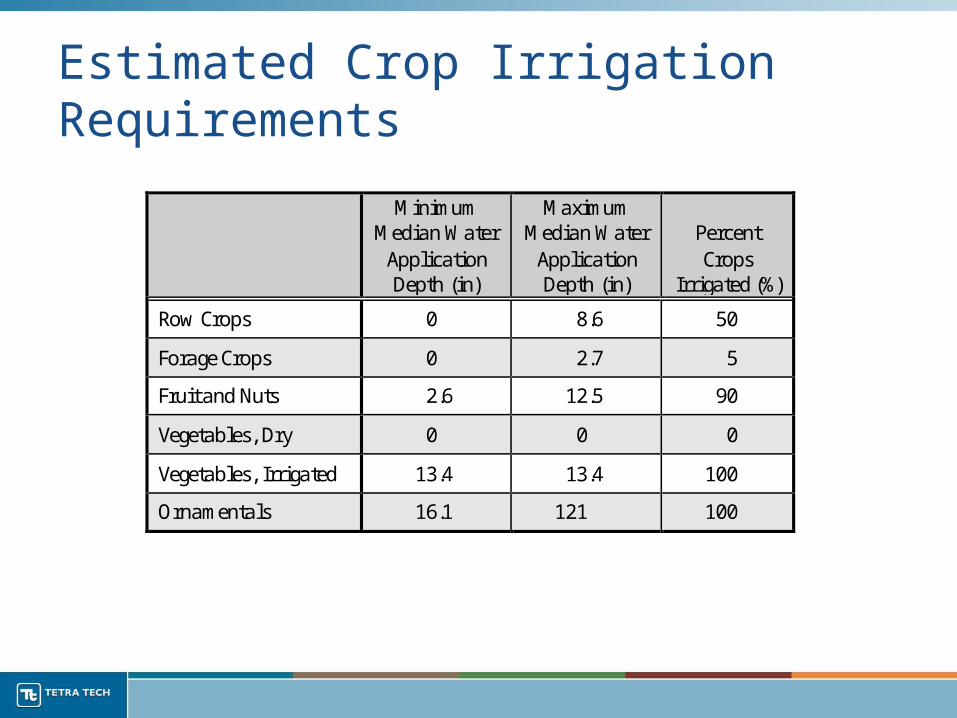
Estimated Crop Irrigation Requirements
Minimum Median Water
Application Depth (in)
Maximum Median Water
Application Depth (in)
Percent Crops
Irrigated (%)
Row Crops 0 8.6 50
Forage Crops 0 2.7 5
Fruit and Nuts 2.6 12.5 90
Vegetables, Dry 0 0 0
Vegetables, Irrigated 13.4 13.4 100
Ornamentals 16.1 121 100
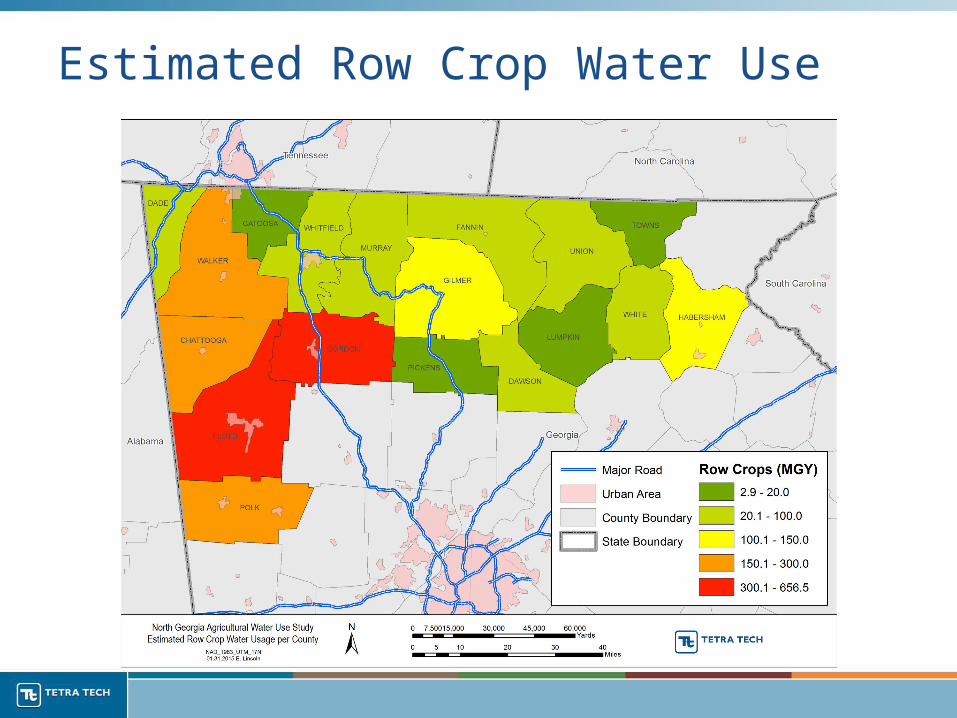
Estimated Row Crop Water Use
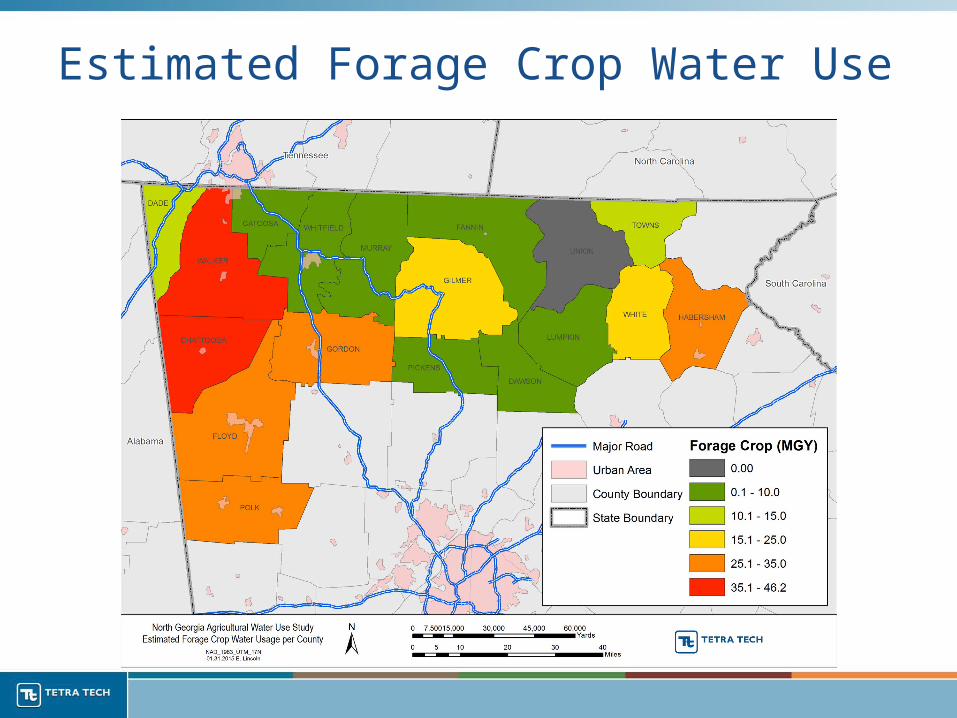
Estimated Forage Crop Water Use
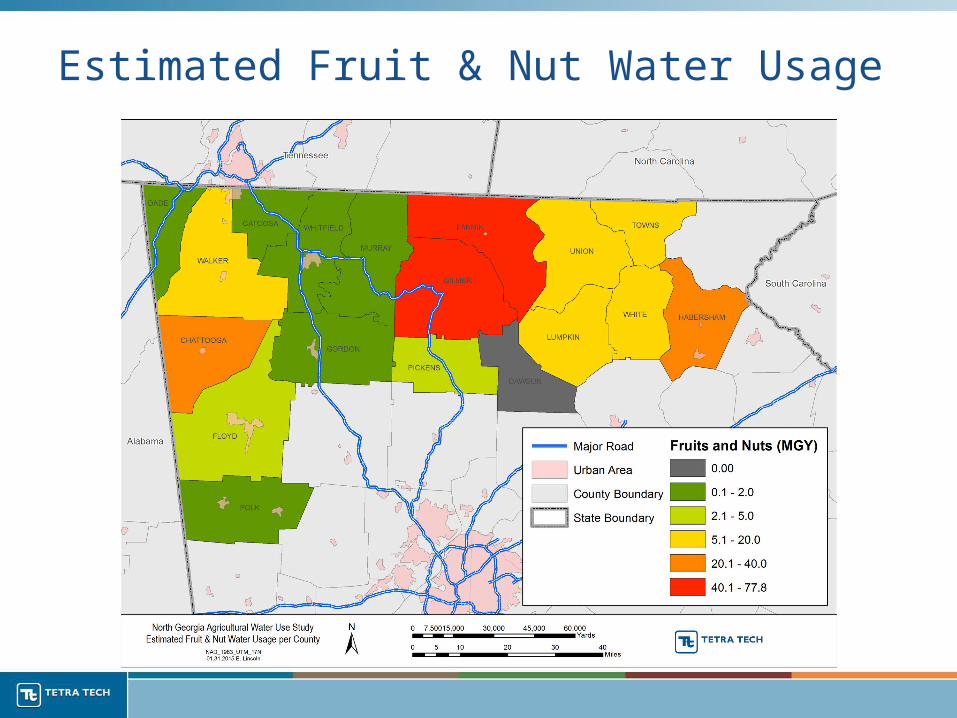
Estimated Fruit & Nut Water Usage
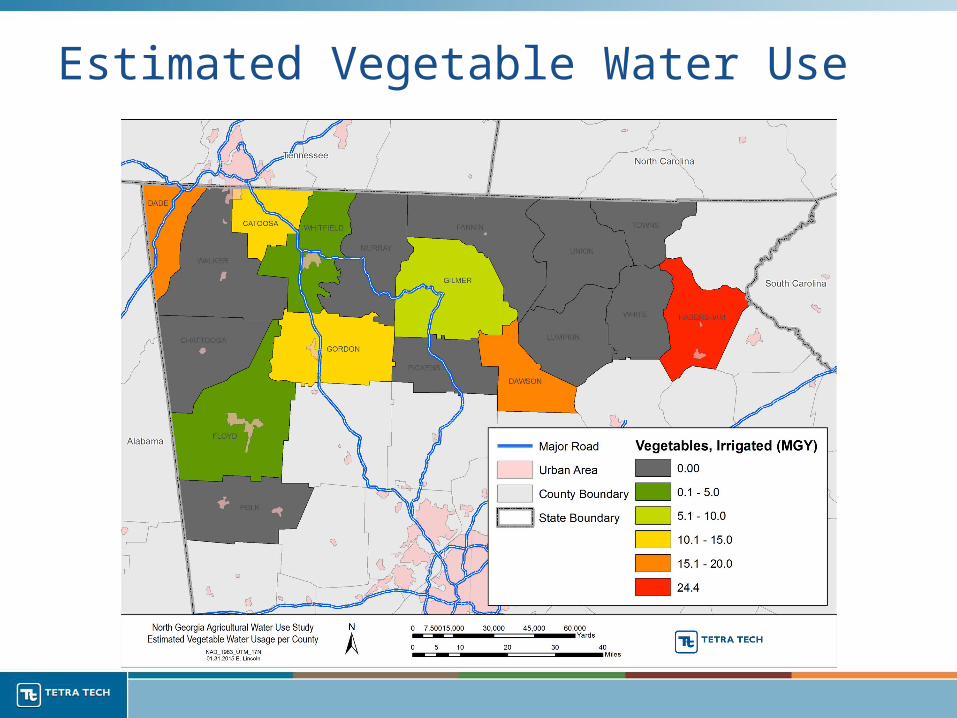
Estimated Vegetable Water Use
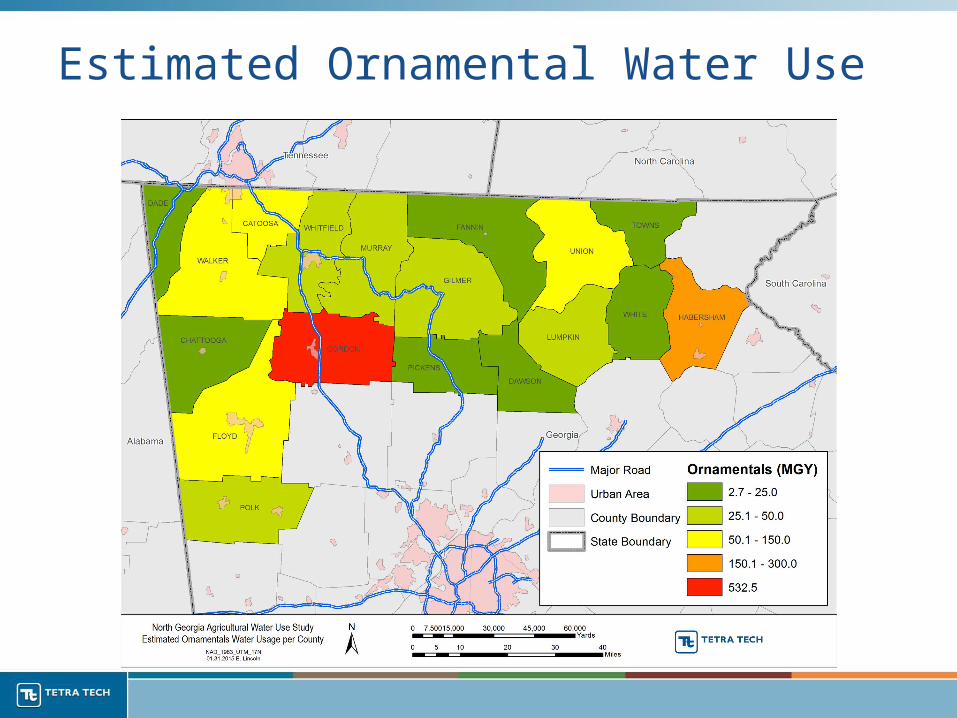
Estimated Ornamental Water Use
Estimated Poultry & Livestock Water Usage

Estimated Poultry & Livestock Water Usage• 19 withdrawal permits for poultry & livestock• Total number of animals and water usage sources
– 2014 Farm Gate Value Report– GA Poultry Federation– University of Georgia (CAES)– Agricultural Water Demand Report (NESPAL)
• Water usage depends on animal type and season– Animal size and lifespan– Consumption and evaporative cooling
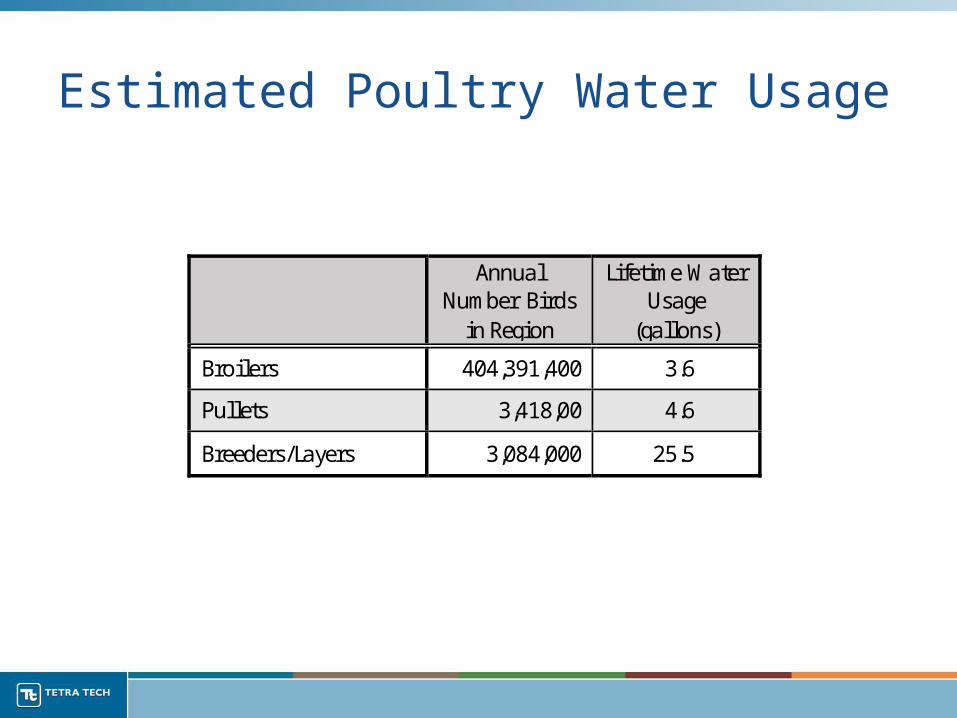
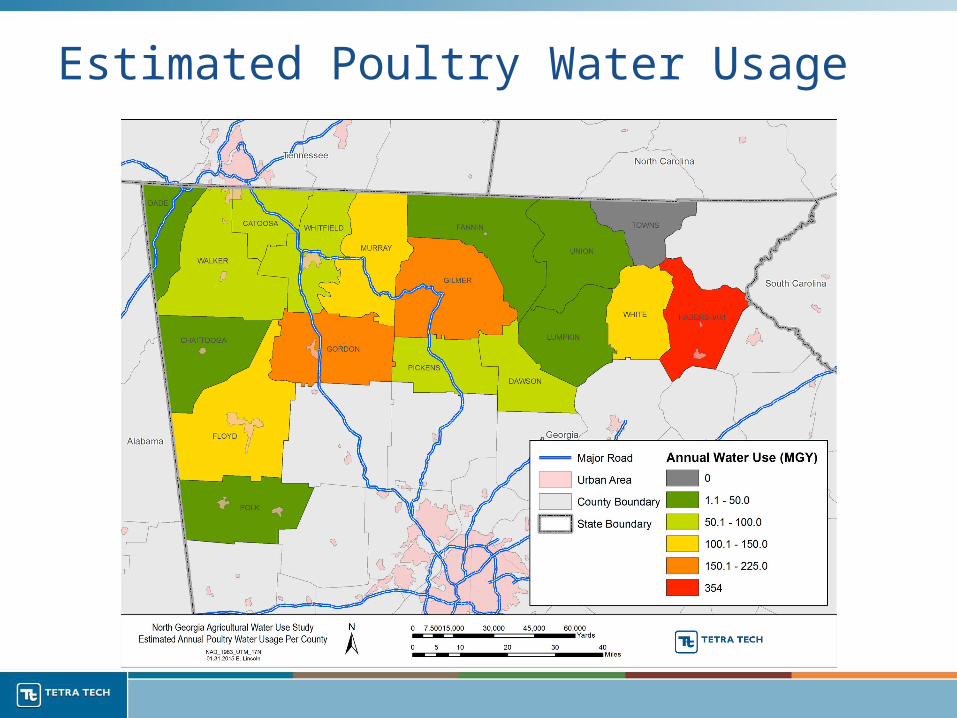
Estimated Poultry Water Usage
Annual Number Birds
in Region
Lifetime Water Usage
(gallons)
Broilers 404,391,400 3.6
Pullets 3,418,00 4.6
Breeders/Layers 3,084,000 25.5
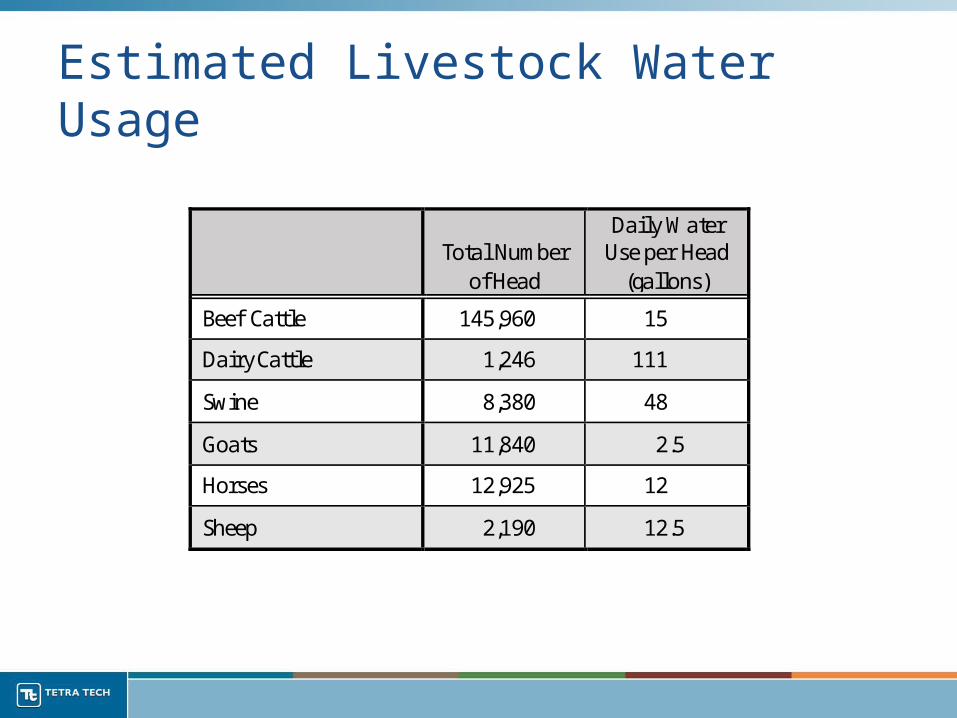
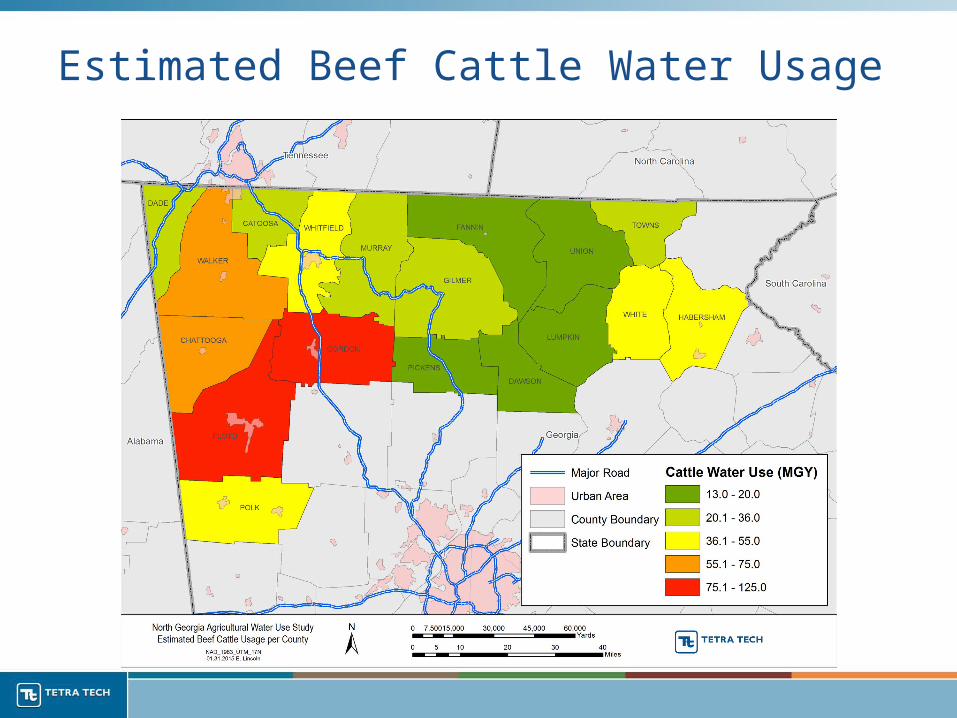
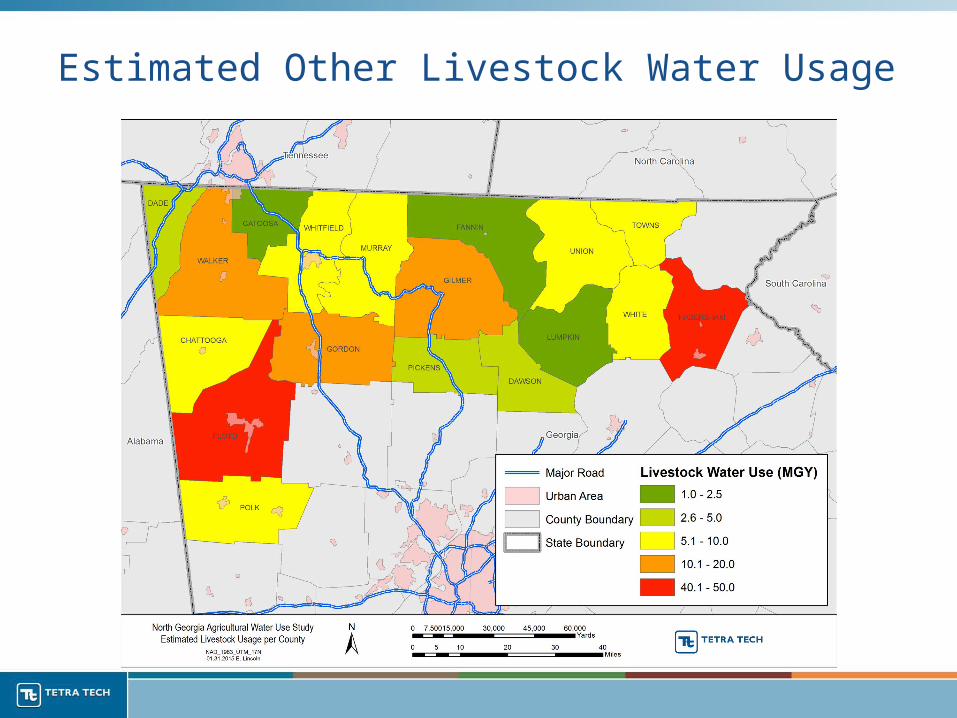
Estimated Livestock Water Usage
Total Number
of Head
Daily Water Use per Head
(gallons)
Beef Cattle 145,960 15
Dairy Cattle 1,246 111
Swine 8,380 48
Goats 11,840 2.5
Horses 12,925 12
Sheep 2,190 12.5
Estimated Poultry Water Usage
Estimated Beef Cattle Water Usage
Estimated Other Livestock Water Usage
Estimated Region-Wide Water Usage
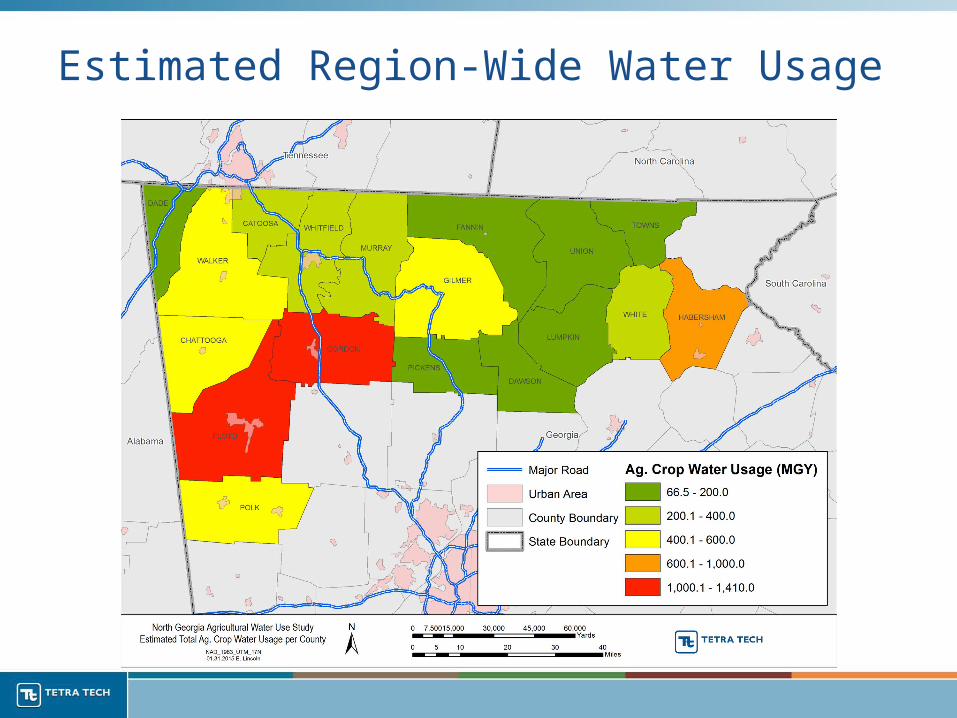
Estimated Region-Wide Water Usage
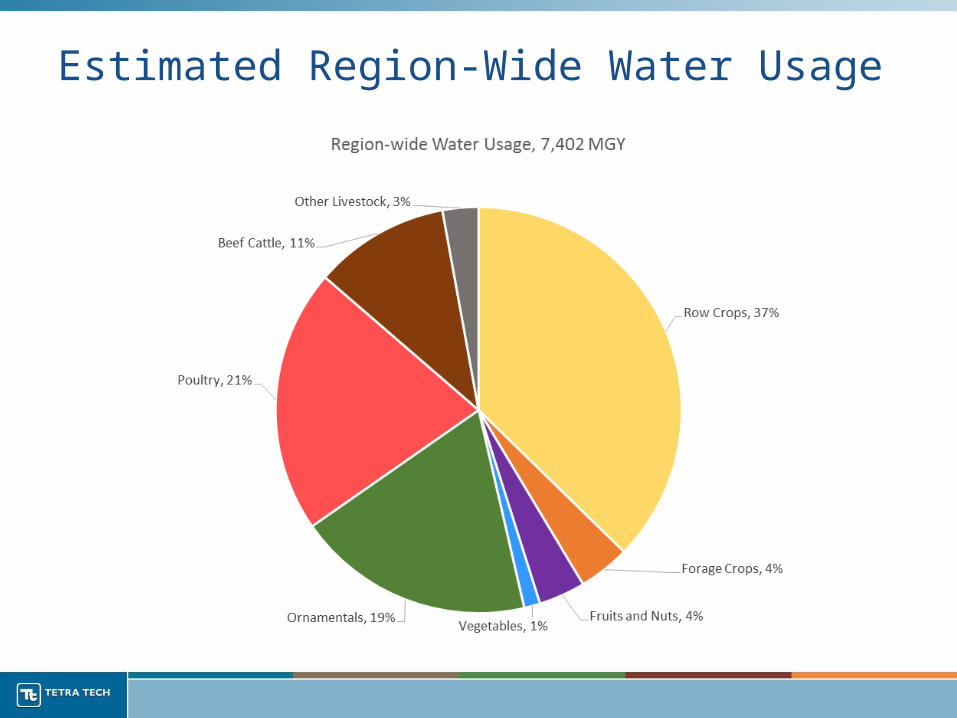
Estimated Region-Wide Water Usage
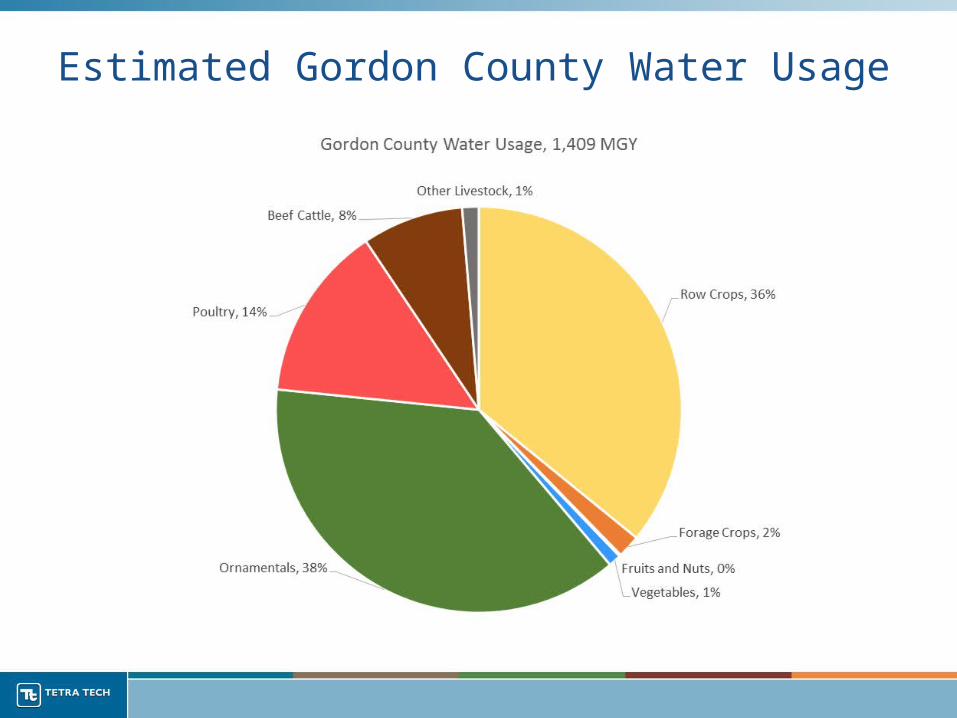
Estimated Gordon County Water Usage
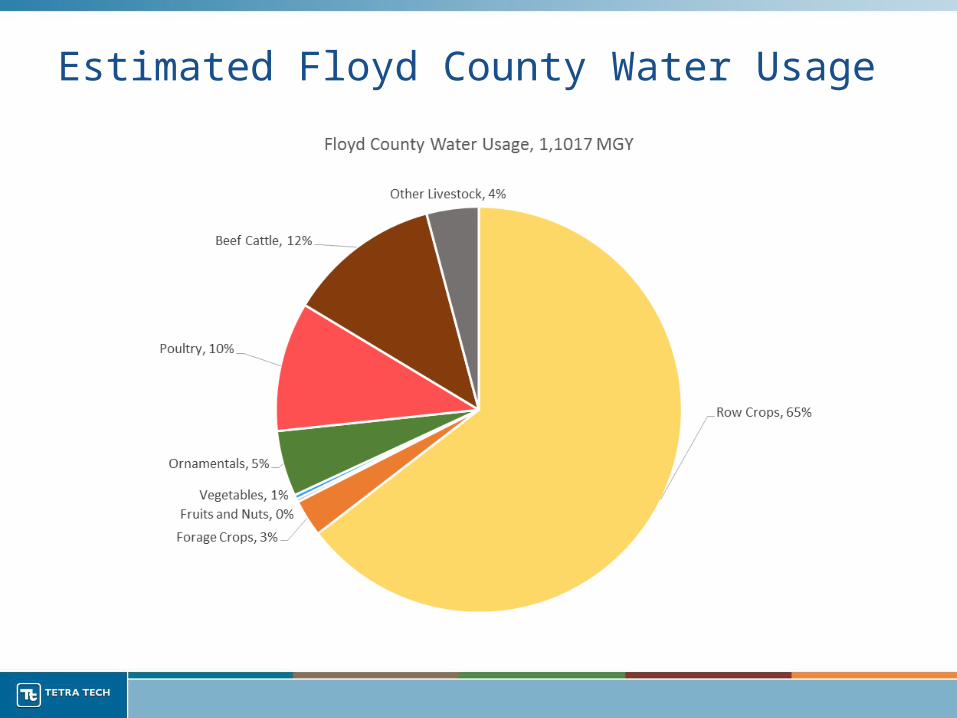
Estimated Floyd County Water Usage
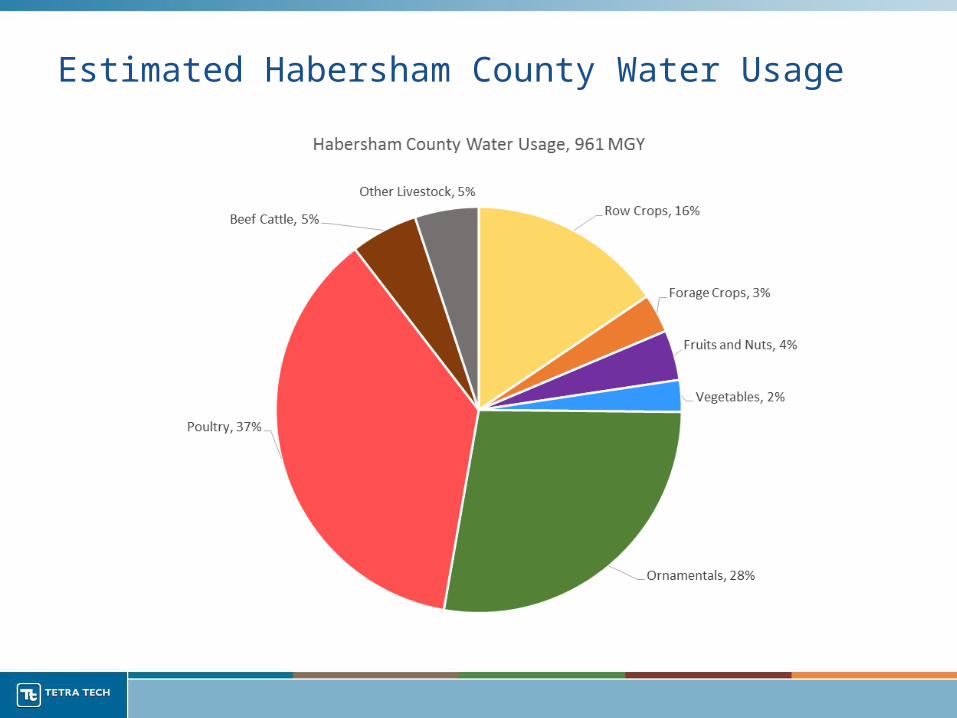
Estimated Habersham County Water Usage
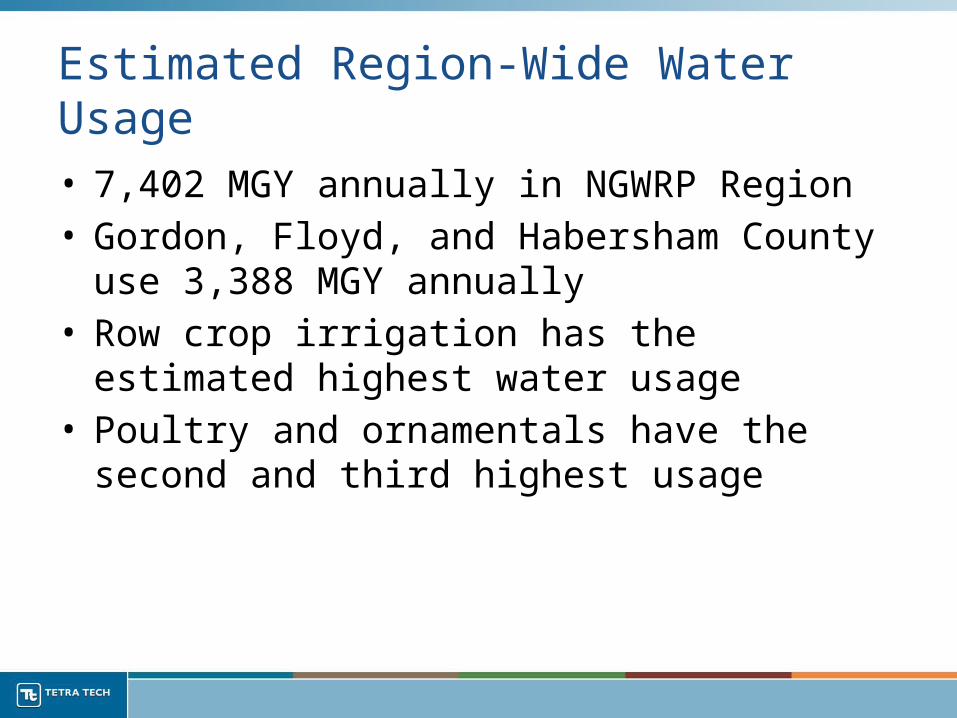
Estimated Region-Wide Water Usage• 7,402 MGY annually in NGWRP Region• Gordon, Floyd, and Habersham County use 3,388
MGY annually• Row crop irrigation has the estimated highest water
usage• Poultry and ornamentals have the second and third
highest usage
Next Steps
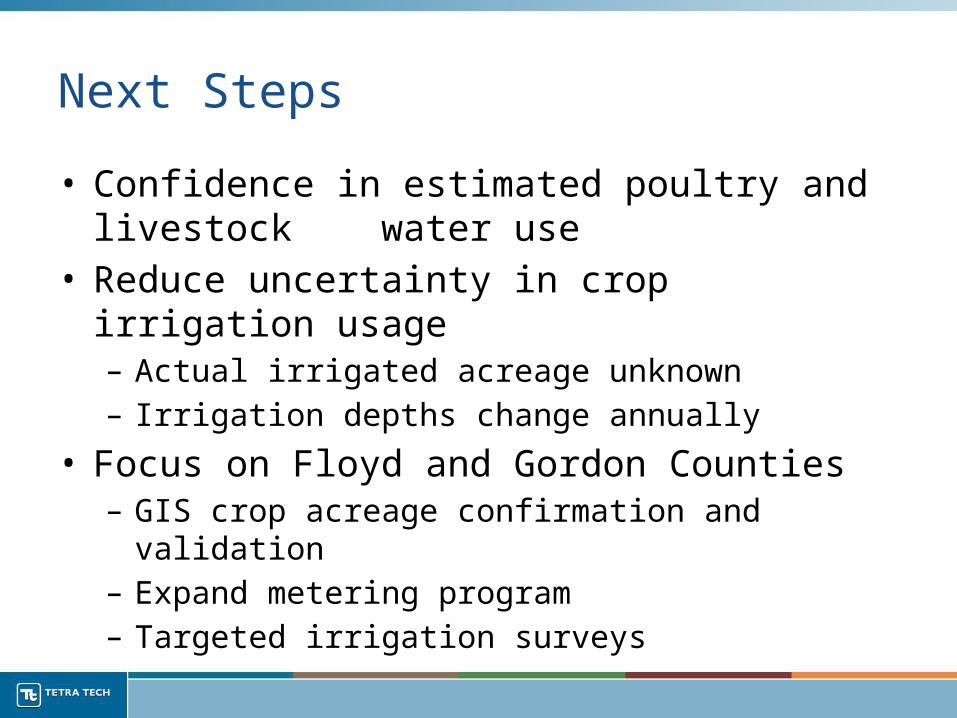
• Confidence in estimated poultry and livestock water use
• Reduce uncertainty in crop irrigation usage– Actual irrigated acreage unknown– Irrigation depths change annually
• Focus on Floyd and Gordon Counties– GIS crop acreage confirmation and validation– Expand metering program– Targeted irrigation surveys
QUESTIONS?
Erin Lincoln, PHTetra [email protected]
Special Thanks To: NGWRP NGRC GAEPD GA Poultry Federation UGA CAES GSWCC