water research & technology
TRANSCRIPT
rsc.li/es-water
EnvironmentalScience Water Research & Technology
rsc.li/es-water
ISSN 2053-1400
PAPERJeyong Yoon et al. Electrochemical lithium recovery and organic pollutant removal from industrial wastewater of a battery recycling plant
Volume 4Number 2February 2018Pages 101-338Environmental
Science Water Research & Technology
This is an Accepted Manuscript, which has been through the Royal Society of Chemistry peer review process and has been accepted for publication.
Accepted Manuscripts are published online shortly after acceptance, before technical editing, formatting and proof reading. Using this free service, authors can make their results available to the community, in citable form, before we publish the edited article. We will replace this Accepted Manuscript with the edited and formatted Advance Article as soon as it is available.
You can find more information about Accepted Manuscripts in the Information for Authors.
Please note that technical editing may introduce minor changes to the text and/or graphics, which may alter content. The journal’s standard Terms & Conditions and the Ethical guidelines still apply. In no event shall the Royal Society of Chemistry be held responsible for any errors or omissions in this Accepted Manuscript or any consequences arising from the use of any information it contains.
Accepted Manuscript
View Article OnlineView Journal
This article can be cited before page numbers have been issued, to do this please use: F. Visentin, S.
Bhartia, M. Mohseni, S. Dorner and B. Barbeau, Environ. Sci.: Water Res. Technol., 2019, DOI:
10.1039/C9EW00538B.
A growing problem affecting drinking water is cyanobacterial blooms events that produce toxins and taste and odor issues, disturbing drinkable water quality. Vacuum ultra violet light is a promising advanced oxidation process used to treat water impacted by cyanobacterial blooms, with potential applicability in small and remote communities because of its simplicity.
Page 1 of 13 Environmental Science: Water Research & Technology
Env
iron
men
talS
cien
ce:W
ater
Res
earc
h&
Tech
nolo
gyA
ccep
ted
Man
uscr
ipt
Publ
ishe
d on
09
Sept
embe
r 20
19. D
ownl
oade
d by
Eco
le P
olyt
echn
ique
de
Mon
trea
l on
9/20
/201
9 1:
26:3
8 PM
.
View Article OnlineDOI: 10.1039/C9EW00538B

Please do not adjust margins
Please do not adjust margins
Received 00th January 20xx,Accepted 00th January 20xx
DOI: 10.1039/x0xx00000x
Performance of Vacuum UV (VUV) for the degradation of MC-LR, geosmin, and MIB from cyanobacteria-impacted waters Flavia Visentin*a, Siddharth Bhartiab, Madjid Mohsenib, Sarah Dornera and Benoit Barbeaua
The increasing frequency with which cyanobacterial blooms are affecting sources of drinking water is a growing concern worldwide. Such events are usually responsible for the presence of cyanotoxins as well as taste and odor (T&O) compounds. Vacuum UV (VUV) is a promising advanced oxidation process used to treat water impacted by cyanobacterial blooms, with potential applicability in small and remote communities because of its simplicity. Here, we present the performance of a VUV process, in both a collimated bean reactor (CBR) and a pilot scale flow-through reactor, using two cyanobacterial-laden Canadian source waters with different inorganic and natural organic matter contents. First, VUV performance was assessed by comparing the removal of microcystin-LR (MC-LR), 2-methylisoborneol (MIB), and geosmin (GSM). The average kinetic rates obtained in the CBR case were 2.9 × 10⁻³ cm2 mJ-1 for MIB and GSM and 6.6 × 10⁻³ cm2 mJ-1 for MC-LR. Under bloom conditions, removals of 40-60% for T&O compounds and MC-LR were achieved in the flow-through reactor. It was observed that although MC-LR, GSM, and MIB were impacted by VUV treatment, the removals achieved may not be sufficient to completely eliminate toxicity and T&O at the tested fluences (up to 400 mJ cm-2). In addition, we observed a 20% increase in disinfection by-products (DBPs), on an average. Hence, achieving high MC-LR, MIB, and GSM removals with VUV may cause the generation of more DBPs.
a. Polytechnique Montreal, NSERC- Industrial Chair in Drinking Water Treatment, Department of Civil, Geological and Mining Engineering, P.O. Box 6079, Downtown Station, Montreal, Quebec, Canada, H3C 3A7
b.Department of Chemical and Biological Engineering, University of British Columbia, Vancouver, British Columbia, Canada
Page 2 of 13Environmental Science: Water Research & Technology
Env
iron
men
talS
cien
ce:W
ater
Res
earc
h&
Tech
nolo
gyA
ccep
ted
Man
uscr
ipt
Publ
ishe
d on
09
Sept
embe
r 20
19. D
ownl
oade
d by
Eco
le P
olyt
echn
ique
de
Mon
trea
l on
9/20
/201
9 1:
26:3
8 PM
.
View Article OnlineDOI: 10.1039/C9EW00538B

Please do not adjust margins
Please do not adjust margins
IntroductionOver recent decades, the occurrence of cyanobacterial blooms has increased worldwide due to climate change, legacy nutrient loads, water resource management strategies, population growth, and changes in land usage affecting the quality of drinking water sources (1). Cyanobacterial blooms often lead to health concerns as a result of risks related to the presence of cyanotoxins. These cyanotoxins can roughly be classified as follows: i) hepatotoxins: microcystins, nodularis, and cylindrospermopsins; ii) neurotoxins: anatoxin-a, anatoxin-a(s), and saxitoxins; and iii) dermatotoxins: lyngbyatoxin-a and aplysiatoxins (2). Codd et al. (2005) proposed two additional categories: cytotoxins (inhibitor of protein synthesis, genotoxic, and can cause chromosome loss and DNA strand breakage) and irritants and gastrointestinal toxins (3). As reported by Kardinaal and Visser (2005), more than 70 different structural variants of microcystins have been identified to date (2). Among them, microcystin-LR (MC-LR) is the most widespread and one of the most toxic, with a lethal dose (LC50) estimated to be 50 µg MC-LR per kilogram bodyweight. Between 2001 and 2004, a study conducted by Wood et al. in New Zealand verified that microcystin is the most frequently detected cyanotoxin in that country (4). Possible human health issues linked to MC-LR include liver damage, increased risk of cancer, and potential damage to the nervous system (5). According to the World Health Organization (WHO) there are insufficient data to derive a guideline value for cyanobacterial toxins other than MC-LR. For this reason, the WHO and several countries have established guidelines and standards for maximum MC-LR levels in drinking water, ranging from 1.0 to 1.5 µg L-1, depending on the jurisdiction (6-8). In 2015, the U.S. Environmental Protection Agency health advisory recommend 0.3 µg L-1 for bottle-fed infants and young children of preschool age and 1.6 µg L-1 for school-age children through adults. The health advisory applies to total microcystins using microcystin-LR as a surrogate (9, 10). Because other microcystins could be also present in drinking water, a Canadian guideline for a maximum total microcystins level of 1.5 µg L-1 has been proposed to protect human health (7).
Blooms events are also responsible for adverse taste and odor compounds (T&O), with the most common metabolites being 2-methylisoborneol (MIB) and geosmin (GSM). Although these compounds do not pose any risk to human health, their presence is noticeable by humans in very low concentrations
(on the order of 5 to 10 ng L-1), and its removal implies challenge (11). Consequently, effective water processes to reduce T&O along with cyanotoxins are also sought by water regulation institutions.
Under appropriate coagulation conditions, conventional water treatment (coagulation/settling/filtration) can be effective for removing cells without provoking lysis but offers limited control of extracellular cyanotoxin and T&O (12, 13). Pre-oxidation processes, using strong oxidants such as ozone (O3) or permanganate, can effectively remove these contaminants (14-16). Moreover, Zamyadi et al. suggested that pre-oxidation should be considered to minimize the accumulation of potentially toxic cyanobacteria within a drinking water treatment plant that uses raw water from a source predisposed to cyanobacterial blooms. These plants are vulnerable to the accumulation and breakthrough of cells and toxins. Thus, in these cases, early destruction of cells during treatment could be the best option. Nevertheless, the impact of pre-oxidation, such as DBP’s formation, must be considered (17).
Alternative advanced oxidation processes (AOPs), such as O3 + hydrogen peroxide (H2O2), ultraviolet light (UV) + O3, UV + H2O2, and UV + TiO2, have also been proposed to control T&O and cyanotoxins (18-20). Pre-oxidation and AOP both add complexity to the treatment train. Oxidation-based processes are expected to lead to the release of intracellular cyanotoxins (21, 22). Thus, their proper control is of paramount importance to achieve the oxidation reaction, a challenging goal for small communities with limited technical resources. In view of this, robust oxidation technologies with minimal operational and chemical use requirements would be beneficial, especially for small water systems.
Recently, vacuum UV (VUV) has been suggested as a potentially simple AOP to control organic micropollutants in drinking water treatment (23-27). VUV relies on the use of a standard UVC lamp with a high purity quartz envelope and sleeve that enables a portion of short wavelength (< 200 nm) photons to irradiate the water. These high energy photons react with water molecules to produce •OH from the water itself without the need to add other chemicals, such as H2O2 or O3 (28). This characteristic simplifies the operation of the system, and this process is deemed effective against pathogens (with UVC) (29) and micropollutants (27).
Page 3 of 13 Environmental Science: Water Research & Technology
Env
iron
men
talS
cien
ce:W
ater
Res
earc
h&
Tech
nolo
gyA
ccep
ted
Man
uscr
ipt
Publ
ishe
d on
09
Sept
embe
r 20
19. D
ownl
oade
d by
Eco
le P
olyt
echn
ique
de
Mon
trea
l on
9/20
/201
9 1:
26:3
8 PM
.
View Article OnlineDOI: 10.1039/C9EW00538B
Please do not adjust margins
The ability of VUV to destroy MC-LR from an artificial M. aeruginosa bloom, under various water conditions, was tested by Liu et al. (30). They reported a positive impact on MC-LR removal under pH < 7 and aeration conditions, such that the maximal removal achieved was 44% after 20 min of exposure for a low initial MC-LR concentration (C0= 1.24 µg L-1). A lower removal was reported for a higher initial concentration (C0= 18.8 µg L-1). The final concentration was lower than that recommended by WHO (1.00 µg L-1 of MC-LR) when C0= 1.24 µg L-1. Unfortunately, no information about the fluence responsible for the degradation was reported.
Kutschera et al. (31) studied MIB and GSM degradation under 254 nm and 185 nm radiation in ultrapure and natural waters. The authors confirmed that these two T&O compounds were not photolyzed at 254 nm, suggesting that the formation of •OH radicals from the 185 nm radiation was the main mechanism responsible for T&O degradation. The degradation followed pseudo first-order kinetics with rate constants of 1.2 x 10⁻² cm2 mJ-1 for both GSM and 2-MIB in ultrapure water. A fluence of 200 mJ cm-2 induced 90% removal in ultrapure water, while complete degradation was achieved by a fluence of 400 mJ cm-2. In natural water (DOC = 3.0 ± 0.3 mg L-1, HCO3
-= 0.3 mmol L-1, specific UV absorbance at 254 nm = 2.3 ± 0.2 L mg-1 m-1), the authors reported a decrease in the rate constants, 2.7 x 10⁻³ cm2 mJ-1 for GSM and 2.5 x 10⁻³ cm2 mJ-1 for 2-MIB, attributed to the presence of scavenged natural organic matter (31).
Previous studies have all been conducted under controlled conditions, such as artificial M. aeruginosa blooms or in the absence of cyanobacterial cells. In addition, most previous studies used batch VUV set-ups that do not represent actual flow-through UV reactors, which are affected by hydrodynamics. In this study, we focused on testing the efficacy of VUV to remove MC-LR and T&O compounds using natural cyanobacterial blooms in a flow-through UV reactor. As the presence of minerals is expected to impact VUV reactions, water from two lakes with very different quality characteristics were selected. In parallel, the performances of the flow-through reactor were compared to a lab-scale collimated beam reactor for which the fluence was characterized by actinometry (32).
Materials and methodsSource Water Location
Source water samples from two Canadian cyanobacterial-impacted lakes, identified as Lakes A and B (Error! Reference source not found.) were collected to conduct this work. Lake A is located 40 km west of Montreal (Quebec, Canada) and constitutes a system of two lakes that supplies a bank filtration water system. Lake B, located 160 km east of Montreal (Quebec, Canada), is a recreational water body currently under consideration to become a source of
drinking water for the area. Samples were collected from Lake A and Lake B on August 25, 2017 and September 7, 2017, respectively.
Source Water Characterization
Source waters were analyzed for total organic carbon (TOC), dissolved organic carbon (DOC), and biodegradable dissolved carbon (BDOC) concentrations using a TOC analyzer (5310C Sievers Instruments Inc., USA). BDOC analysis was performed using the 30-d incubation batch method of Servais et al. (33). The pH was measured using a Fisher Scientific pH-meter (Accumet, Fisher Scientific Instruments, USA), pre-calibrated with pH 4, 7, and 10 standard buffers (BDH VWR Analytical). Turbidity measurements (Hach 2100N turbidimeter) were assessed following Standard Methods #2130B (34). Ions were measured by ionic chromatography ICS 5000 AS-DP DIONEX (Thermo Scientific) with an As18-4µm column. Alkalinity was measured by titration according to Standard Methods #2320 (34).
A YSI 6600 V2-4 water-quality multi-probe (YSI, Yellow Springs, Ohio, USA) equipped with a self-cleaning wiper was used to determine the presence of cyanobacteria (i.e., the phycocyanin measured was higher than 2.4 relative fluorescence units (RFU)) (35). Lugol’s iodine preserved the water samples for further taxonomic identification and cell counting.
Targeted Cyanobacterial Metabolites Detection
Our initial intent was to collect waters during bloom events with the hope that cyanobacterial metabolites (GSM, MIB, and cyanotoxin) would be simultaneously present in sufficiently high concentrations to avoid spiking. However, due to their low abundance, we had to resort to spiking the three target compounds in the waters collected from both lakes. The source waters were always spiked with 100 ng L-1 of MIB and GSM and 10 µg L-1 of MC-LR.
Because microcystin is the most common cyanotoxin and MC-LR the most frequent and one of the most toxic (2, 4), we decided to spike our samples with MC-LR (C0= 10 µg L-1 ). Also, most studies of cyanotoxin oxidation by AOP are performed using MC-LR (19, 36, 37). For this purpose, dry MC-LR was purchased from Alexis Chemical (Cedarlane, Canada). MC-LR was measured by an on-line solid phase extraction coupled with ultra-high performance liquid chromatography, heated electrospray ionization, and high-resolution mass spectrometry detection, Q-Exactive (Thermo Fisher Scientific, Waltham, MA) (UHPLC-HESI-HRMS), as described in Fayad et al. (38). The limit of detection (LOD) of the method was 10 ng L-1, and the limit of quantification (LOQ) was 33 ng L-1.
GSM (purity ≥ 97%), MIB (purity ≥ 98%) and cis-decahydro-1-naphthol, used as an internal standard (IS, purity ≥ 99%), were purchased from Sigma-Aldrich (St. Louis, MO). Individual stock
Page 4 of 13Environmental Science: Water Research & Technology
Env
iron
men
talS
cien
ce:W
ater
Res
earc
h&
Tech
nolo
gyA
ccep
ted
Man
uscr
ipt
Publ
ishe
d on
09
Sept
embe
r 20
19. D
ownl
oade
d by
Eco
le P
olyt
echn
ique
de
Mon
trea
l on
9/20
/201
9 1:
26:3
8 PM
.
View Article OnlineDOI: 10.1039/C9EW00538B

ARTICLE Journal Name
Please do not adjust margins
Please do not adjust margins
solutions were prepared daily in ultrapure water (Milli-QTM) at a concentration of 10 mg L-1 in HPLC grade methanol (MeOH) from Fisher Scientific (Whitby, ON, Canada). The contribution to carbon concentration in the water by MeOH was 4.12 × 10⁻⁷ mg C L-1. This represented a negligible amount of carbon introduced to the samples (0.001% of the lower C concentration measured in our samples). For the MIB and GSM analysis, a GC 3800 coupled to a MS 4000 from Varian (Palo Alto, CA) equipped with a PAL auto sampler (Zwingen, Switzerland) and a Gerstel Twister system (Baltimore, MD) was used. The LOD and LOQ for MIB and GSM were respectively determined as 8/27 ng L-1 and 8.5/29 ng L-1 (C0=100 ng L-1).
Disinfection by-products
Samples were chlorinated under uniform formation conditions (UFC) (1 ppm ± 0.5 Cl2 at pH=8.0 after 24 h incubation at 20°C), and disinfection by-product formation was analyzed in terms of trihalomethanes (THMs) and haloacetic acids (HAAs). We measured four THMs (bromoform, chloroform, bromodichloromethane, and dibromochloromethane) as well as total THM (TTHM) and six haloacetic acids (HAAs) (bromoacetic acid, bromochloroacetic acid, chloroacetic acid, dibromoacetic acid, dichloroacetic acid, and trichloroacetic acid). THMs were measured according to USEPA Method 524-2 (purge and trap [Aquatek 100 - Stratum 9800 de Teledyne Tekmar] coupled with GC-MicroECD [7890B de Agilent]). HAA compounds were extracted by liquid/liquid extraction with methyl tertbutyl ether (MtBE) followed by derivatization with acidic methanol in accordance with USEPA Method 552.2 (GC-MicroECD [7890B de Agilent]).
Vacuum UV Experiments
For each sampling campaign, experiments were first conducted in duplicate using a lab-scale collimated beam UV/VUV reactor (referred hereafter as CBR). In parallel, experiments were also conducted in duplicate on a flow-through UV/VUV reactor (referred hereafter as FTR). The stirred CBR setup allows observation of the precise kinetics of VUV induced reactions. Pollutant concentrations and the local incident radiation are uniform inside the CBR, allowing proper interpretation of the kinetics of reactions (39). The CBR is equipped with an ozone-generating amalgam Hg lamp (Light Sources GPHVA357T5VH/4W) placed in a T-shape polyvinyl chloride (PVC) enclosure that is continuously purged with nitrogen to remove oxygen present in air (Figure A (SI)). To irradiate water samples, a special cylindrical reaction vessels made with regular quartz (except the bottom part made of Suprasil quartz to allow 185 and 254 nm radiation to be transmitted) was used. The diameter and height are 4.8 (path length = 4.67 cm) and 1.5 cm, respectively.
The FTR experiments were conducted using a lab-scale annular photoreactor, 30 cm in length, in a configuration similar to what could be installed for application in a small water system (Figure B (SI)Error! Reference source not found.). The FTR was equipped with
an ozone generating low-pressure mercury lamp (Light Sources GPHVA357T5VH/4W) with a dome-ended high purity quartz sleeve housed in a cylindrical Plexiglass® chamber. Fluence inside the FTR was controlled by adjusting the influent flow, which feeds a 5-mm thick water layer located between the inner core and the outer sleeve (40). The flow was varied from 1.0 to 5.3 LPM (liter per minute), providing a theoretical contact time of 9.4 to 1.8 s, respectively. Under the tested conditions, laminar flow was obtained such that Reynolds numbers in the water layer varied from 320 to 1700.
Kinetic Analysis
VUV treatment involves a potential direct photolysis pathway (for MC-LR) and an indirect pathway (for MC-LR, GSM & MIB) due to the
formation of free radicals according to Equation 1 and Equation 2.
𝐻2𝑂 + ℎ𝑣185𝑛𝑚 → ∙ 𝑂𝐻 +∙ 𝐻; Ф = 0.3 Equation 1
𝐻2𝑂 + ℎ𝑣185𝑛𝑚 → ∙ 𝑂𝐻 + 𝐻 + + 𝑒 ― ; Equation 2
where •OH radicals are highly reactive and non-selective oxidants. Due to the high reactivity of •OH, the generation rate is equal to the consumption rate such that a steady state is reached in a short period of time in comparison with the exposure time (41). It has been shown that the fluence at 185 nm is approximately equivalent to 5-16% of the fluence at 254 nm (41, 42). Therefore, the fluence at 254 nm can be used as an indirect metric of the formation of •OH radicals (43). Assuming that the degradation in the VUV system is solely the result of direct photolysis at 254 nm and indirect hydroxyl radical pathways originating from the fluence at 185 nm, the degradation kinetics can be described by Equation 3 (31):
―𝑑𝐶𝑑𝐻 = (𝑘𝑑,𝐶 + 𝑘 ∙ 𝑂𝐻,𝐶 ∗ [ ∙ 𝑂𝐻]) ∗ [𝐶] Equation 3
where C is the contaminant concentration (MIB, GSM or MC-LR), H is the fluence at 254 nm (mJ cm-2), [•OH] is the hydroxyl radical concentration, kd,C is the first-order direct photolysis rate constant at 254 nm, and k•OH,C is the rate constant for an •OH based reaction.
Since MIB and GSM do not photolyze (31), kd,C can be neglected. Also, the •OH steady state is rapidly reached, so the •OH concentration can be considered constant. The contaminant degradation can then be expressed as follows (31):
―𝑑[𝐶]𝑑𝐻 = 𝑘′ ∗ [𝐶] Equation 4
where in cm2 mJ-1 is the pseudo-first order 𝑘′ = 𝑘 ∙ 𝑂𝐻,𝐶 ∗ [ ∙ 𝑂𝐻]rate constant.
In contrast, MC-LR does photolyze, and kd,C ((3.65 ∗ 10 ―3 ± 0.21) (36)) cannot be neglected (36, 44). In this case, (𝑐𝑚2𝑚𝐽 ―1)
Equation 3 also describes the degradation of MC-LR, where a
Page 5 of 13 Environmental Science: Water Research & Technology
Env
iron
men
talS
cien
ce:W
ater
Res
earc
h&
Tech
nolo
gyA
ccep
ted
Man
uscr
ipt
Publ
ishe
d on
09
Sept
embe
r 20
19. D
ownl
oade
d by
Eco
le P
olyt
echn
ique
de
Mon
trea
l on
9/20
/201
9 1:
26:3
8 PM
.
View Article OnlineDOI: 10.1039/C9EW00538B

Please do not adjust margins
modified becomes the pseudo-first 𝑘" = (𝑘𝑑,𝐶 + 𝑘 ∙ 𝑂𝐻,𝐶 ∗ [ ∙ 𝑂𝐻])order rate constant in cm2 mJ-1.
CBR experimental data were fitted to Equation 4 in order to determine a kinetic model for each contaminant. In the FTR, fluence cannot be directly computed. However, using an approach similar to biodosimetry (45-47), fluences were back-calculated using the kinetics derived in the CBR and the measured performances (C/Co) in the FTR.
Fluence Calculations
The fluence applied in the CBR is calculated based on the following
equation (29):
𝐻 = 𝐸 ∗ 𝑡 Equation 5
where H is the fluence in mJ cm-2, E is the irradiance in mW cm-2, and t is exposure time in s. Irradiance at 254 nm was measured through potassium iodide-potassium iodate (KI-KIO3) actinometry (32, 41, 48). To obtain the applied fluence in the reactor, the fluence in Equation 5 was multiplied by the correction factor, CF, as defined in (39, 48):
𝐻 = 𝐶𝐹 ∗ 𝐸𝑡 = (𝑊𝐹𝑈𝑉254 ∗ 𝑅𝐹 ∗ 𝑃𝐹 ∗ 𝐷𝐹) ∗ 𝐸𝑡 Equation 6
where is the water factor which is a function of UVA254, RF 𝑊𝐹𝑈𝑉254
is the reflection factor (which considers the light reflected at the air-water interface), PF is the petri factor (accounting for non-uniformity of irradiance), and DF is the divergence factor of the
beam. The values adopted were: RF = 0.98, PF = 0.95 and DF = 0.73 (39). is source-water specific. Knowing the irradiance 𝑊𝐹𝑈𝑉254
and the correction factors, the time for irradiation was adjusted to provide the targeted fluences, which ranged from 0 to 400 mJ cm-2
at 254 nm.
Statistical analysis
Kinetic constants were obtained by performing regression analysis (the regression was forced through, x=0 at y = C0). Main Effects ANOVA was conducted to discriminate the roles of source water quality (Lake A vs Lake B), reactor type (FTR vs CBR), and contaminant type (MIB, GSM, or MC-LR) with respect to kinetic constants. Statistical analyses were realized using the Statistica 13 software (TIBCO, CA, USA), with the level of significance set at α= 0.05. A few obvious outliers were removed from the dataset prior to the statistical analysis.
Results and discussionSource Water Characteristics
Table 1 summarizes the water quality parameters measured during the sampling campaigns of Lakes A and B. Lake A source water had a high alkalinity and moderate DOC. Despite the
absence of a cyanobacterial bloom at the time of sampling from Lake A, this source water was selected due to the high concentration of alkalinity (an •OH scavenger) and chloride (a
Table 1. Characteristics of the waters sampled from Lakes A and B
TOC, mg C L-1
DOC, mg C L-1
BDOC, mg C L-1 pH Turbidity,
NTU
UV absorbance
(UVA254), cm-1
Nitrate+ Nitrite, mg N L-1
Sulfate, mg SO4
-2 L-1Alkalinity,
mg CaCO3 L-1Chloride, mg Cl- L-1
Lake A 4.5 4.5 0.6 8.4 0.9 0.085 - 40 170 94
Lake B 14.7 12.2 2.4 7.7 15.7 0.296 0.078 - 14 12
strong absorber of 185 nm photons). For example, when the Cl- concentration is higher than 20 mg L-1, it becomes the major absorber of 185 nm photons (49), resulting in the formation of chlorine radicals (Cl•). When this radical is present, both Cl• and •OH can degrade contaminants (49).
The source water from Lake B was sampled during an important cyanobacterial bloom, which is reflected by the high levels of DOC and the presence of particulate organic carbon from the 220,000 cells mL-1 (88% of cells were Cyanophyceae class and 83% of the cyanobacterial cells corresponded to Planktothrix agardhii). However, this source water exhibited low mineralization, with an alkalinity of 14 mg L-1 and a chloride ion concentration of 12 mg L-1.
Measurements of Irradiance and Fluence Correction Factors
The irradiance value obtained for the collimated beam reactor (CBR) by KI-KIO3 actinometry was 1.24 ±0.04 mW cm-2 at 254 nm. The UVA254 values for Lake A and B waters were 0.085 cm-1 and 0.296 cm-1, respectively, which translate into water factors of WFA = 0.65 and WFB = 0.30. The overall fluence correction factors (including reflection, Petri, and divergence factors) came to CFA = 0.44 and CFB = 0.20. Table 2 summarizes the uncorrected and corrected fluences tested in the CBR for both Lakes.
Page 6 of 13Environmental Science: Water Research & Technology
Env
iron
men
talS
cien
ce:W
ater
Res
earc
h&
Tech
nolo
gyA
ccep
ted
Man
uscr
ipt
Publ
ishe
d on
09
Sept
embe
r 20
19. D
ownl
oade
d by
Eco
le P
olyt
echn
ique
de
Mon
trea
l on
9/20
/201
9 1:
26:3
8 PM
.
View Article OnlineDOI: 10.1039/C9EW00538B

Please do not adjust margins
Please do not adjust margins
Table 2. Uncorrected and corrected fluences for Lakes A and B using the CBR
Huncorrected, mJ cm-2 100 200 400 600 800
Time, min, sec 1’ 20” 2’ 39” 5’ 18” 7’ 57” 10’ 36”
Lake A 44 88 176 264 352Hcorrected, mJ cm-2
Labe B 20 40 80 120 160
Kinetic reactions in the Collimated Beam Reactor
Figure 1 (Lake A) and Figure 2 (Lake B) present the degradation kinetics of MC-LR, MIB, and GSM in the CBR. As expected, the removal of MC-LR was higher than the removal of MIB and GSM in both source waters as a result of direct photolysis. During these tests, the removals of T&O metabolites reached a maximum of 50%, while an MC-LR removal of almost 80% was observed at the highest fluence. Kutschera et al. [24] analyzed the effectiveness of 254 nm and 185 nm radiation on ultra-pure and natural water (DOC = 3.0 ±0.3 mg L-1) spiked with MIB and GSM (C0= 100 ng L-1). They verified that 254 nm was ineffective for removing MIB and GSM. However, when the samples were irradiated with 254 nm and 185 nm simultaneously, around 80% removal rates for MIB and GSM were observed at a fluence of 200 mJ cm-2 (31). In our experiments, 50% removal was obtained with a fluence of 160 mJ cm-2 (Lake B).
The apparent rate constants k’ or k’’ for the waters of both lakes are summarized in Table 3 and compared to those reported by Kutschera et al. (31). For Lake B, k’ values for MIB and GSM were greater than those from Lake A (1.4 and 2.5 times greater, respectively), suggesting that higher degradation was achieved in the water where a bloom/high DOC/low mineral content was present (Lake B). The presence of alkalinity and chloride (Lake A) affect VUV performance, as reported by Furatian (41). However, the k’ values obtained in our experiments were similar to the k values reported by Kutschera et al. (31) (except for the k’ for GSM in Lake A where our value is 1.7 times lower). According to an ANOVA, the rate constants for T&O metabolites were marginally, yet statistically significantly, lower (p= 0.057) in Lake A (with high minerals) compared to those in Lake B (with high DOC). GSM rate constants were also lower than those of MIB in Lake A (p <0.05).
Regarding MC-LR, kinetic values exhibited a similar trend to MIB and GSM: they were higher in Lake B than Lake A. The k” value from Lake B was three times higher than the k” value from Lake A when photolysis was considered. Once again, it is apparent that inorganic components interfere with VUV performance more than the cyanobacterial bloom (high organic carbon concentration).
Table 3. Kinetic rates (k’ and k”) for MIB and GSM (cm2 mJ-1 × 10⁻³). In parenthesis, the R-square fitting result is reported for each case.
k’ or k” (cm2 mJ-1) × 10-3
MIB GSM MC-LR
Lake A 2.5 ± 0.3(R2=0.79)
1.6 ± 0.0(R2=0.56)
3.9 ± 0.9(R2=0.65)
Lake B 3.4 ±0.1(R2=0.85)
4.0(R2=0.85)
9.2 ± 0.0(R2=0.82)
Kutschera et al. (2009) 2.5 2.7 -
As expected, the removal of MC-LR was more effective than that of MIB and GSM due to the added effect of direct photolysis. Approximately 80% removals of MC-LR were achieved for the highest tested fluences. The apparent rate constants were two times greater than those of the two T&O metabolites (Table 3) for Lake B. It was also observed that the apparent rate of MC-LR removal was higher in Lake B than in Lake A (p<0.01), a similar conclusion to the source-water matrix effect observed for GSM and MIB. Assuming that the rate of MC-LR direct photolysis is 3.65 × 10⁻³ (cm2 mJ-1) (36), the rates provided by the action of free radicals represented 40% of the overall removal of MC-LR (for Lake B). Consequently, it is important to account for the role of direct photolysis in the prediction of MC-LR removals.
Page 7 of 13 Environmental Science: Water Research & Technology
Env
iron
men
talS
cien
ce:W
ater
Res
earc
h&
Tech
nolo
gyA
ccep
ted
Man
uscr
ipt
Publ
ishe
d on
09
Sept
embe
r 20
19. D
ownl
oade
d by
Eco
le P
olyt
echn
ique
de
Mon
trea
l on
9/20
/201
9 1:
26:3
8 PM
.
View Article OnlineDOI: 10.1039/C9EW00538B

Please do not adjust margins
Raw water impacted by a natural cyanobacterial bloom with a cell concentration of 220,000 cell mL-1 was spiked with MC-LR (Lake B). After irradiation, a maximum 80% MC-LR removal was achieved (Figure 2). We estimated a k” value of 9.2 × 10⁻³ ± 0.0 cm2 mJ-1
(Table 3). For Lake A, without a cyanobacterial bloom and the same exposure time, 80% removal was also obtained with a k” value of 3.9 × 10⁻³ ± 0.9 cm2 mJ-1. It should be noted that although the exposure time was the same, the applied fluences were different because they depended on the UVA254. The same removal (80%) was achieved for both water matrices but with different fluences: 264 mJ cm-2 and 160 mJ cm-2 for Lakes A and B, respectively. Once again, we can infer that higher concentrations of major solutes, such as chloride and alkalinity, result in the need for higher fluences to obtain desirable MC-LR removal.
Liu et al. [23] also studied the degradation of microcystins in natural waters using 185 nm UV irradiation of an artificial bloom of M. aeruginosa (cultured for 3 weeks, cell concentration of 106 cell L-1).
They observed a maximum removal of 44% (C0 = 1.24 µg L-1). At a higher initial concentration (C0 = 18.8 µg L-1), higher exposure times were required and lower removals were obtained (around 30%). From a graph presented in their article where the degradation of MC-LR for different pH values was plotted, it is possible to estimate rate constants ranging from 0.005 to 0.01 min-1 (for pH values from 12 to 7) when C0 = 1.55 µg L-1 (30). There was no mention of whether the authors applied correction factors in their analysis.
Figure 1. Lake A micropollutants degradation in the CBR (Error bars denote standard deviation). Experiments conducted in duplicate using a lab-scale CBR
UV/VUV reactor
Figure 2. Lake B micropollutants degradation in the CBR (Error bars denote standard deviation). Experiments conducted in duplicate using a lab-scale CBR
UV/VUV reactor
The water matrix, i.e. major solutes (Cl- and HCO3-) and DOC, is
expected to interfere with contaminant removal. In particular, Cl- plays a significant role, and its concentration is more important in VUV compared to other AOPs, such as UV-H2O2 and O3-H2O2 (41, 49) since Cl- strongly absorbs UV at 185 nm. Furatian et al. investigated the influence of Cl- in VUV water treatment using carbamazepine as a probe and two sources of carbon (t-butanol, an effective •OH radical scavenger and NOM) (40, 50). They found that the carbamazepine degradation rate increased with the addition of Cl- when t-butanol was present to scavenge •OH radicals. However, the opposite trend was observed when t-butanol was replaced by NOM as a source of carbon. The authors concluded that Cl- has a negative influence on contaminant removal rates. When the Cl- concentration is higher than 20 mg Cl- L-1 it becomes the major 185 nm absorber (49). In our case, Lake A has a Cl- concentration of 94 mg Cl- L-1 (Error! Reference source not
found.), yielding a Cl- absorbance at 185 nm of 9.37 cm-1 (assuming a molar absorption coefficient of ε185nm = 3540 M-1 cm-1 (49)), while ε185nm = 1.8 cm-1 for water (51). The fraction fs_i of absorbed photons for each absorbing solute is given by fSi = αSi/αTotal, where αSi is the absorption coefficient for solute Si, and αTotal is the absorption coefficient for the overall solution. Considering only the main 185 nm absorbances (water, Cl-, HCO3
- (ε185nm= 290 M-1 cm-1 (41)) and NOM (ε185nm, referred as Specific UV Absorbance), we calculated that Cl- absorbs 75% of the 185 nm photons for Lake A, whereas H20 absorbs 15%, and the remaining 10% is absorbed by HCO3
- and NOM. By contrast, in Lake B (where Cl- < 20 mg Cl- L-1), water is the dominant 185 nm absorber, since 50% of the 185 nm photons are absorbed by water and 35% by Cl-. Once more, HCO3
- and NOM absorption was <10%. The reduced performance in Lake A is related to the presence of a high Cl- concentration. As Furatian et al. concluded, the impact of Cl-
Page 8 of 13Environmental Science: Water Research & Technology
Env
iron
men
talS
cien
ce:W
ater
Res
earc
h&
Tech
nolo
gyA
ccep
ted
Man
uscr
ipt
Publ
ishe
d on
09
Sept
embe
r 20
19. D
ownl
oade
d by
Eco
le P
olyt
echn
ique
de
Mon
trea
l on
9/20
/201
9 1:
26:3
8 PM
.
View Article OnlineDOI: 10.1039/C9EW00538B

ARTICLE Journal Name
Please do not adjust margins
Please do not adjust margins
on VUV efficiency is specific to each water source. With a high Cl- concentration, the success of VUV treatment relies on Cl- reactivity with NOM and target contaminants (40, 50). Therefore, the negative impact of Cl-on the removal of MIB, GSM, and MC-LR observed in this study is consistent with the conclusions of Furatian et al. (40, 50). When Cl- absorbs photons at 185 nm, it will generate chlorine radicals (Cl•) (Equation 7). The Cl• reacts with Cl- (Equation 8) and dichlorine radical anion (Cl2-•) are generated (52). Cl• and Cl2-• are expected to react with the background water matrix to produce •OH (Equation 9) (53). Details of all the reactions between the radicals are discussed by Gonzalez et al (2004) (28).
𝐶𝑙 ― + ℎ𝑣185𝑛𝑚 →𝐶𝑙 ∙ + 𝑒 ―𝑎𝑞; Ф = 0.4 Equatio
n 7
𝐶𝑙 ∙ + 𝐶𝑙 ― ⇄𝐶𝑙 ― ∙2 Equatio
n 8
𝐶𝑙 ∙ /𝐶𝑙 ― ∙2 + 𝐻2𝑂⇄𝐻 + + 𝐻𝑂𝐶𝑙 ∙ ― ⇄𝐶𝑙 ― +∙ 𝑂𝐻 + 𝐻 +Equatio
n 9An important difference between Lakes A and B can also be found in their respective alkalinities. Bicarbonate is responsible for radical scavenging as well as 185 nm photo-absorption (41). Bicarbonates may react with HO• according to:
∙ 𝑂𝐻 + 𝐻𝐶𝑂 ―3 →𝐶𝑂 ― ∙
3 + 𝐻2𝑂; Equation 10
The kinetic constant rate of the reaction range from 8.5 x 10⁶ M-1 s-1 (53) to 1.5 x 10⁷ M-1s-1 (54). Duca et al. reported that atrazine removal was reduced by one order of magnitude in the presence of 50 mg CaCO3 L-1 of bicarbonate (55). The high alkalinity of Lake A waters (170 mg CaCO3 L-1) compared to Lake B (14 mg CaCO3 L-1) is therefore suggested as the main reason for the lower VUV performance in Lake A. If kapp is calculated for each lake (as the product of k times the inorganic compounds concentration, in this case HCO3
-) we obtained a kapp for Lake A (3.4 x 10⁴ s-1) 12 times higher than kapp Lake B (2.8 x 10³ s-1). Suggesting that the high bicarbonate concentration in Lake A reduce VUV performance.
DOC also acts as a radical scavenger and 185 nm photo-absorber (41, 56). DOC in Lake B was almost three times higher than DOC in Lake A (Error! Reference source not found.). Regarding the kinetic constant of the reaction between NOM and •OH (based on moles of organic carbon) is in the range of 1.6 x 10⁸ to 1 x 10¹⁰ M-1 s-1 (54, 57, 58). This gives us kapp 3.75 x 10⁵ s-1 and 1.2 x 10⁶ s-1, for Lake A and B respectively. Suggesting that DOC concentration in our study has less influcen than inorganic compounents in VUV performance. Nevertheless, kinetic rates of contaminants tested during this work (MC-LR, MIB and GSM) were higher in Lake B, allowing us to infer that the presence of major inorganic solutes is more important than DOC for explaining differences in performance. In 2007, Rosenfeldt and Linden propose to apply the R•OH,UV in order to experimentally determined •OH radical exposure per UV fluence a given water matrix and initial H2O2 concentration. R•OH,UV is defined as follow (Equation 11) (59):
𝑅.𝑂𝐻,𝑈𝑉 =∫𝑡
0[.𝑂𝐻]𝑑𝑡
𝐻 Equation 11
where R•OH,UV in M s cm2mJ-1, H is the fluence in mJ cm-2. Although the work mentioned above applies UV + H2O2 not VUV as is our case, we apply the concept of R•OH,UV to estimate the concentration of •OH in Lake A and B. R•OH,UV was twice bigger in Lake B than Lake A (Table 4). Consequently the •OH concentration was also lower in Lake A.
Table 4. R•OH,UV (M s cm2 mJ-1 ) for Lake A and Lake B
R•OH,UV, (M s cm2 mJ-1)GSM MIB MC-LR
Lake A 1.95× 10⁻¹³ 8.33× 10⁻¹³ 2.50× 10⁻¹⁴
Lake B 4.88× 10⁻¹³ 1.13× 10⁻¹² 5.55× 10⁻¹³
Assuming that reactor conditions operation did not change for Lake A and Lake B, the explanation why R•OH,UV is lower in Lake A than Lake B is directly related to the water matrix.
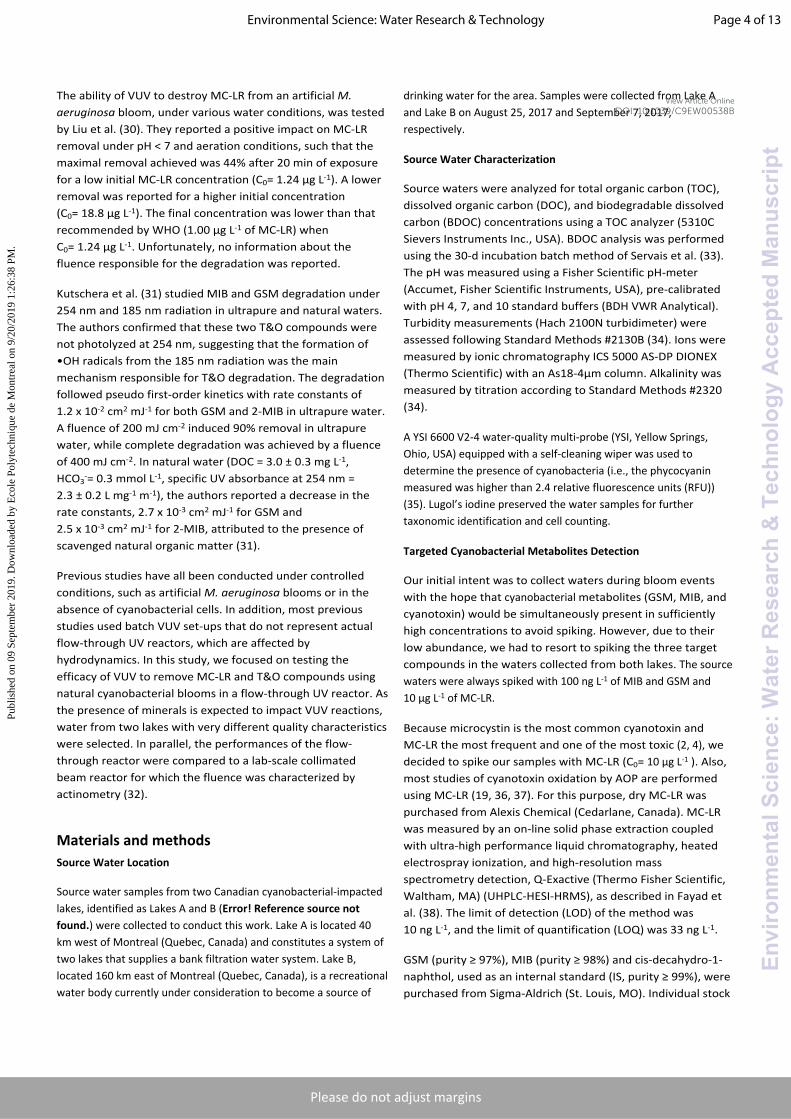
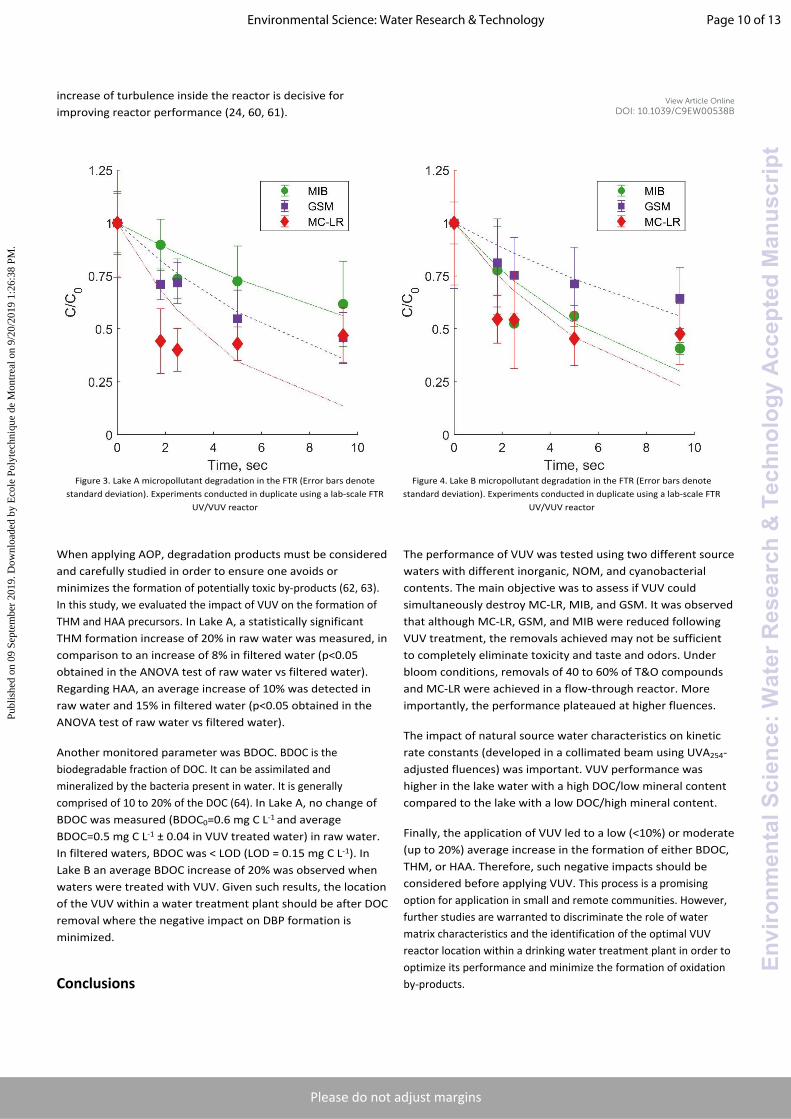
Flow-through reactor (FTR)
A bench scale FTR (Figure B (SI)) was used to study the degradation of MIB, GSM, and MC-LR. For Lake A, 40% of MIB and 50% of GSM were removed with a residence time of 9.5 s, which gave a reduction equivalent dose of 360 mJ cm-2 (Figure 3). The equivalent fluence for MIB and GSM in Lake B was 150 mJ cm-2 and removals achieved were 60% and 35%, respectively (Figure 4). Regarding MC-LR removal, 50% removal was achieved in both waters (Lakes A and B) (Figure 3 and Figure 4), but the dose required for that removal in Lake A was twice the dose required in Lake B, 230 and 100 mJ cm-2, respectively. In order to achieve the same removal, a higher fluence was required in Lake A. Differences in removals could be explained on one hand by the water matrix and its impact on the fluence received by the sample and the kinetics
involved, and on the other hand by the hydrodynamics of the reactor. The water matrix effect was discussed in the previous section.
According to Bagheri and Mohseni (2015) the hydrodynamics of the reactor is correlated with its performance (60). About 90% of 185 nm photons are expected to be absorbed in the 0.3 cm layer close to the lamp (23) (details of the propagation of 254 nm and 185 nm photons are presented elsewhere (24)). In our study, the Reynolds number in the FTR varied from 320 to 1700, suggesting a laminar flow regime and thus a strong influence of hydrodynamics on reactor performance. The lack of turbulence along with poor distribution of VUV photons in the reactor may also explain why we observed a plateau of performance in the FTR at higher fluences. Consequently, the
Page 9 of 13 Environmental Science: Water Research & Technology
Env
iron
men
talS
cien
ce:W
ater
Res
earc
h&
Tech
nolo
gyA
ccep
ted
Man
uscr
ipt
Publ
ishe
d on
09
Sept
embe
r 20
19. D
ownl
oade
d by
Eco
le P
olyt
echn
ique
de
Mon
trea
l on
9/20
/201
9 1:
26:3
8 PM
.
View Article OnlineDOI: 10.1039/C9EW00538B
Please do not adjust margins
increase of turbulence inside the reactor is decisive for improving reactor performance (24, 60, 61).
Figure 3. Lake A micropollutant degradation in the FTR (Error bars denote standard deviation). Experiments conducted in duplicate using a lab-scale FTR
UV/VUV reactor
Figure 4. Lake B micropollutant degradation in the FTR (Error bars denote standard deviation). Experiments conducted in duplicate using a lab-scale FTR
UV/VUV reactor
When applying AOP, degradation products must be considered and carefully studied in order to ensure one avoids or minimizes the formation of potentially toxic by-products (62, 63). In this study, we evaluated the impact of VUV on the formation of THM and HAA precursors. In Lake A, a statistically significant THM formation increase of 20% in raw water was measured, in comparison to an increase of 8% in filtered water (p<0.05 obtained in the ANOVA test of raw water vs filtered water). Regarding HAA, an average increase of 10% was detected in raw water and 15% in filtered water (p<0.05 obtained in the ANOVA test of raw water vs filtered water).
Another monitored parameter was BDOC. BDOC is the biodegradable fraction of DOC. It can be assimilated and mineralized by the bacteria present in water. It is generally comprised of 10 to 20% of the DOC (64). In Lake A, no change of BDOC was measured (BDOC0=0.6 mg C L-1 and average BDOC=0.5 mg C L-1 ± 0.04 in VUV treated water) in raw water. In filtered waters, BDOC was < LOD (LOD = 0.15 mg C L-1). In Lake B an average BDOC increase of 20% was observed when waters were treated with VUV. Given such results, the location of the VUV within a water treatment plant should be after DOC removal where the negative impact on DBP formation is minimized.
Conclusions
The performance of VUV was tested using two different source waters with different inorganic, NOM, and cyanobacterial contents. The main objective was to assess if VUV could simultaneously destroy MC-LR, MIB, and GSM. It was observed that although MC-LR, GSM, and MIB were reduced following VUV treatment, the removals achieved may not be sufficient to completely eliminate toxicity and taste and odors. Under bloom conditions, removals of 40 to 60% of T&O compounds and MC-LR were achieved in a flow-through reactor. More importantly, the performance plateaued at higher fluences.
The impact of natural source water characteristics on kinetic rate constants (developed in a collimated beam using UVA254-adjusted fluences) was important. VUV performance was higher in the lake water with a high DOC/low mineral content compared to the lake with a low DOC/high mineral content.
Finally, the application of VUV led to a low (<10%) or moderate (up to 20%) average increase in the formation of either BDOC, THM, or HAA. Therefore, such negative impacts should be considered before applying VUV. This process is a promising option for application in small and remote communities. However, further studies are warranted to discriminate the role of water matrix characteristics and the identification of the optimal VUV reactor location within a drinking water treatment plant in order to optimize its performance and minimize the formation of oxidation by-products.
Page 10 of 13Environmental Science: Water Research & Technology
Env
iron
men
talS
cien
ce:W
ater
Res
earc
h&
Tech
nolo
gyA
ccep
ted
Man
uscr
ipt
Publ
ishe
d on
09
Sept
embe
r 20
19. D
ownl
oade
d by
Eco
le P
olyt
echn
ique
de
Mon
trea
l on
9/20
/201
9 1:
26:3
8 PM
.
View Article OnlineDOI: 10.1039/C9EW00538B

ARTICLE Journal Name
Please do not adjust margins
Please do not adjust margins
Conflicts of interestThere are no conflicts to declare.
AcknowledgementsThis study was financially supported by Natural Sciences andEngineering Research Council of Canada (NSERC) IndustrialChair on Drinking Water at Polytechnique de Montreal.The authors acknowledge the support of Yves Fontaine, Julie Philibert, Jacinthe Mailly, Morgan Solliec and Sung Do Duy.
References1. Lurling M, Roessink I. On the way to cyanobacterial blooms: impact of the herbicide metribuzin on the competition between a green alga (Scenedesmus) and a cyanobacterium (Microcystis). Chemosphere. 2006;65(4):618-26.2. Kardinaal W, Visser P. Dynamic of Cyanobacterial Toxins. In: Springer E, editor. Harmful Cyanobacteria: Huisman, J.; Matthijs, H.; Visser, P.; 2005. p. 41-63.3. Codd GA, Morrison LF, Metcalf JS. Cyanobacterial toxins: Risk management for health protection. Toxicol Appl Pharmacol. 2005;203(3):264-72.4. Wood SA, Holland PT, Stirling DJ, Briggs LR, Sprosen J, Ruck JG, et al. Survey of cyanotoxins in New Zealand water bodies between 2001 and 2004. New Zealand Journal of Marine and Freshwater Research. 2006;40:585-97.5. Sivonen K. Toxic Cyanobacteria. In: Schaechter M, editor. Encyclopedia of Microbiology: Elsevier; 2009. p. 290-[307].6. WHO. Cyanobacterial toxins: Microcystin-LR in Drinking-water. Background document for development of Wordl Health Organization (WHO) Guidelines for Drinking-water Quality. 1998;2.7. HealthCanada. Guidelines for Canadian Drinking Water Quality: Supporting Documentation. Cyanobacterial Toxins — Microcystin-LR. In: Canada H, editor. Ottawa, Canada2002.8. Whitton B, Potts, M. Introduction to the cyanobacteria. In: Whitton B, Potts, M., editor. The ecology of Cyanobacteria Their diversity in time and space: Kluwer Academic Publishers; 2002. p. 1-11.9. USEPA. Drinking Water Health Advisory for the Cyanobacterial Microcystin Toxins. US Environmental Protection Agency Washington, DC 204602015.10. USEPA. Health Effects Support Document for the Cyanobacterial Toxin Microcystins. US Environmental Protection Agency. In: Division OoWTHaEC, editor. Washington, DC 204602015.11. Mallevialle J. Identification and Treatment of Tastes and Odors in Drinking Water. Denver, CO,: American Water Works Association; 1987.12. Chow CD, M.; House, J.; Burch, M.; Velzeboer, R. The impact of conventional water treatment processes on cells of the cyanobacterium Microcystis aeruginosa. Water Research. 1999;33(15):3253-62.13. Stackelberg PE, Gibs J, Furlong ET, Meyer MT, Zaugg SD, Lippincott RL. Efficiency of conventional drinking-water-treatment processes in removal of pharmaceuticals and other organic compounds. Sci Total Environ. 2007;377(2-3):255-72.14. Fan J, Hobson P, Ho L, Daly R, Brookes J. The effects of various control and water treatment processes on the membrane integrity and toxin fate of cyanobacteria. J Hazard Mater. 2014;264:313-22.
15. Naceradska J, Pivokonsky M, Pivokonska L, Baresova M, Henderson RK, Zamyadi A, et al. The impact of pre-oxidation with potassium permanganate on cyanobacterial organic matter removal by coagulation. Water Res. 2017;114:42-9.16. Zhou S, Shao Y, Gao N, Zhu S, Li L, Deng J, et al. Removal of Microcystis aeruginosa by potassium ferrate (VI): Impacts on cells integrity, intracellular organic matter release and disinfection by-products formation. Chemical Engineering Journal. 2014;251:304-9.17. Zamyadi A, Dorner S, Ndong M, Ellis D, Bolduc A, Bastien C, et al. Low-risk cyanobacterial bloom sources: Cell accumulation within full-scale treatment plants. Journal - American Water Works Association. 2013;105(11):E651-E63.18. Sharma VK, Triantis TM, Antoniou MG, He X, Pelaez M, Han C, et al. Destruction of microcystins by conventional and advanced oxidation processes: A review. Separation and Purification Technology. 2012;91:3-17.19. Al Momani F, Smith DW, Gamal El-Din M. Degradation of cyanobacteria toxin by advanced oxidation processes. J Hazard Mater. 2008;150(2):238-49.20. Kim TK, Moon BR, Kim T, Kim MK, Zoh KD. Degradation mechanisms of geosmin and 2-MIB during UV photolysis and UV/chlorine reactions. Chemosphere. 2016;162:157-64.21. Schmidt W, Willmitzer H, Bornmann K, Pietsch J. Production of drinking water from raw water containing cyanobacteria--pilot plant studies for assessing the risk of microcystin breakthrough. Environ Toxicol. 2002;17(4):375-85.22. Wert EC, Korak JA, Trenholm RA, Rosario-Ortiz FL. Effect of oxidant exposure on the release of intracellular microcystin, MIB, and geosmin from three cyanobacteria species. Water Res. 2014;52:251-9.23. Imoberdorf G, Mohseni M. Modeling and experimental evaluation of vacuum-UV photoreactors for water treatment. Chemical Engineering Science. 2011;66(6):1159-67.24. Imoberdorf G, Mohseni M. Degradation of natural organic matter in surface water using vacuum-UV irradiation. J Hazard Mater. 2011;186(1):240-6.25. Zoschke K, Bornick H, Worch E. Vacuum-UV radiation at 185 nm in water treatment--a review. Water Res. 2014;52:131-45.26. Zoschke K, Dietrich N, Bornick H, Worch E. UV-based advanced oxidation processes for the treatment of odour compounds: efficiency and by-product formation. Water Res. 2012;46(16):5365-73.27. Li M, Hao M, Yang L, Yao H, Bolton JR, Blatchley ER, 3rd, et al. Trace Organic Pollutant Removal by VUV/UV/chlorine Process: Feasibility Investigation for Drinking Water Treatment on a Mini-Fluidic VUV/UV Photoreaction System and a Pilot Photoreactor. Environ Sci Technol. 2018;52(13):7426-33.28. Gonzalez M, Oliveros E, Worner M, Braun A. Vacuum-ultraviolet photolysis of aqueous reaction systems. Journal of Photochemistry and Photobiology C: Photochemistry Reviews. 2004;5(3):225-46.29. Bolton J, Cotton C. The Ultraviolet Disinfection Handbook. First Edition ed: American Water Works Association; 2008. 149 p.30. Liu S, Hu X, Jiang W, Ma L, Cai M, Xu H, et al. Degradation of Microcystins from Microcystis aeruginosa by 185-nm UV Irradiation. Water, Air, & Soil Pollution. 2016;227(4).31. Kutschera K, Bornick H, Worch E. Photoinitiated oxidation of geosmin and 2-methylisoborneol by irradiation with 254 nm and 185 nm UV light. Water Res. 2009;43(8):2224-32.32. Rahn RO, Bolton J, Stefan MI. The iodide/iodate actinometer in UV disinfection: determination of the fluence rate distribution in UV reactors. Photochem Photobiol. 2006;82(2):611-5.
Page 11 of 13 Environmental Science: Water Research & Technology
Env
iron
men
talS
cien
ce:W
ater
Res
earc
h&
Tech
nolo
gyA
ccep
ted
Man
uscr
ipt
Publ
ishe
d on
09
Sept
embe
r 20
19. D
ownl
oade
d by
Eco
le P
olyt
echn
ique
de
Mon
trea
l on
9/20
/201
9 1:
26:3
8 PM
.
View Article OnlineDOI: 10.1039/C9EW00538B

Please do not adjust margins
33. Servais P, Barillier, A., Garnier, J. Determination of the biodegradable fraction of dissolved and particulate organic carbon. International Journal of Limnology. 1995;31(1):78-80.34. American Public Health Association (APHA). Standard methods for the examination of water and wastewater (20th Edition). Clescheri L, Greenberg AE, Eaton AD, editors. Washington, DC, USA: American Water Works Association (AWWA) and the Water Environment Federation; 1998. 1220 p.35. McQuaid N, Zamyadi A, Prevost M, Bird DF, Dorner S. Use of in vivo phycocyanin fluorescence to monitor potential microcystin-producing cyanobacterial biovolume in a drinking water source. J Environ Monit. 2011;13(2):455-63.36. He X, de la Cruz AA, Hiskia A, Kaloudis T, O'Shea K, Dionysiou DD. Destruction of microcystins (cyanotoxins) by UV-254 nm-based direct photolysis and advanced oxidation processes (AOPs): influence of variable amino acids on the degradation kinetics and reaction mechanisms. Water Res. 2015;74:227-38.37. Sun Q, Zhang T, Wang F, Liu C, Wu C, Xie RR, et al. Ultraviolet photosensitized transformation mechanism of microcystin-LR by natural organic matter in raw water. Chemosphere. 2018;209:96-103.38. Fayad PB, Roy-Lachapelle A, Duy SV, Prevost M, Sauve S. On-line solid-phase extraction coupled to liquid chromatography tandem mass spectrometry for the analysis of cyanotoxins in algal blooms. Toxicon. 2015;108:167-75.39. Duca C, Imoberdorf G, Mohseni M. Novel Collimated Beam Setup to Study the Kinetics of VUV-Induced Reactions. Photochem Photobiol. 2014;90(1):238-40.40. Serrano Mora A. UV/Vacuum-UV Advanced Oxidation Process for theTreatment of Micropollutants from Drinking Water Sources Under Common Operational Temperatures. The University of British Columbia. 2016.41. Furatian L. The Use of 185 nm Radiation for Drinking Water Treatment. Influence of Temperature and Major Solutes on the Degradation of Trace Organic Contaminants. The University of British Columbia. 2017.42. Furatian L, Mohseni M. Temperature dependence of 185 nm photochemical water treatment – The photolysis of water. Journal of Photochemistry and Photobiology A: Chemistry. 2018;356:364-9.43. Linden K, Mohseni M. Advanced Oxidation Processes: Applications in Drinking Water Treatment. Comprehensive Water Quality and Purification. 2: Elsevier; 2014. p. 148-72.44. Chintalapati P. Degradation of Cyanobacterial toxin Microcystin-LR usinf UV/Vacuum-UV advanced oxidation for drinking water. The University of British Columbia. 2017.45. Cabaj A, Sommer R, Kundi M. The influence of dose distributions in the result of UV-biosodimetry.46. Cabaj A, Sommer R, Schoenen D. Biodosimetry: Model calculation for UV water disidention devices with regard to dose distributins. Water Research. 1996;30(4):1003-9.47. Jin S, Mofidi AA, Linden KG. Polychromatic UV fluence measurement using chemical actinometry, biodosimetry, and mathematical techniques. Journal of Environmental Engineering. 2006;132(8):831-41.48. Bolton JL, K. Standardization of Methods for Fluence (UV Dose) determination in bench-scale UV experiments. JOURNAL OF ENVIRONMENTAL ENGINEERING. 2003;129((3)):209-15.49. Furatian L, Mohseni M. Influence of chloride on the 185nm advanced oxidation process. Chemosphere. 2018;199:263-8.50. Serrano Mora A, Mohseni M. Temperature dependence of the absorbance of 185 nm photons by water and commonly occurring solutes and its influence on the VUV advanced oxidation process.
Environmental Science Water Research & Technology. 2018;4:1303-9.51. WEEKS JL, MEABURN GMAC, GORDON S. Absorption Coefficients of Liquid Water And Aqueous Solution in the Far Ultraviolet. Radiation Research. 1963;19:559-67.52. Hasegawa K, Neta P. Rate constants and mechanisms of reaction of chloride (Cl2-) radicals. J Phys Chem. 1978;82:854-7.53. Buxton GV, Greenstock CL, Helman WP, Ross AB. Critical Review of rate constants for reactions of hydrated electrons, hydrogen atoms and hydroxyl radicals (⋅OH/⋅O− in Aqueous Solution. Journal of Physical and Chemical Reference Data. 1988;17(2):513-886.54. Langlais B, Reckhow DA, Brink DR. Ozone in water treatment: application and engineering: American Water Works Association Research Foundation: Compagnie Générale Eaux; 1991.55. Duca C, Imoberdorf G, Mohseni M. Effects of inorganics on the degradation of micropollutants with vacuum UV (VUV) advanced oxidation. J Environ Sci Health A Tox Hazard Subst Environ Eng. 2017;52(6):524-32.56. Xie P, Yue S, Ding J, Wan Y, Li X, Ma J, et al. Degradation of organic pollutants by Vacuum-Ultraviolet (VUV): Kinetic model and efficiency. Water Res. 2018;133:69-78.57. Westerhoff P, Aiken G, Amy G, Debroux J. Relationships between the structure of natural organic matter and its reactivity towards molecular ozone and hydroxyl radicals. Water Res. 1999;33:2265-76.58. Goldstone JV, Pullin MJ, Bertilsson S, Voelker BM. Reactions of hydroxyl radical with humic substances: bleaching, mineralization, and production of bioavailable carbon substrates. Environ Sci Technol. 2002;36:362-72.59. Rosenfeldt E, Linden K. The ROH,UV Concept to Characterize and the Model UV/H2O2 Process in Natural Waters. ENVIRONMENTAL SCIENCE & TECHNOLOGY. 2007;41(7):2548-53.60. Bagheri M, Mohseni M. Impact of hydrodynamics on pollutant degradation and energy efficiency of VUV/UV and H2O2/UV oxidation processes. J Environ Manage. 2015;164:114-20.61. Dobrovic S, Juretic H, Ruzinski N. Photodegradation of natural organic matter in water with UV irradiation at 185 and 254 nm: importance of hydrodynamic conditions on the decomposition rate. Sep Sci Technol. 2007;42:1421–32.62. Von Gunten U. Ozonation of drinking water: Part II. Disinfection and by-product formation in presence of bromide, iodide or chlorine. Water Research. 2003;37(7):1469-87.63. Von Gunten U. Ozonation of drinking water: Part I. Oxidation kinetics and product formation. Water Research. 2003;37:1443-67.64. Escobar I, Randall A. Assimilable organic carbon (AOC) and biodegradable dissolved organic carbon (BDOC): Complementary measurements. Water Research. 2001;35(18):4444–54.
Page 12 of 13Environmental Science: Water Research & Technology
Env
iron
men
talS
cien
ce:W
ater
Res
earc
h&
Tech
nolo
gyA
ccep
ted
Man
uscr
ipt
Publ
ishe
d on
09
Sept
embe
r 20
19. D
ownl
oade
d by
Eco
le P
olyt
echn
ique
de
Mon
trea
l on
9/20
/201
9 1:
26:3
8 PM
.
View Article OnlineDOI: 10.1039/C9EW00538B

Impact of VUV on different water contaminants and the high NOM of a cyanobacterial bloom.
Page 13 of 13 Environmental Science: Water Research & Technology
Env
iron
men
talS
cien
ce:W
ater
Res
earc
h&
Tech
nolo
gyA
ccep
ted
Man
uscr
ipt
Publ
ishe
d on
09
Sept
embe
r 20
19. D
ownl
oade
d by
Eco
le P
olyt
echn
ique
de
Mon
trea
l on
9/20
/201
9 1:
26:3
8 PM
.
View Article OnlineDOI: 10.1039/C9EW00538B