wavelet decomposition-based morphometric algorithm for analyzing photomicrographs of texture of...
TRANSCRIPT

ISSN 0012�5008, Doklady Chemistry, 2010, Vol. 434, Part 2, pp. 269–273. © Pleiades Publishing, Ltd., 2010.Original Russian Text © P.D. Sarkisov, O.B. Butusov, V.P. Meshalkin, 2010, published in Doklady Akademii Nauk, 2010, Vol. 434, No. 5, pp. 651–655.
269
Most physicochemical functional properties ofnanomaterials are determined by cluster organizationof nanoparticles in the texture of material. For exam�ple, radiation permeability of a structural nanomate�rial is essentially dependent on the presence and shapeof nanocavities, which ensure rapid annihilation ofradiation�induced defects.
In some cases, aggregation of nanoclusters, whichoccurs because of a large ratio between the surface andvolume energies, impairs the properties of nanocom�posites [1]. Therefore, one of the main technologicalproblems in creating the texture of nanomaterials is toreach uniform distribution of nanoclusters in a nano�composite. Of importance in planning the propertiesof nanocomposites is to take into account the “com�pactness” or “looseness” of nanoclusters [2] and alsothe packing density of crystals of nanomaterials.
Cluster analysis of pixels in a photomicrograph oftexture is directly related to methods of classificationand segmentation of images [3]. The purpose of thetexture analysis is to identify image regions with iden�tical characteristics of pixel mosaic. There are threemain types of texture analysis: statistical, structural�cluster and frequency�decomposition [4].
In statistical methods, classification indices oforganization of nanoparticles are statistical momentsof image pixel distribution or pixel brightness codistri�bution histograms.
In structural�cluster methods, classification ismade in terms of numerical morphometric parameterscharacterizing the internal geometrical organization
of clusters, such as area, eccentricity, compact�ness, etc.
In frequency�decomposition methods, classifica�tion is performed on the basis of frequency spectra ofimages, e.g., spectra of two�dimensional Fouriertransforms or wavelet transforms.
We proposed an original wavelet decomposition�based morphometric algorithm for analyzing photo�micrographs that is based on a combination of theabove three types of methods.
STEPS OF WAVELET MORPHOMETRIC ALGORITHM FOR COMPUTER ANALYSIS
OF TEXTURE OF SOLID�PHASE NANOMATERIALS
The texture of a nanomaterial characterizes ele�mentwise shape specific features of organization of theinternal or surface structure of this material.
The algorithm for analyzing photomicrographs oftexture of nanocomposites comprises the flowingsteps.
Step 1. Binary decomposition filtration of the ini�tial photomicrograph into low� and high�frequencyimage components using a discrete wavelet transform.
Step 2. Calculation of special energy�mechanicalindices (or special matrices) for the high�frequencycomponent of the photomicrograph. The specialenergy�mechanical indices are entropy, informationmeasure of correlation of clusters, and uniformitycoefficient; the latter describes specific features ofshape, composition, and other properties of materialtexture elements.
Step 3. Visualization of the special energy�mechanical indices and selection of an image of cho�sen elements with pronounced physical structure forfurther morphometric analysis, which determines spe�cific features of shape, composition, and other proper�ties of material texture elements.
Step 4. Calculation of integral morphometric indi�ces for the selected energy�mechanical indices. Mor�phometric indices are numerical characteristics of the
CHEMICALTECHNOLOGY
Wavelet Decomposition�Based Morphometric Algorithmfor Analyzing Photomicrographs of Texture of Solid�Phase
NanomaterialsAcademician P. D. Sarkisov, O. B. Butusov, and Corresponding Member of the RAS V. P. Meshalkin
Received May 6, 2010
DOI: 10.1134/S001250081010006X
Mendeleev Russian University of Chemical Technology, Miusskaya pl. 9, 127047 Moscow, RussiaKurnakov Institute of General and Inorganic Chemistry, Russian Academy of Sciences, Leninskii pr. 31, Moscow, 119991 RussiaMoscow State University of Environmental Engineering,ul. Staraya Basmannaya 21/4, Moscow, 107060 Russia

270
DOKLADY CHEMISTRY Vol. 434 Part 2 2010
SARKISOV et al.
geometrical shape of organization of texture elements:volume, length, height, eccentricity, etc. [5–7].
Step 5. Analysis of identified clusters in the photo�micrograph of texture of nanocomposites using theintegral morphometric indices calculated in step 4.
A two�dimensional image of the brightness field ofphotomicrographs of nanocomposites is a section sur�face in a three�dimensional space. One of the methodsfor analyzing the image of a surface is the method ofbinary decomposition of images of surfaces at varioussection levels. Transition from one section to anotheris accompanied by deformations and changes in theconfiguration of objects of the binary image. As char�acteristics of these changes, we propose to use variousmorphometric indices. In our studies, photomicro�graphs of texture of nanocomposites were subjected topreliminary decomposition filtration using a discretewavelet transform into low�frequency components(approximations) and high�frequency components.
Further, the texture of the high�frequency compo�nent was analyzed using algorithms for calculating theenergy�mechanical indices of texture organizationelements. Obtained by these mathematical transfor�mations, the values of the energy�mechanical indicesof the image were then analyzed using the binarydecomposition filtration mechanism.
The area of an object (the number of pixels consti�tuting the object), the length of the major and minoraxes of inertia, the orientation of an object, and itseccentricity were chosen as morphometric indices. Weproposed algorithms for calculating these morpho�metric indices [5, 6].
Thus, the wavelet morphometric algorithm forcomputer analysis of photomicrographs of texture ofnanomaterials ensures the sequential hierarchicalidentification of possible clusters of nanoparticles inthe texture of a nanomaterial that are not clearly dis�cerned in the initial photomicrograph. This is doneusing various energy�mechanical indices, which arequantitatively characterized by various morphometricindices.
Each binary decomposition filtration section canbe characterized by mean and standard deviations foreach morphometric index:
(1)
where E ∈ {S, Amax, Amin, ε, Q}, S is the area of anobject, Amax is the length of the major axis of inertia,Amin or is the length of the minor axis of inertia, ε is theeccentricity of the object, Q is the orientation of theobject, Mb is the number of objects at the binarizationsection under the number b, and m is the index of theobject.
Eb1
Mb
����� Emb,
m 1=
Mb
∑=
σb E( )1
Mb 1–������������� Emb Eb–( )
2,
m 1=
Mb
∑=
The generalized morphometric indices over all thebinary decomposition filtration sections are the uni�versal mean calculated from the arithmetic means foreach section and the universal standard deviation cal�culated from the standard deviations for each section:
(2)
where is the universal mean, B is the number ofbinary sections, and b is the index of a section.
System of morphometric indices (1)–(2) can beproposed for numerical evaluation of the organizationof identified possible clusters in the texture of nano�materials.
For the researcher to most confidently understandand explain the organization of possible clusters in thephotomicrographs of texture of nanomaterials thatwere identified by the algorithm we proposed, it is nec�essary to further analyze a set of various photomicro�graphs of the same texture in different operatingmodes of atomic�force microscope or using otherinstrumentation.
RESULTS OF APPLICATION OF THE WAVELET MORPHOMETRIC ALGORITHM
FOR COMPUTER ANALYSIS OF TEXTUREOF SOLID�PHASE NANOMATERIALS
A computer analysis of the texture of a solid�phasenanomaterial by the proposed wavelet morphometricalgorithm was performed using an atomic�forcemicroscope photograph of a silicon carbide nanocom�posite synthesized at the Kurnakov Institute of Gen�eral and Inorganic Chemistry, Russian Academy ofSciences, Moscow, Russia (Fig. 1).
Recently, the commercial interest in nanocrystal�line silicon carbide has considerably increased. First ofall, this is because of the semiconductor properties ofthis nanomaterial. SiC has numerous useful electricalproperties [8, 9], among which is a wide bandgap,allowing the use of this semiconductor over a widerange of high temperatures. Another important char�acteristic of silicon carbide is high thermal conductiv�ity, which is essential for solving the problem of cool�ing electronic equipment. In these parameters, nanoc�rystalline SiC is superior to the classicalsemiconductor GaAs. Two more useful properties ofSiC are high hardness and high elasticity.
By a discrete wavelet transform, the initial photo�micrograph (Fig. 1) was subjected to decompositionfiltration into low� and high�frequency components.
As is seen in Fig. 1, the initial photomicrograph ofthe silicon carbide texture is characterized by the pres�ence of a large number of various microstructures(probably, clusters) looking perfectly identical. How�ever, in the image of the high�frequency component,not nearly all the microstructures discernible in Fig. 1are seen. The number of microstructures observable in
E⟨ ⟩1B��� Eb, σ E( )⟨ ⟩
b 1=
B
∑1B��� σb E( ),
b 1=
B
∑= =
…⟨ ⟩
DOKLADY CHEMISTRY Vol. 434 Part 2 2010
WAVELET DECOMPOSITION�BASED MORPHOMETRIC ALGORITHM 271
the high�frequency component is smaller than that forthe low�frequency component. These microstructurescharacterize specific features of the nanomaterial tex�ture.
They are identified using energy�mechanicalindices calculated using special energy�mechanicalmatrices.
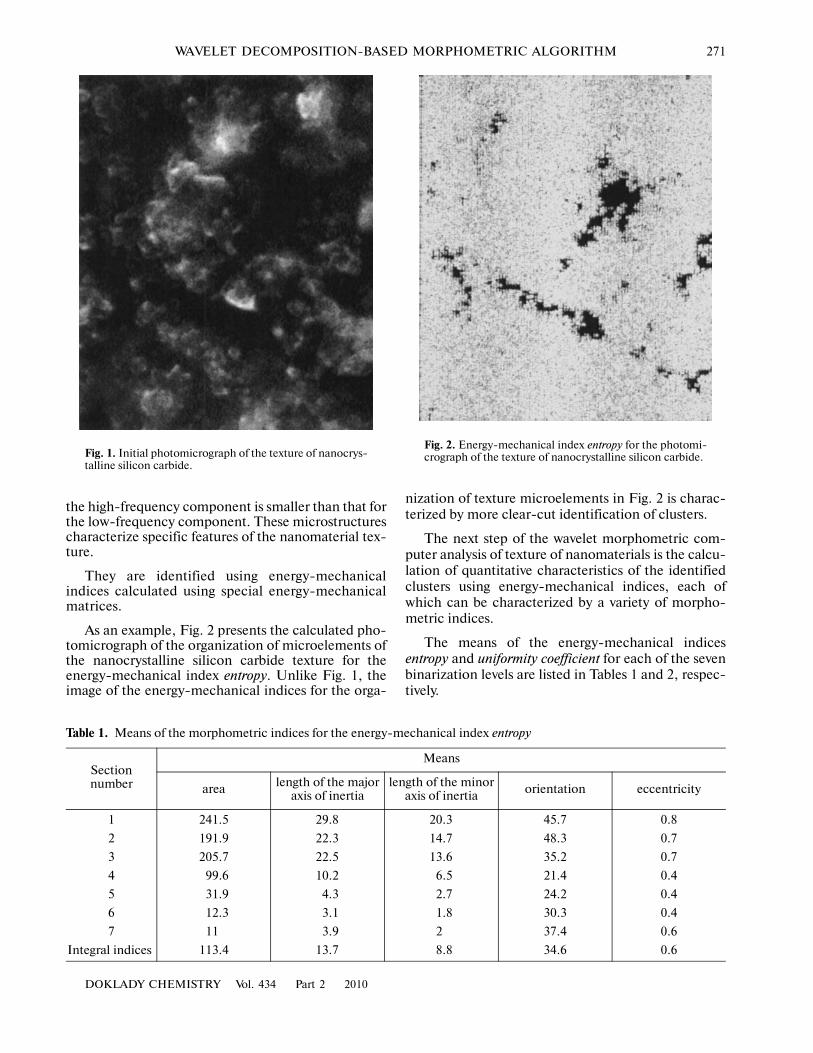
As an example, Fig. 2 presents the calculated pho�tomicrograph of the organization of microelements ofthe nanocrystalline silicon carbide texture for theenergy�mechanical index entropy. Unlike Fig. 1, theimage of the energy�mechanical indices for the orga�
nization of texture microelements in Fig. 2 is charac�terized by more clear�cut identification of clusters.
The next step of the wavelet morphometric com�puter analysis of texture of nanomaterials is the calcu�lation of quantitative characteristics of the identifiedclusters using energy�mechanical indices, each ofwhich can be characterized by a variety of morpho�metric indices.
The means of the energy�mechanical indicesentropy and uniformity coefficient for each of the sevenbinarization levels are listed in Tables 1 and 2, respec�tively.
Fig. 2. Energy�mechanical index entropy for the photomi�crograph of the texture of nanocrystalline silicon carbide.Fig. 1. Initial photomicrograph of the texture of nanocrys�
talline silicon carbide.
Table 1. Means of the morphometric indices for the energy�mechanical index entropy
Sectionnumber
Means
area length of the major axis of inertia
length of the minor axis of inertia orientation eccentricity
1 241.5 29.8 20.3 45.7 0.8
2 191.9 22.3 14.7 48.3 0.7
3 205.7 22.5 13.6 35.2 0.7
4 99.6 10.2 6.5 21.4 0.4
5 31.9 4.3 2.7 24.2 0.4
6 12.3 3.1 1.8 30.3 0.4
7 11 3.9 2 37.4 0.6
Integral indices 113.4 13.7 8.8 34.6 0.6

272
DOKLADY CHEMISTRY Vol. 434 Part 2 2010
SARKISOV et al.
The lowermost rows of the tables present the indi�ces averaged over all the binary decomposition sec�tions. These average values can be proposed as integralindices of organization of clusters in the texture ofnanomaterials.
For the energy�mechanical index uniformity coeffi�cient, the mean eccentricity is 0.5, which is indicativeof the spherical shape of clusters. At the same time, themorphometric index length of the major axis of inertiaexceeds the morphometric index length of the minoraxis of inertia by a factor of almost 4, which is indica�tive of the fact that small fragments of clusters group inone direction and large fragments gather in a perpen�dicular direction.
The morphometric index area for the energy�mechanical index entropy is almost twice as large asthe morphometric index area for the energy�mechan�ical index uniformity coefficient, which suggests a more
diffuse character of the cluster structure of the nano�material.
Figure 3 presents the graphs of the normalizedmorphometric indices for the energy�mechanicalindex entropy as a function of the level of binarizationof the initial silicon carbide photomicrograph. Themorphometric indices were normalized by the formula
(3)
where xmax and xmin are the maximal and minimal val�ues of an index.
The slope of the graphs characterizes the rate ofchange in the mean of an energy�mechanical index intransition from one of the photomicrograph binariza�tion sections to another, i.e., characterizes the sharp�ness of relief elements of three�dimensional brightnessfields representing the energy�mechanical indices.The relief sharpness of gentleness is an importantcharacteristic of organization of clusters in the texture
x ' x xmin–( )/ xmax xmin–( ),=
Table 2. Means of the morphometric indices for the energy�mechanical index uniformity coefficient
Sectionnumber
Means
area length of the major axis of inertia
length of the minor axis of inertia orientation eccentricity
1 34.5 5.6 3.1 33.2 0.5
2 10.3 4.1 2.2 32.4 0.6
3 7.3 3.2 1.6 26 0.5
4 14.3 3.7 1.6 18.4 0.3
5 54.4 10.2 2.7 23.7 0.4
6 122.7 23.8 4.7 50.1 0.7
7 157.3 34.7 5.7 52.6 0.8
Integral indices 57.4 12.2 3.1 33.8 0.5
0.2
10
2 3 4 5 6 7
(a)
–0.2
0.4
0.6
0.8
1.0
1.2
1 2 3 4 5 6 7
(b)
Mor
phom
etri
c in
dice
s
0.2
0
0.4
0.6
0.8
1.0
1.2
Nor
mal
ized
are
a
Area
Length of the major axis of inertia
Length of the minor axis of inertia
Orientation
Eccentricity
Area
Linear approximation of area
Binarization level
Fig. 3. Normalized morphometric indices for the energy�mechanical index entropy as a function of the level of binarization of theinitial silicon carbide photomicrograph for (a) various morphometric indices and (b) the morphometric index area and its linearapproximation.

DOKLADY CHEMISTRY Vol. 434 Part 2 2010
WAVELET DECOMPOSITION�BASED MORPHOMETRIC ALGORITHM 273
of nanomaterials. It characterizes the looseness orcompactness of the organization of clusters and,hence, directly affects the physicochemical propertiesof the nanomaterial that are determined by the inter�nal organization of clusters. The compactness of clus�ters can be quantitatively estimated using the averageslope of linear approximations of the normalizedgraphs (Fig. 3a). Figure 3b presents the morphometricindex area and its linear approximation for the energy�mechanical index entropy.
The slope of the linear approximation of the mor�phometric index area is |k | = 0.19. This relatively lowvalue of the sharpness index of relief elements of thebrightness field representing the energy�mechanicalindex entropy is indicative of gentleness of the relief,which, in turn, corresponds to the loose and diffuseorganization of clusters.
CONCLUSIONS
(1) A new wavelet decomposition�based morpho�metric algorithm is proposed for computer analysis oforganization of clusters in the texture of solid�phasenanomaterials using photomicrographs of the nano�materials. Images of organization of clusters in the ini�tial photomicrograph of the texture of nanomaterialsare obtained by binary decomposition filtration of theinitial photomicrograph using discrete wavelet trans�forms and special matrices of energy�mechanical indi�ces.
(2) A new system of energy�mechanical and mor�phometric indices of organization of clusters in thetexture of solid�phase nanomaterials is proposed,which is based on binary decomposition filtration ofphotomicrographs of nanomaterials and morphomet�ric indices of organization of clusters.
(3) New energy�mechanical indices and their cor�responding morphometric indices can be used forquantitative characterization of organization of clus�ters in the texture of solid�phase nanomaterials, which
is of importance for analyzing and predicting the phys�icochemical properties of nanomaterials.
ACKNOWLEDGMENTS
This work was supported by the Russian Founda�tion for Basic Research (project no. 09�03�00926a)and the Presidium of the Russian Academy of Sci�ences (Basic Research Program no. 18 “Targeted Syn�thesis of Inorganic Substances with Controlled Prop�erties and Creation of Functional Materials Based onThem”).
REFERENCES
1. Hui, L., Smith, R.C., Wang, X., et al., Electrical Insu�lation and Dielectric Phenomena, Annual Report Confer�ences, 26–29 October, 2008, Quebec, pp. 317–320.
2. Chou, C.H., Su, M.C.,and Lai, E., Proceedings ofIASTED Conference on Intelligent Systems and Control,Salzburg, 2003, pp. 276–281.
3. Tuceryan, M. and Jain, A.K., in Handbook of PatternRecognition and Computer Vision, Singapore: WorldSci., 1993, pp. 235–276.
4. Winkler, G., Image Analysis, Random Fields, andMarkov Chain Monte Carlo Methods, A MathematicalIntroduction, Heidelberg: Springer, 1995. Translatedunder the title Analiz izobrazhenii, sluchainye polya idinamicheskie metody Monte�Karlo. Matematicheskieosnovy, Novosibirsk: Sib. Otd. Ross. Akad. Nauk, 2002.
5. Butusov, O.B. and Meshalkin, V.P., Teor. Osn. Khim.Tekhnol., 2006, vol. 40, no. 3, pp. 313–327.
6. Butusov, O.B. and Meshalkin, V.P., Teor. Osn. Khim.Tekhnol., 2008, vol. 42, no. 2, pp. 170–175.
7. Rudakov, P.I. and Safonov, V.I., Obrabotka signalov iizobrazhenii, MATLAB 5.x (Processing of Signals andImages, MATLAB 5.x), Moscow: Dialog�MIFI, 2000.
8. Lebedev, A. and Sbruev, S., Elektronika: Nauka, Tekh�nologiya, Biznes, 2006, no. 6, pp. 28–41.
9. Filonov, K.N., Kurlov, V.N., Klassen, N.V., et al., Izv.Akad. Nauk, Ser. Fiz., 2009, vol. 73, no. 10, pp. 1457–1459.