wealth building plan - focus growth investor - pdm ... building plan development and support •...
TRANSCRIPT

Wealth Building Plan Wealth Plan, Portfolio Performance & Analysis
Example
David & Deborah Smith
1111 North River Road
Bloomfield Hills, MI 48085
111-222-3737 111-222-3738
[email protected]@comcast.net
A Wealth Building and Retirement Plan are written long-term plans to guide you to meet your retirement goals and maintain income in retirement. A plan provides peace of mind to your family, defines goals, monitors progress and drives adjustments. Plans make you less likely to overreact to market volatility and increase one’s confidence and effectiveness in managing income, spending, saving, debt and investing. The investment process is complicated and requires strict discipline without emotion. Without professional guidance, you will likely produce mediocre returns, and not meet your retirement goals. You should always seek professional advice unless you receive the proper training, invest in the proper tools, and are willing to put the time into managing your portfolio. Most people find investing complicated, difficult to find good advice and are worried about losing money.
Prepared by Philip Michalek January 2017
PDM Investment Services, LLC
A Registered Investment Advisor
5131 Standish Drive, Troy, Michigan 48085 1-248-890-4696 * www.fginvestor.com * [email protected]
See our website or brochure for our Disclosure, Fee Schedule and Privacy Policy

Our Financial Advisor Value Proposition
We put our clients interest first, investing our client’s money in the same investments we invest our personal money. Performance is monitored and verified by an independent party.
If you answer NO to any of the following questions, it is likely a good financial advisor can add value.
• Do you feel you have the proper investment training? (Asset allocation, security selection, portfolio implementation and portfolio management)
• Do you have the proper investment tools? (Market forecast, fundamental, technical, valuation, psychology and cycles & seasonality)
• Will you make the time to keep up with the complex and changing investment environment? (Barron’s, Morningstar and newsletters on the market forecast, stocks and mutual funds)
• Are you putting in enough time to design, manage and monitor your portfolios? • Are you measuring your portfolios performance each year against its benchmark?
The average investor lagged the S&P 500’s 11.1% return by 7.4% per year from 1993 to 2013 due to poor timing decisions particularly during down markets. (DALBAR research)
• Do you sell at market tops when everyone else is buying and buy at market bottoms?
If an advisor can improve your portfolio performance annually over time by at least the management fee than the portfolio is performing now, the advisor adds value.
Wealth Building Plan Development and Support • Identify goals and risk tolerance, income, spending, saving and debt service. • Investment portfolio allocation and analysis, investment and income projections. • Value comes from applying discipline to the unpredictable, chaotic and complex financial
world. A Wealth Plan is a written long-term investment plan to guide you to meet your retirement goals. It provides peace of mind to your family, defines goals, monitors progress and drives adjustments.
• Plans make you less likely to overreact to market volatility and increase one’s confidence and effectiveness in managing income, spending, saving, debt and investing.
• Our plans have measured goals with investment and income projections along with portfolio allocation & analysis. The plans are reviewed annually.
• Benchmark comparison of your progress to goals compared to others in your situation.
Investor Education • Focused Growth Investor Newsletter
An educated investor increases one’s confidence and effectiveness in investing. • Guidance through the Transition into retirement, retirement income and complex IRA rules.
Investment Research • Keeping your strategy current with the complex and changing investment environment. • Tactical investment strategies can help to control risk.
Professional Portfolio Design and Management • Market outlook, strategic asset class & sector allocation and mutual fund selection. • Efficient portfolio management and implementation with timely execution of trades. • Free annual 401(k) design for portfolio management clients.
Behavior Coach & Fraud Detection • Behavior coach for disciplined emotional support through bull & bear markets and bubbles. • Help investors stick to their strategy and avoid low returns from jumping in and out of funds. • A trusted advisor monitors account activities for fraud, account titles and beneficiaries
Portfolio Performance Analysis with Quarterly Performance Reports • Investments, asset allocation, cash movement, management fees and performance.

Stock Market Return Expectations S&P 500 (2017)
Annual return predictions should be calculated over the long term of five to ten years. Expected returns are much higher after a bear market when valuations are low than in a mature bull market when valuations are high. Stock appreciation is based on fundamental returns (earnings growth and dividend yield) and speculative return (valuation expansion). Earnings growth can change fast and valuation expansion (speculative return) is impossible to predict.
• Global growth has slowed to the 3.0% to 4.0% range and this will likely be the norm going forward. The developed countries like the United States, Europe and Japan continue to see low growth. Emerging market growth is higher, but slowing. Slowing productivity and demographics is hurting growth.
• Dividend yields over the past 100 years were around 4.0%, but have slowed to around 2.5%. • The PE ratio of the S&P 500 (SPY) at the end of 2016 was 19.9 past/19.5 forward. The PE ratio is close
to the average PE of 18, leaving no return for long-term expansion. • Expected returns going forward are going to be low. Bond yields are low, so bond returns are likely to be
low or negative as interest rates rise. Bonds will not contribute as much to the typical 70% stock & 30% bond portfolio like they have in the past 30 years. Stocks are fair valued so their contribution to portfolio returns will also be low. (Labor Force Growth + Productivity Growth Expectations = 2.0%)
• Since the 1980’s stocks and bonds moved together benefiting from falling interest rates, falling inflation and rising productivity. Alternative investments may fill some of the gap.
The earnings growth, dividend yield and PE expansion indicator is predicting a 6.0% annual return going forward. (see calculation below) The earnings yield predictor is predicting a 7.1% annual return going forward. (1/19.5 forward PE = 5.1% + 2.0% dividend yield) The forward PE and subsequent 5-yr annualized returns indicator is predicting a 5.0% annual return. Expected Returns are based on past performance, a secular bull market and future expectations from various sources. Returns in the table reflect average annual S&P 500 total returns going forward, but are not guaranteed. For real return, subtract 2.5% for inflation. The global stock market performance, asset allocation and equity selection contribute to portfolio performance.
Portfolio Manager Return Expectations • A good portfolio manager aims to outperform the benchmark that it tracks based on a client’s risk level. • The Morningstar benchmarks are a good place to start. Unless you are in an aggressive risk portfolio
100% invested in stocks, you should not judge your portfolio against the S&P 500 Large Cap Index. • A portfolio manager and risk strategy should be judged over a 5 and 10-year period, not over a single
year. If a manager can outperform its benchmark 3 out of 4 years with the appropriate risk, they are doing a good job relative to most fund and portfolio managers.
• Market conditions change during the economic cycle. No strategy can outperform in every part of the market cycle. By chasing performance, investors fall into an ongoing pattern of buying after share prices have risen and selling after they have dropped.
• Top managers make up lost ground and add excess return following periods of weakness. Investors with the patience to stick with top managers through trying times are likely to reap greater rewards than those who chase the latest winner. Approximately 85% of top managers have at least one three-year period in which they underperformed their benchmark by 1%, 50% by 3% and 25% by 5%. (AAII 2016)
• Achieving goals based on a long-term plan is more important than maximizing returns each year. • Portfolio management fees should be considered. If you are outperforming the benchmark by 2% per
year before fees over the long-term and paying a 1% annual portfolio management fee, you can justify the cost. Also, consider the other services you are getting from the portfolio manager as part of the fee.
Earning Dividends PE Total Return Expectations Growth Yield Expansion Next 5 Years (Annualized) ______________________________________________________________________________________________________ Past Stock Market 4.0% 4.0% 1.0% 9.0% Future Stock Market 3.5% 2.5% 0.0% 6.0% High volatility, higher risk of loss
Moderate Allocation Portfolio (75% stocks / 20% bonds / 5% cash) 5.2% Moderate volatility, less risk of loss Future Bond Mix 3.0%Money Market, CD or Short Term Bond Fund 2.0% Low volatility and limited risk of loss

Investment Goals & Risk Tolerance Page 1
Client Information David Smith (45), Deborah Smith (45), Michael (14), Michelle (10) in 2017.
Investment Advisor Philip Michalek, PDM Investment Services.
Goals, Time Horizon, Risk Tolerance Retire in 10 years at 55 years old.
An ideal retirement is often defined as one including freedom, security, flexibility, reduced stress, peace of mind, travel, time with family and time with hobbies. Follow your investment plan to achieve your goals.
GROWTH strategy with a MODERATE risk. (Tactical Allocation) (Base: 75% Stocks / 25% Bonds & Cash)
How much will you need to save for retirement to maintain your standard of living? The Wealth-to-Income Ratio says you should have saved 10 times your working average annual income by the time you retire. If your average annual income is $150,000 over the next 15 years, you can retire comfortably with $1,500,000 or $5,000 per month after taxes of total income including Investment Income + Social Security + Pension. Assumptions: 20% tax rate and 5% annual investment return in retirement. *Pension: $24k/year/0.05 return
Retirement Spend Goal (80% to 100% pre): Total Income of $6,000 per month after tax. (See page 7) Current Retirement Income Plan @60: Total Income of $6,200 per month after tax. (See page 7)
Investment Portfolio $850,000 (Current) Moderate Riskalyze score = 70 x 65% = 45 Pension Portfolio $480,000 (Future) Conservative Riskalyze score = 20 x 35% = 7 ------------------------------------------------------------------------------------------------------------------------------------------------ Total $1,330,000 Moderate-Conservative Riskalyze score = 52
Riskalyze survey in 2017 was 70 acceptable six-month risk: +24% (+$200,000) to -15% (-$125,000). Your current investment portfolio six-month risk is 70: +24% (+$200,000) to -15% (-$125,000).
Risk tolerance is the amount of price volatility (ST) and investment loss (LT) you are willing to withstand before changing your behavior. Risk comes in the form of market risk, security risk, financial risk, valuation risk, economic risk, currency risk, political risk, interest rate risk, inflation risk and liquidity risk. Most investors are not trained to know their risk tolerance. At market tops, most people will say their risk tolerance is high. At market bottoms, they will say they have no tolerance for risk. The longer your time horizon, the higher the risk you can take. Volatility is only a problem if you sell. There is long-term risk in not owning equities. Consider your need to take risk to reach your goals. How did you react in the past bear markets and corrections?
Achieving goals based on a long-term plan is more important than a benchmark beating returns each year. To participate in bull market gains, you must also endure the risk of corrections and bear markets. Without some risk, reward will likely by small.
• If you have a large pension, you may be able to take on more investment risk. • If your job earned income is very stable into your sixties, you may be able to take on more risk. • If the investment will be passed on to heirs, you may be able to take on their level of risk. • If you have no debt, you may be able to take on more risk. • The more you understand the markets, the more likely you will be comfortable with more risk.
Select a portfolio type based on your goals, risk tolerance and time horizon from the table below.

Wealth Building Guidelines Page 2 Career Income • Document your annual income estimating profit sharing and bonuses. • Select a career in a field that is in demand and pays well. • Increase your income by at least 5% annually by employing continued education, acquiring new skills,
hard work and developing strong interpersonal skills. • Seek out promotions into management to get bonus and stock option income.
Spending Plan • Document your monthly spend, create a budget and review it annually. What are your liquidity needs? • Prioritize saving over spending, plan savings first then adjust your budget for what you have left. • Live within your means with a modest home and car. Vacation homes and boats are not typically good
investments. Do not buy more house than you need. The house you live in is more of a liability than an asset. A large home mean high interest payments and high taxes, insurance, utilities and maintenance.
• Your home is not a good investment. Over long periods of time, homes grow near the inflation rate of 3% to 4%. A diversified mutual fund portfolio historically saw returns of 7% to 8%.
• Bag a lunch and only purchase insurance you need. Buy a car, maintain it and keep it at least 8 years, stay in your house at least 15 years before you move.
Saving Plan • Automate your savings to control your budget.
Automate your paycheck to be distributed to your 401(k), stock purchase plan, savings account and IRA account by taking money out before you see it setting up the self-discipline to save.
• Target saving 20% of your wages annually. • Your 401(k) should be your primary saving account for retirement.
You should be contributing as much as you can from each paycheck in bull and bear markets. Do not try to time the market or your returns will likely suffer from poor emotional decisions. Contribute enough to your 401(k) to get at least the full match. Invest profit sharing into your 401(k). Once you reach the IRS max in your 401(k), contribute to your Roth or IRA and last your taxable account. Invest extra money in your taxable account for a home, home improvement or a car.
• Use Health Savings Accounts. A Health Savings Account (HSA) is an employer sponsored health insurance saving plan that allows you to accumulate pre-tax money to be used to pay medical bills like co-payments and deductibles. Typically offered by plans with higher deductibles. Money going in is pre-tax, grows tax free and the money is not taxable on the way out if used for qualified health-care expenditures. There is no limit on the amount of unused HSA funds that can roll over one year to the next. There are no wage restrictions. Once you build up the account with enough cash to use for the year, the extra can be invested for long-term for the future. Flexible Spending Account (FSA) is an employer sponsored health insurance saving plan that allows you to accumulate pre-tax money to be used to pay medical bills like co-payments, deductibles and child-care. Typically offered with lower deductible plans. Money going in is pre-tax and the money is not taxable on the way out if used for qualified health-care expenditures. Limit is $2,500 per year. Can only roll $500 into next year. The investment return is 0%.
Debt Reduction Plan • Document your debt level. • Pay off high interest loans first. Pay off credit card balances each month. • Maintain a good credit rating to get lower interest loans.
Mortgage Debt (2016) $150,000 mortgage left, 30 year fixed, 25 years left, 4.0%, $1,000 per month $250,000 Zillow Home Estimate
Automotive Debt $20,000, 4 year, 2 years left, 2%, $400 per month

Wealth Building Mechanics Page 3
Below you can see how job income is invested pre-tax into 401 (k)’s and the rest after tax into your primary bank account for spending and investing in taxable and IRA accounts. The investment accounts show the custodian, manager, risk level, and annual savings amount and rate.
Merrill Lynch 401(k), David Fidelity 401(k), Deborah
PDM Design and Client Managed
Moderate Risk
Primary savings vehicle
+$18,000 per year with match +$18,000 per year with match
24% Savings rate
Scottrade Roth David Scottrade Roth Deborah
Client Design & Managed Moderate Risk
+$11,000 per year 7% Savings rate
Scottrade Rollover IRA David
PDM Design & Managed
Moderate Risk
+$0 per year 0% savings rate
Scottrade Taxable Joint
PDM Design & Managed
Moderate Risk
+$5,000 per year 3% savings rate
Joint Taxable Primary Bank Checking
Client Managed, Conservative Risk, Annual
+$100,000 take home income after taxes and 401 (k) - $80,000 spending ($6,500 per month) - $11,000 savings for Roth IRA contributions - $5,000 savings to Scottrade taxable account - $4,000 extra for major purchases
Job Income
$150,000

Investment Summary Page 4
• Merrill Lynch 401 (k), David PDM Investment Services design and client managed Moderate Risk (Base Allocation: 75% stocks / 25% bonds & cash) Contributions: 2016=$18,000, 2015= $15,000 Performance: See full-page report. $200,000 (December 2016)
• Fidelity 401 (k), Deborah PDM Investment Services design and client managed Moderate Risk (Base Allocation: 75% stocks / 25% bonds & cash) Contributions: 2016=$18,000, 2015= $15,000 Performance: See full-page report. $150,000 (December 2016)
• Scottrade Rollover IRA, David PDM Investment Services design and managed Moderate Risk (Base Allocation: 75% stocks / 25% bonds & cash) Contributions: 2016=$0, 2015= $0 Performance: See full-page report. $200,000 (December 2016)
• Scottrade Roth, David Client design and managed Moderate Risk (Base Allocation: 75% stocks / 25% bonds & cash) Contributions: 2016=$5,500, 2015= $5,500 Performance: 2016= 5%, 2015= -2%, 2014= 4%, 2013= 18% $30,000 (December 2016)
• Scottrade Roth, Deborah Client design and managed Moderate Risk (Base Allocation: 75% stocks / 25% bonds & cash) Contributions: 2016=$5,500, 2015= $5,500 Performance: 2016= 5%, 2015= -1%, 2014= 5%, 2013= 20% $40,000 (December 2016)
• Scottrade Taxable, Joint PDM Investment Services design and managed Moderate Risk (Base Allocation: 75% stocks / 25% bonds & cash) Contributions: 2016=$5,000, 2015= $5,000 Performance: See full-page report. $200,000 (December 2016)
• Bank of America, Taxable, Joint Client design and managed Conservative Risk (Base Allocation: 0% stocks/100% cash) $30,000 (December 2016)
2016: Fidelity Asset Manager 70% Moderate Risk Benchmark (FASGX) saw a 7.1% return. 2015: Morningstar Moderate Risk Benchmark saw a -1.8% return. 2014: Morningstar Moderate Risk Benchmark saw a 4.9% return. 2013: Morningstar Moderate Risk Benchmark saw a 14.3% return. 2012: Morningstar Moderate Risk Benchmark saw a 12.1% return. 2016: Fidelity Asset Manager 85% Moderate-Aggressive. Risk Benchmark (FAMRX) saw a 7.4% return. 2015: Morningstar Moderate-Aggressive Risk Benchmark saw a -2.3% return. 2014: Morningstar Moderate-Aggressive Risk Benchmark saw a 5.3% return. 2013: Morningstar Moderate-Aggressive Risk Benchmark saw a 17.8% return. 2012: Morningstar Moderate-Aggressive Risk Benchmark saw a 12.8% return.

Investment Action List Page 5
(Proposed - January 2017)
Career Income, Spending, Saving and Debt Reduction • Increase your income by at least 5% annually by employing continued education, acquiring new skills,
hard work and developing strong interpersonal skills. • Stick to your spending plan. Review your budget and spending for reductions annually. • Focus on reducing your debt to zero by age 60. Make double house payments. Use bonuses and the
periodic sale of stock purchase plan shares and stock options to pay down debt, for needed major purchases and to increase investment accounts.
Merrill Lynch 401 (k), David • Allocate mutual funds to the recommended allocation for the Contribution and the Balance. • Setup your contribution rate to save $18,000 per year.
The maximum contribution for 2017 is $18,000 under 50 years old, $24,000 over 50 years old plus match.
Fidelity 401 (k), Deborah • Allocate mutual funds to the recommended allocation for the Contribution and the Balance. • Setup your contribution rate to save $18,000 per year.
The maximum contribution for 2017 is $18,000 under 50 years old, $24,000 over 50 years old plus match.
Scottrade Rollover IRA, David • Contribute $0 per year.
The maximum contribution for 2017 is $5,500 for under 50 years old and $6,500 for over 50 years old.
Scottrade Roth IRA, David • Contribute $5,500 per year.
The maximum contribution for 2017 is $5,500 for under 50 years old and $6,500 for over 50 years old.
Scottrade Roth IRA, Deborah • Contribute $5,500 per year.
The maximum contribution for 2017 is $5,500 for under 50 years old and $6,500 for over 50 years old.
Scottrade Taxable, Joint • Setup an auto-investment plan to transfer $416 per month automatically from your primary bank checking
account to your Scottrade Joint Taxable account.
Bank of America Taxable, Joint • No actions
Education Savings Account • Start an ESA with Scottrade for each child and contribute $2,000 each year to each account.
Insurance Planning, Tax Planning and Estate Planning • Review your home, auto, health, life, disability, umbrella policy and long-term care insurance needs and
rates annually. • Make sure your accountant and investment advisor are working together. • Make sure you keep your Will and Revocable Living Trust updated with your estate planning attorney. • Setup your online account with Social Security (www.socialsecurity.gov) and verify your earnings are
recorded are correct. To correct earnings, gather your W2’s and call 800-772-1213.
Beneficiaries • Scottrade IRA account have your spouse as primary and children as contingent. • Scottrade taxable account is Joint so spouse is primary. To add contingent change to TOD or Trust. • Check other accounts for primary and contingent beneficiaries.

Investment Total Allocation Page 6
(Current)
Total Allocation Taxable/Tax Deferred
Asset Allocation
Risk Allocation Financial Advisor
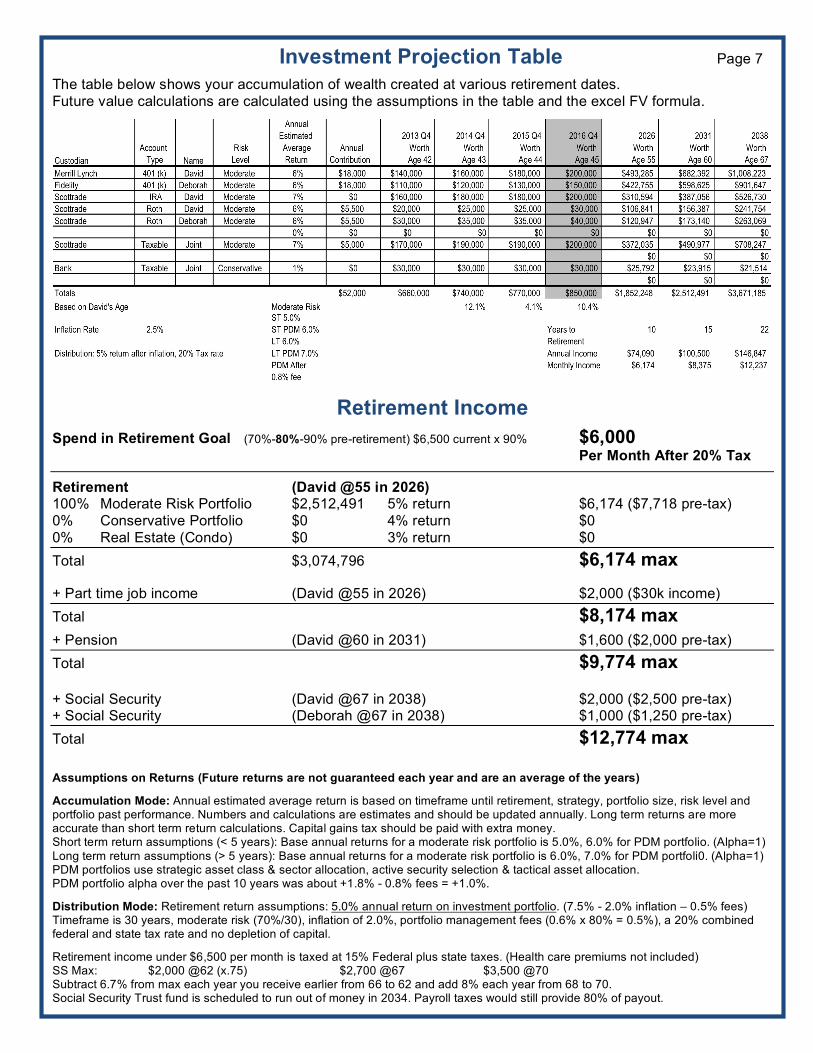
Investment Projection Table Page 7
The table below shows your accumulation of wealth created at various retirement dates. Future value calculations are calculated using the assumptions in the table and the excel FV formula.
Retirement Income
Spend in Retirement Goal (70%-80%-90% pre-retirement) $6,500 current x 90% $6,000 Per Month After 20% Tax
Retirement (David @55 in 2026) 100% Moderate Risk Portfolio $2,512,491 5% return $6,174 ($7,718 pre-tax) 0% Conservative Portfolio $0 4% return $0 0% Real Estate (Condo) $0 3% return $0 Total $3,074,796 $6,174 max + Part time job income (David @55 in 2026) $2,000 ($30k income) Total $8,174 max
+ Pension (David @60 in 2031) $1,600 ($2,000 pre-tax) Total $9,774 max
+ Social Security (David @67 in 2038) $2,000 ($2,500 pre-tax) + Social Security (Deborah @67 in 2038) $1,000 ($1,250 pre-tax) Total $12,774 max Assumptions on Returns (Future returns are not guaranteed each year and are an average of the years) Accumulation Mode: Annual estimated average return is based on timeframe until retirement, strategy, portfolio size, risk level and portfolio past performance. Numbers and calculations are estimates and should be updated annually. Long term returns are more accurate than short term return calculations. Capital gains tax should be paid with extra money. Short term return assumptions (< 5 years): Base annual returns for a moderate risk portfolio is 5.0%, 6.0% for PDM portfolio. (Alpha=1) Long term return assumptions (> 5 years): Base annual returns for a moderate risk portfolio is 6.0%, 7.0% for PDM portfoli0. (Alpha=1) PDM portfolios use strategic asset class & sector allocation, active security selection & tactical asset allocation. PDM portfolio alpha over the past 10 years was about +1.8% - 0.8% fees = +1.0%. Distribution Mode: Retirement return assumptions: 5.0% annual return on investment portfolio. (7.5% - 2.0% inflation – 0.5% fees) Timeframe is 30 years, moderate risk (70%/30), inflation of 2.0%, portfolio management fees (0.6% x 80% = 0.5%), a 20% combined federal and state tax rate and no depletion of capital. Retirement income under $6,500 per month is taxed at 15% Federal plus state taxes. (Health care premiums not included) SS Max: $2,000 @62 (x.75) $2,700 @67 $3,500 @70 Subtract 6.7% from max each year you receive earlier from 66 to 62 and add 8% each year from 68 to 70. Social Security Trust fund is scheduled to run out of money in 2034. Payroll taxes would still provide 80% of payout.
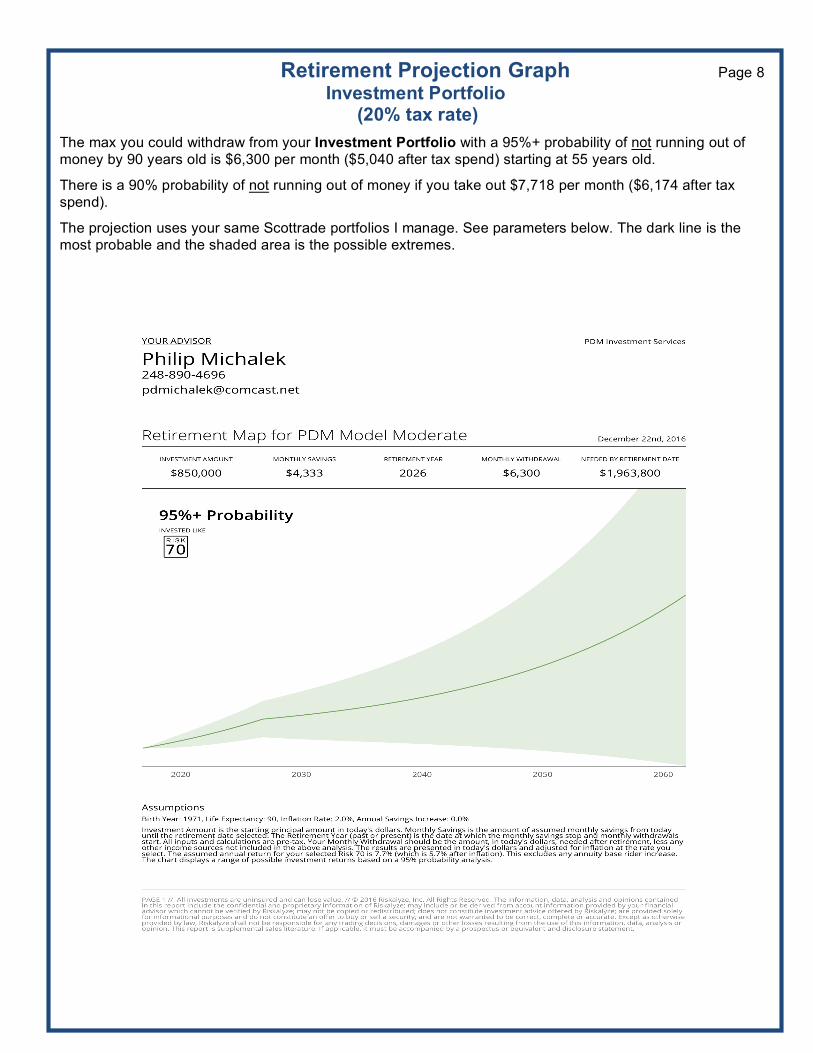
Retirement Projection Graph Page 8 Investment Portfolio (20% tax rate)
The max you could withdraw from your Investment Portfolio with a 95%+ probability of not running out of money by 90 years old is $6,300 per month ($5,040 after tax spend) starting at 55 years old.
There is a 90% probability of not running out of money if you take out $7,718 per month ($6,174 after tax spend).
The projection uses your same Scottrade portfolios I manage. See parameters below. The dark line is the most probable and the shaded area is the possible extremes.

Portfolio Allocation & Analysis Page 9 Merrill Lynch 401(k) David
(Proposed Portfolio - December 2016)
Goal: Retirement Risk Tolerance: Moderate (Current Allocation: 75% stocks / 25% bonds & cash) Time Horizon: 15 years Contributions: $18,000 2015= $15,000 Amount: $200,000 (December 2016)
Plan Fees Not disclosed
The portfolio is designed to meet your goals, risk tolerance and time horizon. Grades are derived from technical charts, fundamentals and other rating services. Funds listed below may be like funds and not exactly the ones in the plan. Change the allocation of the Contribution Elections and the Current Balance to the new allocation below. Leaders in Bold
TICKER ASSET CURRENT RECOMMENDED GRADE SYMBOL CLASS ALLOCATION ALLOCATION
JPMorgan Large Cap Growth (JPMJT) JLGMX LCG 11% 11% B Vanguard Equity Income Admiral VEIRX LCV 16% 16% A
PRIMECAP Odyssey Aggressive Growth POAGX MCG 7% 7% A JPMorgan Mid Value FLMVX MCV 11% 11% A
Vanguard Extended Market Index VIEIX SCG MCG 6% 6% B T. Rowe Price US Small Cap Value PRSVX? SCV 10% 10% B
American Funds Euro Pacific Growth R4 RERGX INT LCG 5% 5% B Templeton Inst. Foreign Small Cap TFSCX INT MCV 6% 6% B Invesco Developing Markets GTDIX INT EM MKT 3% 3% B
PIMCO Total Return (Y=3.4%, D=5yrs, Q=NR) PTTRX ITB 10% 10% B PIMCO Income Fund (Y=3.7%, D=3yrs, Q=NR) PIMIX MULTI BD 10% 10% B Vanguard Prime Money Market Fund VMRXX MONEY MKT 5% 5% B
Analysis The portfolio is moderate risk, diversified and has a fund quality of a B average grade. This portfolio has no sector funds and uses active mutual funds. Client implemented, no management fee. Performance is based on managed accounts with the recommended moderate risk allocation. See your year-end statements for your actual performance. 2014: Underperforming active managed funds and a divergent market hurt performance. 2015: Small Cap Value, Large Cap Value, International and High Yield Bonds hurt performance. 2016: Active managed funds and sector funds are underperforming hurting performance.
Asset Class Key LCG-Large Cap Growth, LCV-Large Cap Value, MCG-Mid Cap Growth, MCV-Mid Cap Value, SCG-Small Cap Growth, SCV-Small Cap Value, INT-International, INT EM MKT-International Emerging Market, INT BOND-International Bond, HY BOND-High Yield Bond, IT BOND-Intermediate Term Bond, ST BOND-Short Term Bond, MM-Money Market.

Portfolio Allocation & Analysis Page 10 Fidelity 401(k) Deborah
(Proposed Portfolio - December 2016)
Goal: Retirement Risk Tolerance: Moderate (Current Allocation: 75% stocks / 25% bonds & cash) Time Horizon: 15 years Contributions: $18,000 2015= $15,000 Amount: $150,000 (December 2016)
Plan Fees Not disclosed Self-Directed Option Schwab ($100 setup + $150 per year)
The portfolio is designed to meet your goals, risk tolerance and time horizon. Grades are derived from technical charts, fundamentals and other rating services. Funds listed below may be like funds and not exactly the ones in the plan. Change the allocation of the Contribution Elections and the Current Balance to the new allocation below.
TICKER ASSET CURRENT RECOMMENDED GRADE SYMBOL CLASS ALLOCATION ALLOCATION
Fidelity Contrafund FCNTX LCG 15% 15% B Columbia Diversified Equity Income ADECX LCV 10% 10% C Artisan Mid Cap Value ARTQX MCV 15% 15% A Neuberger Berman Genesis NBGIX M/SCG 10% 10% B Fidelity Low Priced Stock FLPSX M/SCV 15% 15% A Fidelity Diversified International FDIVX INT 15% 15% B PIMCO Total Return PTTAX ITB 15% 15% A Fidelity Cash Reserves MM 5% 5% X
Analysis The portfolio is moderate risk, diversified and has a fund quality of a B average grade. This portfolio has no sector funds and uses active mutual funds. Client implemented so no management fee. Performance is based on managed accounts with the recommended moderate risk allocation. See your year-end statements for your actual performance. 2014: Underperforming active managed funds and a divergent market hurt performance. 2015: Small Cap Value, Large Cap Value, International and High Yield Bonds hurt performance. 2016: Active managed funds and sector funds are underperforming hurting performance.
Asset Class Key LCG-Large Cap Growth, LCV-Large Cap Value, MCG-Mid Cap Growth, MCV-Mid Cap Value, SCG-Small Cap Growth, SCV-Small Cap Value, INT-International, INT EM MKT-International Emerging Market, INT BOND-International Bond, HY BOND-High Yield Bond, IT BOND-Intermediate Term Bond, ST BOND-Short Term Bond, MM-Money Market.

Portfolio Allocation & Analysis Page 11A Scottrade IRA, David
(Proposed Portfolio - December 2016)
Goal: Retirement Risk Tolerance: Moderate (Current Allocation: 75% stocks / 25% bonds & cash) Time Horizon: 15 years Contributions: $0 2015=0 Amount: $200,000 (December 2016)
The portfolio is designed to meet your goals, risk tolerance and time horizon. Grades are derived from technical charts, fundamentals and other rating services.
TICKER ASSET ALLOCATION GRADE SYMBOL CLASS
PRIMCAP Odyssey Growth POGRX LCG MCG 2% A Mairs & Power Growth MPGFX LCG LCV MCB 2% A Pamassus Endeavor PARWX LCG 2% A FMI Large Cap FMIHX LCG 1% B Vanguard Growth ETF VUG LCG 1% B
Oakmark Fund OAKMX LCV LCG 3% B Vanguard Equity Income VEIPX LCV LCB 3% A AMG Yacktman YACKX LCV LCB 2% A Vanguard Value ETF VTV LCV 2% B
Akre Focus AKREX MCG LCG 2% A Eventide Gilead ETGLX MCG 1% B Vanguard Mid Cap Growth ETF VOT MCG 2% B
Fidelity Low Priced Stock FLPSX MCV MCB INT 1% A Diamond Hill Small-Mid Cap DHMIX MCV SCG 3% A Vanguard Mid Cap Value ETF VOE MCV MCG 2% B
Valueline Small Cap Opportunities VLEOX SCG MCG 2% A Mairs & Power Small Cap MSCFX SCG SCV 4% A Vanguard Small Cap Growth ETF VBK SCG 0% B
Sterling Capital Stratten Small Cap Value STSCX SCV SCG MCG 4% B Homestead Small Company Stock HSCSX SCV SCG 2% A Vanguard Small Cap Value ETF VBR SCV 3% B
Oakmark International OAKIX INT LCV 2% A FMI International (USD Currency Hedge) FMIJX INT LCB 2% A Tweedy Brown Global Value (Currency Hedge) TBGVX INT GLOB LCV 1% A Oakmark International Small Cap OAKEX INT MCB 2% B Fidelity International Small Cap FISMX INT MCB SCV 1% B Matthews Pacific Tiger MAPTX ASIA 2% A Fidelity Pacific Basin FPBFX ASIA 2% B
Price Global Technology PRGTX TECH LCG 4% A Fidelity Select IT Servicers FBSOX TECH LCG 3% A
Price Financial PRISX FIN MCV SCV 2% B First Trust Financial AlphaDEX ETF FXO FIN MCV 5% A
Price Healthcare PRHSX HC LCG MCG 2% A Fidelity Select Health Care FSPHX HC LCG MCG 1% A
PIMCO High Yield Bond PHYDX HY BOND 4% B Fidelity Floating Rate High Income FFRHX BANK LOAN 4% B Merger Fund MERFX Merger Arbitrage 4% B Vanguard IT Investment Grade Bond ADM VFICX IT BOND 4% A Vanguard Short Term Corporate Bond ETF VCSH ST BOND 4% B Money Market MM 5% NA
See next page for analysis.

Portfolio Allocation & Analysis Page 11B
Scottrade IRA, David (Diversified Mutual Fund & Sector Portfolio - Moderate)
2011 2012 2013 2014 2015 2016
S&P 500 (PREIX) +1.9% 15.7% 32.0% 13.4% 1.1% 11.7% S&P 500 EW (RSP) -0.8% 17.2% 35.5% 14.1% -2.7% 14.5% WORLD MKT (VT) -7.5% 17.1% 23.0% 3.7% -1.9% 8.5% AGGRESSIVE BENCH -3.8% 13.4% 21.3% 5.7% -2.8% 7.4% CORRECTIONS (S&P500) -19% -11%, -8% -5% -5% -12% -16%, -5% PDM MODERATE -3.0% 14.5% 22.8% 5.2% -0.3% 7.0% MODERATE BENCHMARK 0.6% 12.1% 14.3% 4.9% -1.8% 7.1% ALPHA (Outperformance) -3.6% 2.4% 8.5% 0.3% 1.5% -0.1%
TACTICAL ASSET ALLOCATION (AVE EQUITY EXPOSURE) PDM MODERATE 76% 78% 80% 73% 75% 73%
STRATEGIC ASSET ALLOCATION ASSET C > S&P500 (12) 15% 75% 60% 50% 25% 50% SECTORS > S&P500 (4) 50% 100% 75% 75% 50% 50% VALUE > GROWTH (3) 33% 66% 66% 0% 66% 100% SMALL > LARGE (2) 0% 100% 100% 0% 0% 100% HY BOND > IT BOND (2) 50% 100% 100% 0% 0% 100%
EQUITY SELECTION ACTIVE > PASS (12) 15% 65% 85% 33% 75% 25% ]
ANALYSIS SCORE -4 +8 +8 -2 -1 +4

Portfolio Allocation & Analysis Page 11C
Scottrade IRA, David (Diversified Mutual Fund & Sector Portfolio - Moderate)
Traditional Portfolio Asset Allocation Strategy Typical asset allocation strategies invest mostly in Large Cap, International and Intermediate Term Corporate Bonds. There equity position and sector allocation positions stays consistent with their risk level thru the year. PDM Investment Strategy Our strategy has higher positions in Mid Cap, Small Cap, Technology, Financial, Healthcare, Asia and High Yield Bonds than traditional asset allocation strategies. We apply tactical asset allocation for risk management, strategic sector asset allocation through the year as conditions change and invest in mostly active managed funds. Our strategies perform best when more asset classes are outperforming the S&P 500, more sectors are outperforming the S&P 500, value is outperforming growth, small is outperforming large, high yield bond is outperforming intermediate term corporate bond and active is outperforming passive.
The data above is based on average performance of the active funds in each asset class in our newsletter mutual fund list at the end of each year to the benchmark ETF for each asset class. Each of the 12 asset classes contains an average of 4 active funds and 1 passive benchmark fund. Any number over 50% indicates the active funds added some value to the asset class or portfolio. See our Independent Performance Verification Report for full disclosure of performance calculations on the home page of our web site. 2016 Moderate Risk Portfolio, +7.0%. Alpha = +0.1% under benchmark before fees. Sum of +/- = +4 We saw a sharp 16% correction early in the year, 2 small corrections and volatility around the election. Market breadth was strong. RSP>SPY, NH>NL, A/D rising. +
Tactical Asset Allocation Average equity exposure for PDM moderate portfolio was 73%. +
Strategic Asset Allocation Our Asset Classes > S&P500 (12) LCV, MCV, SCV, EM, TECH, FIN. 50% 0 Our Sectors > S&P500 (4) TECH, FIN 50%. 0 Value > Growth (3) 100% + Small > Large (2) 100% + High Yield Bonds > Investment Grade IT Bond (2) 100% +
Equity Selection Active PDM Funds > Passive (12) LCG, SCG, INT. 25% -
Active Drag 2016 Strong outflows since 2014, high correlation/low dispersion, efficient market, low interest rate environment, less manager skill, 0.2% cash drag and 0.5% management drag. PDM Model Diversified Mutual Fund & Sector Portfolio Performance. (+7.0% before management fees) The model is a real cash account managed like portfolio management client portfolios. The model portfolio is moderate risk, large size and uses mostly active managed funds with sector funds. The 20 similar portfolios saw an average return of 7.8% ranging from 6.6% to 8.8% in 2016. Actual client portfolio performance may vary. See your Portfolio Analysis Summary Report for the details of your portfolio.

Portfolio Allocation & Analysis Page 11D
Scottrade IRA, David (Diversified Mutual Fund & Sector Portfolio - Moderate)
2015 Moderate Risk Portfolio, -0.3%. Alpha = +1.5% over benchmark before fees. Sum of +/- = -1 We saw a sharp 12% correction during the year. Market breadth was weak. RSP<SPY, NH<NL, A/D falling. –
Tactical Asset Allocation Average equity exposure for PDM moderate portfolio was 75%. +
Strategic Asset Allocation Our Asset Classes > S&P500 (12) LCG, TECH, HC. 25% - Our Sectors > S&P500 (4) TECH, HC 50%. 0 Value > Growth (3) 66% + Small > Large (2) 0% - High Yield Bonds > Investment Grade IT Bond (2) 0% -
Equity Selection Active PDM Funds > Passive (12) MCG, SCG, SCV, INT, EM, ASIA, TECH, FIN, HC. 75% + 2014 Moderate Risk Portfolio, 5.2%. Alpha = +0.3% over benchmark before fees. Sum of +/- = -2 We saw one small 5% correction during the year. Market breadth was flat. RSP=SPY, NH=NL, A/D topping. 0
Tactical Asset Allocation Average equity exposure for PDM moderate portfolio was 73%. +
Strategic Asset Allocation Our Asset Classes > S&P500 (12) LCG, MCG, MCV, TECH, FIN, HC. 50% 0 Our Sectors > S&P500 (4) TECH, FIN, HC 75%. + Value > Growth (3) 0% - Small > Large (2) 0% - High Yield Bonds > Investment Grade IT Bond (2) 0% -
Equity Selection Active PDM Funds > Passive (12) SCG, ASIA, TECH, HC. 33% -
From 2011 thru 2015 the Morningstar Moderate and Aggressive benchmarks were used. Starting in 2016 the Fidelity Asset Manager Fund 85% (FAMRX) is our aggressive risk benchmark and the Fidelity Asset Manager Fund 70% (FASGX) is our moderate risk benchmark.

Portfolio Allocation & Analysis Page 11E
Scottrade IRA Account, Joint (Diversified Mutual Fund & Sector Portfolio - Moderate)
2013 Moderate Risk Portfolio, 22.8%. Alpha = +8.5% over benchmark before fees. Sum of +/- = +8 The market saw one small 5% correction during the year. Market breadth was strong. RSP>SPY, NH>NL, A/D rising. +
Tactical Asset Allocation Average equity exposure for PDM moderate portfolio was 80%. +
Strategic Asset Allocation Our Asset Classes > S&P500 (12) LCG, MCV, SCG, SCV, TECH, FIN, HC. 60% + Our Sectors > S&P500 (4) TECH, FIN, HC 75%. + Value > Growth (3) 66% + Small > Large (2) 100% + High Yield Bonds > Investment Grade IT Bond (2) 100% +
Equity Selection Active PDM Funds > Passive (12) LCG, MCV, SCG, SCV, INT, EM, ASIA, TECH, FIN, HC. 85% + 2012 Moderate Risk Portfolio, 14.5%. Alpha = +2.4% over benchmark before fees. Sum of +/- = +8 The market saw an 11% and 8% correction during the year. Market breadth was strong. RSP>SPY, NH>NL, A/D rising. +
Tactical Asset Allocation Average equity exposure for PDM moderate portfolio was 78%. +
Strategic Asset Allocation Asset Classes > S&P500 (12) LCG, MCV, SCG, SCV, INT, ASIA, TECH, FIN, HC. 75% + Our Sectors > S&P500 (4) TECH, FIN, HC, ASIA 100%. + Our Value > Growth (3) 66% + Small > Large (2) 100% + High Yield Bonds > Investment Grade IT Bond (2) 100% +
Equity Selection Active PDM Funds > Passive (12) LCV, MCV, INT, EM, ASIA, TECH, FIN, HC. 65% + 2011 Moderate Risk Portfolio, -3.0%. Alpha = -3.6% over benchmark before fees. Sum of +/- = -4 The market saw a sharp 19% correction during the year. Market breadth was weak. RSP<SPY, NH<NL, A/D flat. –
Tactical Asset Allocation Average equity exposure for PDM moderate portfolio was 76%. +
Strategic Asset Allocation Our Asset Classes > S&P500 (12) TECH, HC. 15% - Our Sectors > S&P500 (4) TECH, HC 50%. 0 Value > Growth (3) 33% - Small > Large (2) 0% - High Yield Bonds = Investment Grade IT Bond (2) 50% 0
Equity Selection Active PDM Funds > Passive (12). LCG, HC, 15% - Active is more likely to outperform in years of low active fund outflows, high dispersion*/low correlation between stocks, less efficient markets, high volatility (investor behavior inefficiencies), early in the economic cycle, in down markets, rising interest rate environment (small cap) and in markets where value (high PE market) and small cap are leading.

Portfolio Allocation & Analysis Page 12A Scottrade Taxable, Joint
(Proposed Portfolio - December 2016)
Goal: Retirement Risk Tolerance: Moderate (Current Allocation: 75% stocks / 25% bonds & cash) Time Horizon: 15 years Contributions: $5,000 2015= $5,000 Amount: $200,000 (December 2016)
The portfolio is designed to meet your goals, risk tolerance and time horizon. Grades are derived from technical charts, fundamentals and other rating services.
TICKER ASSET ALLOCATION GRADE SYMBOL CLASS
PRIMCAP Odyssey Growth POGRX LCG MCG 2% A Mairs & Power Growth MPGFX LCG LCV MCB 2% A Pamassus Endeavor PARWX LCG 2% A FMI Large Cap FMIHX LCG 1% B Vanguard Growth ETF VUG LCG 1% B
Oakmark Fund OAKMX LCV LCG 3% B Vanguard Equity Income VEIPX LCV LCB 3% A AMG Yacktman YACKX LCV LCB 2% A Vanguard Value ETF VTV LCV 2% B
Akre Focus AKREX MCG LCG 2% A Eventide Gilead ETGLX MCG 1% B Vanguard Mid Cap Growth ETF VOT MCG 2% B
Fidelity Low Priced Stock FLPSX MCV MCB INT 1% A Diamond Hill Small-Mid Cap DHMIX MCV SCG 3% A Vanguard Mid Cap Value ETF VOE MCV MCG 2% B
Valueline Small Cap Opportunities VLEOX SCG MCG 2% A Mairs & Power Small Cap MSCFX SCG SCV 4% A Vanguard Small Cap Growth ETF VBK SCG 0% B
Sterling Capital Stratten Small Cap Value STSCX SCV SCG MCG 4% B Homestead Small Company Stock HSCSX SCV SCG 2% A Vanguard Small Cap Value ETF VBR SCV 3% B
Oakmark International OAKIX INT LCV 2% A FMI International (USD Currency Hedge) FMIJX INT LCB 2% A Tweedy Brown Global Value (Currency Hedge) TBGVX INT GLOB LCV 1% A Oakmark International Small Cap OAKEX INT MCB 2% B Fidelity International Small Cap FISMX INT MCB SCV 1% B Matthews Pacific Tiger MAPTX ASIA 2% A Fidelity Pacific Basin FPBFX ASIA 2% B
Price Global Technology PRGTX TECH LCG 4% A Fidelity Select IT Servicers FBSOX TECH LCG 3% A
Price Financial PRISX FIN MCV SCV 2% B First Trust Financial AlphaDEX ETF FXO FIN MCV 5% A
Price Healthcare PRHSX HC LCG MCG 2% A Fidelity Select Health Care FSPHX HC LCG MCG 1% A
PIMCO High Yield Bond PHYDX HY BOND 4% B Fidelity Floating Rate High Income FFRHX BANK LOAN 4% B Merger Fund MERFX Merger Arbitrage 4% B Vanguard IT Investment Grade Bond ADM VFICX IT BOND 4% A Vanguard Short Term Corporate Bond ETF VCSH ST BOND 4% B Money Market MM 5% NA
See next page for analysis.

Portfolio Allocation & Analysis Page 12B Scottrade Taxable, Joint
(Proposed Portfolio - December 2016)
The portfolio is moderate risk, diversified and has a fund quality of a B+ average grade. The cash came into the portfolio December 2012. This portfolio is large size, has sector funds and uses mostly active managed mutual funds. Performance does not include the 0.7% (0.7% x 12/12) annual management fee of $1,500 in 2016.
2011: Analysis Score -4 Positives: None Negatives: Asset classes, value, small cap and active managed funds are underperforming. Positives: None
2012: Analysis Score +8 Positives: Asset classes, sectors, value, small cap, high yield bonds and active managed funds are outperforming. Negatives: None
2013: Analysis Score +8 Positives: Asset classes, sectors, value, small cap, high yield bonds and active managed funds are outperforming. Negatives: None
2014: Analysis Score -2 Positives: Sectors are outperforming. Negatives: Value, small cap, high yield bonds and active managed funds are underperforming.
2015: Analysis Score -1 Positives: Value, and active managed funds are outperforming. Negatives: Asset classes, small cap, and high yield bonds are underperforming.
2016: Analysis Score +4. Positives: Value, small cap and high yield bonds are outperforming. Negatives: Active managed funds are underperforming especially our Asia, technology and healthcare active funds. Larger portfolios typically outperform smaller ones due to added diversification. Larger Portfolios with sector funds typically outperform smaller ones without sectors.

Accumulated Gains Page 13
PDM Investment Services Portfolios
Scottrade Taxable
Scottrade David’s IRA
Totals
2011 -$3,800 -$3,800 -$7,600
2012 $13,379 $13,379 $26,758
2013 $24,063 $24,063 $48,126
2014 $5,871 $5,871 $11,742
2015 -$1,532 -$1,532 -$3,064
2016
2017
Totals $37,981 $37,981 $75,962
Calculations are from year end portfolio summary reports. Gains are calculated after portfolio management fees of 0.8% are deducted. Gains do not include contributions or withdrawals.
Scottrade
Scottrade
Totals
2011
2012
2013
2014
2015
2016
2017
Totals
Calculations are from year end portfolio summary reports. Gains are calculated after portfolio management fees of 0.8% are deducted. Gains do not include contributions or withdrawals.

Mutual Fund Research Example
PRIMECAP Odyssey Growth Fund (POGRX)
Strategy
• The PRIMECAP Odyssey Growth Fund is in the Large Cap Growth asset class. • Joel Fried has been manager since 2004 and has over $1,000,000 of his own money in the fund.
He has an MBA degree. The fund is tax efficient and has a high sustainability rating by Morningstar. • Management looks for companies that have grown rapidly in the past and have good potential to
continue the growth but that have become temporarily cheap for some reason. Stocks are sold when the company or the economic environment has shifted significantly or for valuation reasons. They tend to have more-pronounced sector bets. Technology, financial and healthcare had above benchmark ratings in the fund in 2016.
• The turnover rate is low at 9%. • The fund has a low expense ratio of 0.65%. • The fund size is small at $7 billion in assets under management.
Performance
• The fund outperformed its category by 4% annually in the past 3 years, by 3% in the past 5 years and by 2% in the past 10 years.
Source: www.morningstar.com Performance Consistency
• The fund has outperformed its category in 80% of the years between 2005 and 2016. Risk & Reward
• The fund volatility and variation is the same as its category. • The risk-adjusted return is 20% higher than its category risk-adjusted return. • The maximum downdraft was 34% in 2008, less than the S&P 500 loss of 37%. • The up/down capture ratio is positive at 1.1.
Valuation
• The fund valuation is lower than its category. Summary
• This fund is strong with an A overall rating, making it one of the best funds in its category. • The fund is OPEN to new investors with a $2,000 minimum for taxable accounts and $1,000 for IRAs. • The fund is no-load but carries a transaction fee through Scottrade and Schwab.

Retirement Preparation
Old Linear Retirement: School, work, retirement at 62 with pension and death at 75 years old. New Cyclical Retirement: School, work, semi-retirement at 55 with no pension, school/lifelong learning, 20 year second career part time, full-retirement at 75 and death at 85 to 110. Part time work will be required to support living longer. Most people spend more awake time with their co-workers than their families. They have connections, relationships and friendships tied to their job. Some of these friendships will persist, but many will fade away.
Retirees who engage in hobbies, clubs, part-time jobs, volunteer work and join organizations are happier, healthier and more youthful. These activities help fill the social void from your job. When you retire early, you have to do something to keep your brain active or you will likely end up depressed.
When you retire early, you have to do something to keep your brain active or you will likely end up depressed. Start planning at least 5 years before you retire for a part-time second career. See if you can turn a hobby or something you are passionate about into a second career.
To prepare for retirement you should engage in retirement activities before you retire. Some of these activities could lead to a small business or a part time job for fun. Taking a class or getting a certification can be helpful. See the list of ideas below. Some common second career ideas are gardening, investment advisor, cooking, web designer, home repair, dog breeding, internet product trading and consulting.
College Decisions Parents and students should consider the following variables for career and college decisions: Job demand in the career. Expected salaries. College costs. Student loan debt limits. Calculation of return-on-investment.
Other Professional Services Career Counselor How is your career going and do you have any concerns? A Career Counselor and Financial Planner can help align work, interests and lifestyles while staying on a healthy financial track. How much money do I need to quit my crappy job? How do I figure out a better way? It is a good idea to put a portion of your savings in a taxable account to be used for lifetime learning and cushion transition periods between jobs and careers. Phasing in a retirement schedule is often the best method to get to full retirement. Part time work will extend the life of your investment portfolio, offer job satisfaction and social interaction. Career financial assets are an important part of a financial plan.
Insurance Planning Purchase insurance you really need. Ask yourself the what if question? Do not mix investing and insurance. Review home, auto, health, life, disability, umbrella and long-term care insurance needs and rates annually.
Tax Planning Make sure your accountant and investment advisor are working together. Accountant Recommendation: Tammy Moncrief, Yeo & Yeo, 691 N. Squirrel Road, Suite 100, Auburn Hills, MI 48326, 248-239-0900 [email protected]
Estate Planning Review your tax-deferred account beneficiary’s each time accounts change and at least every 10 years. Make sure you keep your Will and Revocable Living Trust updated. A revocable living trust can help you avoid estate taxes and probate, define who receives your assets, distribute your assets to your children in predefined amounts over time, assign a guardian to your minor children, appoint a trustee to handle your estate and distribute the assets, avoid settlement costs, define financial and durable power of attorney and a patient advocate. A Will directs your assets through probate the way you want them. We can work together with an estate attorney. Estate Planning Attorney Recommendation: Michael Witzke, McDonald Hopkins, LLC, 39533 Woodward Ave, Suite 318, Bloomfield Hills, MI 48304, 248-646-5070, 248-593-2948 direct [email protected]
Investment Education Investment education is important so you understand your investments and strategies so you can better support your wealth plan. Sources of investor education are: Focused Growth Investor Newsletter, Investor Education Report, Investment Books, Wall Street Journal and Barron’s.

Activity Calendar
January Research, NL, Trading Invoice, Portfolio Analysis Summary Compliance Investor Education Capital Gains Performance February Research, NL, Trading IRA Contribution March Research, NL, Trading April Research, NL, Trading Invoice, Portfolio Analysis Summary May Research, NL, Trading Wealth Plan
RMD June Research, NL, Trading July Research, NL, Trading Invoice, Portfolio Analysis Summary Investor Education August Research, NL, Trading September Research, NL, Trading October Research, NL, Trading Invoice, Portfolio Analysis Summary November Research, NL, Trading Communication December Research, NL, Trading Key Research Monthly Compile ratings on the market, sectors and stocks for asset allocation
and equity selection NL Monthly Write and send the Focused Growth Investor Newsletter Trading Monthly Review all portfolios for asset allocation and equity selection and trades Invoice Quarterly Send Invoice email for your review Analysis Summary Quarterly Send Portfolio Analysis Summary Report Communication Six-month Phone call to each client 6 months after their wealth plan review Investor Education Six-month Post updated Investor Education Series to our web site RMD Annual Send Required Minimum Distribution paperwork to retirees over 70
with IRA’s IRA Contribution Annual Send reminder to make IRA Contributions Jabil 401(k) Design Annual Send Jabil 401 (k) allocation for Jabil employees clients Compliance Annual Send of updated ADV2, Business Summary and Disclosure, Privacy
Policy and Fee Schedule Wealth Plan Annual Send Wealth Plan data request, design, send and review meeting Capital Gains Annual Send Capital Gains reports for clients with taxable accounts Performance Annual Post model moderate portfolio performance with verification to web site Other periodic sends Investor Education Emails Market updates for corrections and increased volatility Advisor Agreement Updates is fees change

Benchmarks
The chart below shows our client household projected Investment Net Worth at 60 years old and the number of clients at each level. The average client age was 48 years old in 2015. The numbers are based on average projection calculations in 2015 with 12 years to retirement. Does not include retired clients drawing income. See our wealth plan for projection calculation details. The table displays the monthly income at each level based on a 5% annual return and a 20% tax rate. The average client is projected to have $1,500,000 of investment net worth at 60 years old. Data from 35 households was averaged and linearized. Outlier data points were not used in calculations. The net worth does not include social security. The lines are you with and without your future annuity/pension. Pension Calculation: $5,000/month before taxes x 12 months = $24,000/year / 0.05 return = $480,000 @ 60 years old.
Investment Net Worth Projection at Age 60
Annual Income, Spending & Saving Benchmark
The chart below shows our client household annual spending and saving at various income levels in 2015. Annual income is based on an average 10-year annualized income at 48 years old. Spending and savings is based on client averages in 2015. Each household is in a different situation with different variables. Some of the variables include the number of dependents, age, college expenses and debt service levels. The dots are you in the accumulation mode before retirement.
Annual Income (Before Tax)
.

Benchmarks
Investment Net Worth at Different Age Levels
The chart below shows our client current 2015 Investment Net Worth at different ages. Data was averaged, linearized and outlier data points were not used in calculations. The net worth does not include social security. The dots are you with and without your future annuity/pension.
Client Age
Your Investment Projections Over Time
The chart below shows your Investment Net Worth and your projection at age 60 each of the year’s projections were calculated. The net worth does not include social security and pension worth.
Projections Falling slightly each year. Planned Contributions Slightly less than expected. Market Performance Coming in as expected. (6.0% average)
YEAR PLANNED
CONTRIBUTION BENCHMARK
PERFORMANCE (Moderate Risk)
INVESTMENT WORTH @60
2012 x 12.1% $2,600,000 2013 $40,000 14.3% $2,600,000 2014 $40,000 4.9% $2,500,000 2015 $45,000 -1.8% $2,500,000 2016 $50,000 6.7% (Q1-Q3) $2,500,000 2017 $52,000

PDM Investment Services
Our mission is to create and support a simple wealth plan to help our clients build wealth to achieve early retirement. We conduct objective research and provide honest unbiased advice.
Our passion is educating clients and our youth on wealth building and investing.
Our goal is to produce strong and consistent performance using the time-tested investment strategies.
Our priorities are putting our client’s interest first, wealth building, conducting investment research to enhance our strategies, providing investment education, and last our company profits.
PDM Investment Services Process
Wealth Plan Development
Investment Goals & Risk Tolerance Wealth Building Guidelines
(Income, Spending, Saving, Investing & Debt Service) Investment Summary
Investment and Income Projections Portfolio Allocation & Analysis
Benchmarking
Portfolio Design & Implementation
Setup Brokerage Accounts Portfolio Design, Allocation & Analysis
Portfolio Implementation
Portfolio Management
Active Portfolio Management Portfolio Performance and Analysis Reports (Quarterly)
Investor Education (Focused Growth Investor)
Gather Client Information
Define Goals & Risk Tolerance Income, Spending, Saving, Debt, Investments
Account Statements

Client past Concerns, Fears, Needs and Wants
• High fees, no simple fee disclosure document Our fees are at the low end of the spectrum for the services we offer. Our Advisor Agreement discloses all fees on one page.
• Lack of advisor activity Did activity from your previous advisor end once your account was established? We actively manage your portfolio reviewing investments and allocation on a monthly basis.
• Poor service and poor communication Did your previous advisor return calls within 24 hours? Our clients receive timely service, quarterly reports, a monthly newsletter and annual reviews.
• Poor performance Does your advisor claim to be successful at market timing and beating the market consistently? Market timing is impossible to do consistently and beating the market is very difficult. Our strategies aim to outperform their benchmarks over time. We employ time-proven asset allocation and security selection strategies.
• No quarterly performance reports We send a simple 1-page report quarterly listing YTD returns, fees, holdings and asset allocation.
• No wealth plan offered Does your advisor review your whole financial picture to get a better understanding of your needs? Do they just sell you products and manage a portfolio? All portfolio management clients receive a wealth plan that is updated and reviewed with the client annually.
• Firm pushes advisor to sell products client does not want We are independent with no incentive to push high fee products. As a RIA, a client’s best interest and suitable investments are required by law. We own the same products we recommend to our clients.
• Fear of large losses Does your advisor try to talk you out of bad moves with sound advice, or just let you act with your emotions and sell at market bottoms? We will provide you with sound advice to help control your emotions? World events like terrorist attacks, wars and other black swans are unpredictable. We are in the fourth secular bear market in the past 100 years. Secular bear markets clean up excess and lead to new secular bull markets. What are your options?
1. Listen to the media and sit in fear for the rest of your life in bank accounts, money markets and CD’s with a -1% after inflation annual return. There is always something to worry about in the world.
2. Try to time the world markets. Most individual investors buy high when times are good and sell low when times are bad. They underperform the market by about 6% annually seeing a -1% after inflation annual return.
3. Invest in a mix of bond funds with a 2% after inflation annual return.
4. Invest in a moderate risk equity-bond portfolio with a 5% after inflation annual return.
5. Our Long-Term Timing Model may help avoid some bear market losses. We will help guide you through the market peaks and bear markets to sell when times are good and buy when times are bad. If we miss getting out selling at the top, we still have the opportunity of investing our 20% cash and bond cushion at the bottom to improve returns.
Why Work with Us?
• We Put Our Client’s Interests First PDM Investment Services is a Registered Investment Advisor with a fiduciary responsibility to put its client’s interests first. We focus on problem solving, not sales. We act with skill, care, diligence and good professional judgment. We will not mislead you and avoid conflicts of interest. If you are not happy with your financial advisor due to poor performance, high fees, poor service or lack of trust, it is time to change advisors.
• Customer Service & Integrity We strive to serve our clients with the highest standards of ethics, integrity and professionalism. We focus on your needs, offering different levels of service to meet individual needs and budget.
• Independent Advice We are an independent firm, not linked financially with any bank, insurance company or brokerage firm. Since we are independent, we are not pressured into pushing high cost commission products like loaded mutual funds and annuities. Our income is derived from only portfolio management fees.
• Investor Education We focus on educating our clients and our youth so they can make better investment decisions.
• Open Architecture & Transparency Our open architecture allows us to purchase the best stocks and mutual funds, without limitations. Your investments are held with a discount broker as custodian for transparency and low cost.
• Management Owns the Products Recommended to Clients President, Philip Michalek, invests his own personal money in the portfolios he recommends.
We put our clients interest first, investing our client’s money in the same investments we invest in our own portfolios. Performance is monitored and verified by an independent party.
• Liquidity We do not invest in illiquid investments like limited partnerships, penny stocks and hedge funds.
• Low Cost Structure We invest in low cost strategies using a discount broker as custodian, purchasing no-load mutual funds with low transaction fees and paying reasonable portfolio management fees.
• Investment Strategy 1. Our Long-Term Market Indicator sets up the stock market exposure for our portfolios around there define base risk level. We attempt to reduce stock market exposure during periods of high risk and recessions and raise exposure during periods of low risk. We also use other top timing models to confirm our model signals.
2. Our Strategic Asset Class & Sector Allocation Model sets up the percent of cash allocated to each asset class and sector in a portfolio.
3. Our Mutual Fund Selection Model rates each active managed mutual fund and passive managed exchange traded fund. Portfolios are designed and managed using higher rated funds and market leaders.
• Simple Portfolio Performance Reports Each quarter you receive a simple portfolio performance report that contains market analysis, portfolio performance & analysis, investments, asset allocation, cash movements and management fees. Our model portfolio performance is reported and verified annually by an independent party.
• Different Product Levels to Meet Your Individual Needs and Budget Do-It-Yourself Investor Support. (Investor Education, Focused Growth Investor Newsletter) Wealth Building Plans with Portfolio Management Services.
• Advantages of Working with a Small RIA (NAAIM 2016) More satisfying experience, greater responsiveness, more personal level of attention, work with founding manager, portfolio models for smaller accounts, client-centric service model and avoid large company scandals.
• We Actually Manage the Portfolios We Recommend, Not Outsource Them

Investment Advisor Process Finding Meeting
• General information about goals, risk tolerance, time horizon, expected returns, income, spending, savings, investing and debt.
• Your experience with investing, asset management and investment advisors. • Your concerns, needs, wants and fears about investing. • Review current investments and brokerage statements.
(Custodian, advisor, amount, type, investment strategy and performance) • Review our services, strategy and portfolio types.
Wealth Plan & Proposal Review Meeting • Review wealth plan, accounts and action plans. • Review strategy and proposed portfolio asset allocations and holdings.
Custodian Account Setup • Fill out Scottrade Brokerage Account Applications for each new account. • Fill out Scottrade Trade Authorization Form if you have a Scottrade Retail account. • Fill out Scottrade Account Transfer Forms and gather latest brokerage statement. • For cash deposits make check out to Scottrade FBO/Your Name. • We will take forms, brokerage statements and check to Scottrade to open your accounts and process
transfers. Clients can go to the local branch to deposit checks once account is open. • For 401 (k) Rollovers: Call the 401 (k) Custodian Retirement Team. (Phone number on statement)
Ask them liquidate the 401(k) for a direct rollover. (They may require a form) Have them make the check payable to Scottrade FBO/Your Name. Having them mail the check to you is easiest. To wire the funds has more forms and fees. When the check comes in the mail, deposit the check at your Scottrade branch in Rochester. Deposit into your Scottrade Rollover IRA (xxxx 8629).
Sign Investment Advisory Agreement • Sign Investment Advisory Agreement and send to PDM Investment Services.
On-Line Account Setup • In about a week you will receive a letter from Scottrade with directions to create your login to view
your account. The temporary password will expire, so you may have to call Scottrade at 877-726-8741 to walk you through the process.
• If you want to view the account sooner, call Scottrade at 877-726-8741 and they will guide you through the process with a starter login and password.
• For retail and 401(k) accounts, communicate login and password to PDM Investment Services.
Portfolio Design & Implementation • PDM Investment Services will design and implement your portfolio per your investment plan. • Purchases will be made all at once or over a period of time, depending on market conditions.
Billing Process • At the end of each quarter you will receive an invoice for the portfolio management fee. Review the
fee calculation. You have 7 days to dispute the fee calculation before the fee is transferred out of your account and into our fee holding account.
Portfolio Monitor & Reports • Your portfolio will be monitored for asset allocation and holdings. (Monthly) • Brokerage statements will be sent to you by the custodian. (At least quarterly, monthly if activity)
For paperless, login to your account and select paperless. You will receive email notifications. • Portfolio Report with holdings, inflows/outflows, asset allocation, fees and performance. (Quarterly) • Wealth Plan update and Review Meeting in person or conference call. (Annually) • Capital Gains Tax Summary for taxable accounts. (Annually)
Portfolio Management Free Services • Focused Growth Investor Newsletter - Stock & Mutual Fund Letter. (Monthly) • Wealth plans with 401 (k) designs and stock option management • Special Reports - Investor Education and access to other special reports on our web site. • Stock and Mutual Fund Reports. (See website for latest reports)

Client Information
Below is a list of information needed to complete a Wealth Plan. Name and age of each family member House address, email address and phone numbers Occupation and place of work for adult family members Target age for retirement Your risk tolerance level Annual career income itemizing bonuses and stock option incentives Monthly take home pay after taxes and 401(k) contribution Current monthly spend excluding large purchases Mortgage debt (Current debt amount, term, # years left, interest rate, monthly payment, estimated home value) Estimated Social Security payment at 68 year’s old Pension Year start withdrawal Estimated monthly payout Brokerage Account #1 Account type (401k, IRA, Roth, Taxable) Name on account Last statement Annual contribution Portfolio designer Portfolio manager Brokerage Account #2 Account type (401k, IRA, Roth, Taxable) Name on account Last statement Annual contribution Portfolio designer Portfolio manager Brokerage Account #3 Account type (401k, IRA, Roth, Taxable) Name on account Last statement Annual contribution Portfolio designer Portfolio manager Bank Account Cash Amount Other Investments Real Estate other than home you live in