webcast 4q09
TRANSCRIPT
1
RESULTS ANNOUCEMENT
4th Quarter and Fiscal Year 2009 (Brazilian Corporate Law)
Conference Call / Webcast
José Sergio Gabrielli de AzevedoCEO
March, 24th 2010
2
DISCLAIMER
The presentation may contain forecasts about
future events. Such forecasts merely reflect the
expectations of the Company's management.
Such terms as "anticipate", "believe", "expect",
"forecast", "intend", "plan", "project", "seek",
"should", along with similar or analogous
expressions, are used to identify such forecasts.
These predictions evidently involve risks and
uncertainties, whether foreseen or not by the
Company. Therefore, the future results of
operations may differ from current expectations,
and readers must not base their expectations
exclusively on the information presented herein.
The Company is not obliged to update the
presentation/such forecasts in light of new
information or future developments.
The United States Securities and Exchange
Commission permits oil and gas companies, in
their filings with the SEC, to disclose only proved
reserves that a company has demonstrated by
actual production or conclusive formation tests to
be economically and legally producible under
existing economic and operating conditions. We
use certain terms in this presentation, such as oil
and gas resources, that the SEC’s guidelines
strictly prohibit us from including in filings with the
SEC.
CAUTIONARY STATEMENT FOR
US INVESTORS
11.969 12.056
2.124 2.113
Oil & NGL Natural Gas
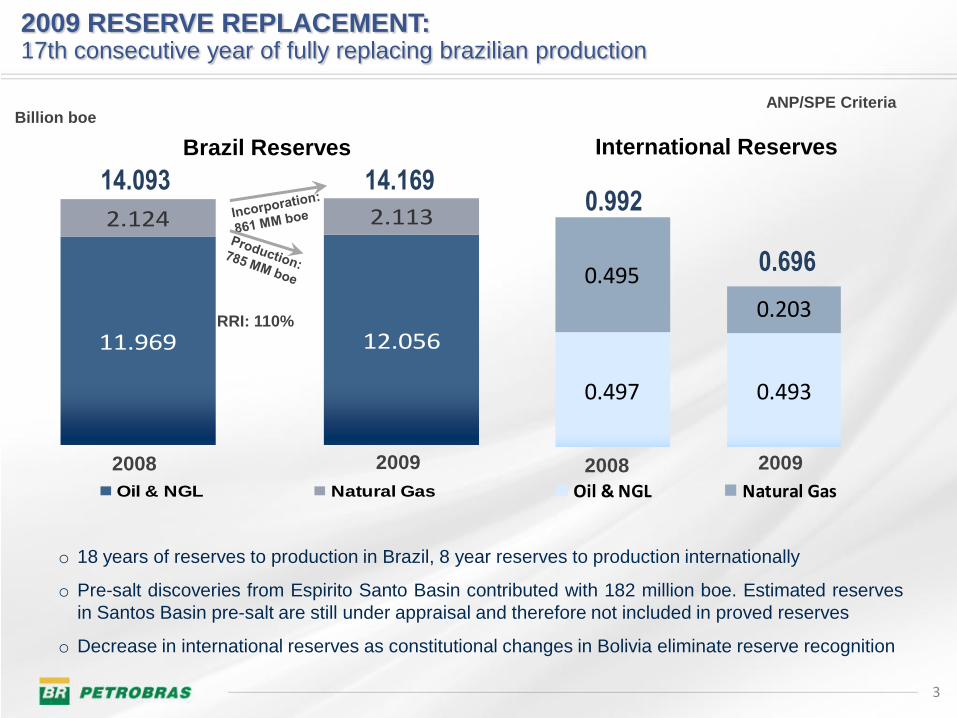
International ReservesBrazil Reserves
2008 2009
Billion boe
o 18 years of reserves to production in Brazil, 8 year reserves to production internationally
o Pre-salt discoveries from Espirito Santo Basin contributed with 182 million boe. Estimated reserves
in Santos Basin pre-salt are still under appraisal and therefore not included in proved reserves
o Decrease in international reserves as constitutional changes in Bolivia eliminate reserve recognition
2009 RESERVE REPLACEMENT:17th consecutive year of fully replacing brazilian production
14.093 14.169
0.497 0.493
0.495
0.203
Oil & NGL Natural Gas
0.992
0.696
2008 2009
RRI: 110%
3
ANP/SPE Criteria
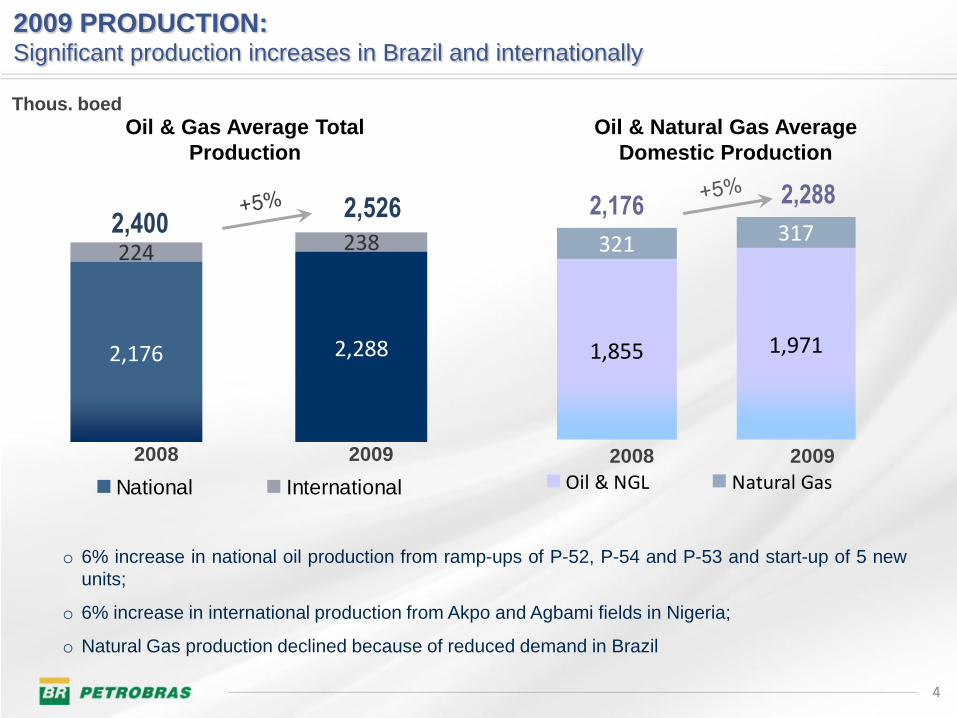
224 238
2,2882,176
National International
321 317
1,9711,855
Oil & NGL Natural Gas
PRODUÇÃO SEGUE TRAJETÓRIA SUSTENTADA DE CRESCIMENTO
Oil & Gas Average Total
Production
2008 2009
Thous. boed
2008
2009 PRODUCTION:Significant production increases in Brazil and internationally
2,4002,526
2009
2,176 2,288
o 6% increase in national oil production from ramp-ups of P-52, P-54 and P-53 and start-up of 5 new
units;
o 6% increase in international production from Akpo and Agbami fields in Nigeria;
o Natural Gas production declined because of reduced demand in Brazil
Oil & Natural Gas Average
Domestic Production
4
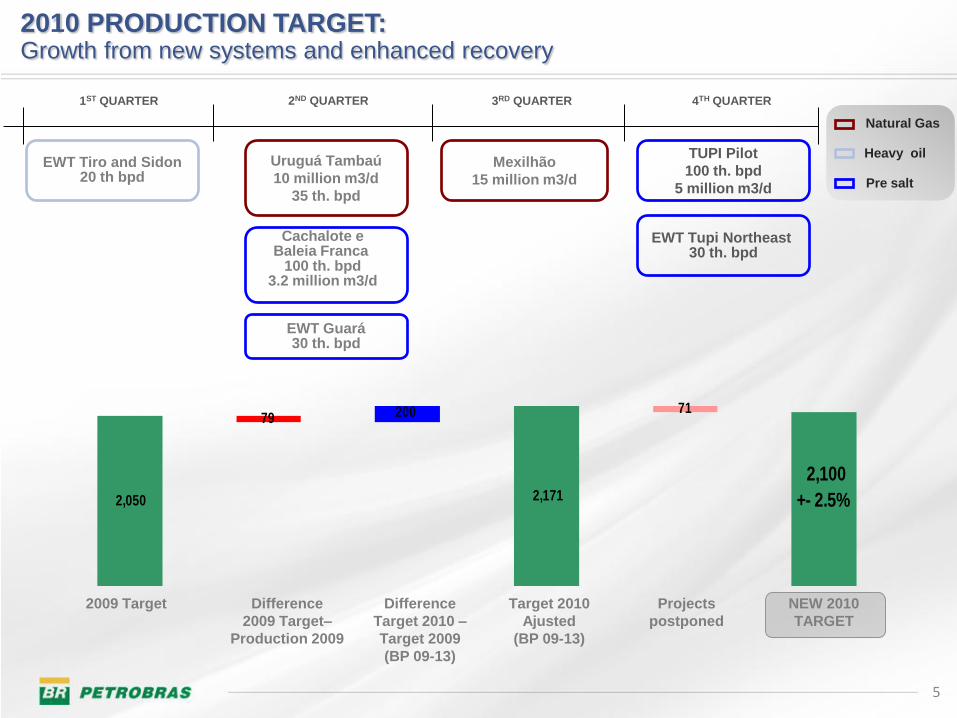
PRODUÇÃO 2010
Pre salt
Natural Gas
Heavy oil
1ST QUARTER 2ND QUARTER 3RD QUARTER 4TH QUARTER
Cachalote eBaleia Franca
100 th. bpd3.2 million m3/d
EWT Tiro and Sidon20 th bpd
Uruguá Tambaú
10 million m3/d
35 th. bpd
Mexilhão
15 million m3/d
TUPI Pilot
100 th. bpd
5 million m3/d
EWT Guará30 th. bpd
EWT Tupi Northeast 30 th. bpd
7971
2,050
2,100
+- 2.5% 2,171
200
2009 Target Difference
2009 Target–
Production 2009
Target 2010
Ajusted
(BP 09-13)
Difference
Target 2010 –
Target 2009
(BP 09-13)
Projects
postponed
NEW 2010
TARGET
2010 PRODUCTION TARGET: Growth from new systems and enhanced recovery
5
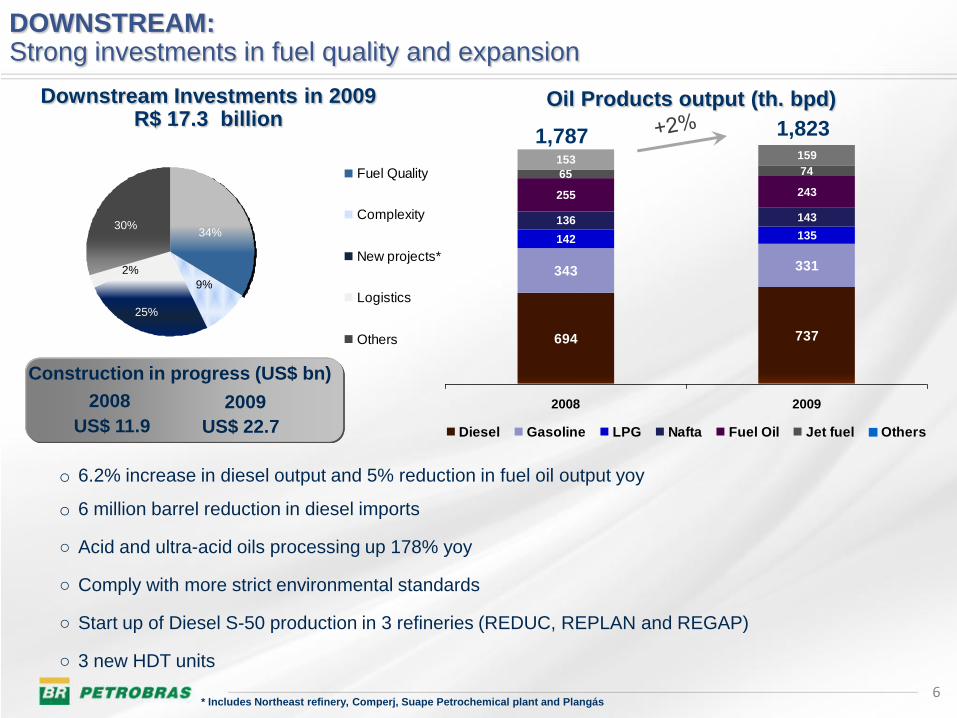
DOWNSTREAM: Strong investments in fuel quality and expansion
9%
2%
34%
25%
30%
Fuel Quality
Complexity
New projects*
Logistics
Others
o 6.2% increase in diesel output and 5% reduction in fuel oil output yoy
o 6 million barrel reduction in diesel imports
○ Acid and ultra-acid oils processing up 178% yoy
○ Comply with more strict environmental standards
○ Start up of Diesel S-50 production in 3 refineries (REDUC, REPLAN and REGAP)
○ 3 new HDT units
Downstream Investments in 2009 R$ 17.3 billion
* Includes Northeast refinery, Comperj, Suape Petrochemical plant and Plangás
Construction in progress (US$ bn)
2008 2009
US$ 11.9 US$ 22.7
694 737
343 331
142 135
136 143
255 243
65 74153 159
2008 2009
Diesel Gasoline LPG Nafta Fuel Oil Jet fuel Others
Oil Products output (th. bpd)
1,787 1,823
6
7
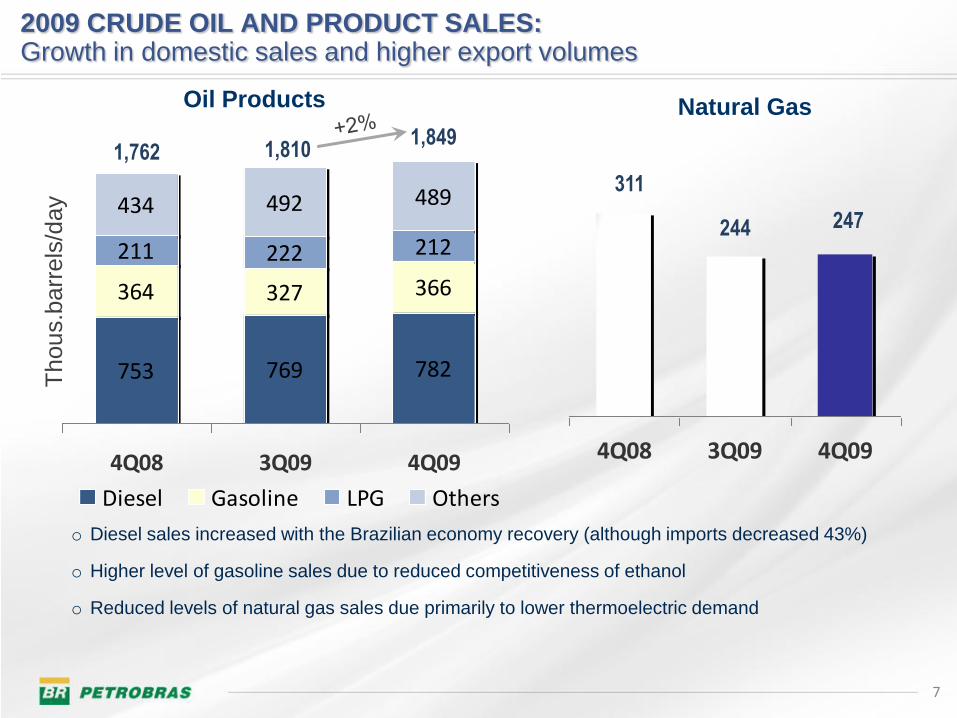
753 769 782
364 327 366
211 222 212
434 492 489
4Q08 3Q09 4Q09
Diesel Gasoline LPG Others
Oil Products
o Diesel sales increased with the Brazilian economy recovery (although imports decreased 43%)
o Higher level of gasoline sales due to reduced competitiveness of ethanol
o Reduced levels of natural gas sales due primarily to lower thermoelectric demand
4Q08 3Q09 4Q09
Natural Gas
244 247
311
2009 CRUDE OIL AND PRODUCT SALES:Growth in domestic sales and higher export volumes
Thous.b
arr
els
/day
1,762 1,8101,849
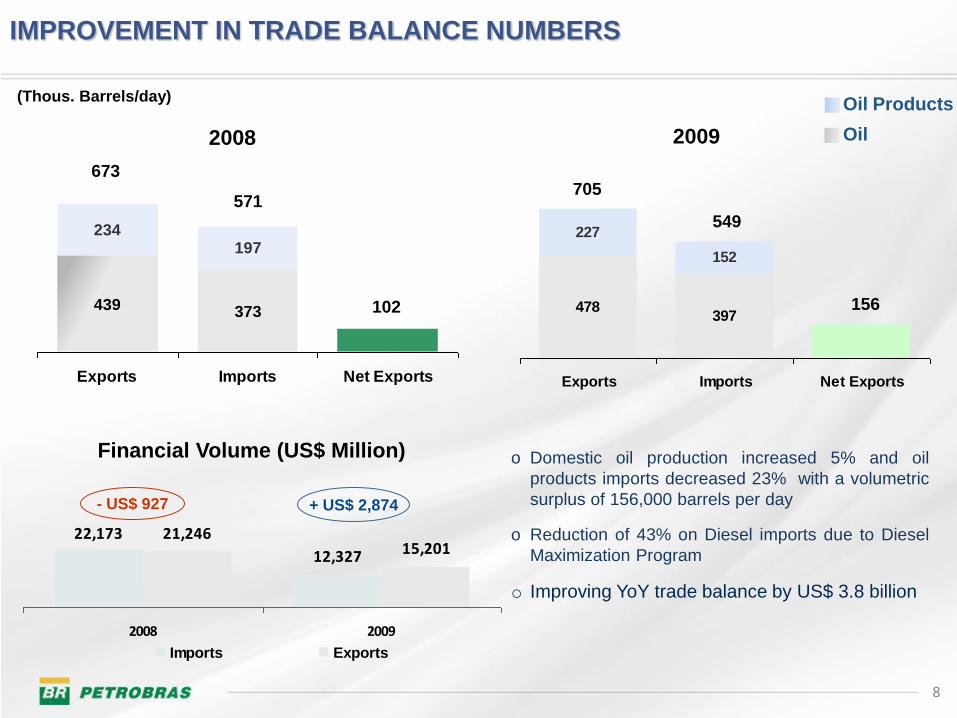
2009
478397
227
152
Exports Imports Net Exports
2008
234197
439 373
Exports Imports Net Exports
571
673
102 156
549
705
IMPROVEMENT IN TRADE BALANCE NUMBERS
(Thous. Barrels/day)
Oil
Oil Products
o Domestic oil production increased 5% and oil
products imports decreased 23% with a volumetric
surplus of 156,000 barrels per day
o Reduction of 43% on Diesel imports due to Diesel
Maximization Program
o Improving YoY trade balance by US$ 3.8 billion
12,327
22,17315,201
21,246
2008 2009
Imports Exports
+ US$ 2,874- US$ 927
Financial Volume (US$ Million)
8
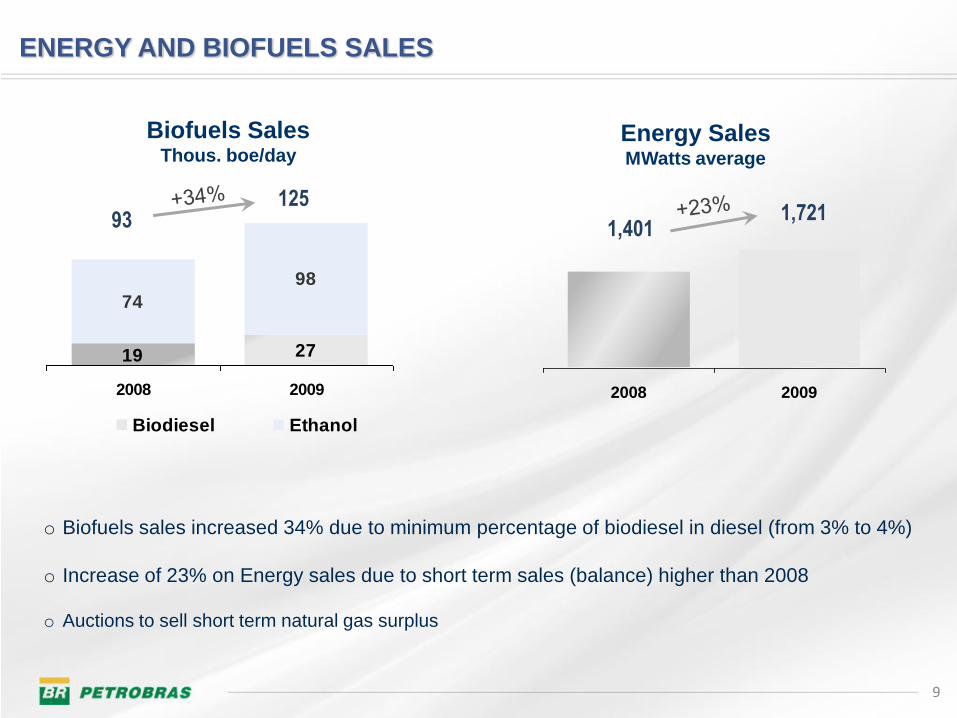
ENERGY AND BIOFUELS SALES
o Biofuels sales increased 34% due to minimum percentage of biodiesel in diesel (from 3% to 4%)
o Increase of 23% on Energy sales due to short term sales (balance) higher than 2008
o Auctions to sell short term natural gas surplus
74
98
19 27
2008 2009
Biodiesel Ethanol
Biofuels SalesThous. boe/day
93125
2008 2009
Energy Sales MWatts average
1,4011,721
9
10
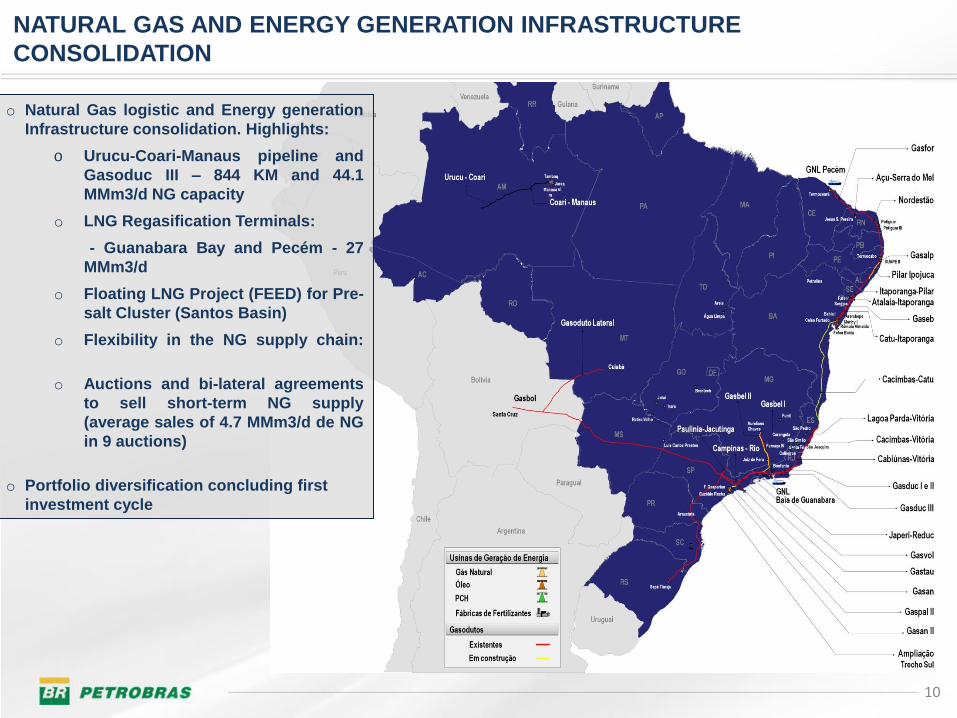
NATURAL GAS AND ENERGY GENERATION INFRASTRUCTURE
CONSOLIDATION
o Natural Gas logistic and Energy generation
Infrastructure consolidation. Highlights:
o Urucu-Coari-Manaus pipeline and
Gasoduc III – 844 KM and 44.1
MMm3/d NG capacity
o LNG Regasification Terminals:
- Guanabara Bay and Pecém - 27
MMm3/d
o Floating LNG Project (FEED) for Pre-
salt Cluster (Santos Basin)
o Flexibility in the NG supply chain:
o Auctions and bi-lateral agreements
to sell short-term NG supply
(average sales of 4.7 MMm3/d de NG
in 9 auctions)
o Portfolio diversification concluding first
investment cycle
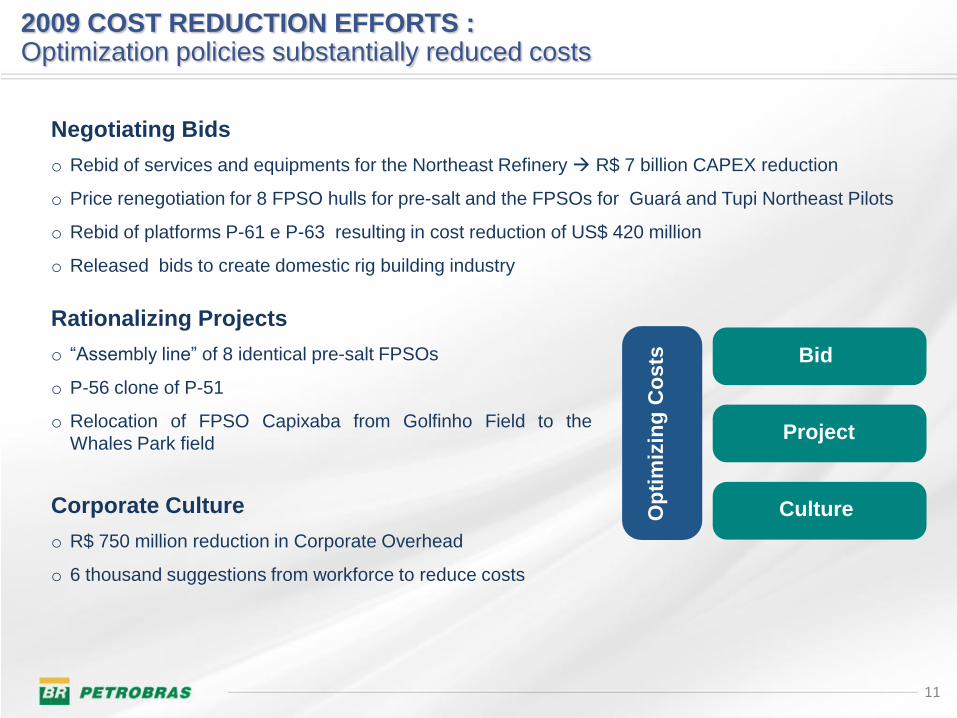
2009 COST REDUCTION EFFORTS : Optimization policies substantially reduced costs
Negotiating Bids
o Rebid of services and equipments for the Northeast Refinery R$ 7 billion CAPEX reduction
o Price renegotiation for 8 FPSO hulls for pre-salt and the FPSOs for Guará and Tupi Northeast Pilots
o Rebid of platforms P-61 e P-63 resulting in cost reduction of US$ 420 million
o Released bids to create domestic rig building industry
Op
tim
izin
g C
osts Bid
Project
Culture
Rationalizing Projects
o “Assembly line” of 8 identical pre-salt FPSOs
o P-56 clone of P-51
o Relocation of FPSO Capixaba from Golfinho Field to the
Whales Park field
Corporate Culture
o R$ 750 million reduction in Corporate Overhead
o 6 thousand suggestions from workforce to reduce costs
11
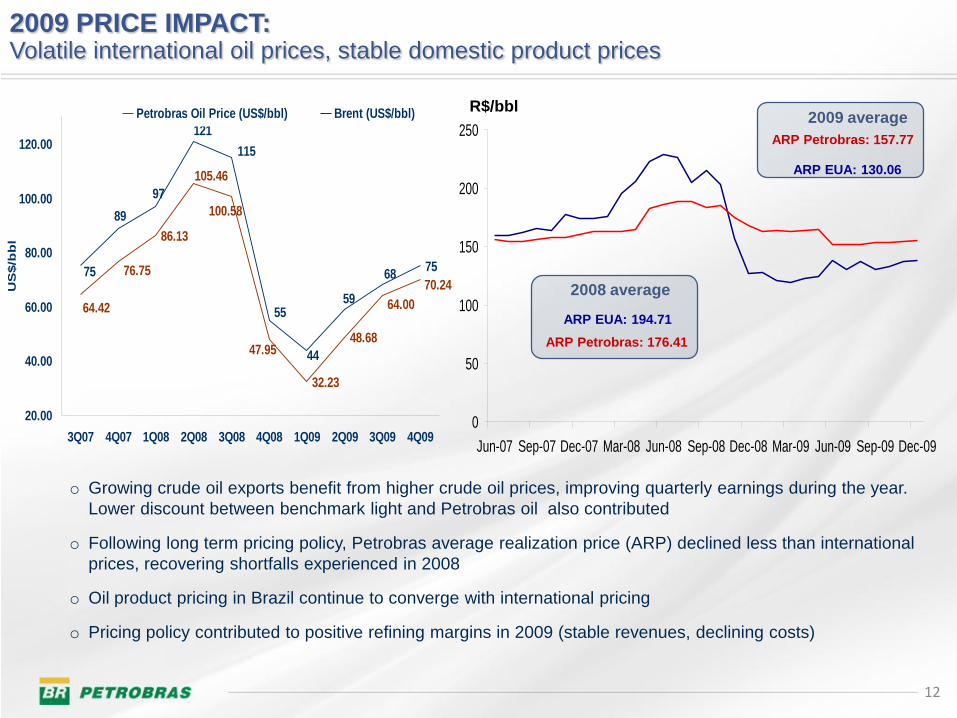
12
R$/bbl
ARP EUA: 194.71
ARP Petrobras: 176.41
2008 average
ARP EUA: 130.06
ARP Petrobras: 157.77
2009 average
o Growing crude oil exports benefit from higher crude oil prices, improving quarterly earnings during the year.
Lower discount between benchmark light and Petrobras oil also contributed
o Following long term pricing policy, Petrobras average realization price (ARP) declined less than international
prices, recovering shortfalls experienced in 2008
o Oil product pricing in Brazil continue to converge with international pricing
o Pricing policy contributed to positive refining margins in 2009 (stable revenues, declining costs)
2009 PRICE IMPACT:Volatile international oil prices, stable domestic product prices
0
50
100
150
200
250
Jun-07 Sep-07 Dec-07 Mar-08 Jun-08 Sep-08 Dec-08 Mar-09 Jun-09 Sep-09 Dec-09
86.13
32.23
48.68
7576.75
64.42
105.46
100.58
47.95
64.00
70.24
115
121
97
89
75
55
44
59
68
20.00
40.00
60.00
80.00
100.00
120.00
3Q07 4Q07 1Q08 2Q08 3Q08 4Q08 1Q09 2Q09 3Q09 4Q09
US
$/b
bl
Petrobras Oil Price (US$/bbl) Brent (US$/bbl)
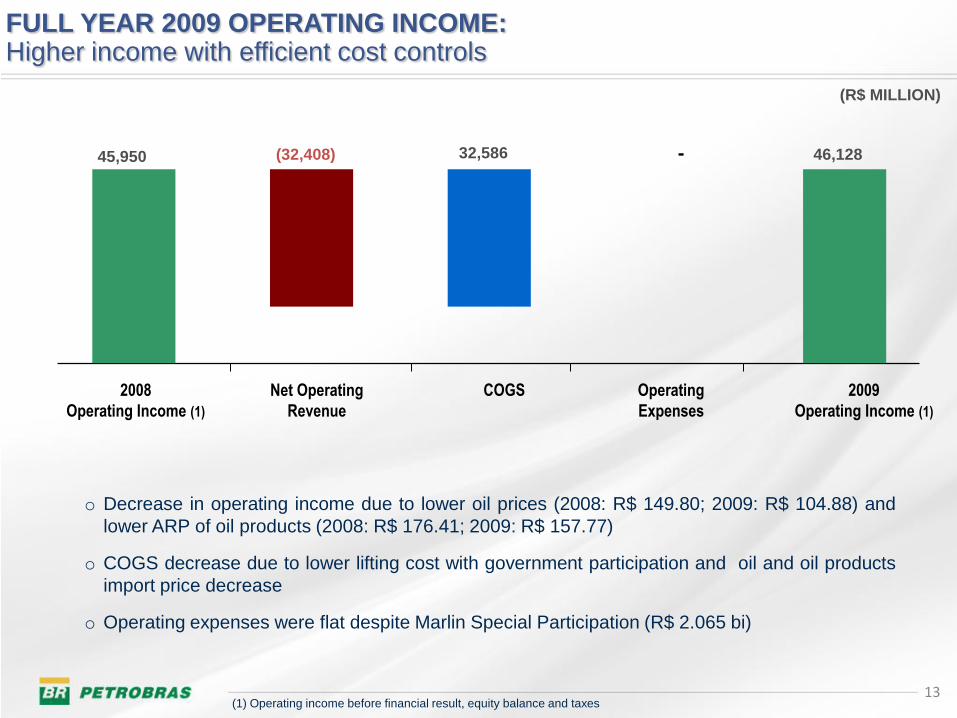
(R$ MILLION)
45,950 (32,408) 32,586 - 46,128
2008
Operating Income (1)
Net Operating
Revenue
COGS Operating
Expenses
2009
Operating Income (1)
13(1) Operating income before financial result, equity balance and taxes
o Decrease in operating income due to lower oil prices (2008: R$ 149.80; 2009: R$ 104.88) and
lower ARP of oil products (2008: R$ 176.41; 2009: R$ 157.77)
o COGS decrease due to lower lifting cost with government participation and oil and oil products
import price decrease
o Operating expenses were flat despite Marlin Special Participation (R$ 2.065 bi)
FULL YEAR 2009 OPERATING INCOME:Higher income with efficient cost controls
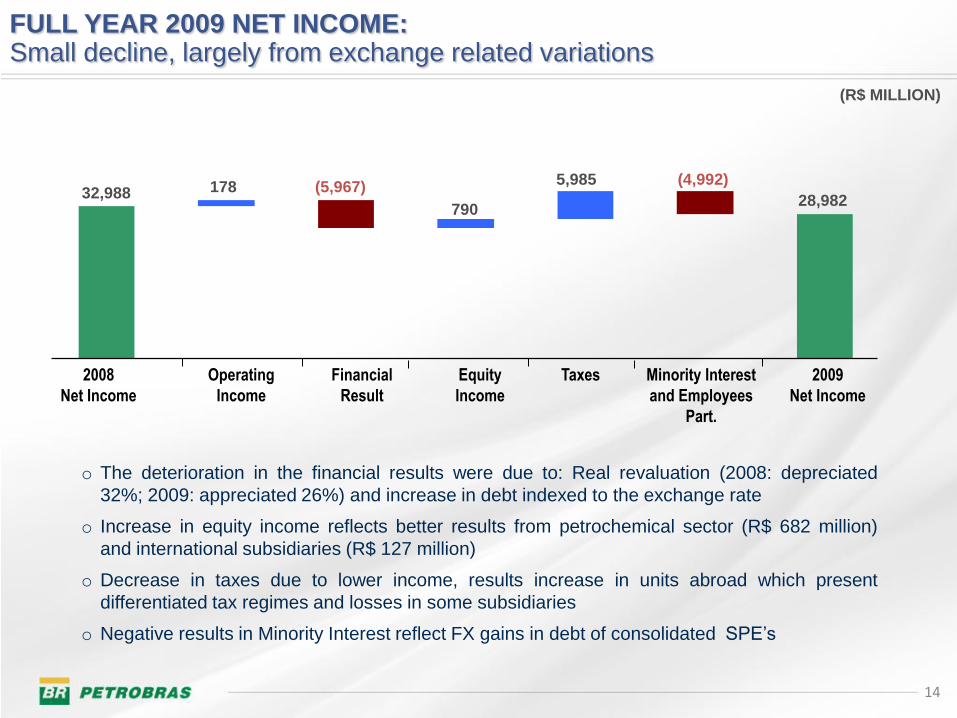
(R$ MILLION)
2009
Net Income
32,988 178 (5,967)28,982
5,985
790
(4,992)
o The deterioration in the financial results were due to: Real revaluation (2008: depreciated
32%; 2009: appreciated 26%) and increase in debt indexed to the exchange rate
o Increase in equity income reflects better results from petrochemical sector (R$ 682 million)
and international subsidiaries (R$ 127 million)
o Decrease in taxes due to lower income, results increase in units abroad which present
differentiated tax regimes and losses in some subsidiaries
o Negative results in Minority Interest reflect FX gains in debt of consolidated SPE’s
2008
Net Income
Taxes Minority Interest
and Employees
Part.
Financial
Result
Equity
Income
Operating
Income
14
FULL YEAR 2009 NET INCOME:Small decline, largely from exchange related variations
15
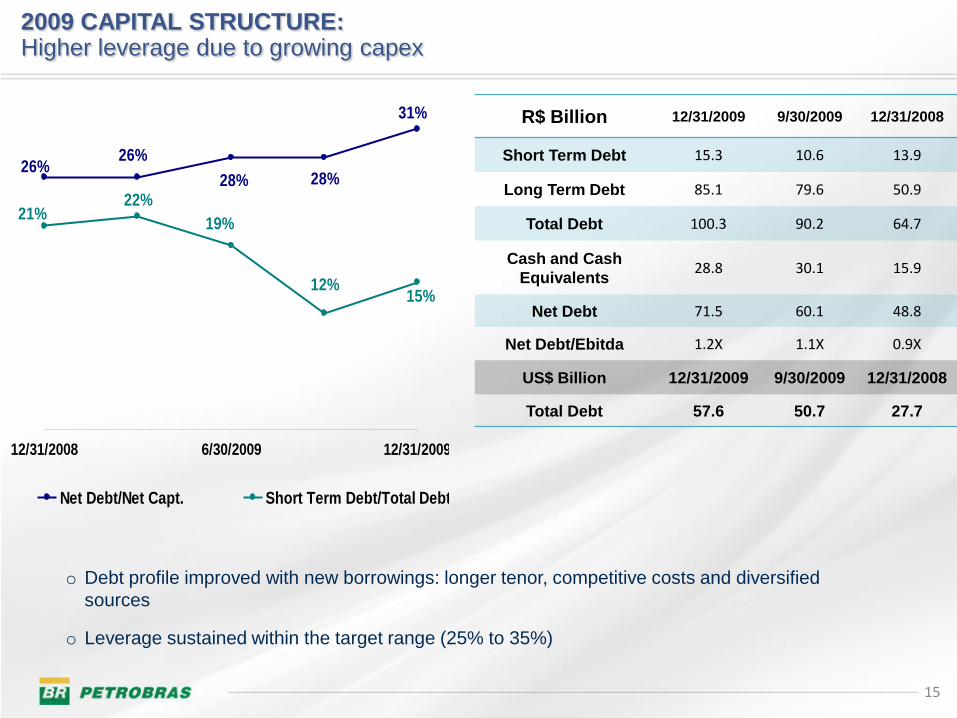
o Debt profile improved with new borrowings: longer tenor, competitive costs and diversified
sources
o Leverage sustained within the target range (25% to 35%)
R$ Billion 12/31/2009 9/30/2009 12/31/2008
Short Term Debt 15.3 10.6 13.9
Long Term Debt 85.1 79.6 50.9
Total Debt 100.3 90.2 64.7
Cash and Cash
Equivalents28.8 30.1 15.9
Net Debt 71.5 60.1 48.8
Net Debt/Ebitda 1.2X 1.1X 0.9X
US$ Billion 12/31/2009 9/30/2009 12/31/2008
Total Debt 57.6 50.7 27.7
28%28%26%
26%
31%
15%12%
19%
22%21%
12/31/2008 6/30/2009 12/31/2009
Net Debt/Net Capt. Short Term Debt/Total Debt
2009 CAPITAL STRUCTURE:Higher leverage due to growing capex
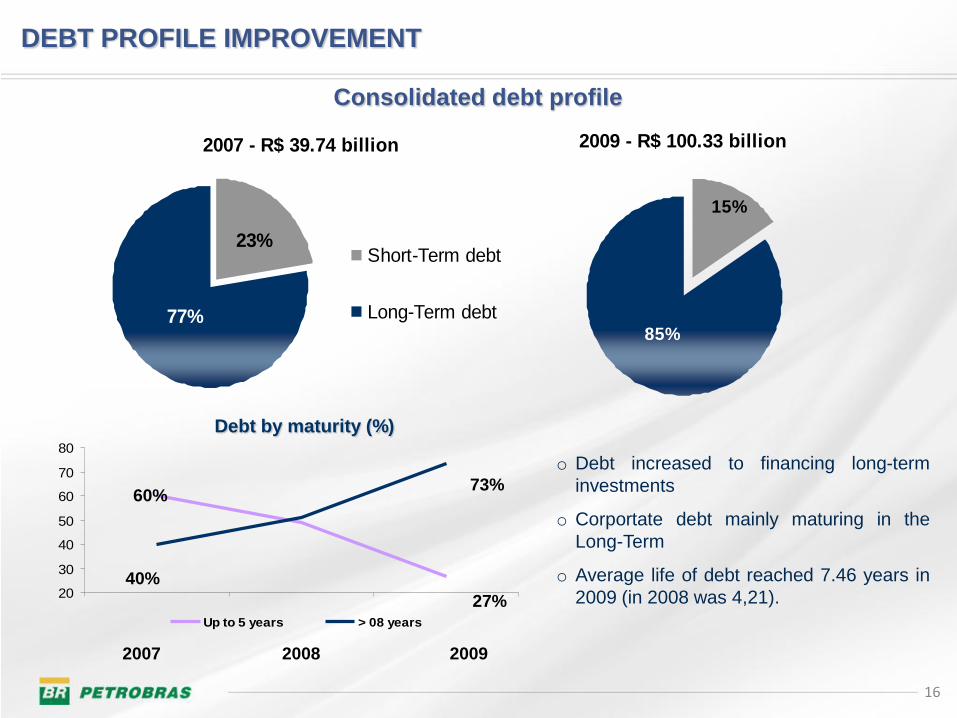
DEBT PROFILE IMPROVEMENT
20
30
40
50
60
70
80
Up to 5 years > 08 years
2007 2008 2009
60%73%
27%
40%
Consolidated debt profile
Debt by maturity (%)
o Debt increased to financing long-term
investments
o Corportate debt mainly maturing in the
Long-Term
o Average life of debt reached 7.46 years in
2009 (in 2008 was 4,21).
2007 - R$ 39.74 billion
23%
77%
Short-Term debt
Long-Term debt
2009 - R$ 100.33 billion
15%
85%
16
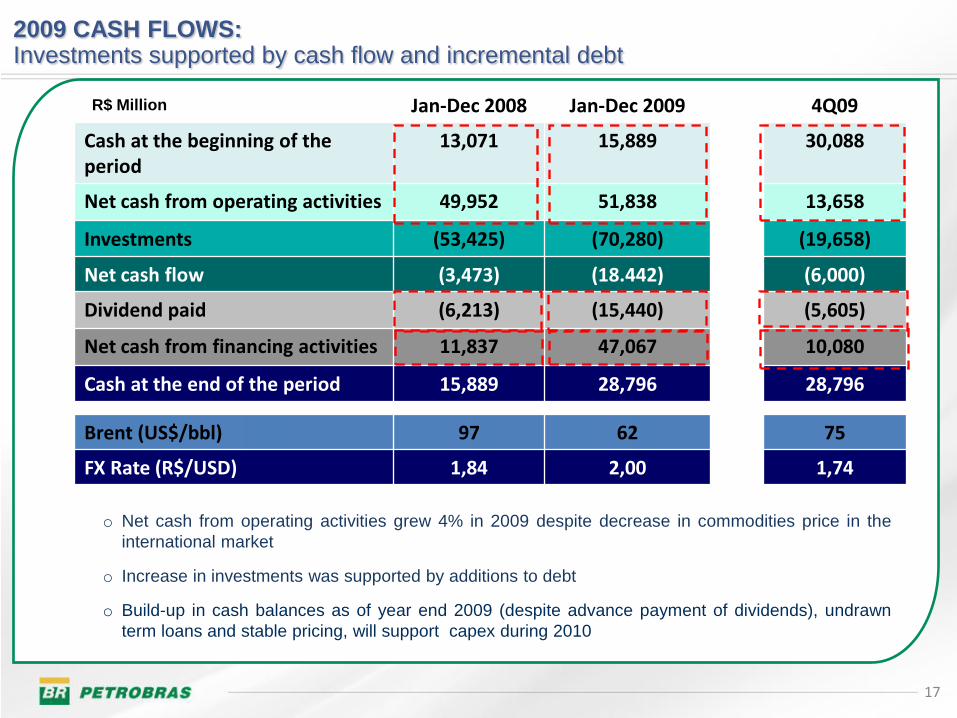
Jan-Dec 2008 Jan-Dec 2009 4Q09
Cash at the beginning of the period
13,071 15,889 30,088
Net cash from operating activities 49,952 51,838 13,658
Investments (53,425) (70,280) (19,658)
Net cash flow (3,473) (18.442) (6,000)
Dividend paid (6,213) (15,440) (5,605)
Net cash from financing activities 11,837 47,067 10,080
Cash at the end of the period 15,889 28,796 28,796
R$ Million
Brent (US$/bbl) 97 62 75
FX Rate (R$/USD) 1,84 2,00 1,74
2009 CASH FLOWS:Investments supported by cash flow and incremental debt
o Net cash from operating activities grew 4% in 2009 despite decrease in commodities price in the
international market
o Increase in investments was supported by additions to debt
o Build-up in cash balances as of year end 2009 (despite advance payment of dividends), undrawn
term loans and stable pricing, will support capex during 2010
17
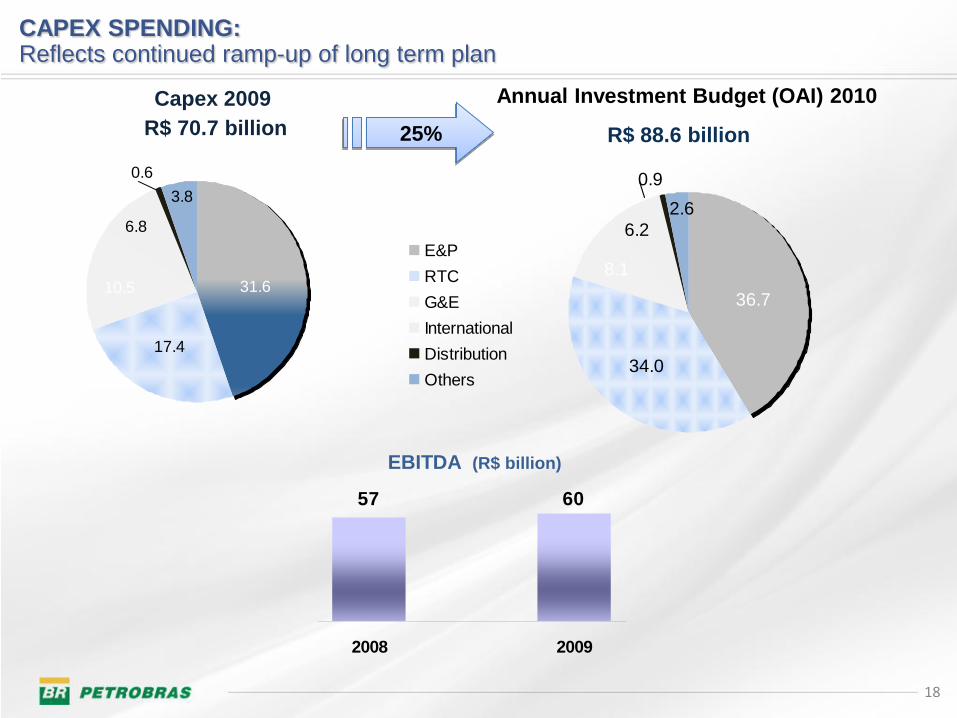
57 60
2008 2009
CAPEX SPENDING:Reflects continued ramp-up of long term plan
EBITDA (R$ billion)
Capex 2009
R$ 70.7 billion
17.4
6.8
31.610.5
0.6
3.8
18
34.0
6.2
36.7
8.1
0.9
2.6
E&P
RTC
G&E
International
Distribution
Others
Annual Investment Budget (OAI) 2010
R$ 88.6 billion 25%
BUSINESS PLAN 2010 - 2014
INVESTMENT 2010 – 2014 BETWEEN US$ 200 TO US$ 220 BILLIONS:
MONITORING FINANCIAL RATIOS
o Leverage between 25% and 35%
o Net Debt/ EBITDA up to 2.5X
o Investment revenue maintenance in the different segments
RELEVANT ASSUMPTIONS FOR THE PROJECTIONS
o Brent curve – upward trend
o Capitalization – value and timing
o Funding needs for the new Strategic Plan 2010-2014
19
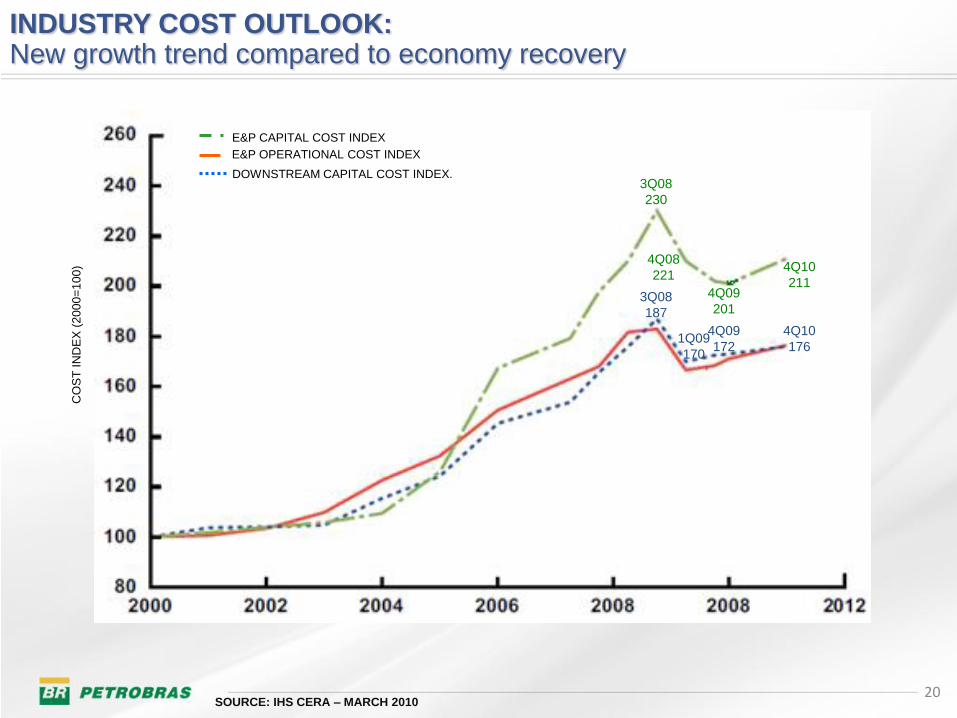
INDUSTRY COST OUTLOOK:New growth trend compared to economy recovery
SOURCE: IHS CERA – MARCH 2010
CO
ST
IN
DE
X (
20
00
=1
00
)
E&P CAPITAL COST INDEX
E&P OPERATIONAL COST INDEX
DOWNSTREAM CAPITAL COST INDEX.3Q08
230
4Q08
221
4Q09
201
4Q10
2113Q08
187
1Q09
170
4Q09
172
4Q10
176
20
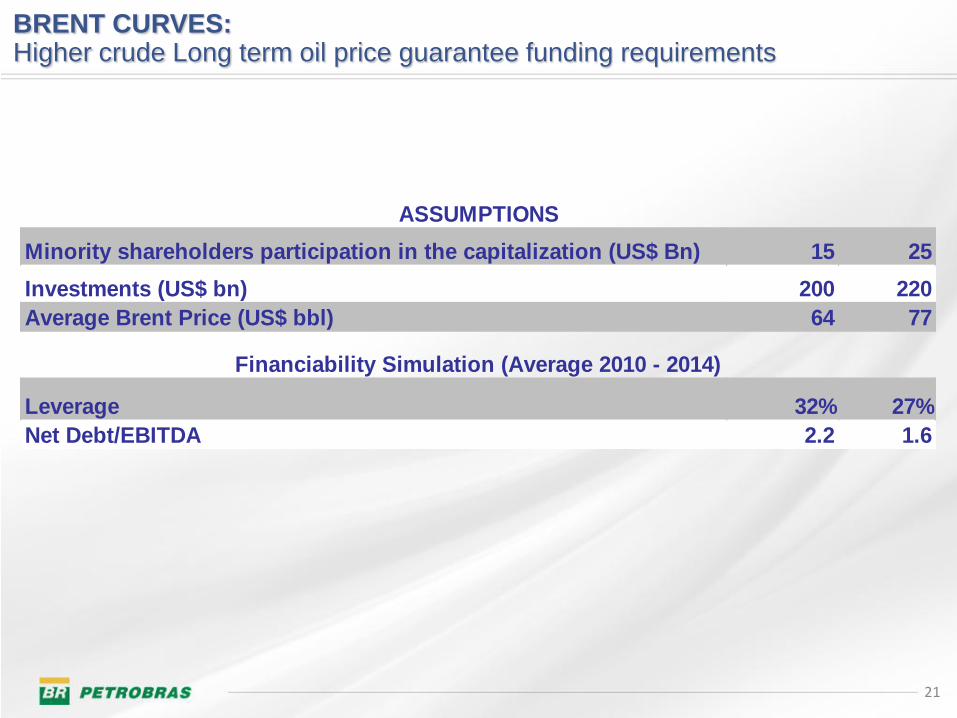
Minority shareholders participation in the capitalization (US$ Bn) 15 25
Investments (US$ bn) 200 220
Average Brent Price (US$ bbl) 64 77
Leverage 32% 27%
Net Debt/EBITDA 2.2 1.6
ASSUMPTIONS
Financiability Simulation (Average 2010 - 2014)
BRENT CURVES: Higher crude Long term oil price guarantee funding requirements
21
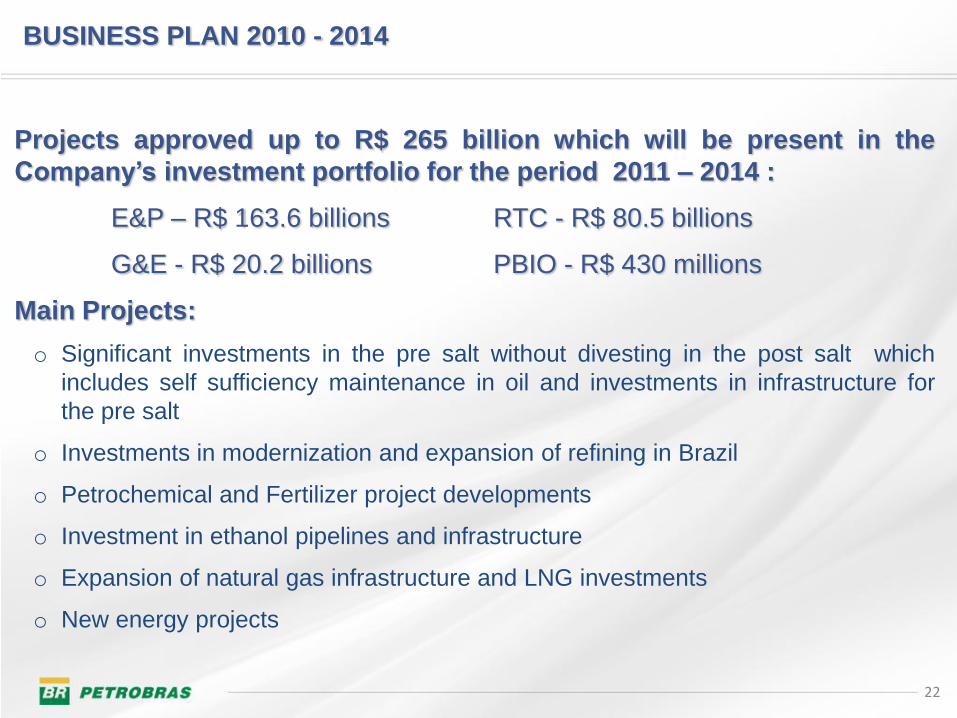
Projects approved up to R$ 265 billion which will be present in the
Company’s investment portfolio for the period 2011 – 2014 :
E&P – R$ 163.6 billions RTC - R$ 80.5 billions
G&E - R$ 20.2 billions PBIO - R$ 430 millions
Main Projects:
o Significant investments in the pre salt without divesting in the post salt which
includes self sufficiency maintenance in oil and investments in infrastructure for
the pre salt
o Investments in modernization and expansion of refining in Brazil
o Petrochemical and Fertilizer project developments
o Investment in ethanol pipelines and infrastructure
o Expansion of natural gas infrastructure and LNG investments
o New energy projects
BUSINESS PLAN 2010 - 2014
22
23
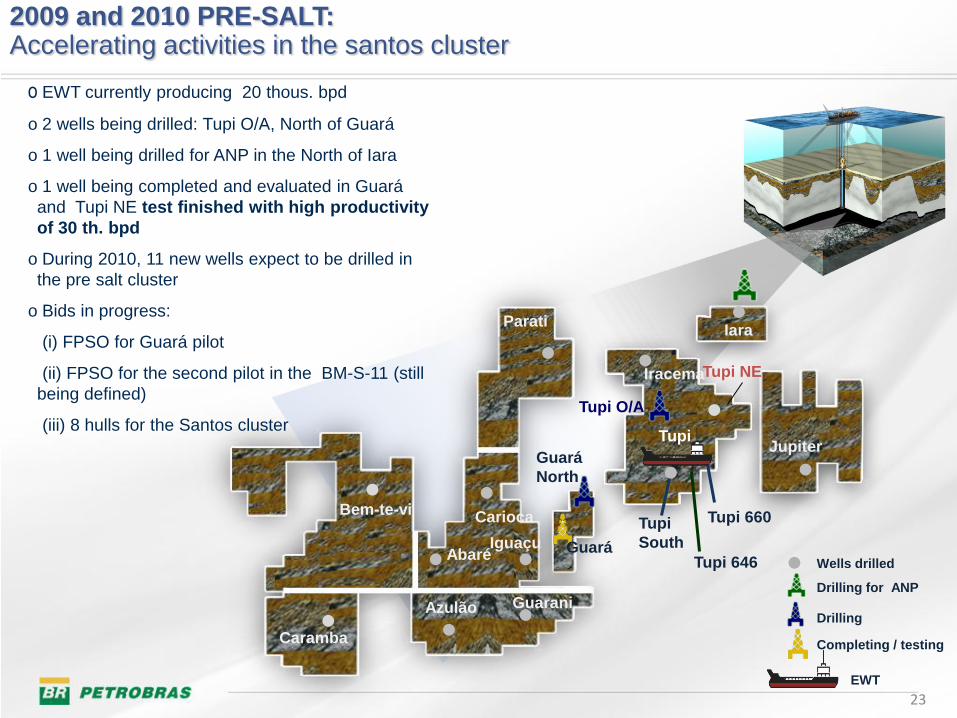
2009 and 2010 PRE-SALT: Accelerating activities in the santos cluster
Caramba
Bem-te-viCarioca
IguaçuAbaré
Azulão Guarani
Guará
North
ParatiIara
Iracema
Tupi
Tupi 660Tupi
South
Jupiter
Tupi NE
Tupi O/A
Tupi 646Guará
Wells drilled
Drilling for ANP
Drilling
EWT
Completing / testing
o EWT currently producing 20 thous. bpd
o 2 wells being drilled: Tupi O/A, North of Guará
o 1 well being drilled for ANP in the North of Iara
o 1 well being completed and evaluated in Guará
and Tupi NE test finished with high productivity
of 30 th. bpd
o During 2010, 11 new wells expect to be drilled in
the pre salt cluster
o Bids in progress:
(i) FPSO for Guará pilot
(ii) FPSO for the second pilot in the BM-S-11 (still
being defined)
(iii) 8 hulls for the Santos cluster
24
Valuation of
the barrels
Timing
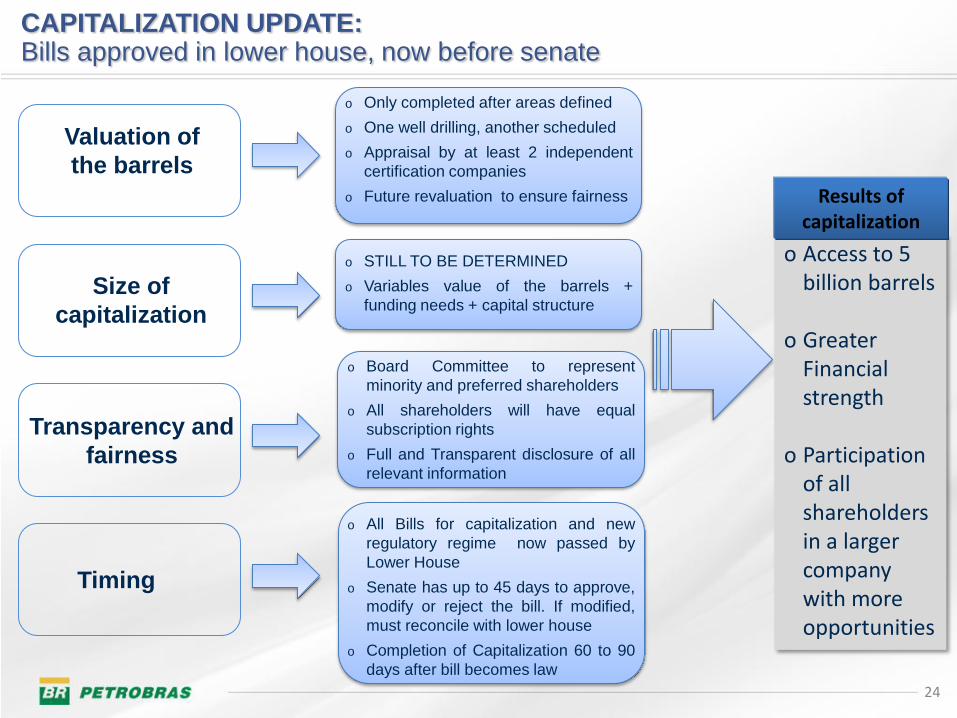
CAPITALIZATION UPDATE: Bills approved in lower house, now before senate
Transparency and
fairness
Size of
capitalization
o Access to 5 billion barrels
o Greater Financial strength
o Participation of all shareholders in a larger company with more opportunities
Results ofcapitalization
o Only completed after areas defined
o One well drilling, another scheduled
o Appraisal by at least 2 independent
certification companies
o Future revaluation to ensure fairness
o STILL TO BE DETERMINED
o Variables value of the barrels +
funding needs + capital structure
o Board Committee to represent
minority and preferred shareholders
o All shareholders will have equal
subscription rights
o Full and Transparent disclosure of all
relevant information
o All Bills for capitalization and new
regulatory regime now passed by
Lower House
o Senate has up to 45 days to approve,
modify or reject the bill. If modified,
must reconcile with lower house
o Completion of Capitalization 60 to 90
days after bill becomes law
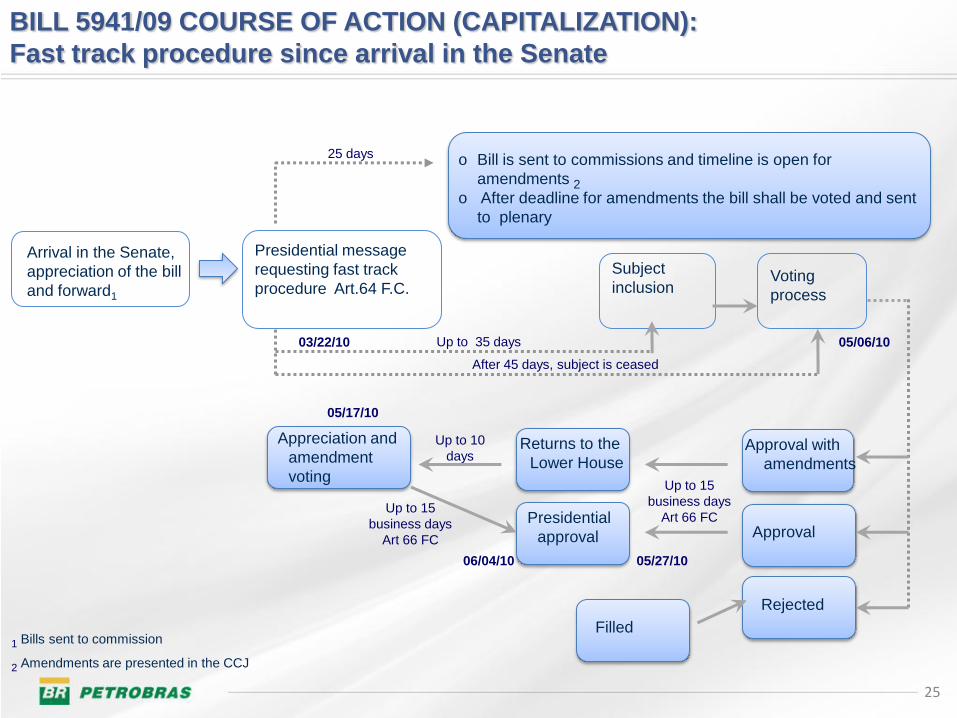
BILL 5941/09 COURSE OF ACTION (CAPITALIZATION):
Fast track procedure since arrival in the Senate
1 Bills sent to commission
2 Amendments are presented in the CCJ
Arrival in the Senate,
appreciation of the bill
and forward1
Presidential message
requesting fast track
procedure Art.64 F.C.
o Bill is sent to commissions and timeline is open for
amendments 2o After deadline for amendments the bill shall be voted and sent
to plenary
25 days
Subject
inclusionVoting
process
Up to 35 days
After 45 days, subject is ceased
Approval with
amendments
Approval
Rejected
Filled
Presidential
approval
Up to 15
business days
Art 66 FC
Returns to the
Lower House
Up to 10
days
Appreciation and
amendment
voting
03/22/10 05/06/10
05/17/10
06/04/10 05/27/10
Up to 15
business days
Art 66 FC
25
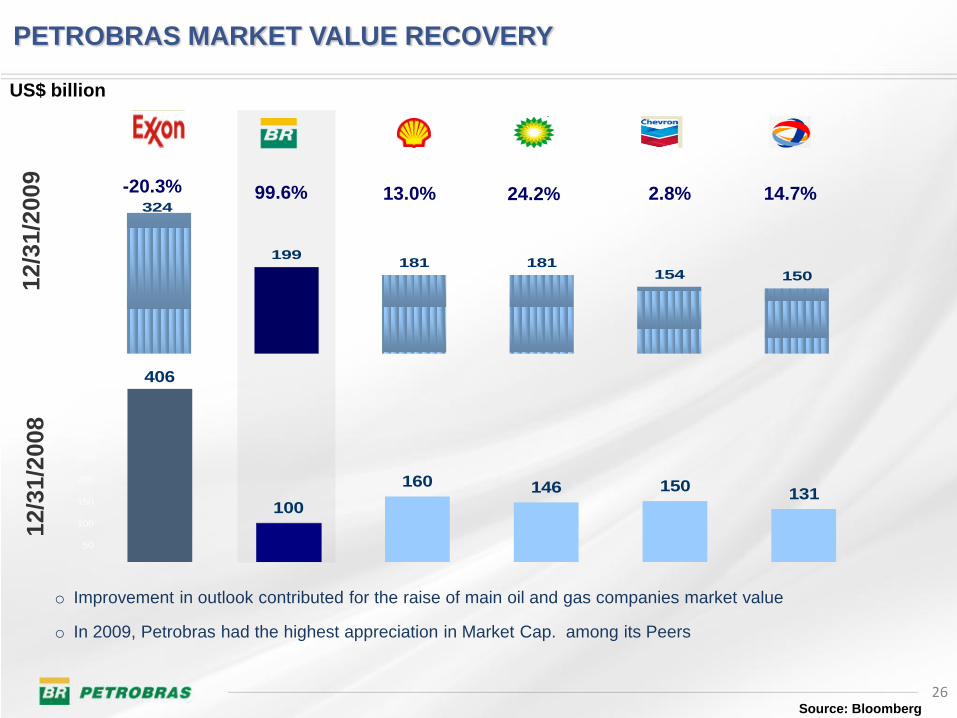
199181 181
154 150
324
0
50
100
150
200
250
300
350
Exxon Petrobras Shell BP Chevron Total
PETROBRAS MARKET VALUE RECOVERY
13.0%-20.3% 99.6% 24.2% 14.7%2.8%
Source: Bloomberg
o Improvement in outlook contributed for the raise of main oil and gas companies market value
o In 2009, Petrobras had the highest appreciation in Market Cap. among its Peers
US$ billion
406
100
160 146 150131
0
50
100
150
200
250
300
350
400
450
12/3
1/2
009
12/3
1/2
008
26
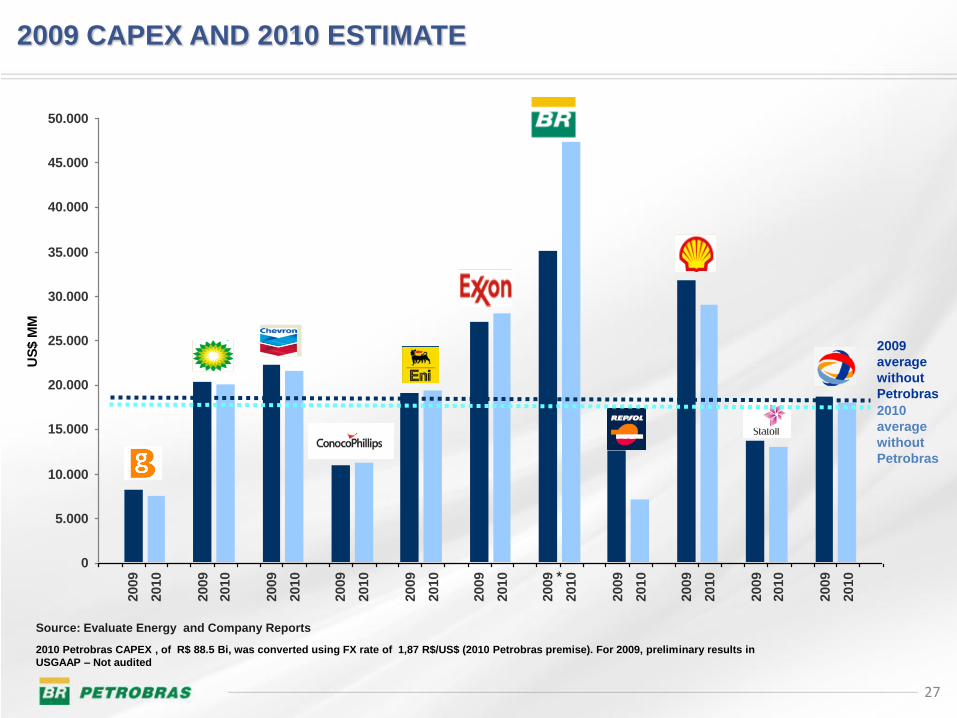
2009 CAPEX AND 2010 ESTIMATE
0
5.000
10.000
15.000
20.000
25.000
30.000
35.000
40.000
45.000
50.0002009
2010
2009
2010
2009
2010
2009
2010
2009
2010
2009
2010
2009
2010
2009
2010
2009
2010
2009
2010
2009
2010
US
$ M
M
2009
average
without
Petrobras
2010
average
without
Petrobras
Source: Evaluate Energy and Company Reports
2010 Petrobras CAPEX , of R$ 88.5 Bi, was converted using FX rate of 1,87 R$/US$ (2010 Petrobras premise). For 2009, preliminary results in
USGAAP – Not audited
*
27

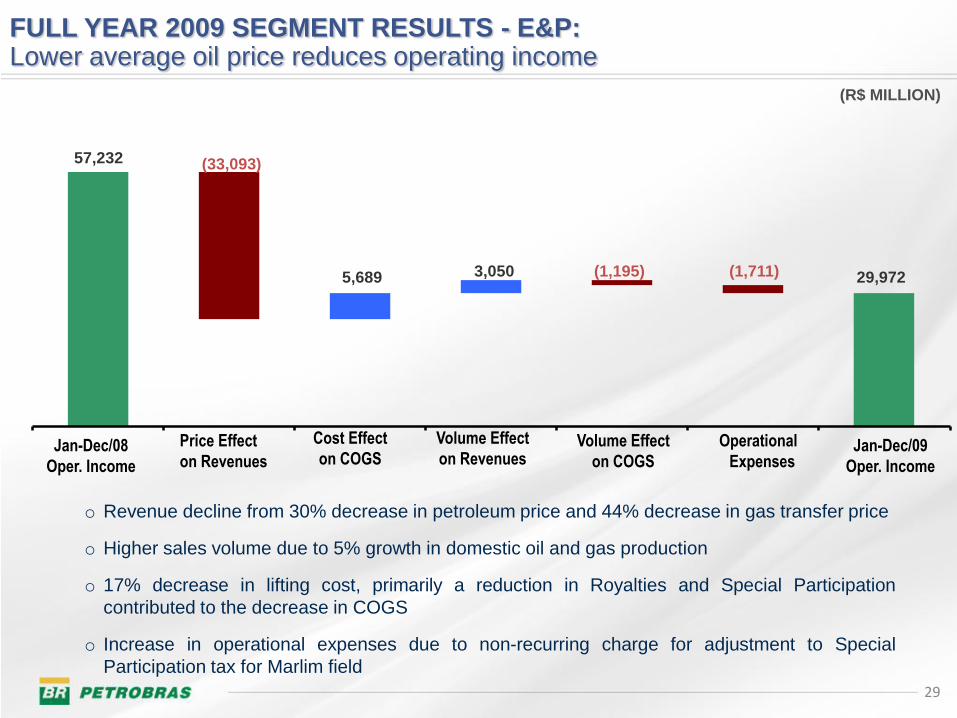
(33,093)
5,689 3,050 (1,195) (1,711) 29,972
57,232
o Revenue decline from 30% decrease in petroleum price and 44% decrease in gas transfer price
o Higher sales volume due to 5% growth in domestic oil and gas production
o 17% decrease in lifting cost, primarily a reduction in Royalties and Special Participation
contributed to the decrease in COGS
o Increase in operational expenses due to non-recurring charge for adjustment to Special
Participation tax for Marlim field
Jan-Dec/08
Oper. Income
Jan-Dec/09
Oper. Income
(R$ MILLION)
Price Effect
on Revenues
Volume Effect
on Revenues
Cost Effect
on COGSOperational
Expenses
Volume Effect
on COGS
29
FULL YEAR 2009 SEGMENT RESULTS - E&P:Lower average oil price reduces operating income
(28,648)
53,4572,240 (2,203)
234 20,482
(4,598)
(R$ MILLION)
Price Effect
on Revenues
Volume Effect
on Revenues
Cost Effect
on COGS
Operational
Expenses
Volume Effect
on COGS
Jan-Dec/08
Oper. Income
Jan-Dec/09
Oper. Income
30
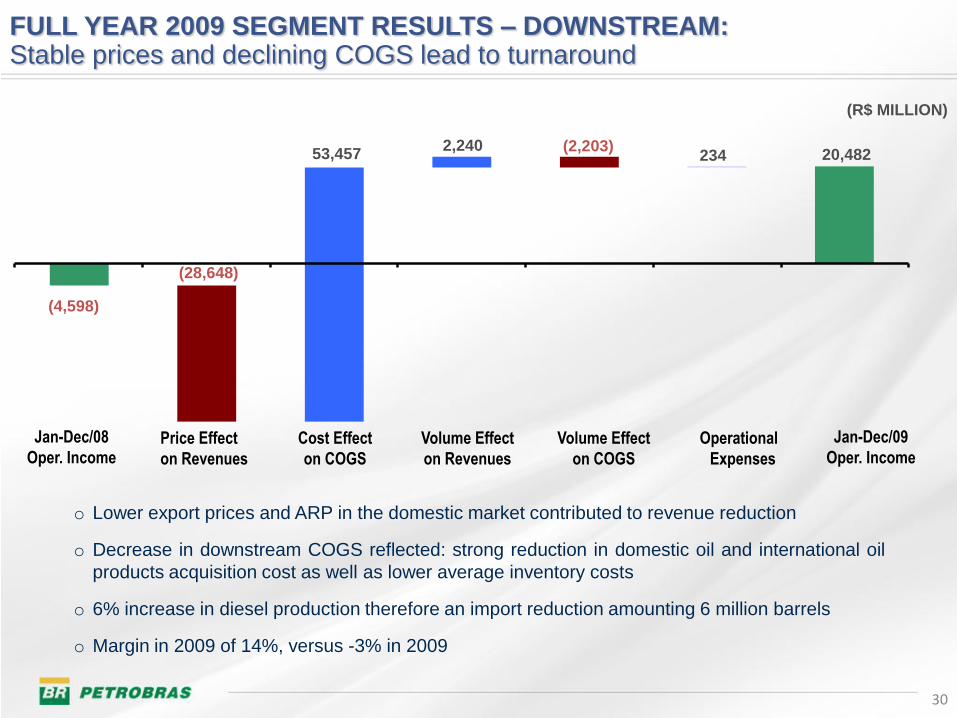
o Lower export prices and ARP in the domestic market contributed to revenue reduction
o Decrease in downstream COGS reflected: strong reduction in domestic oil and international oil
products acquisition cost as well as lower average inventory costs
o 6% increase in diesel production therefore an import reduction amounting 6 million barrels
o Margin in 2009 of 14%, versus -3% in 2009
FULL YEAR 2009 SEGMENT RESULTS – DOWNSTREAM:Stable prices and declining COGS lead to turnaround
(1,482)
3,388 (2,879)
2,497
546 1,541
(529)
(R$ MILLION)
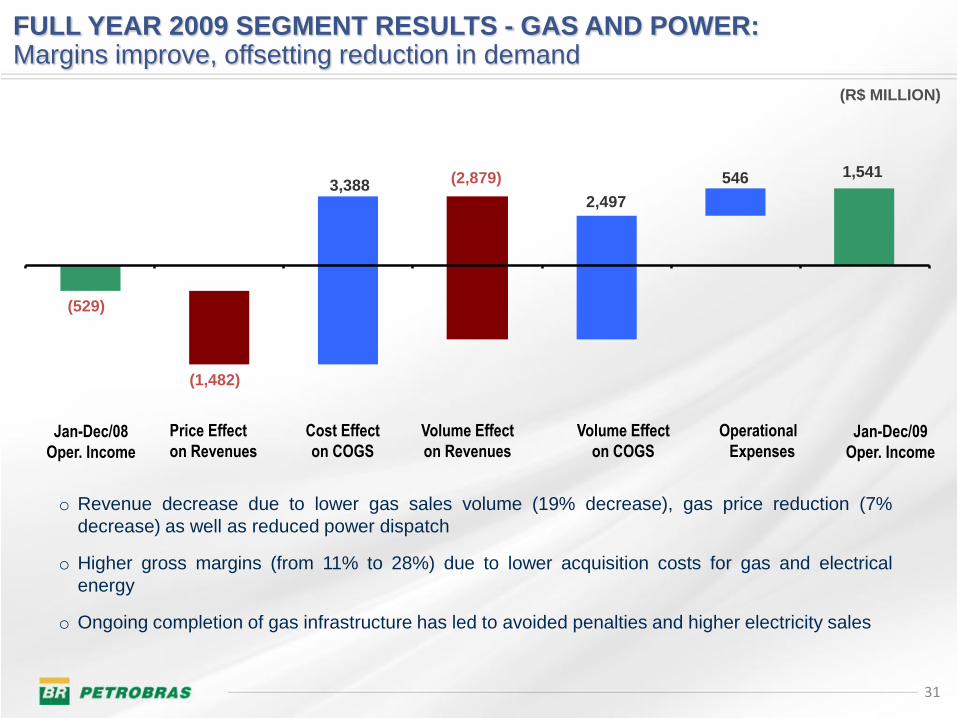
o Revenue decrease due to lower gas sales volume (19% decrease), gas price reduction (7%
decrease) as well as reduced power dispatch
o Higher gross margins (from 11% to 28%) due to lower acquisition costs for gas and electrical
energy
o Ongoing completion of gas infrastructure has led to avoided penalties and higher electricity sales
Price Effect
on Revenues
Volume Effect
on Revenues
Cost Effect
on COGS
Operational
Expenses
Volume Effect
on COGSJan-Dec/08
Oper. Income
Jan-Dec/09
Oper. Income
31
FULL YEAR 2009 SEGMENT RESULTS - GAS AND POWER: Margins improve, offsetting reduction in demand
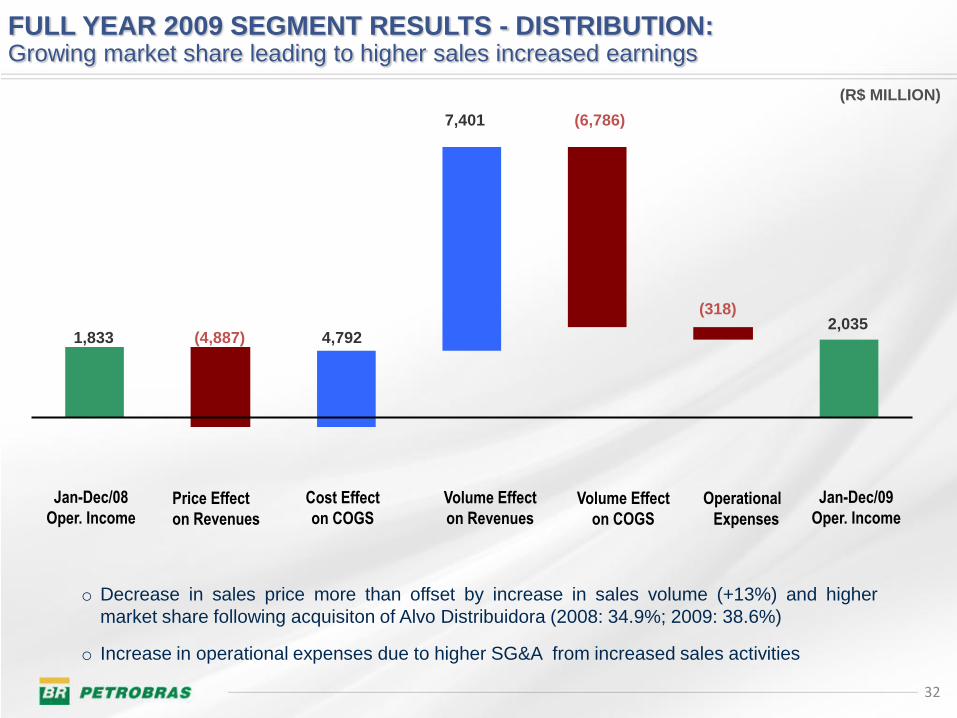
(4,887) 4,792
7,401 (6,786)
(318)2,035
1,833
(R$ MILLION)
o Decrease in sales price more than offset by increase in sales volume (+13%) and higher
market share following acquisiton of Alvo Distribuidora (2008: 34.9%; 2009: 38.6%)
o Increase in operational expenses due to higher SG&A from increased sales activities
Price Effect
on Revenues
Volume Effect
on Revenues
Cost Effect
on COGSOperational
Expenses
Volume Effect
on COGS
Jan-Dec/08
Oper. Income
Jan-Dec/09
Oper. Income
32
FULL YEAR 2009 SEGMENT RESULTS - DISTRIBUTION: Growing market share leading to higher sales increased earnings
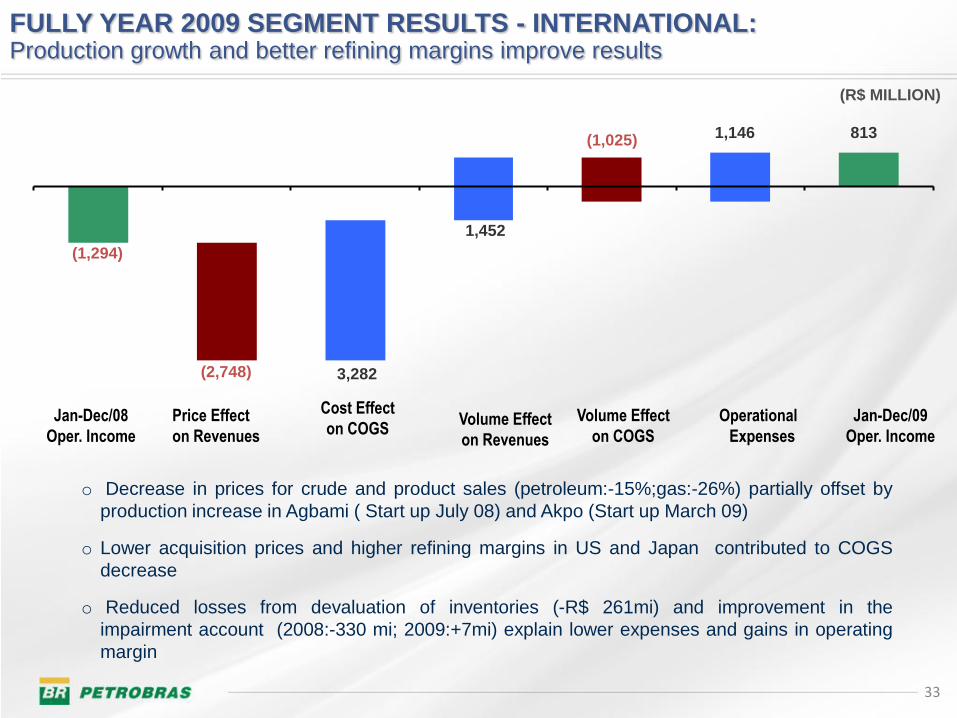
(2,748) 3,282
1,452
(1,025) 1,146 813
(1,294)
(R$ MILLION)
o Decrease in prices for crude and product sales (petroleum:-15%;gas:-26%) partially offset by
production increase in Agbami ( Start up July 08) and Akpo (Start up March 09)
o Lower acquisition prices and higher refining margins in US and Japan contributed to COGS
decrease
o Reduced losses from devaluation of inventories (-R$ 261mi) and improvement in the
impairment account (2008:-330 mi; 2009:+7mi) explain lower expenses and gains in operating
margin
Price Effect
on RevenuesVolume Effect
on Revenues
Cost Effect
on COGSOperational
Expenses
Volume Effect
on COGS
Jan-Dec/08
Oper. Income
Jan-Dec/09
Oper. Income
33
FULLY YEAR 2009 SEGMENT RESULTS - INTERNATIONAL:Production growth and better refining margins improve results