website annexure to the 2015 budget review … budget/2015/review/annexure... · website annexure...
TRANSCRIPT
1
W1 Website annexure to the 2015 Budget Review
Explanatory memorandum to the division of revenue
Background
Section 214(1) of the Constitution requires that every year a Division of Revenue Act determine the
equitable division of nationally raised revenue between national government, the nine provinces and
278 municipalities. This process takes into account the powers and functions assigned to each sphere of
government. The division of revenue process fosters transparency and is at the heart of constitutional
cooperative governance.
The Intergovernmental Fiscal Relations Act (1997) prescribes the process for determining the equitable
sharing and allocation of nationally raised revenue. Sections 9 and 10(4) of the act set out the consultation
process to be followed with the Financial and Fiscal Commission (FFC), including considering
recommendations made regarding the division of revenue.
This explanatory memorandum to the 2015 Division of Revenue Bill fulfils the requirement set out in
section 10(5) of the Intergovernmental Fiscal Relations Act that the bill be accompanied by an explanatory
memorandum detailing how it takes account of the matters listed in sections 214(2)(a) to (j) of the
Constitution, government’s response to the FFC’s recommendations, and any assumptions and formulas
used in arriving at the respective divisions among provinces and municipalities. This explanatory
memorandum has six sections:
Part 1 lists the factors that inform the division of resources between national, provincial and local
government.
Part 2 describes the 2015 division of revenue.
Part 3 sets out how the FFC’s recommendations on the 2015 division of revenue have been taken into
account.
Part 4 explains the formula and criteria for the division of the provincial equitable share and conditional
grants among provinces.
2015 BUDGET REVIEW
2
Part 5 sets out the formula and criteria for the division of the local government equitable share and
conditional grants among municipalities.
Part 6 summarises issues that will form part of subsequent reviews of provincial and local government
fiscal frameworks.
The Division of Revenue Bill and its underlying allocations are the result of extensive consultation
between national, provincial and local government. The Budget Council deliberated on the matters
discussed in this memorandum at several meetings during the year. The approach to local government
allocations was discussed with organised local government at technical meetings with the South African
Local Government Association (SALGA), culminating in meetings of the Budget Forum (the Budget
Council and SALGA). An extended Cabinet meeting involving ministers, provincial premiers and the
SALGA chairperson was held in October 2014. The division of revenue, and the government priorities that
underpin it, was agreed for the next three years.
Part 1: Constitutional considerations
Section 214 of the Constitution requires that the annual Division of Revenue Act be enacted after factors in
sub-sections (2)(a) to (j) of the Constitution are taken into account. These include national interest, debt
provision, the needs of national government, flexibility in responding to emergencies, resource allocation
for basic services and developmental needs, the fiscal capacity and efficiency of provincial and local
government, reduction of economic disparities, and promotion of stability and predictability. The
constitutional principles taken into account in deciding on the division of revenue are briefly noted below.
National interest and the division of resources
The national interest is encapsulated by governance goals that benefit the nation as a whole. The National
Development Plan, endorsed by Cabinet in November 2012, sets out a long-term vision for the country’s
development. This is complemented by the strategic integrated projects overseen by the Presidential
Infrastructure Coordinating Council and the 14 priority outcomes adopted by Cabinet in 2014 for the
2014–2019 Medium Term Strategic Framework. In the 2014 Medium Term Budget Policy Statement, the
Minister of Finance outlined how the resources available to government over the 2015 medium-term
expenditure framework (MTEF) would be allocated to help achieve these goals. Chapter 4 of the
2014 Medium Term Budget Policy Statement and Chapters 5 and 6 of the 2015 Budget Review discuss how
funds have been allocated across the three spheres of government based on these priorities. The
frameworks for each conditional grant allocated as part of the division of revenue also note how the grant
is linked to the 14 priority outcomes.
Provision for debt costs
The resources shared between national, provincial and local government include proceeds from national
government borrowing used to fund public spending. National government provides for the resulting debt
costs to protect the country’s integrity and credit reputation. A more detailed discussion can be found in
Chapter 7 of the 2015 Budget Review.
National government’s needs and interests
The Constitution assigns exclusive and concurrent powers and functions to each sphere of government.
National government is exclusively responsible for functions that serve the national interest and are best
centralised. National and provincial government have concurrent responsibility for a range of functions.
Provincial and local government receive equitable shares and conditional grants to enable them to provide
basic services and perform their functions. Functions may shift between spheres of government to better
meet government’s needs. The division of revenue responds to this by modifying the funding
arrangements. For example, in 2015/16 the port health and further education and training functions will
shift from provincial to national government, so the funds for these functions will move from the
provincial equitable share and conditional grants to the budgets of the national departments of Health and
ANNEXURE W1: EXPLANATORY MEMORANDUM TO THE DIVISION OF REVENUE
3
Higher Education and Training. Changes continue to be made to various national transfers to provincial
and local government to improve their efficiency, effectiveness and alignment with national strategic
objectives.
Provincial and local government basic services
Provinces and municipalities are assigned service delivery functions such as education, health, social
development, housing, roads, and provision of electricity, water and municipal infrastructure. They have
significant autonomy to allocate resources to meet basic needs and respond to provincial and local
priorities, while also giving effect to national objectives. The division of revenue provides equitable shares
to provinces and local government, together with conditional grants for basic service delivery.
Baseline reductions to the provincial and local fiscal frameworks in this year’s division of revenue have
been structured to minimise the effect on basic service delivery. For example, the comprehensive HIV and
AIDS grant to provinces and the local government equitable share have not been reduced. Transfers to
local government have grown significantly in recent years, providing municipalities with greater resources
to deliver basic services. This is in addition to local government’s substantial own-revenue-raising powers.
The 2015 division of revenue has made additional resources available to accelerate the rollout of water and
sanitation infrastructure, and a new grant to municipalities affected by the 2016 boundary changes will
help minimise any negative effects that the transition may have on service delivery.
Fiscal capacity and efficiency
National government has primary revenue-raising powers. Provinces have limited revenue-raising capacity
and the resources required to deliver provincial functions do not lend themselves to self-funding or cost
recovery. Municipalities finance most of their expenditure through property rates, user charges and fees.
However, rural municipalities raise significantly less revenue than larger urban and metropolitan
municipalities. Due to their limited revenue-raising potential and their responsibility to implement
government priorities, provinces receive a larger share of nationally raised revenue than local government.
Local government’s share of revenue has increased from 3 per cent in 2000/01 to 9 per cent over the 2015
MTEF period. A review of the local government equitable share was completed in 2012 and a new formula
is being phased in from 2013/14 to 2017/18. The new formula incorporates a revenue adjustment factor
that considers the fiscal capacity of the recipient municipality (full details of the formula are provided in
part 5 of this annexure). The mechanisms for allocating funds to provinces and municipalities are
continuously reviewed to improve their efficiency. A new approach to the funding of provincial
infrastructure is being implemented to promote better planning and implementation, and to improve
efficiency in the delivery of health and education infrastructure. To maximise the effect of allocations,
many provincial and local government conditional grants use criteria that consider the efficiency with
which the recipient has used previous allocations.
Developmental needs
Developmental needs are accounted for at two levels. First, in the determination of the division of revenue,
which explains the continued commitment to grow the provincial and local government shares of
nationally raised revenue, and second, in the determination of the division within each sphere through the
formulas used to divide national transfers among municipalities and provinces. Developmental needs are
encapsulated in the equitable share formulas for provincial and local government and in specific
conditional grants, such as the municipal infrastructure grant, which allocates funds according to the
number of households in a municipality without access to basic services. Various infrastructure grants and
growing capital budgets aim to boost the economic and social development of provinces and
municipalities.
2015 BUDGET REVIEW
4
Economic disparities
The equitable share and infrastructure grant formulas are redistributive towards poorer provinces and
municipalities. Through the division of revenue, government continues to invest in economic infrastructure
(such as roads) and social infrastructure (such as schools, hospitals and clinics) to stimulate economic
development, create jobs, and address economic and social disparities.
Obligations in terms of national legislation
The Constitution confers autonomy on provincial governments and municipalities to determine priorities
and allocate budgets. National government is responsible for policy development, national mandates,
setting national norms and standards for provincial and municipal functions, and monitoring
implementation for concurrent functions. The 2015 MTEF and division of revenue provide additional
funding for municipalities affected by significant boundary changes due to take effect after the 2016 local
government elections. National government will also ensure that baseline reductions do not affect
important obligations that are already funded through existing provincial and local government allocations.
Predictability and stability
Provincial and local government equitable share allocations are based on estimates of nationally raised
revenue. If this revenue falls short of the estimates within a given year, the equitable shares of provinces
and local government will not be adjusted downwards. Allocations are assured (voted, legislated and
guaranteed) for the first year and are transferred according to a payment schedule. To contribute to longer-
term predictability and stability, estimates for a further two years are published with the annual proposal
for appropriations. Adjusted estimates as a result of changes to data underpinning the equitable share
formulas and revisions to the formulas are phased in to ensure minimal disruption.
Flexibility in responding to emergencies
Government has a contingency reserve that provides a cushion for emergencies and unforeseeable events.
In addition, two conditional grants for disasters allow for the swift allocation and transfer of funds to
affected provinces and municipalities in the immediate aftermath of a declared disaster. Sections 16 and 25
of the Public Finance Management Act (1999) make specific provision for the allocation of funds to deal
with emergency situations. Section 30(2) deals with adjustment allocations for unforeseeable and
unavoidable expenditure. Section 29 of the Municipal Finance Management Act (2003) allows a municipal
mayor to authorise unforeseeable and unavoidable expenditure in an emergency.
Part 2: The 2015 division of revenue
As announced in the 2014 Medium Term Budget Policy Statement, government has lowered its expenditure
ceiling to reduce the budget deficit and stabilise public debt (see Chapters 1, 3 and 5 of the Budget
Review). However, the most important public spending programmes that help poor South Africans,
contribute to growth and generate employment have been protected from major reductions. The 2015
division of revenue reprioritises existing funds to ensure these objectives are met despite a lower
expenditure ceiling. The lower spending ceiling has been applied proportionately across the three spheres
of government. Parts 4 and 5 of this annexure set out in more detail how the baseline reductions have been
effected on provincial and local government transfers.
Excluding debt-service costs and the contingency reserve, allocated expenditure shared between the three
spheres amounts to R1.1 trillion, R1.2 trillion and R1.2 trillion over each of the MTEF years. These
allocations take into account government’s spending priorities, each sphere’s revenue-raising capacity and
responsibilities, and input from various intergovernmental forums and the FFC. The provincial and local
equitable share formulas are designed to ensure fair, stable and predictable revenue shares, and to address
economic and fiscal disparities.
ANNEXURE W1: EXPLANATORY MEMORANDUM TO THE DIVISION OF REVENUE
5
Government’s policy priorities for the 2015 MTEF period
Following the reductions to the baseline, existing budgets need to be reprioritised to meet government’s
policy priorities outlined in the Medium Term Strategic Framework. Priorities over the 2015 MTEF period
that are funded through reprioritisations in the division of revenue include:
The repair of provincial and municipal infrastructure damaged by disasters during 2013 and 2014
The upgrade of the R573 Moloto Road by the South African National Roads Agency Limited
The accelerated provision of bulk water and sanitation and the extension of basic infrastructure to areas
without water supply
A new grant to assist municipalities with the costs associated with major boundary changes.
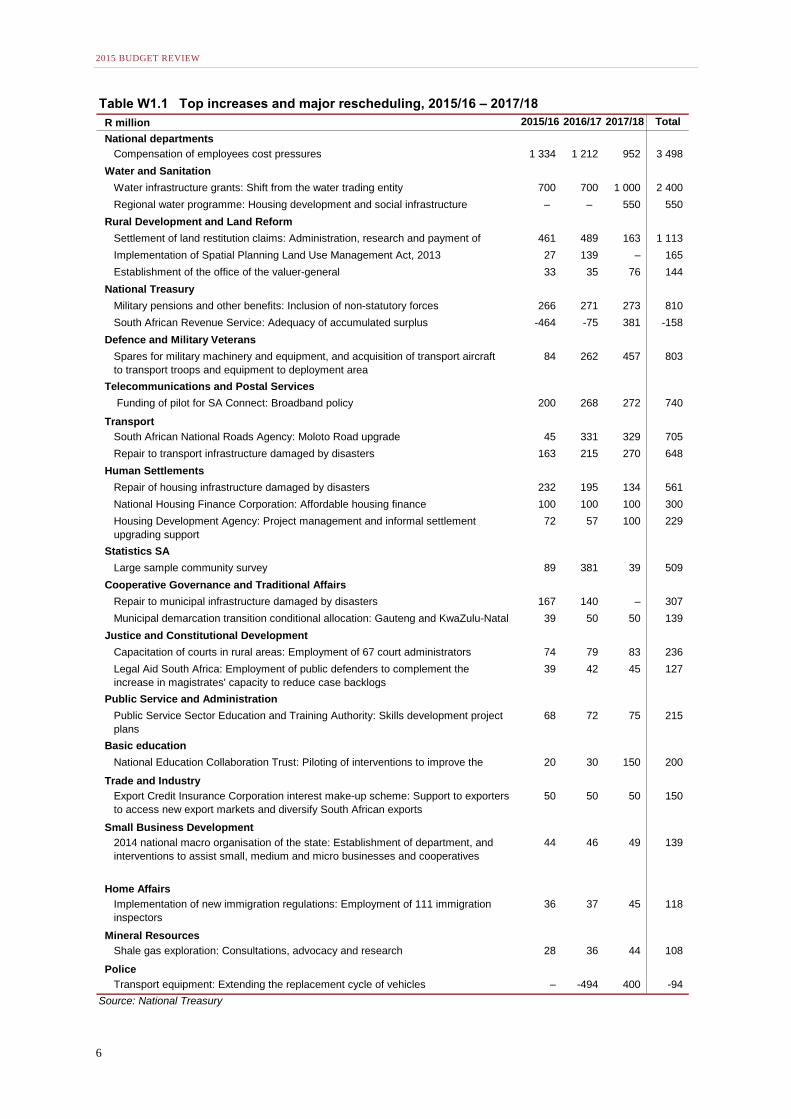
Table W1.1 shows how major reprioritisations are distributed to priority areas across national, provincial
and local government over the MTEF period.
2015 BUDGET REVIEW
6
Table W1.1 Top increases and major rescheduling, 2015/16 – 2017/18
R million 2015/16 2016/17 2017/18 Total
National departments
Compensation of employees cost pressures 1 334 1 212 952 3 498
Water and Sanitation
Water infrastructure grants: Shift from the water trading entity 700 700 1 000 2 400
Regional water programme: Housing development and social infrastructure – – 550 550
Rural Development and Land Reform
Settlement of land restitution claims: Administration, research and payment of
claims
461 489 163 1 113
Implementation of Spatial Planning Land Use Management Act, 2013 27 139 – 165
Establishment of the office of the valuer-general 33 35 76 144
National Treasury
Military pensions and other benefits: Inclusion of non-statutory forces 266 271 273 810
South African Revenue Service: Adequacy of accumulated surplus -464 -75 381 -158
Defence and Military Veterans
Spares for military machinery and equipment, and acquisition of transport aircraft
to transport troops and equipment to deployment area
84 262 457 803
Telecommunications and Postal Services
Funding of pilot for SA Connect: Broadband policy 200 268 272 740
Transport
South African National Roads Agency: Moloto Road upgrade 45 331 329 705
Repair to transport infrastructure damaged by disasters 163 215 270 648
Human Settlements
Repair of housing infrastructure damaged by disasters 232 195 134 561
National Housing Finance Corporation: Affordable housing finance 100 100 100 300
Housing Development Agency: Project management and informal settlement
upgrading support
72 57 100 229
Statistics SA
Large sample community survey 89 381 39 509
Cooperative Governance and Traditional Affairs
Repair to municipal infrastructure damaged by disasters 167 140 – 307
Municipal demarcation transition conditional allocation: Gauteng and KwaZulu-Natal
municipal restructuring costs
39 50 50 139
Justice and Constitutional Development
Capacitation of courts in rural areas: Employment of 67 court administrators 74 79 83 236
Legal Aid South Africa: Employment of public defenders to complement the
increase in magistrates' capacity to reduce case backlogs
39 42 45 127
Public Service and Administration
Public Service Sector Education and Training Authority: Skills development project
plans
68 72 75 215
Basic education
National Education Collaboration Trust: Piloting of interventions to improve the
quality of basic education
20 30 150 200
Trade and Industry
Export Credit Insurance Corporation interest make-up scheme: Support to exporters
to access new export markets and diversify South African exports
50 50 50 150
Small Business Development
2014 national macro organisation of the state: Establishment of department, and
interventions to assist small, medium and micro businesses and cooperatives
44 46 49 139
Home Affairs
Implementation of new immigration regulations: Employment of 111 immigration
inspectors
36 37 45 118
Mineral Resources
Shale gas exploration: Consultations, advocacy and research 28 36 44 108
Police
Transport equipment: Extending the replacement cycle of vehicles – -494 400 -94
Source: National Treasury
ANNEXURE W1: EXPLANATORY MEMORANDUM TO THE DIVISION OF REVENUE
7
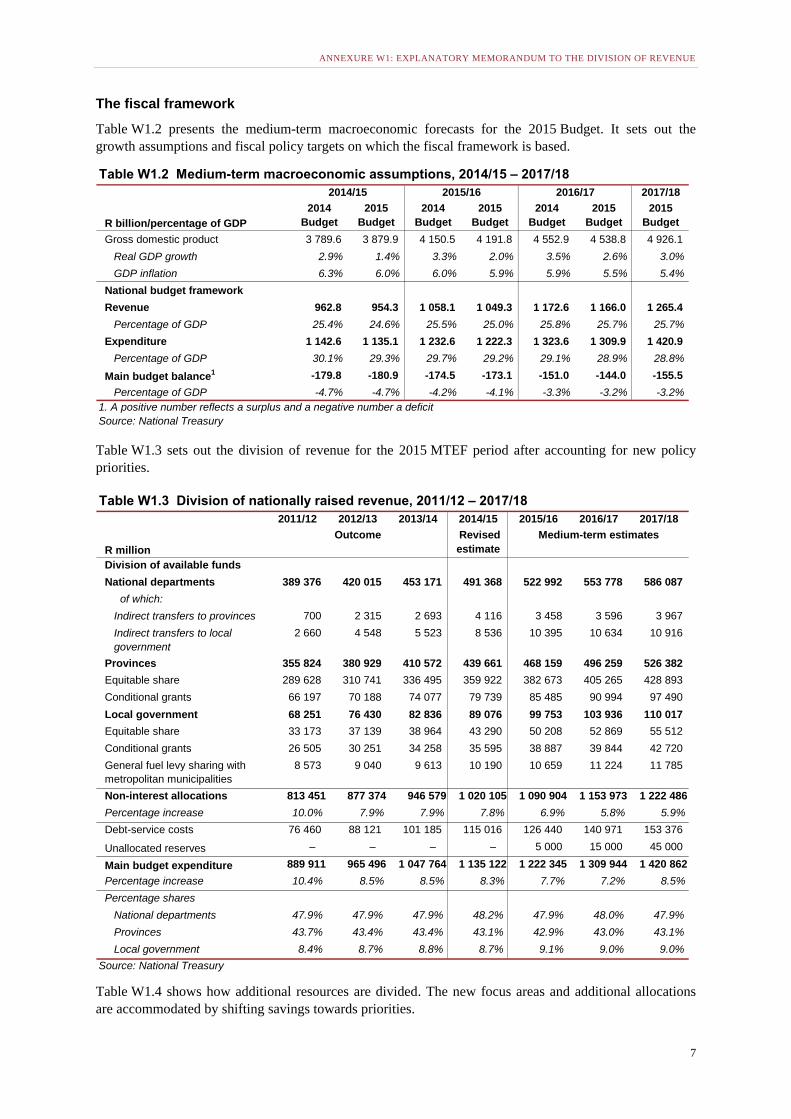
The fiscal framework
Table W1.2 presents the medium-term macroeconomic forecasts for the 2015 Budget. It sets out the
growth assumptions and fiscal policy targets on which the fiscal framework is based.
Table W1.3 sets out the division of revenue for the 2015 MTEF period after accounting for new policy
priorities.
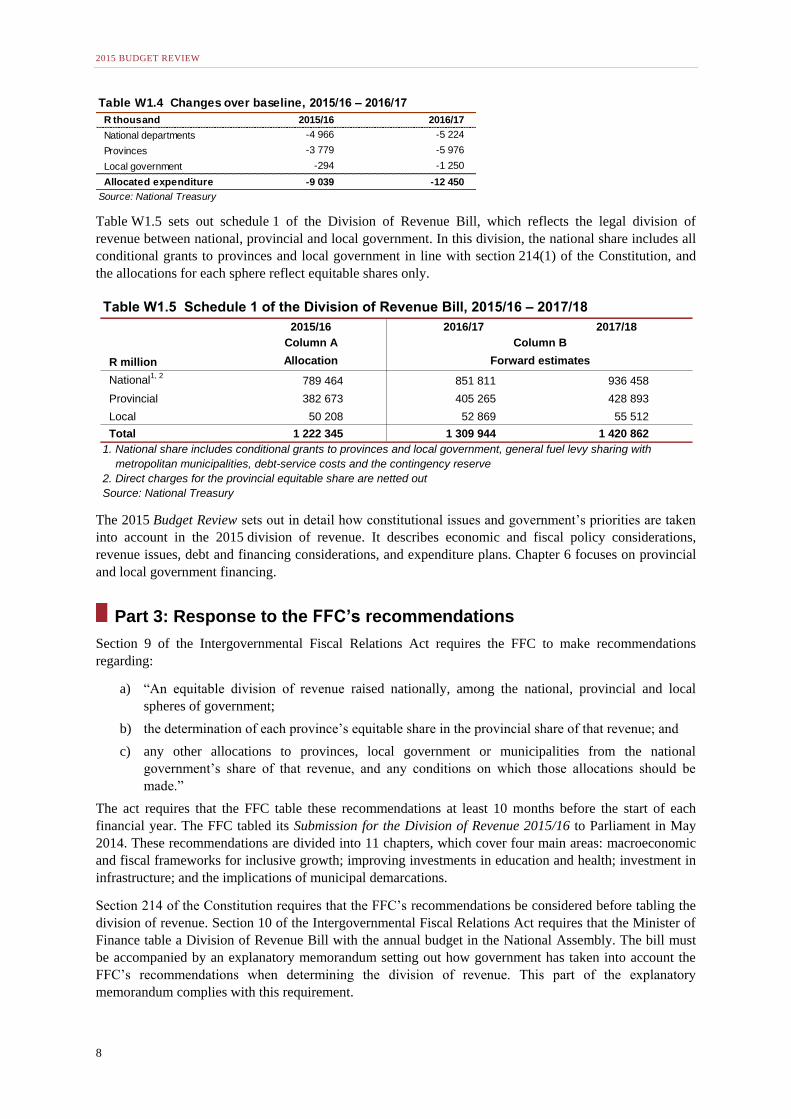
Table W1.4 shows how additional resources are divided. The new focus areas and additional allocations
are accommodated by shifting savings towards priorities.
Table W1.2 Medium-term macroeconomic assumptions, 2014/15 – 2017/18
2014/15 2015/16 2016/17 2017/18
R billion/percentage of GDP
2014
Budget
2015
Budget
2014
Budget
2015
Budget
2014
Budget
2015
Budget
2015
Budget
Gross domestic product 3 789.6 3 879.9 4 150.5 4 191.8 4 552.9 4 538.8 4 926.1
Real GDP growth 2.9% 1.4% 3.3% 2.0% 3.5% 2.6% 3.0%
GDP inflation 6.3% 6.0% 6.0% 5.9% 5.9% 5.5% 5.4%
National budget framework
Revenue 962.8 954.3 1 058.1 1 049.3 1 172.6 1 166.0 1 265.4
Percentage of GDP 25.4% 24.6% 25.5% 25.0% 25.8% 25.7% 25.7%
Expenditure 1 142.6 1 135.1 1 232.6 1 222.3 1 323.6 1 309.9 1 420.9
Percentage of GDP 30.1% 29.3% 29.7% 29.2% 29.1% 28.9% 28.8%
Main budget balance1 -179.8 -180.9 -174.5 -173.1 -151.0 -144.0 -155.5
Percentage of GDP -4.7% -4.7% -4.2% -4.1% -3.3% -3.2% -3.2%
1. A positive number reflects a surplus and a negative number a deficit
Source: National Treasury
Table W1.3 Division of nationally raised revenue, 2011/12 – 2017/18
2011/12 2012/13 2013/14 2014/15 2015/16 2016/17 2017/18
R million
Outcome Revised
estimate
Medium-term estimates
Division of available funds
National departments 389 376 420 015 453 171 491 368 522 992 553 778 586 087
of which:
Indirect transfers to provinces 700 2 315 2 693 4 116 3 458 3 596 3 967
Indirect transfers to local
government
2 660 4 548 5 523 8 536 10 395 10 634 10 916
Provinces 355 824 380 929 410 572 439 661 468 159 496 259 526 382
Equitable share 289 628 310 741 336 495 359 922 382 673 405 265 428 893
Conditional grants 66 197 70 188 74 077 79 739 85 485 90 994 97 490
Local government 68 251 76 430 82 836 89 076 99 753 103 936 110 017
Equitable share 33 173 37 139 38 964 43 290 50 208 52 869 55 512
Conditional grants 26 505 30 251 34 258 35 595 38 887 39 844 42 720
General fuel levy sharing with
metropolitan municipalities
8 573 9 040 9 613 10 190 10 659 11 224 11 785
Non-interest allocations 813 451 877 374 946 579 1 020 105 1 090 904 1 153 973 1 222 486
Percentage increase 10.0% 7.9% 7.9% 7.8% 6.9% 5.8% 5.9%
Debt-service costs 76 460 88 121 101 185 115 016 126 440 140 971 153 376
Unallocated reserves – – – – 5 000 15 000 45 000
Main budget expenditure 889 911 965 496 1 047 764 1 135 122 1 222 345 1 309 944 1 420 862
Percentage increase 10.4% 8.5% 8.5% 8.3% 7.7% 7.2% 8.5%
Percentage shares
National departments 47.9% 47.9% 47.9% 48.2% 47.9% 48.0% 47.9%
Provinces 43.7% 43.4% 43.4% 43.1% 42.9% 43.0% 43.1%
Local government 8.4% 8.7% 8.8% 8.7% 9.1% 9.0% 9.0%
Source: National Treasury
2015 BUDGET REVIEW
8
Table W1.5 sets out schedule 1 of the Division of Revenue Bill, which reflects the legal division of
revenue between national, provincial and local government. In this division, the national share includes all
conditional grants to provinces and local government in line with section 214(1) of the Constitution, and
the allocations for each sphere reflect equitable shares only.
The 2015 Budget Review sets out in detail how constitutional issues and government’s priorities are taken
into account in the 2015 division of revenue. It describes economic and fiscal policy considerations,
revenue issues, debt and financing considerations, and expenditure plans. Chapter 6 focuses on provincial
and local government financing.
Part 3: Response to the FFC’s recommendations
Section 9 of the Intergovernmental Fiscal Relations Act requires the FFC to make recommendations
regarding:
a) “An equitable division of revenue raised nationally, among the national, provincial and local
spheres of government;
b) the determination of each province’s equitable share in the provincial share of that revenue; and
c) any other allocations to provinces, local government or municipalities from the national
government’s share of that revenue, and any conditions on which those allocations should be
made.”
The act requires that the FFC table these recommendations at least 10 months before the start of each
financial year. The FFC tabled its Submission for the Division of Revenue 2015/16 to Parliament in May
2014. These recommendations are divided into 11 chapters, which cover four main areas: macroeconomic
and fiscal frameworks for inclusive growth; improving investments in education and health; investment in
infrastructure; and the implications of municipal demarcations.
Section 214 of the Constitution requires that the FFC’s recommendations be considered before tabling the
division of revenue. Section 10 of the Intergovernmental Fiscal Relations Act requires that the Minister of
Finance table a Division of Revenue Bill with the annual budget in the National Assembly. The bill must
be accompanied by an explanatory memorandum setting out how government has taken into account the
FFC’s recommendations when determining the division of revenue. This part of the explanatory
memorandum complies with this requirement.
Table W1.4 Changes over baseline, 2015/16 – 2016/17
R thousand 2015/16 2016/17
National departments -4 966 -5 224
Provinces -3 779 -5 976
Local government -294 -1 250
Allocated expenditure -9 039 -12 450
Source: National Treasury
Table W1.5 Schedule 1 of the Division of Revenue Bill, 2015/16 – 2017/18
2015/16 2016/17 2017/18
Column A Column B
R million Allocation Forward estimates
National1, 2
789 464 851 811 936 458
Provincial 382 673 405 265 428 893
Local 50 208 52 869 55 512
Total 1 222 345 1 309 944 1 420 862
1. National share includes conditional grants to provinces and local government, general fuel levy sharing with
metropolitan municipalities, debt-service costs and the contingency reserve
2. Direct charges for the provincial equitable share are netted out
Source: National Treasury
ANNEXURE W1: EXPLANATORY MEMORANDUM TO THE DIVISION OF REVENUE
9
The FFC’s recommendations can be divided into three categories:
Recommendations that apply directly to the division of revenue
Recommendations that indirectly apply to issues related to the division of revenue
Recommendations that do not relate to the division of revenue.
Government responses to the first and second categories are provided below. The relevant national
departments are considering the recommendations that do not relate to the division of revenue, and they
will respond directly to the FFC.
Recommendations that apply directly and indirectly to the division of revenue
Chapter 2: Public debt challenges and the need for fiscal reforms
Use cost-cutting as an opportunity for reform
The FFC recommends that, “Government does not resort simply to cutting costs to reduce public debt. The
need to restrain spending should be an opportunity to reform programmes and service delivery. Simple
cost cutting may be effective in achieving deficit reduction targets but does not encourage longer-run fiscal
stability or allow for reforms that will generate more value for money spent.”
Government response
Government agrees with the recommendation. The National Treasury has undertaken a careful review of
current expenditure trends to identify areas where spending on non-essential items can be reduced.
Government’s major programmes to reduce poverty and create jobs have been protected. This includes
expenditure on social grants, public employment programmes and economic incentives. Major cuts have
focused on non-essential goods and services, including catering, entertainment and travel budgets.
Avoid expenditure ceilings as a means of debt control
The FFC recommends that, “Government avoids across-the-board cuts or expenditure ceilings as a means
of debt control. Such blunt tools treat valuable, efficiently run programmes and outdated, poorly managed
programmes in the same way. Spending should be aligned with government priorities, to ensure adequate
funding of high-priority initiatives and elimination or substantial reduction of lower-priority programmes.”
Government response
The expenditure ceiling announced in the 2012 Budget is an important policy tool for ensuring that
government closes its structural budget deficit over the medium term. Government agrees that maintaining
this ceiling should not be done using across-the-board cuts. Government has carefully analysed current
expenditure trends to ensure that spending in priority areas is maintained, including the large poverty-
reduction and job-creation programmes. In national departmental budgets, major cuts have been limited to
non-essential goods and services, and provinces and municipalities have been encouraged to follow the
same approach in their budgets. In the event of a shortfall in revenue in 2015/16, further fiscal
consolidation will focus on poorly managed programmes.
Chapter 4: Equitable resourcing of schools for better outcomes
Education infrastructure grants
The FFC recommends that, “The allocation framework for education infrastructure conditional grants sets
out clear expenditure targets for quintile 1 to 3 schools and timelines for addressing priority infrastructure
backlogs in each quintile. The school infrastructure backlogs grant must also make provision for the
transitional asset handover process to school governing boards and provincial education departments on
newly built schools. This would address alignment between funding for non-physical inputs and physical
inputs, as well as curb the decay of newly constructed infrastructure.”
2015 BUDGET REVIEW
10
Government response
The aim of the school infrastructure backlogs grant is to replace unsafe school structures with
appropriately built ones. While government appreciates the FFC’s research into the appropriate
frameworks for such grants, a project list has already been established and projects are at various stages of
implementation. As a result, it is not feasible to shift schools on this project list on the basis of the quintiles
in which they fall without delaying the overall backlog reduction.
Government agrees on the importance of timelines for addressing infrastructure backlogs and ensuring that
schools have access to water, sanitation and electricity, and are built with appropriate and safe materials. In
2013, government published minimum norms and standards for school infrastructure, and provinces have
been given until 2016 for all schools to meet these standards.
Government’s focus on replacing, upgrading or rehabilitating existing schools to meet safety or basic
service standards, rather than building new schools, means the problem of poorly planned handovers is
largely avoided. However, government does acknowledge the risk, which is why the provincial education
department must be notified before a school is transferred onto its asset register. This ensures that there is a
current budget (for employees, learner materials and maintenance) so that the school is functional before
the start of the school year.
Chapter 5: Adequacy and efficiency in primary healthcare financing
Increase primary healthcare allocation levels in line with norms and standards
The FFC recommends that, “Provincial governments increase their allocation levels to primary healthcare
funding, to be in line with the minimum norms and standards for the primary healthcare package set by the
national Department of Health, in particular on clinic services such as integrated management of childhood
illnesses, reproductive health and HIV/AIDS.”
Further engagements with the FFC led to the clarification that this recommendation should be read as:
“The provincial equitable share or health conditional grants may need to increase or be re-allocated to take
account of provincial primary healthcare requirements set out by the national Department of Health. An
absence of such increased funding or revising the allocation method of current funding may result in norms
and standards, set by the national department, not being met adequately by the provincial departments with
service delivery suffering as a result.”
Government response
Government welcomes the suggestion that further work is needed to ensure primary healthcare funding is
sufficient and equitably allocated. However, the norms and standards referenced in the study were
published in 2000, so updated norms and standards are needed before increased funding or reallocation can
be considered. Government has recently taken steps to improve the functioning of primary healthcare
clinics through the ideal clinic initiative. The conditional health grants – together with departmental
budgets – are being aligned with this initiative. A reengineering of primary healthcare is also envisaged as
part of the national health insurance reforms, with emphasis shifting from a curative to a preventative
approach. Government continues to commit funds in this regard. For example, indirect national health
grant (national health insurance component) funds will be used to test contracting with health
professionals in the 10 national health insurance pilot districts.
Chapter 6: Impact of fiscal expenditure on food security
Better enforcement of agricultural grant conditions
The FFC recommends that, “The Department of Agriculture, Forestry and Fisheries strengthens its ability
to enforce the conditions in the grant framework to ensure better oversight of provinces, so that spending
and performance of the agricultural conditional grants can be improved. The Commission suggests that
norms and standards be developed to assess the performance of provinces and five-year evaluations of
conditional grants be institutionalised.”
ANNEXURE W1: EXPLANATORY MEMORANDUM TO THE DIVISION OF REVENUE
11
Government response
Government agrees that norms and standards should be developed to assess provincial performance.
Regarding the institutionalisation of the evaluation of agricultural conditional grants, government (via the
Department of Planning, Monitoring and Evaluation) is reviewing the comprehensive agricultural support
programme grant’s performance. The review report will be used as a basis to institutionalise evaluation
processes.
Review agricultural grants
The FFC recommends that, “The terms of reference for the committee to review the agricultural
conditional grants are finalised without unnecessary delays. The review should be comprehensive in scope
and should include assessing the value chain of conditional grants and unlocking operational constraints,
especially in relation to planning, procurement, comprehensive smallholder support, cash-flow and
monitoring and evaluation. Stakeholders such as the Department of Rural Development and Land Reform
should be invited to be part of the committee, and ways to streamline the funding overlap between the
Ilima/Letsema projects grant and the recapitalisation and development programme should be examined.”
Government response
Government agrees with the recommendation that this work is a priority and that overlaps between grants
are to be avoided. The Department of Agriculture, Forestry and Fisheries, the National Treasury and the
Department of Rural Development and Land Reform are discussing ways to streamline existing overlaps in
provincial grants.
Chapter 8: Improving public transport for better mobility
Develop a transport subsidy framework
The FFC recommends that, “The Department of Transport (the custodian of national transport policy)
formulates and implements a transport subsidy framework, which explicitly incorporates social welfare,
service productivity and environmental management, which are the three aspects endorsed by national
transport policy.”
Further discussions with the FFC led to the clarification that this recommendation should be read as: “The
development of a transport subsidy framework is crucial to effectively guiding the allocation of transport
conditional grants. The FFC study found that the existing public transport grants perpetuate the fragmented
transport planning processes and are not effective in achieving the goal of integrated public transport.
Therefore the consolidation of transport funding, allocated via the Division of Revenue Act, is required
and should be driven by a new transport subsidy framework.”
Government response
Government agrees that a more integrated approach to funding public transport and a transport subsidy
framework is required. It has begun taking steps in this regard – in the 2015 division of revenue, two of the
municipal public transport grants have been consolidated into a single grant and the framework for this
new public transport network grant includes a commitment for the national Department of Transport to
develop a draft public transport subsidy framework. The City Support Programme in the National Treasury
has undertaken to assist the Department of Transport in this regard.
Chapter 11: The impact of demarcations on municipal finances
Demarcation grant to affected municipalities
The FFC recommends that, “For every vertically decided demarcation process, government bears the
transitional costs of the restructuring. A transitional demarcation grant should be awarded to the
amalgamated municipality. This grant should be temporary and be awarded over at least three years (at
least a year before, the year of and the year after demarcation takes place). The purpose of the grant will be
to facilitate the restructuring process. This includes the following:
2015 BUDGET REVIEW
12
a. Planning and preparing an amalgamated municipality’s delivery model, e.g. combining the delivery
models of individual municipalities.
b. Rationalising and harmonising policy regimes, integrated development plans and bylaws of different
municipalities.
c. Rationalising tariffs.
d. Rationalising employment policies and other human resources systems (grading of workers and job
evaluation processes).
e. Rationalising and harmonising evaluation rolls and asset registers.
f. Building capacity to deal with change management.
g. Facilitating communication about the demarcation.”
Government response
Government agrees that major boundary changes can be costly for affected municipalities. The Select
Committee on Appropriations has also recommended in its report on the 2014 Division of Revenue Bill
that funding be allocated to provide for these costs. As such, government is proposing a municipal
demarcation transition grant for the demarcation changes that will come into effect after the 2016 local
government elections. Rather than unconditionally funding every cost associated with changed
demarcations, government proposes that the following principles should be applied:
a. Only major re-demarcations should be eligible for funding (for example, amalgamations).
b. Only administrative costs directly related to the change in demarcations can be funded (for example,
upgrading service levels should not qualify).
c. A differentiated approach should be applied, so that municipalities with larger own-revenue capacity
are expected to fund more of the re-demarcation costs themselves.
d. Benefits and efficiencies that can be gained as a result of the new demarcations should also be taken
into account in determining allocations for support.
e. Funds should be allocated for a maximum of one year before the boundary change (for planning and
preparation costs only) and for two years following the change.
Government has consulted relevant stakeholders and used research by the FFC and SALGA to assist in the
costing of such a grant. Based on this research and the above principles, government has introduced a grant
worth R139 million over the MTEF period, with R39 million transferred in 2015/16 to 21 municipalities
for preparatory costs. In 2016/17 and 2017/18, R50 million per year will be transferred to the 10 new
municipalities.
Part 4: Provincial allocations
Sections 214 and 227 of the Constitution require that an equitable share of nationally raised revenue be
allocated to provincial government to enable it to provide basic services and perform its allocated
functions.
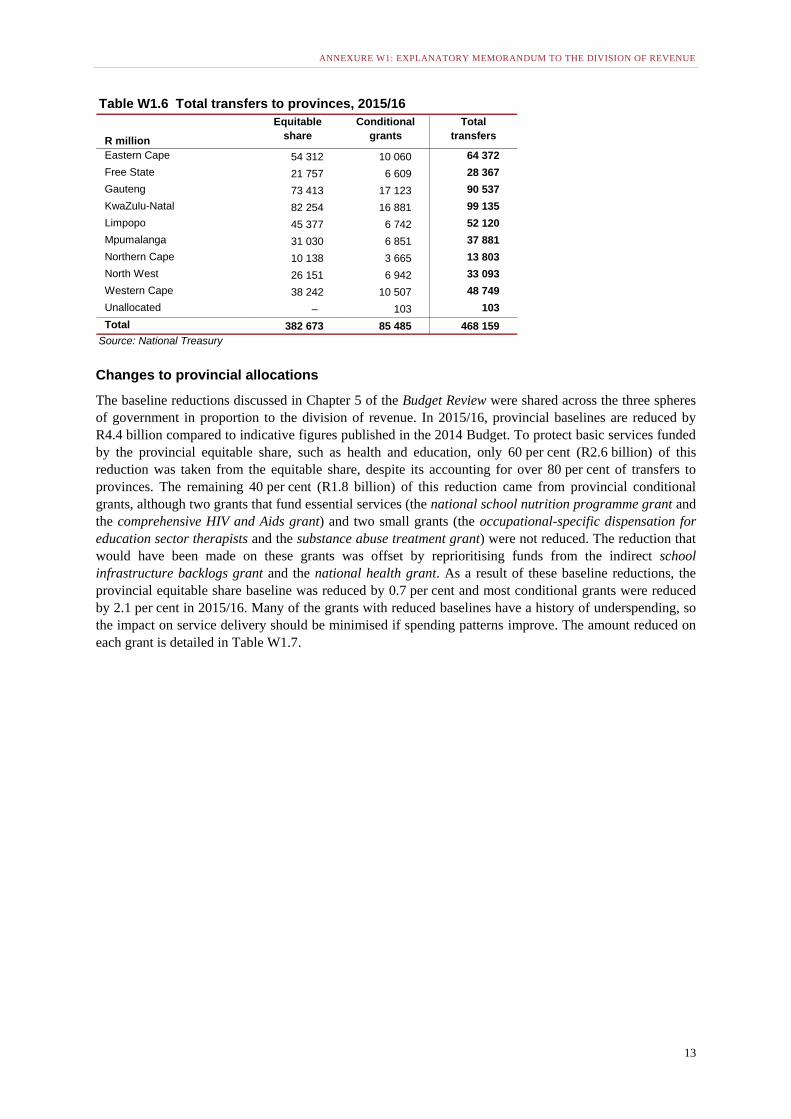
National transfers to provinces increase from R439.7 billion in 2014/15 to R468.2 billion in 2015/16. Over
the MTEF period, provincial transfers will grow at an average annual rate of 6.2 per cent to R526.4 billion
in 2017/18. Table W1.6 sets out the total transfers to provinces for 2015/16. A total of R382.7 billion is
allocated to the provincial equitable share and R85.5 billion to conditional grants, which includes an
unallocated R100 million for the provincial disaster grant, but excludes indirect transfers of R3.5 billion.
ANNEXURE W1: EXPLANATORY MEMORANDUM TO THE DIVISION OF REVENUE
13
Changes to provincial allocations
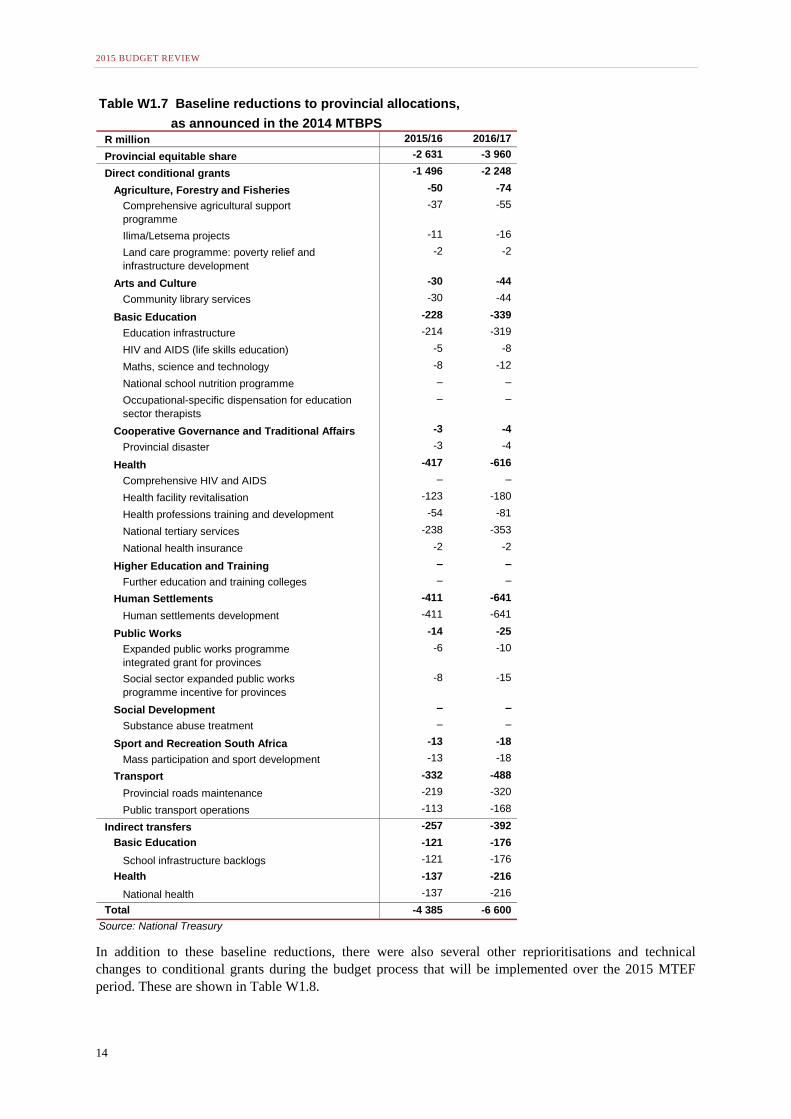
The baseline reductions discussed in Chapter 5 of the Budget Review were shared across the three spheres
of government in proportion to the division of revenue. In 2015/16, provincial baselines are reduced by
R4.4 billion compared to indicative figures published in the 2014 Budget. To protect basic services funded
by the provincial equitable share, such as health and education, only 60 per cent (R2.6 billion) of this
reduction was taken from the equitable share, despite its accounting for over 80 per cent of transfers to
provinces. The remaining 40 per cent (R1.8 billion) of this reduction came from provincial conditional
grants, although two grants that fund essential services (the national school nutrition programme grant and
the comprehensive HIV and Aids grant) and two small grants (the occupational-specific dispensation for
education sector therapists and the substance abuse treatment grant) were not reduced. The reduction that
would have been made on these grants was offset by reprioritising funds from the indirect school
infrastructure backlogs grant and the national health grant. As a result of these baseline reductions, the
provincial equitable share baseline was reduced by 0.7 per cent and most conditional grants were reduced
by 2.1 per cent in 2015/16. Many of the grants with reduced baselines have a history of underspending, so
the impact on service delivery should be minimised if spending patterns improve. The amount reduced on
each grant is detailed in Table W1.7.
Table W1.6 Total transfers to provinces, 2015/16
R million
Equitable
share
Conditional
grants
Total
transfers
Eastern Cape 54 312 10 060 64 372
Free State 21 757 6 609 28 367
Gauteng 73 413 17 123 90 537
KwaZulu-Natal 82 254 16 881 99 135
Limpopo 45 377 6 742 52 120
Mpumalanga 31 030 6 851 37 881
Northern Cape 10 138 3 665 13 803
North West 26 151 6 942 33 093
Western Cape 38 242 10 507 48 749
Unallocated – 103 103
Total 382 673 85 485 468 159
Source: National Treasury
2015 BUDGET REVIEW
14
In addition to these baseline reductions, there were also several other reprioritisations and technical
changes to conditional grants during the budget process that will be implemented over the 2015 MTEF
period. These are shown in Table W1.8.
Table W1.7 Baseline reductions to provincial allocations,
as announced in the 2014 MTBPSR million 2015/16 2016/17
Provincial equitable share -2 631 -3 960
Direct conditional grants -1 496 -2 248
Agriculture, Forestry and Fisheries -50 -74
Comprehensive agricultural support
programme
-37 -55
Ilima/Letsema projects -11 -16
Land care programme: poverty relief and
infrastructure development
-2 -2
Arts and Culture -30 -44
Community library services -30 -44
Basic Education -228 -339
Education infrastructure -214 -319
HIV and AIDS (life skills education) -5 -8
Maths, science and technology -8 -12
National school nutrition programme – –
Occupational-specific dispensation for education
sector therapists
– –
Cooperative Governance and Traditional Affairs -3 -4
Provincial disaster -3 -4
Health -417 -616
Comprehensive HIV and AIDS – –
Health facility revitalisation -123 -180
Health professions training and development -54 -81
National tertiary services -238 -353
National health insurance -2 -2
Higher Education and Training – –
Further education and training colleges – –
Human Settlements -411 -641
Human settlements development -411 -641
Public Works -14 -25
Expanded public works programme
integrated grant for provinces
-6 -10
Social sector expanded public works
programme incentive for provinces
-8 -15
Social Development – –
Substance abuse treatment – –
Sport and Recreation South Africa -13 -18
Mass participation and sport development -13 -18
Transport -332 -488
Provincial roads maintenance -219 -320
Public transport operations -113 -168
Indirect transfers -257 -392
Basic Education -121 -176
School infrastructure backlogs -121 -176
Health -137 -216
National health -137 -216
Total -4 385 -6 600
Source: National Treasury
ANNEXURE W1: EXPLANATORY MEMORANDUM TO THE DIVISION OF REVENUE
15
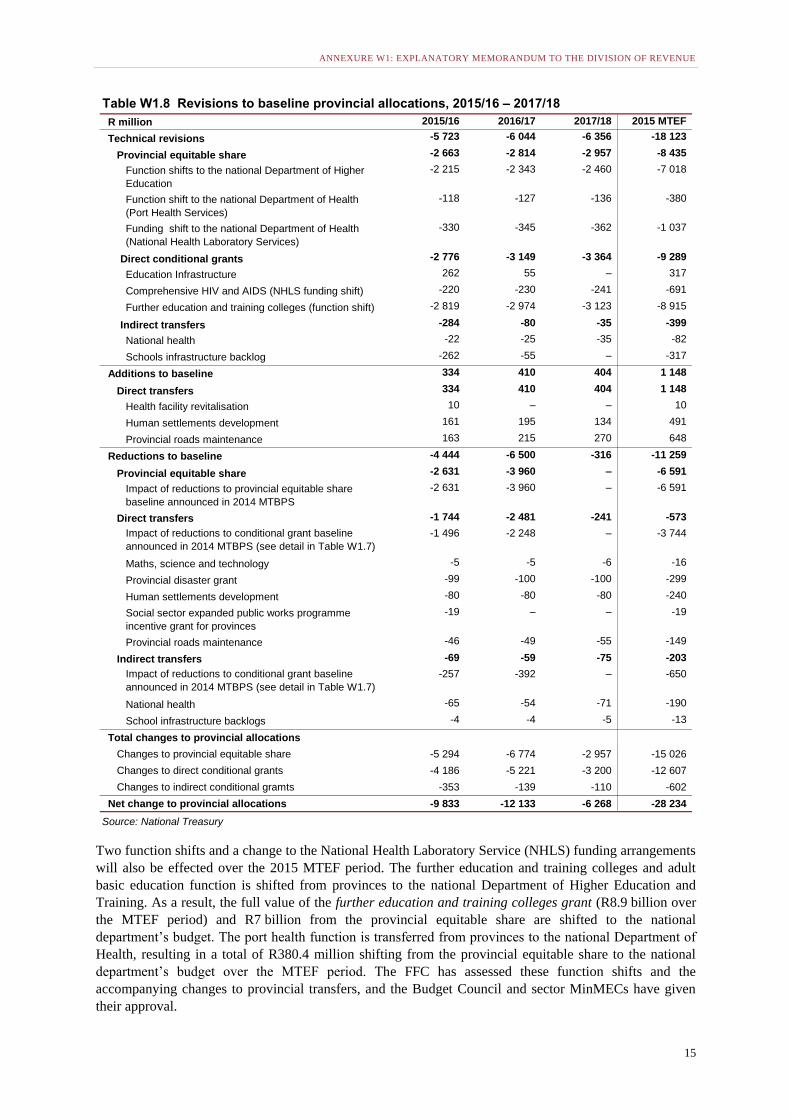
Two function shifts and a change to the National Health Laboratory Service (NHLS) funding arrangements
will also be effected over the 2015 MTEF period. The further education and training colleges and adult
basic education function is shifted from provinces to the national Department of Higher Education and
Training. As a result, the full value of the further education and training colleges grant (R8.9 billion over
the MTEF period) and R7 billion from the provincial equitable share are shifted to the national
department’s budget. The port health function is transferred from provinces to the national Department of
Health, resulting in a total of R380.4 million shifting from the provincial equitable share to the national
department’s budget over the MTEF period. The FFC has assessed these function shifts and the
accompanying changes to provincial transfers, and the Budget Council and sector MinMECs have given
their approval.
Table W1.8 Revisions to baseline provincial allocations, 2015/16 – 2017/18
R million 2015/16 2016/17 2017/18 2015 MTEF
Technical revisions -5 723 -6 044 -6 356 -18 123
Provincial equitable share -2 663 -2 814 -2 957 -8 435
Function shifts to the national Department of Higher
Education
-2 215 -2 343 -2 460 -7 018
Function shift to the national Department of Health
(Port Health Services)
-118 -127 -136 -380
Funding shift to the national Department of Health
(National Health Laboratory Services)
-330 -345 -362 -1 037
Direct conditional grants -2 776 -3 149 -3 364 -9 289
Education Infrastructure 262 55 – 317
Comprehensive HIV and AIDS (NHLS funding shift) -220 -230 -241 -691
Further education and training colleges (function shift) -2 819 -2 974 -3 123 -8 915
Indirect transfers -284 -80 -35 -399
National health -22 -25 -35 -82
Schools infrastructure backlog -262 -55 – -317
Additions to baseline 334 410 404 1 148
Direct transfers 334 410 404 1 148
Health facility revitalisation 10 – – 10
Human settlements development 161 195 134 491
Provincial roads maintenance 163 215 270 648
Reductions to baseline -4 444 -6 500 -316 -11 259
Provincial equitable share -2 631 -3 960 – -6 591
Impact of reductions to provincial equitable share
baseline announced in 2014 MTBPS
-2 631 -3 960 – -6 591
Direct transfers -1 744 -2 481 -241 -573
Impact of reductions to conditional grant baseline
announced in 2014 MTBPS (see detail in Table W1.7)
-1 496 -2 248 – -3 744
Maths, science and technology -5 -5 -6 -16
Provincial disaster grant -99 -100 -100 -299
Human settlements development -80 -80 -80 -240
Social sector expanded public works programme
incentive grant for provinces
-19 – – -19
Provincial roads maintenance -46 -49 -55 -149
Indirect transfers -69 -59 -75 -203
Impact of reductions to conditional grant baseline
announced in 2014 MTBPS (see detail in Table W1.7)
-257 -392 – -650
National health -65 -54 -71 -190
School infrastructure backlogs -4 -4 -5 -13
Total changes to provincial allocations
Changes to provincial equitable share -5 294 -6 774 -2 957 -15 026
Changes to direct conditional grants -4 186 -5 221 -3 200 -12 607
Changes to indirect conditional gramts -353 -139 -110 -602
Net change to provincial allocations -9 833 -12 133 -6 268 -28 234
Source: National Treasury
2015 BUDGET REVIEW
16
The NHLS funding arrangements are being amended so that national functions for training and research
are funded directly by the national Department of Health from 2015/16, and no longer paid for through
fees charged to provinces for NHLS services. To ensure this change does not affect provincial budgets, the
fees charged for NHLS services will be reduced to offset the funds taken out of the provincial equitable
share and the comprehensive HIV and Aids grant. Over the 2015 MTEF period, the provincial equitable
share will be reduced by R1 billion. The comprehensive HIV and AIDS grant will be reduced by
R691.2 million. These funds will be allocated to the national department for the NHLS’s national
functions. The Budget Council has agreed to this arrangement and an audit will be conducted after the first
year to ensure that the change is revenue-neutral for provinces.
After accounting for the reductions and function shifts, net revisions to the provincial direct and indirect
allocations amount to a reduction of R10.1 billion in 2015/16 and R12.5 billion in 2016/17.
The provincial equitable share
The equitable share is the main source of revenue for meeting provincial expenditure responsibilities. To
ensure that allocations are fair, the equitable share is allocated through a formula using objective data on
the context and demand for services in each of the nine provinces. The revisions due to function shifts in
health and higher education and the change in NHLS funding arrangements reduce the provincial equitable
share by R5.3 billion in 2015/16, R6.8 billion in 2016/17 and R3 billion in 2017/18. This brings the
equitable share allocations to R382.7 billion, R405.3 billion and R428.9 billion respectively for each year
of the 2015 MTEF period. These revisions result in the provincial equitable share increasing by
6.3 per cent between 2014/15 and 2015/16, and growing at an average annual rate of 6 per cent over the
MTEF period.
Allocations calculated outside the equitable share formula
The equitable share includes an amount of R2.3 billion in 2015/16 that was previously part of the
devolution of property rate funds grant. This grant, which funded provinces to pay municipal charges on
provincial properties that were previously administered by national government, has been transferred as
part of the provincial equitable share since 2013/14. These funds are still allocated to provinces in the same
proportions as the former grant, but from 2016/17 they will be allocated using the provincial equitable
share formula.
Over the 2015 MTEF period, the amounts taken out of the provincial equitable share to implement the
change in the NHLS’s funding arrangements will be subtracted from each province’s allocation in
proportion to their share of the formula’s health component.
The equitable share formula
The provincial equitable share formula is reviewed and updated with new data annually. For the
2015 MTEF, the formula has been updated with data from the 2014 mid-year population estimates
published by Statistics South Africa; the 2014 preliminary data published by the Department of Basic
Education on school enrolment; data from the 2013 General Household Survey for medical aid coverage;
and data from the health sector and the Risk Equalisation Fund for the risk-adjusted capitation index.
Because the formula is largely population-driven, the allocations capture shifts in population across
provinces, which results in changes in the relative demand for public services across these areas. The effect
of these updates on the provincial equitable share is phased in over three years (2015/16 to 2017/18).
Full impact of data updates on the provincial equitable share
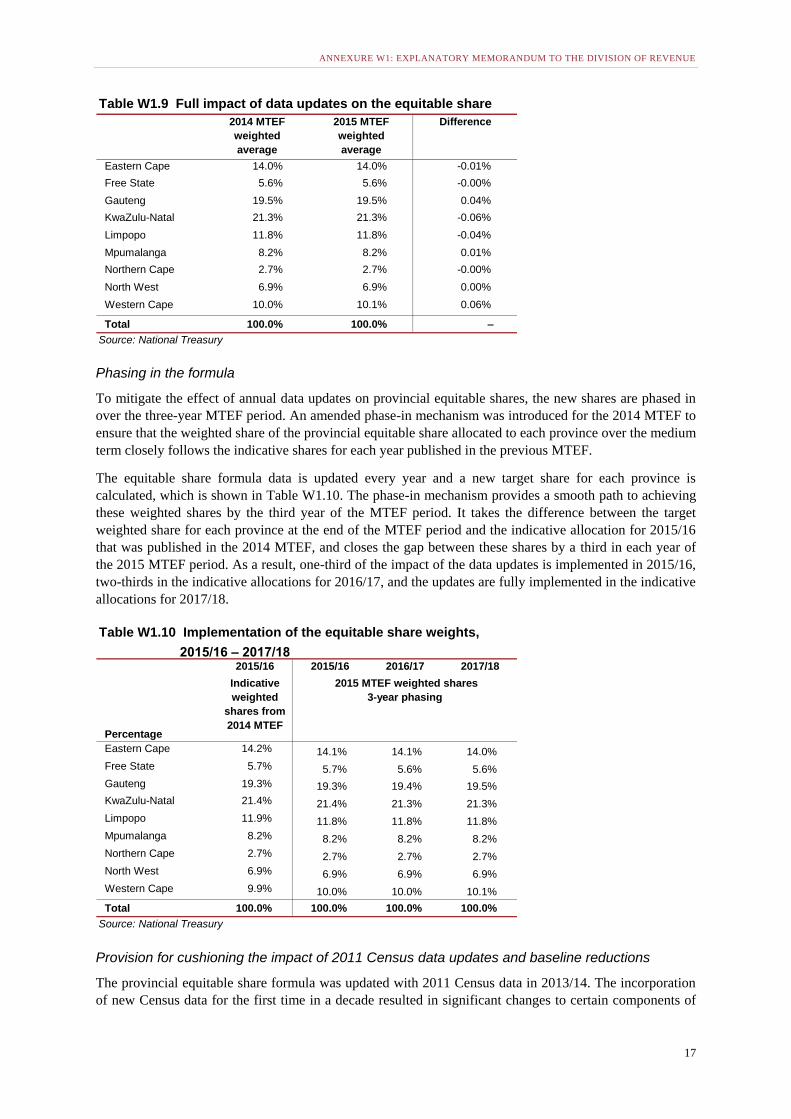
Table W1.9 shows the full impact of the data updates on the provincial equitable share per province. It
compares the target shares for the 2014 and 2015 MTEF periods. The details of how the data updates affect
each component of the formula are described in detail in the subsections below.
ANNEXURE W1: EXPLANATORY MEMORANDUM TO THE DIVISION OF REVENUE
17
Phasing in the formula
To mitigate the effect of annual data updates on provincial equitable shares, the new shares are phased in
over the three-year MTEF period. An amended phase-in mechanism was introduced for the 2014 MTEF to
ensure that the weighted share of the provincial equitable share allocated to each province over the medium
term closely follows the indicative shares for each year published in the previous MTEF.
The equitable share formula data is updated every year and a new target share for each province is
calculated, which is shown in Table W1.10. The phase-in mechanism provides a smooth path to achieving
these weighted shares by the third year of the MTEF period. It takes the difference between the target
weighted share for each province at the end of the MTEF period and the indicative allocation for 2015/16
that was published in the 2014 MTEF, and closes the gap between these shares by a third in each year of
the 2015 MTEF period. As a result, one-third of the impact of the data updates is implemented in 2015/16,
two-thirds in the indicative allocations for 2016/17, and the updates are fully implemented in the indicative
allocations for 2017/18.
Provision for cushioning the impact of 2011 Census data updates and baseline reductions
The provincial equitable share formula was updated with 2011 Census data in 2013/14. The incorporation
of new Census data for the first time in a decade resulted in significant changes to certain components of
Table W1.9 Full impact of data updates on the equitable share
2014 MTEF
weighted
average
2015 MTEF
weighted
average
Difference
Eastern Cape 14.0% 14.0% -0.01%
Free State 5.6% 5.6% -0.00%
Gauteng 19.5% 19.5% 0.04%
KwaZulu-Natal 21.3% 21.3% -0.06%
Limpopo 11.8% 11.8% -0.04%
Mpumalanga 8.2% 8.2% 0.01%
Northern Cape 2.7% 2.7% -0.00%
North West 6.9% 6.9% 0.00%
Western Cape 10.0% 10.1% 0.06%
Total 100.0% 100.0% –
Source: National Treasury
Table W1.10 Implementation of the equitable share weights,
2015/16 – 2017/182015/16 2015/16 2016/17 2017/18
Percentage
Eastern Cape 14.2% 14.1% 14.1% 14.0%
Free State 5.7% 5.7% 5.6% 5.6%
Gauteng 19.3% 19.3% 19.4% 19.5%
KwaZulu-Natal 21.4% 21.4% 21.3% 21.3%
Limpopo 11.9% 11.8% 11.8% 11.8%
Mpumalanga 8.2% 8.2% 8.2% 8.2%
Northern Cape 2.7% 2.7% 2.7% 2.7%
North West 6.9% 6.9% 6.9% 6.9%
Western Cape 9.9% 10.0% 10.0% 10.1%
Total 100.0% 100.0% 100.0% 100.0%
Source: National Treasury
Indicative
weighted
shares from
2014 MTEF
2015 MTEF weighted shares
3-year phasing
2015 BUDGET REVIEW
18
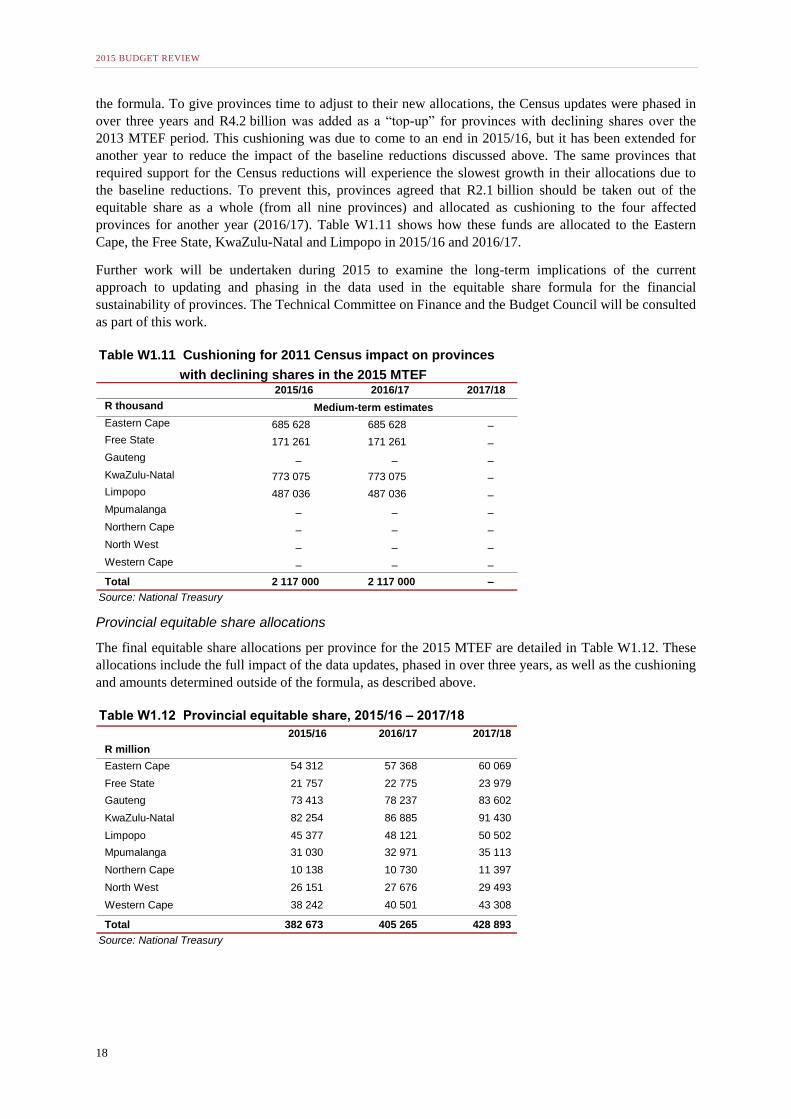
the formula. To give provinces time to adjust to their new allocations, the Census updates were phased in
over three years and R4.2 billion was added as a “top-up” for provinces with declining shares over the
2013 MTEF period. This cushioning was due to come to an end in 2015/16, but it has been extended for
another year to reduce the impact of the baseline reductions discussed above. The same provinces that
required support for the Census reductions will experience the slowest growth in their allocations due to
the baseline reductions. To prevent this, provinces agreed that R2.1 billion should be taken out of the
equitable share as a whole (from all nine provinces) and allocated as cushioning to the four affected
provinces for another year (2016/17). Table W1.11 shows how these funds are allocated to the Eastern
Cape, the Free State, KwaZulu-Natal and Limpopo in 2015/16 and 2016/17.
Further work will be undertaken during 2015 to examine the long-term implications of the current
approach to updating and phasing in the data used in the equitable share formula for the financial
sustainability of provinces. The Technical Committee on Finance and the Budget Council will be consulted
as part of this work.
Provincial equitable share allocations
The final equitable share allocations per province for the 2015 MTEF are detailed in Table W1.12. These
allocations include the full impact of the data updates, phased in over three years, as well as the cushioning
and amounts determined outside of the formula, as described above.
Table W1.11 Cushioning for 2011 Census impact on provinces
with declining shares in the 2015 MTEF2015/16 2016/17 2017/18
R thousand Medium-term estimates
Eastern Cape 685 628 685 628 –
Free State 171 261 171 261 –
Gauteng – – –
KwaZulu-Natal 773 075 773 075 –
Limpopo 487 036 487 036 –
Mpumalanga – – –
Northern Cape – – –
North West – – –
Western Cape – – –
Total 2 117 000 2 117 000 –
Source: National Treasury
Table W1.12 Provincial equitable share, 2015/16 – 2017/18
2015/16 2016/17 2017/18
R million
Eastern Cape 54 312 57 368 60 069
Free State 21 757 22 775 23 979
Gauteng 73 413 78 237 83 602
KwaZulu-Natal 82 254 86 885 91 430
Limpopo 45 377 48 121 50 502
Mpumalanga 31 030 32 971 35 113
Northern Cape 10 138 10 730 11 397
North West 26 151 27 676 29 493
Western Cape 38 242 40 501 43 308
Total 382 673 405 265 428 893
Source: National Treasury
ANNEXURE W1: EXPLANATORY MEMORANDUM TO THE DIVISION OF REVENUE
19
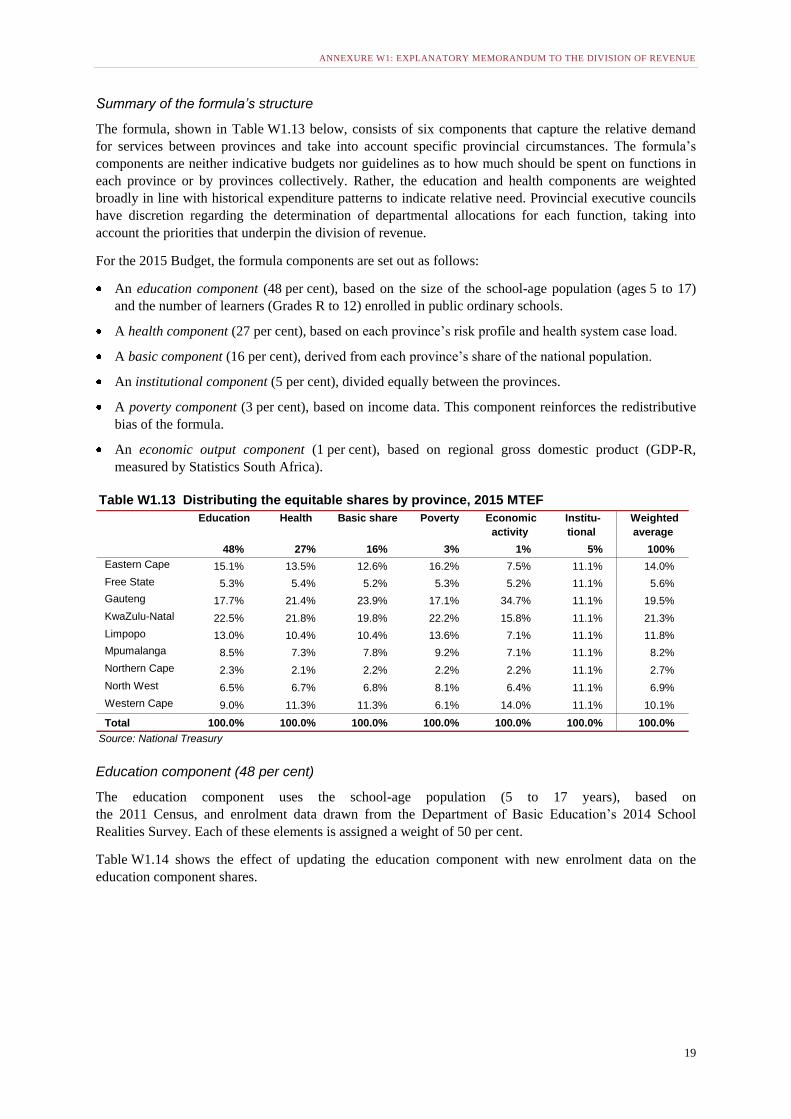
Summary of the formula’s structure
The formula, shown in Table W1.13 below, consists of six components that capture the relative demand
for services between provinces and take into account specific provincial circumstances. The formula’s
components are neither indicative budgets nor guidelines as to how much should be spent on functions in
each province or by provinces collectively. Rather, the education and health components are weighted
broadly in line with historical expenditure patterns to indicate relative need. Provincial executive councils
have discretion regarding the determination of departmental allocations for each function, taking into
account the priorities that underpin the division of revenue.
For the 2015 Budget, the formula components are set out as follows:
An education component (48 per cent), based on the size of the school-age population (ages 5 to 17)
and the number of learners (Grades R to 12) enrolled in public ordinary schools.
A health component (27 per cent), based on each province’s risk profile and health system case load.
A basic component (16 per cent), derived from each province’s share of the national population.
An institutional component (5 per cent), divided equally between the provinces.
A poverty component (3 per cent), based on income data. This component reinforces the redistributive
bias of the formula.
An economic output component (1 per cent), based on regional gross domestic product (GDP-R,
measured by Statistics South Africa).
Education component (48 per cent)
The education component uses the school-age population (5 to 17 years), based on
the 2011 Census, and enrolment data drawn from the Department of Basic Education’s 2014 School
Realities Survey. Each of these elements is assigned a weight of 50 per cent.
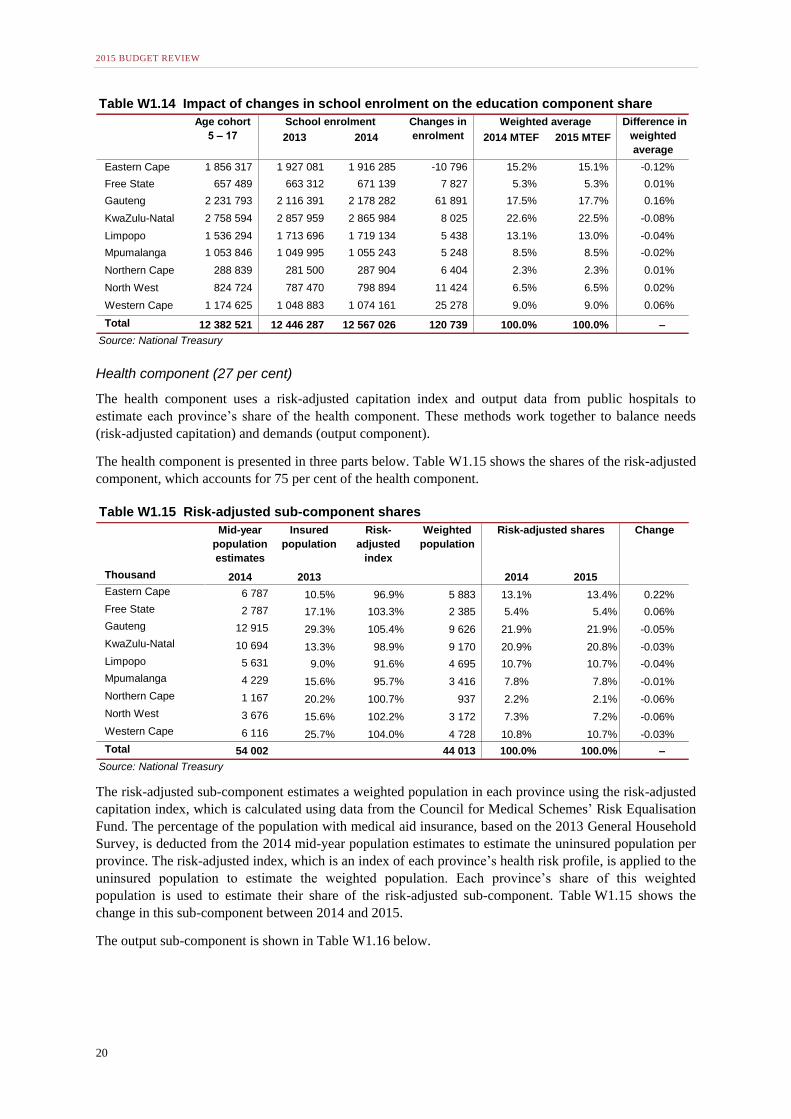
Table W1.14 shows the effect of updating the education component with new enrolment data on the
education component shares.
Table W1.13 Distributing the equitable shares by province, 2015 MTEF
Education Health Basic share Poverty Economic
activity
Institu-
tional
Weighted
average
48% 27% 16% 3% 1% 5% 100%
Eastern Cape 15.1% 13.5% 12.6% 16.2% 7.5% 11.1% 14.0%
Free State 5.3% 5.4% 5.2% 5.3% 5.2% 11.1% 5.6%
Gauteng 17.7% 21.4% 23.9% 17.1% 34.7% 11.1% 19.5%
KwaZulu-Natal 22.5% 21.8% 19.8% 22.2% 15.8% 11.1% 21.3%
Limpopo 13.0% 10.4% 10.4% 13.6% 7.1% 11.1% 11.8%
Mpumalanga 8.5% 7.3% 7.8% 9.2% 7.1% 11.1% 8.2%
Northern Cape 2.3% 2.1% 2.2% 2.2% 2.2% 11.1% 2.7%
North West 6.5% 6.7% 6.8% 8.1% 6.4% 11.1% 6.9%
Western Cape 9.0% 11.3% 11.3% 6.1% 14.0% 11.1% 10.1%
Total 100.0% 100.0% 100.0% 100.0% 100.0% 100.0% 100.0%
Source: National Treasury
2015 BUDGET REVIEW
20
Health component (27 per cent)
The health component uses a risk-adjusted capitation index and output data from public hospitals to
estimate each province’s share of the health component. These methods work together to balance needs
(risk-adjusted capitation) and demands (output component).
The health component is presented in three parts below. Table W1.15 shows the shares of the risk-adjusted
component, which accounts for 75 per cent of the health component.
The risk-adjusted sub-component estimates a weighted population in each province using the risk-adjusted
capitation index, which is calculated using data from the Council for Medical Schemes’ Risk Equalisation
Fund. The percentage of the population with medical aid insurance, based on the 2013 General Household
Survey, is deducted from the 2014 mid-year population estimates to estimate the uninsured population per
province. The risk-adjusted index, which is an index of each province’s health risk profile, is applied to the
uninsured population to estimate the weighted population. Each province’s share of this weighted
population is used to estimate their share of the risk-adjusted sub-component. Table W1.15 shows the
change in this sub-component between 2014 and 2015.
The output sub-component is shown in Table W1.16 below.
Table W1.14 Impact of changes in school enrolment on the education component share
2013 2014 2014 MTEF 2015 MTEF
Eastern Cape 1 856 317 1 927 081 1 916 285 -10 796 15.2% 15.1% -0.12%
Free State 657 489 663 312 671 139 7 827 5.3% 5.3% 0.01%
Gauteng 2 231 793 2 116 391 2 178 282 61 891 17.5% 17.7% 0.16%
KwaZulu-Natal 2 758 594 2 857 959 2 865 984 8 025 22.6% 22.5% -0.08%
Limpopo 1 536 294 1 713 696 1 719 134 5 438 13.1% 13.0% -0.04%
Mpumalanga 1 053 846 1 049 995 1 055 243 5 248 8.5% 8.5% -0.02%
Northern Cape 288 839 281 500 287 904 6 404 2.3% 2.3% 0.01%
North West 824 724 787 470 798 894 11 424 6.5% 6.5% 0.02%
Western Cape 1 174 625 1 048 883 1 074 161 25 278 9.0% 9.0% 0.06%
Total 12 382 521 12 446 287 12 567 026 120 739 100.0% 100.0% –
Source: National Treasury
Difference in
weighted
average
Age cohort
5 – 17
School enrolment Changes in
enrolment
Weighted average
Table W1.15 Risk-adjusted sub-component shares
Mid-year
population
estimates
Insured
population
Risk-
adjusted
index
Weighted
population
Risk-adjusted shares Change
Thousand 2014 2013 2014 2015
Eastern Cape 6 787 10.5% 96.9% 5 883 13.1% 13.4% 0.22%
Free State 2 787 17.1% 103.3% 2 385 5.4% 5.4% 0.06%
Gauteng 12 915 29.3% 105.4% 9 626 21.9% 21.9% -0.05%
KwaZulu-Natal 10 694 13.3% 98.9% 9 170 20.9% 20.8% -0.03%
Limpopo 5 631 9.0% 91.6% 4 695 10.7% 10.7% -0.04%
Mpumalanga 4 229 15.6% 95.7% 3 416 7.8% 7.8% -0.01%
Northern Cape 1 167 20.2% 100.7% 937 2.2% 2.1% -0.06%
North West 3 676 15.6% 102.2% 3 172 7.3% 7.2% -0.06%
Western Cape 6 116 25.7% 104.0% 4 728 10.8% 10.7% -0.03%
Total 54 002 44 013 100.0% 100.0% –
Source: National Treasury
ANNEXURE W1: EXPLANATORY MEMORANDUM TO THE DIVISION OF REVENUE
21
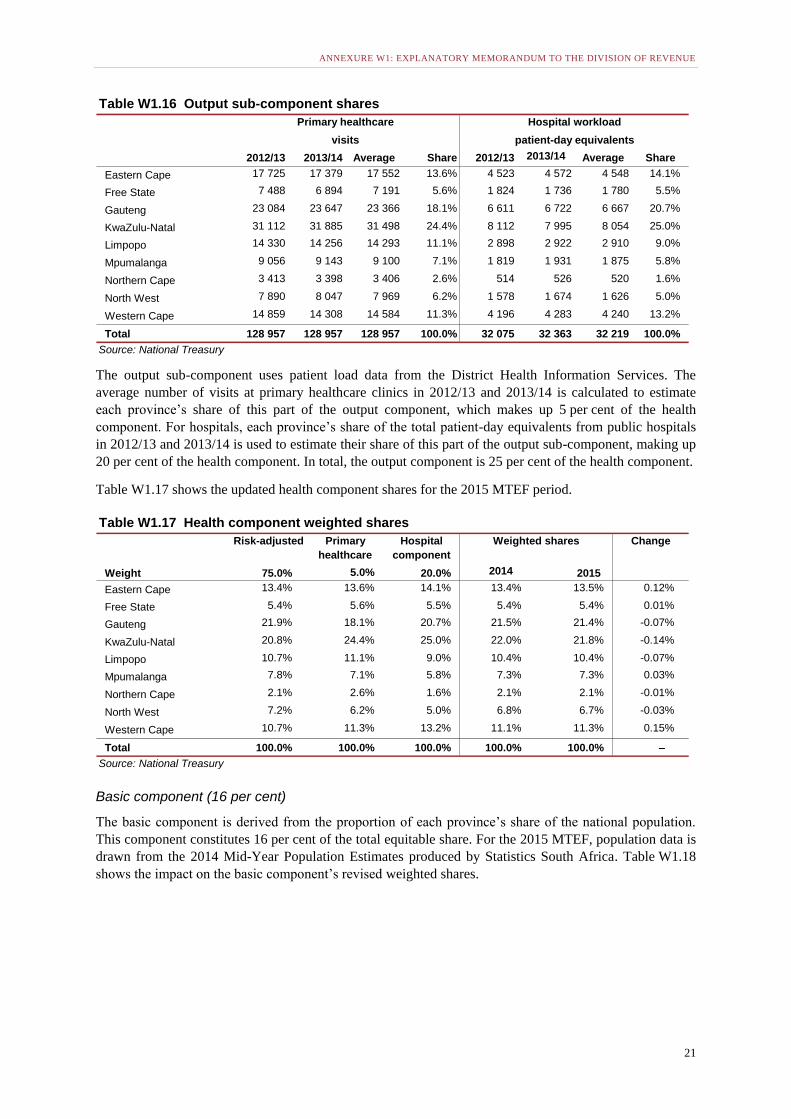
The output sub-component uses patient load data from the District Health Information Services. The
average number of visits at primary healthcare clinics in 2012/13 and 2013/14 is calculated to estimate
each province’s share of this part of the output component, which makes up 5 per cent of the health
component. For hospitals, each province’s share of the total patient-day equivalents from public hospitals
in 2012/13 and 2013/14 is used to estimate their share of this part of the output sub-component, making up
20 per cent of the health component. In total, the output component is 25 per cent of the health component.
Table W1.17 shows the updated health component shares for the 2015 MTEF period.
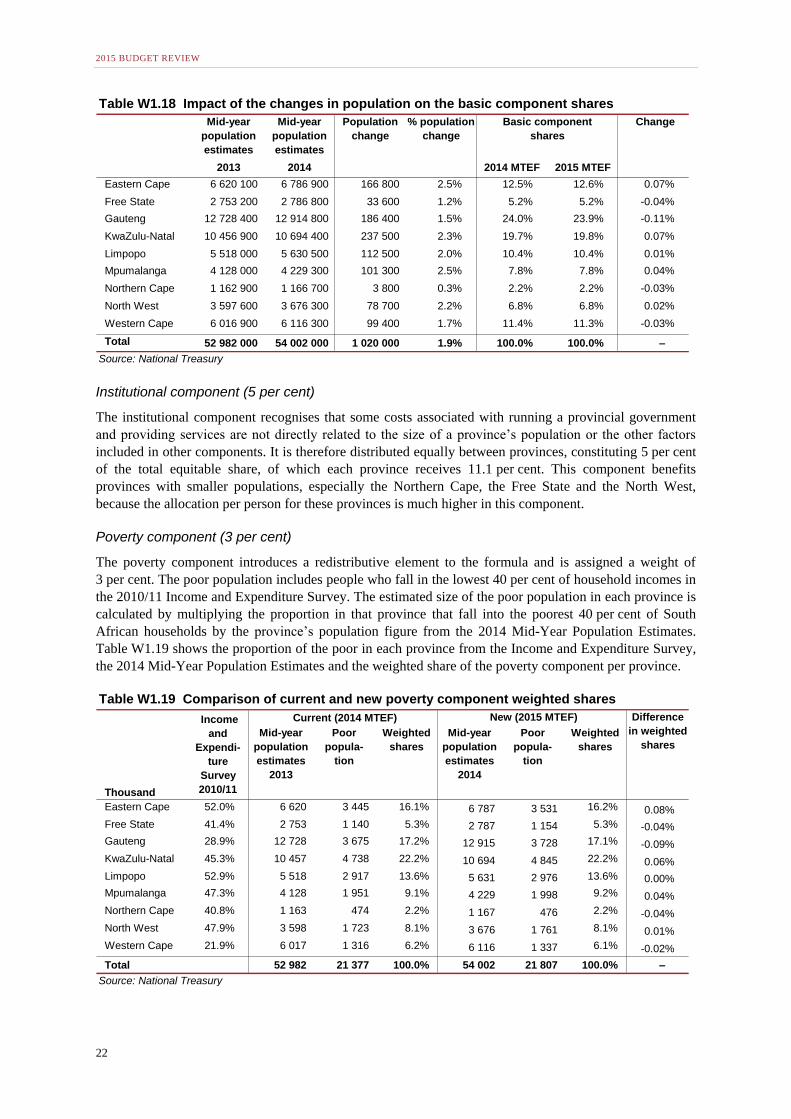
Basic component (16 per cent)
The basic component is derived from the proportion of each province’s share of the national population.
This component constitutes 16 per cent of the total equitable share. For the 2015 MTEF, population data is
drawn from the 2014 Mid-Year Population Estimates produced by Statistics South Africa. Table W1.18
shows the impact on the basic component’s revised weighted shares.
Table W1.16 Output sub-component shares
Primary healthcare Hospital workload
visits patient-day equivalents
2012/13 2013/14 Average Share 2012/13 2013/14 Average Share
Eastern Cape 17 725 17 379 17 552 13.6% 4 523 4 572 4 548 14.1%
Free State 7 488 6 894 7 191 5.6% 1 824 1 736 1 780 5.5%
Gauteng 23 084 23 647 23 366 18.1% 6 611 6 722 6 667 20.7%
KwaZulu-Natal 31 112 31 885 31 498 24.4% 8 112 7 995 8 054 25.0%
Limpopo 14 330 14 256 14 293 11.1% 2 898 2 922 2 910 9.0%
Mpumalanga 9 056 9 143 9 100 7.1% 1 819 1 931 1 875 5.8%
Northern Cape 3 413 3 398 3 406 2.6% 514 526 520 1.6%
North West 7 890 8 047 7 969 6.2% 1 578 1 674 1 626 5.0%
Western Cape 14 859 14 308 14 584 11.3% 4 196 4 283 4 240 13.2%
Total 128 957 128 957 128 957 100.0% 32 075 32 363 32 219 100.0%
Source: National Treasury
Table W1.17 Health component weighted shares
Risk-adjusted Primary
healthcare
Hospital
component
Weighted shares Change
Weight 75.0% 5.0% 20.0% 2014 2015
Eastern Cape 13.4% 13.6% 14.1% 13.4% 13.5% 0.12%
Free State 5.4% 5.6% 5.5% 5.4% 5.4% 0.01%
Gauteng 21.9% 18.1% 20.7% 21.5% 21.4% -0.07%
KwaZulu-Natal 20.8% 24.4% 25.0% 22.0% 21.8% -0.14%
Limpopo 10.7% 11.1% 9.0% 10.4% 10.4% -0.07%
Mpumalanga 7.8% 7.1% 5.8% 7.3% 7.3% 0.03%
Northern Cape 2.1% 2.6% 1.6% 2.1% 2.1% -0.01%
North West 7.2% 6.2% 5.0% 6.8% 6.7% -0.03%
Western Cape 10.7% 11.3% 13.2% 11.1% 11.3% 0.15%
Total 100.0% 100.0% 100.0% 100.0% 100.0% –
Source: National Treasury
2015 BUDGET REVIEW
22
Institutional component (5 per cent)
The institutional component recognises that some costs associated with running a provincial government
and providing services are not directly related to the size of a province’s population or the other factors
included in other components. It is therefore distributed equally between provinces, constituting 5 per cent
of the total equitable share, of which each province receives 11.1 per cent. This component benefits
provinces with smaller populations, especially the Northern Cape, the Free State and the North West,
because the allocation per person for these provinces is much higher in this component.
Poverty component (3 per cent)
The poverty component introduces a redistributive element to the formula and is assigned a weight of
3 per cent. The poor population includes people who fall in the lowest 40 per cent of household incomes in
the 2010/11 Income and Expenditure Survey. The estimated size of the poor population in each province is
calculated by multiplying the proportion in that province that fall into the poorest 40 per cent of South
African households by the province’s population figure from the 2014 Mid-Year Population Estimates.
Table W1.19 shows the proportion of the poor in each province from the Income and Expenditure Survey,
the 2014 Mid-Year Population Estimates and the weighted share of the poverty component per province.
Table W1.18 Impact of the changes in population on the basic component shares
Mid-year
population
estimates
Mid-year
population
estimates
Population
change
% population
change
Change
2013 2014 2014 MTEF 2015 MTEF
Eastern Cape 6 620 100 6 786 900 166 800 2.5% 12.5% 12.6% 0.07%
Free State 2 753 200 2 786 800 33 600 1.2% 5.2% 5.2% -0.04%
Gauteng 12 728 400 12 914 800 186 400 1.5% 24.0% 23.9% -0.11%
KwaZulu-Natal 10 456 900 10 694 400 237 500 2.3% 19.7% 19.8% 0.07%
Limpopo 5 518 000 5 630 500 112 500 2.0% 10.4% 10.4% 0.01%
Mpumalanga 4 128 000 4 229 300 101 300 2.5% 7.8% 7.8% 0.04%
Northern Cape 1 162 900 1 166 700 3 800 0.3% 2.2% 2.2% -0.03%
North West 3 597 600 3 676 300 78 700 2.2% 6.8% 6.8% 0.02%
Western Cape 6 016 900 6 116 300 99 400 1.7% 11.4% 11.3% -0.03%
Total 52 982 000 54 002 000 1 020 000 1.9% 100.0% 100.0% –
Source: National Treasury
Basic component
shares
Table W1.19 Comparison of current and new poverty component weighted shares
Current (2014 MTEF)
Thousand
Mid-year
population
estimates
2013
Poor
popula-
tion
Weighted
shares
Mid-year
population
estimates
2014
Poor
popula-
tion
Weighted
shares
Eastern Cape 52.0% 6 620 3 445 16.1% 6 787 3 531 16.2% 0.08%
Free State 41.4% 2 753 1 140 5.3% 2 787 1 154 5.3% -0.04%
Gauteng 28.9% 12 728 3 675 17.2% 12 915 3 728 17.1% -0.09%
KwaZulu-Natal 45.3% 10 457 4 738 22.2% 10 694 4 845 22.2% 0.06%
Limpopo 52.9% 5 518 2 917 13.6% 5 631 2 976 13.6% 0.00%
Mpumalanga 47.3% 4 128 1 951 9.1% 4 229 1 998 9.2% 0.04%
Northern Cape 40.8% 1 163 474 2.2% 1 167 476 2.2% -0.04%
North West 47.9% 3 598 1 723 8.1% 3 676 1 761 8.1% 0.01%
Western Cape 21.9% 6 017 1 316 6.2% 6 116 1 337 6.1% -0.02%
Total 52 982 21 377 100.0% 54 002 21 807 100.0% –
Source: National Treasury
Income
and
Expendi-
ture
Survey
2010/11
New (2015 MTEF) Difference
in weighted
shares
ANNEXURE W1: EXPLANATORY MEMORANDUM TO THE DIVISION OF REVENUE
23
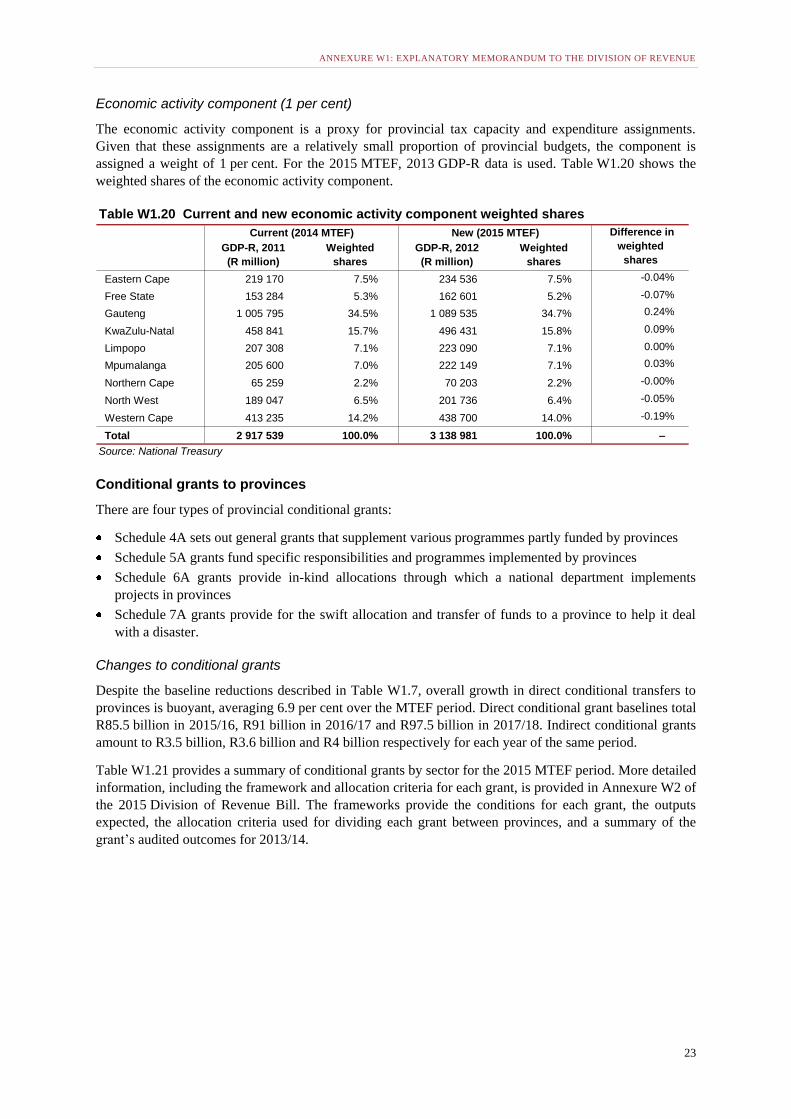
Economic activity component (1 per cent)
The economic activity component is a proxy for provincial tax capacity and expenditure assignments.
Given that these assignments are a relatively small proportion of provincial budgets, the component is
assigned a weight of 1 per cent. For the 2015 MTEF, 2013 GDP-R data is used. Table W1.20 shows the
weighted shares of the economic activity component.
Conditional grants to provinces
There are four types of provincial conditional grants:
Schedule 4A sets out general grants that supplement various programmes partly funded by provinces
Schedule 5A grants fund specific responsibilities and programmes implemented by provinces
Schedule 6A grants provide in-kind allocations through which a national department implements
projects in provinces
Schedule 7A grants provide for the swift allocation and transfer of funds to a province to help it deal
with a disaster.
Changes to conditional grants
Despite the baseline reductions described in Table W1.7, overall growth in direct conditional transfers to
provinces is buoyant, averaging 6.9 per cent over the MTEF period. Direct conditional grant baselines total
R85.5 billion in 2015/16, R91 billion in 2016/17 and R97.5 billion in 2017/18. Indirect conditional grants
amount to R3.5 billion, R3.6 billion and R4 billion respectively for each year of the same period.
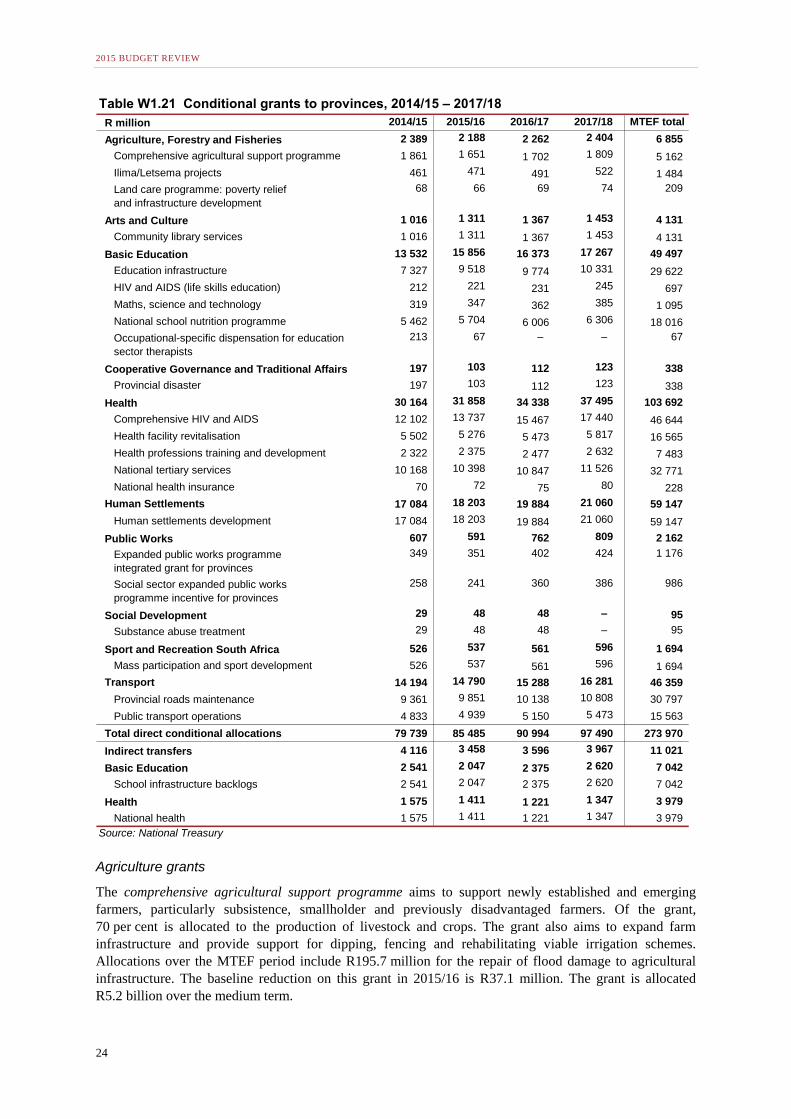
Table W1.21 provides a summary of conditional grants by sector for the 2015 MTEF period. More detailed
information, including the framework and allocation criteria for each grant, is provided in Annexure W2 of
the 2015 Division of Revenue Bill. The frameworks provide the conditions for each grant, the outputs
expected, the allocation criteria used for dividing each grant between provinces, and a summary of the
grant’s audited outcomes for 2013/14.
Table W1.20 Current and new economic activity component weighted shares
Current (2014 MTEF) New (2015 MTEF)
GDP-R, 2011
(R million)
Weighted
shares
GDP-R, 2012
(R million)
Weighted
shares
Eastern Cape 219 170 7.5% 234 536 7.5% -0.04%
Free State 153 284 5.3% 162 601 5.2% -0.07%
Gauteng 1 005 795 34.5% 1 089 535 34.7% 0.24%
KwaZulu-Natal 458 841 15.7% 496 431 15.8% 0.09%
Limpopo 207 308 7.1% 223 090 7.1% 0.00%
Mpumalanga 205 600 7.0% 222 149 7.1% 0.03%
Northern Cape 65 259 2.2% 70 203 2.2% -0.00%
North West 189 047 6.5% 201 736 6.4% -0.05%
Western Cape 413 235 14.2% 438 700 14.0% -0.19%
Total 2 917 539 100.0% 3 138 981 100.0% –
Source: National Treasury
Difference in
weighted
shares
2015 BUDGET REVIEW
24
Agriculture grants
The comprehensive agricultural support programme aims to support newly established and emerging
farmers, particularly subsistence, smallholder and previously disadvantaged farmers. Of the grant,
70 per cent is allocated to the production of livestock and crops. The grant also aims to expand farm
infrastructure and provide support for dipping, fencing and rehabilitating viable irrigation schemes.
Allocations over the MTEF period include R195.7 million for the repair of flood damage to agricultural
infrastructure. The baseline reduction on this grant in 2015/16 is R37.1 million. The grant is allocated
R5.2 billion over the medium term.
Table W1.21 Conditional grants to provinces, 2014/15 – 2017/18
R million 2014/15 2015/16 2016/17 2017/18 MTEF total
Agriculture, Forestry and Fisheries 2 389 2 188 2 262 2 404 6 855
Comprehensive agricultural support programme 1 861 1 651 1 702 1 809 5 162
Ilima/Letsema projects 461 471 491 522 1 484
Land care programme: poverty relief
and infrastructure development
68 66 69 74 209
Arts and Culture 1 016 1 311 1 367 1 453 4 131
Community library services 1 016 1 311 1 367 1 453 4 131
Basic Education 13 532 15 856 16 373 17 267 49 497
Education infrastructure 7 327 9 518 9 774 10 331 29 622
HIV and AIDS (life skills education) 212 221 231 245 697
Maths, science and technology 319 347 362 385 1 095
National school nutrition programme 5 462 5 704 6 006 6 306 18 016
Occupational-specific dispensation for education
sector therapists
213 67 – – 67
Cooperative Governance and Traditional Affairs 197 103 112 123 338
Provincial disaster 197 103 112 123 338
Health 30 164 31 858 34 338 37 495 103 692
Comprehensive HIV and AIDS 12 102 13 737 15 467 17 440 46 644
Health facility revitalisation 5 502 5 276 5 473 5 817 16 565
Health professions training and development 2 322 2 375 2 477 2 632 7 483
National tertiary services 10 168 10 398 10 847 11 526 32 771
National health insurance 70 72 75 80 228
Human Settlements 17 084 18 203 19 884 21 060 59 147
Human settlements development 17 084 18 203 19 884 21 060 59 147
Public Works 607 591 762 809 2 162
Expanded public works programme
integrated grant for provinces
349 351 402 424 1 176
Social sector expanded public works
programme incentive for provinces
258 241 360 386 986
Social Development 29 48 48 – 95
Substance abuse treatment 29 48 48 – 95
Sport and Recreation South Africa 526 537 561 596 1 694
Mass participation and sport development 526 537 561 596 1 694
Transport 14 194 14 790 15 288 16 281 46 359
Provincial roads maintenance 9 361 9 851 10 138 10 808 30 797
Public transport operations 4 833 4 939 5 150 5 473 15 563
Total direct conditional allocations 79 739 85 485 90 994 97 490 273 970
Indirect transfers 4 116 3 458 3 596 3 967 11 021
Basic Education 2 541 2 047 2 375 2 620 7 042
School infrastructure backlogs 2 541 2 047 2 375 2 620 7 042
Health 1 575 1 411 1 221 1 347 3 979
National health 1 575 1 411 1 221 1 347 3 979
Source: National Treasury
ANNEXURE W1: EXPLANATORY MEMORANDUM TO THE DIVISION OF REVENUE
25
The land care programme grant: poverty relief and infrastructure development aims to improve
productivity and the sustainable use of natural resources. Provinces are also encouraged to use this grant to
create jobs through the Expanded Public Works Programme. The baseline reduction on this grant in
2015/16 is R1.8 million. Over the medium term, R209.2 million is allocated to this grant.
The Ilima/Letsema projects grant aims to boost food production by helping previously disadvantaged
farming communities. After the Department of Agriculture, Forestry and Fisheries has tested the new
approach, it will make this grant subject to the standard operating procedure for farmer support. The
baseline reduction on this grant in 2015/16 is R11 million. It is allocated R1.5 billion over the MTEF
period.
Arts and culture grant
The community library services grant, administered by the Department of Arts and Culture, aims to help
South Africans access knowledge and information to improve their socioeconomic situation. The grant is
allocated to the relevant provincial department and administered by that department or through a service-
level agreement with municipalities. In collaboration with provincial departments of basic education, the
grant also funds dual service point libraries that serve both schools and the general public. Funds from this
grant may also be used to shift the libraries function between provinces and municipalities. The baseline
reduction on this grant in 2015/16 is R29.5 million, but average annual growth over the MTEF period
remains strong at 12.7 per cent. The grant is allocated R4.1 billion over the next three years.
Basic education grants
Provinces use the education infrastructure grant to construct, maintain and refurbish education
infrastructure and schools. The baseline reduction on this grant in 2015/16 is R213.9 million. The grant
totals R29.6 billion over the MTEF period, which includes a ring-fenced amount of R322.1 million over
the three years to repair school infrastructure damaged by natural disasters.
Infrastructure grant reforms to improve planning were introduced in 2013 after a decade of provincial
capacity building through the Infrastructure Delivery Improvement Programme. Under the requirements
introduced in the 2013 Division of Revenue Bill, provincial education departments had to go through a
two-year planning process to be eligible to receive incentive allocations in 2015/16. The departments had
to meet certain prerequisites in 2013/14 and have their infrastructure plans approved in 2014/15. The
national Department of Basic Education and the National Treasury assessed the provinces’ infrastructure
plans. A moderation process was undertaken between the national departments, provincial treasuries and
provincial departments of basic education to agree on the final scores. Provinces needed to obtain a
minimum score of 60 per cent to qualify for the incentive. Table W1.22 shows the final score and incentive
allocation for each province.
Table W1.22 Education infrastructure grant allocations
R million
Basic
component
Incentive
component
Disaster
recovery
funds
Eastern Cape 71% 1560 94 50 1 704
Free State 42% 763 – – 763
Gauteng 63% 852 84 – 936
KwaZulu-Natal 64% 1870 85 24 1 979
Limpopo 43% 736 – 69 805
Mpumalanga 48% 848 – 10 857
Northern Cape 66% 359 88 – 447
North West 69% 852 92 51 995
Western Cape 81% 920 108 5 1 032
Total 8 758 550 209 9 518
Source: National Treasury
User Asset
Management
Plan
assessment
scores
2015/16 Final
allocation
for 2015/16
2015 BUDGET REVIEW
26
The national Department of Basic Education is reviewing the education infrastructure grant formula for
outer-year allocations, so changes should be expected in the indicative allocations published for 2016/17
and 2017/18. Allocations for the incentive component in the outer years are shown as unallocated.
The national school nutrition programme grant seeks to improve the nutrition of poor school children,
enhance active learning capacity and increase school attendance. It provides a free daily meal to pupils in
the poorest 60 per cent of schools (quintile 1 to 3). The grant’s purpose has been expanded to include
deworming of learners without incurring a change in its 2015 MTEF allocations. This expansion will be
funded through the grant’s nutrition and food production component. The grant is allocated R18 billion
over the MTEF period. The baseline has not been reduced.
The maths, science and technology grant has been created by merging the Dinaledi schools grant with the
technical secondary schools recapitalisation grant. By combining these similar and overlapping
programmes, they can be better administered and expanded to reach more schools. The new grant’s
baseline is the sum of the baseline allocations for the two previous grants after 1 per cent has been
removed to fund improved administration of the grant at national level. The baseline reduction on this
grant in 2015/16 is R8.3 million. It is allocated R1.1 billion over the 2015 MTEF period.
The HIV and Aids (life skills education) programme grant provides for life skills training and sexuality and
HIV/AIDS education in primary and secondary schools. It is fully integrated into the school system, with
learner and teacher support materials provided for Grades 1 to 9. The baseline reduction on this grant in
2015/16 is R5.3 million. It is allocated R697.2 million over the MTEF period.
The school infrastructure backlogs grant is an indirect grant to provinces that was introduced in 2011 as a
temporary, high-impact grant. The national Department of Basic Education uses this grant to build and
upgrade schools on behalf of provinces to address inappropriate structures and access to basic services.
Due to the grant’s lack of spending, R297 million has been reprioritised over the MTEF period to offset the
impact of the baseline reductions on the occupational-specific dispensation for education sector therapists
grant, the further education and training colleges grant and the national school nutrition programme
grant. The grant is allocated R7 billion over the next three years.
The occupational-specific dispensation for education sector therapists grant provides funds for provinces
to implement the occupation-specific dispensation agreement for therapists, counsellors and psychologists
in the education sector. The grant is allocated for two years (2014/15 and 2015/16) while back-pay is being
funded and new remuneration levels are normalised. No baseline reduction has been effected on this grant.
From 2016/17, the funds will be allocated as part of the provincial equitable share. The grant has been
allocated R67 million for its last year in 2015/16.
Cooperative governance grant
The provincial disaster grant is administered by the National Disaster Management Centre in the
Department of Cooperative Governance and is unallocated at the start of the financial year. The grant
allows for an immediate (in-year) release of funds to be disbursed by the National Disaster Management
Centre after a disaster is declared, without the need for the transfers to be gazetted first. The reconstruction
of infrastructure damaged by disasters is funded separately through ring-fenced allocations in sector grants.
Due to past underspending on this grant, R298.5 million has been reprioritised out of the grant over the
2015 MTEF period. To ensure that sufficient funds are available in the event of a disaster, section 26 of the
2015 Division of Revenue Bill allows for funds allocated to the municipal disaster grant to be transferred
to provinces if funds in the provincial disaster grant have already been exhausted, and vice versa. The bill
also allows for more than one transfer to be made to areas affected by disasters so that an initial payment
for emergency aid can be made before a full assessment of damages and costs has been completed. The
baseline reduction on this grant in 2015/16 is R2.6 million. Over the MTEF period, R338.2 million is
available for disbursement through this grant.
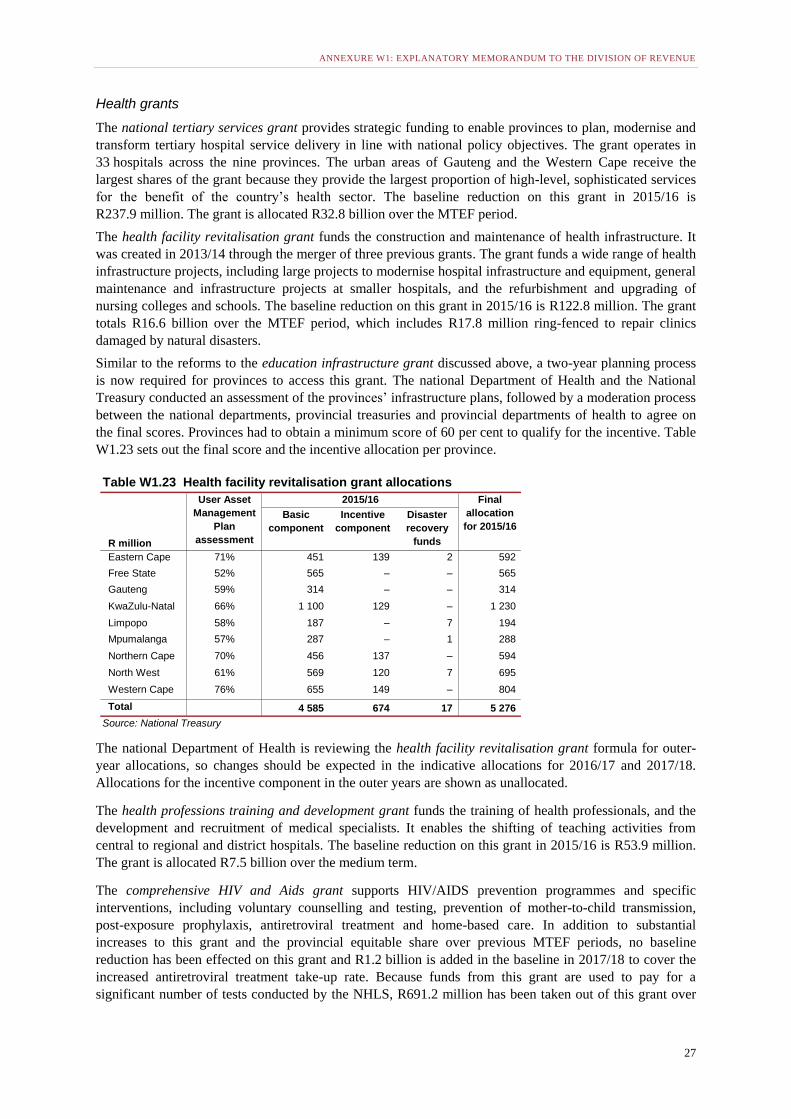
ANNEXURE W1: EXPLANATORY MEMORANDUM TO THE DIVISION OF REVENUE
27
Health grants
The national tertiary services grant provides strategic funding to enable provinces to plan, modernise and
transform tertiary hospital service delivery in line with national policy objectives. The grant operates in
33 hospitals across the nine provinces. The urban areas of Gauteng and the Western Cape receive the
largest shares of the grant because they provide the largest proportion of high-level, sophisticated services
for the benefit of the country’s health sector. The baseline reduction on this grant in 2015/16 is
R237.9 million. The grant is allocated R32.8 billion over the MTEF period.
The health facility revitalisation grant funds the construction and maintenance of health infrastructure. It
was created in 2013/14 through the merger of three previous grants. The grant funds a wide range of health
infrastructure projects, including large projects to modernise hospital infrastructure and equipment, general
maintenance and infrastructure projects at smaller hospitals, and the refurbishment and upgrading of
nursing colleges and schools. The baseline reduction on this grant in 2015/16 is R122.8 million. The grant
totals R16.6 billion over the MTEF period, which includes R17.8 million ring-fenced to repair clinics
damaged by natural disasters.
Similar to the reforms to the education infrastructure grant discussed above, a two-year planning process
is now required for provinces to access this grant. The national Department of Health and the National
Treasury conducted an assessment of the provinces’ infrastructure plans, followed by a moderation process
between the national departments, provincial treasuries and provincial departments of health to agree on
the final scores. Provinces had to obtain a minimum score of 60 per cent to qualify for the incentive. Table
W1.23 sets out the final score and the incentive allocation per province.
The national Department of Health is reviewing the health facility revitalisation grant formula for outer-
year allocations, so changes should be expected in the indicative allocations for 2016/17 and 2017/18.
Allocations for the incentive component in the outer years are shown as unallocated.
The health professions training and development grant funds the training of health professionals, and the
development and recruitment of medical specialists. It enables the shifting of teaching activities from
central to regional and district hospitals. The baseline reduction on this grant in 2015/16 is R53.9 million.
The grant is allocated R7.5 billion over the medium term.
The comprehensive HIV and Aids grant supports HIV/AIDS prevention programmes and specific
interventions, including voluntary counselling and testing, prevention of mother-to-child transmission,
post-exposure prophylaxis, antiretroviral treatment and home-based care. In addition to substantial
increases to this grant and the provincial equitable share over previous MTEF periods, no baseline
reduction has been effected on this grant and R1.2 billion is added in the baseline in 2017/18 to cover the
increased antiretroviral treatment take-up rate. Because funds from this grant are used to pay for a
significant number of tests conducted by the NHLS, R691.2 million has been taken out of this grant over
Table W1.23 Health facility revitalisation grant allocations
R million
Basic
component
Incentive
component
Disaster
recovery
funds
Eastern Cape 71% 451 139 2 592
Free State 52% 565 – – 565
Gauteng 59% 314 – – 314
KwaZulu-Natal 66% 1 100 129 – 1 230
Limpopo 58% 187 – 7 194
Mpumalanga 57% 287 – 1 288
Northern Cape 70% 456 137 – 594
North West 61% 569 120 7 695
Western Cape 76% 655 149 – 804
Total 4 585 674 17 5 276
Source: National Treasury
User Asset
Management
Plan
assessment
scores
2015/16 Final
allocation
for 2015/16
2015 BUDGET REVIEW
28
the MTEF period as part of the change in funding arrangements for the NHLS described above. This
brings the baseline to R46.6 billion over the MTEF period, with average annual growth of 12.3 per cent.
The national health insurance grant funds the national health insurance pilots introduced in 2012/13,
which aim to strengthen primary healthcare for the implementation of national health insurance.
Ten districts have been selected as pilot sites to test interventions that aim to strengthen health systems and
improve performance. The baseline reduction on this grant in 2015/16 is R1.9 million. Over the 2015
MTEF period, the grant has been allocated R227.6 million. This grant is complemented by the national
health insurance component within the national health grant.
The national health grant is an indirect grant introduced in 2013/14, which is spent by the Department of
Health on behalf of provinces. The grant has three components, one to support infrastructure projects, a
second to support the national health insurance scheme pilot sites, and a third to support the rollout of the
human papillomavirus vaccine. The infrastructure component will be used to accelerate construction,
maintenance, upgrades and rehabilitation for new and existing health infrastructure. The second component
will be used to contract general practitioners from the private sector for national health insurance sites. It
will also support 10 central hospitals to strengthen their patient information systems and develop and pilot
alternative hospital reimbursement tools. Funds for exploring the use of diagnostic-related groups to
structure health budgets has been shifted from the national health insurance component of the indirect
national health grant to the Department of Health’s core budget. The human papillomavirus vaccine
component is allocated for two years (2014/15 and 2015/16), and will be used to support provincial health
departments with the rollout of the vaccine. Funds for the vaccine have been added to the provincial
equitable share in 2016/17. A total of R352.7 million was reprioritised from this grant to offset the baseline
reductions that would have been effected on the comprehensive HIV and Aids grant. The national health
grant is allocated R4 billion over the MTEF period.
Human settlements grant
The human settlements development grant seeks to establish habitable, stable and sustainable human
settlements in which all citizens have access to social and economic amenities. This grant is allocated
using a formula with three components:
The first component shares 70 per cent of the total allocation between provinces in proportion to their
share of the total number of households living in inadequate housing. Data from the 2011 Census is
used for the number of households in each province living in informal settlements, shacks in backyards
and traditional dwellings. Not all traditional dwellings are inadequate, which is why information on the
proportion of traditional dwellings per province with damaged roofs and walls from the 2010 General
Household Survey is used to adjust these totals so that only traditional dwellings that provide
inadequate shelter are counted in the formula.
The second component determines 20 per cent of the total allocation based on the share of poor
households in each province. The number of households with an income of less than R1 500 per month
is used to determine 80 per cent of the component and the share of households with an income of
between R1 500 and R3 500 per month is used to determine the remaining 20 per cent. Data used in this
component comes from the 2011 Census.
The third component, which determines 10 per cent of the total allocation, is shared in proportion to the
number of people in each province, as measured in the 2011 Census.
In addition to the allocations determined through the formula, a total of R3.3 billion is ring-fenced over the
2015 MTEF period to upgrade human settlements in mining towns in six provinces. These allocations
respond to areas with significant informal settlement challenges, with a high proportion of economic
activity based on the natural resources sector. A total of R740.1 million is also ring-fenced over the MTEF
period to repair infrastructure damaged by natural disasters.
The baseline reduction on this grant in 2015/16 is R411.4 million. A further R240 million over the 2015
MTEF period has been reprioritised from the grant to the Housing Development Agency, which is
ANNEXURE W1: EXPLANATORY MEMORANDUM TO THE DIVISION OF REVENUE
29
expanding its mandate to include some of the planning and project development work that was previously
carried out by provinces. The grant’s allocation totals R59.1 billion over the medium term.
Public works grants
The expanded public works programme integrated grant for provinces incentivises provincial departments
to use labour-intensive methods in infrastructure, environmental and other projects. Grant allocations are
determined upfront based on the performance of provincial departments in meeting job targets in the
preceding financial year. The baseline reduction on this grant in 2015/16 is R5.96 million. It is allocated
R1.2 billion over the MTEF period.
The social sector expanded public works programme incentive grant for provinces rewards provinces for
creating jobs in the preceding financial year in the areas of home-based care, early childhood development,
adult literacy and numeracy, community safety and security, and sports programmes. The grant’s
allocation model incentivises provincial departments to participate in the Expanded Public Works
Programme and measures the performance of each province relative to its peers, providing additional
incentives to those that perform well. The baseline reduction on this grant in 2015/16 is R8 million. The
grant is allocated R985.8 million over the MTEF period.
Social development grant
The substance abuse treatment grant aims to build public substance abuse treatment facilities in the four
provinces that do not already have such facilities: the Eastern Cape, the Free State, the Northern Cape and
the North West. The grant is administered by the Department of Social Development and is expected to
run for two more years before it is incorporated into the provincial equitable share in 2017/18. The grant
has adopted the processes implemented for the education infrastructure grant and the health facility
revitalisation grant to streamline the process of planning and building these facilities, although the
allocation criteria for the grant remains unchanged. No baseline reduction has been effected on this grant.
It has been allocated R95 million over the 2015 MTEF period.
Sport and recreation South Africa grant
The mass participation and sport development grant aims to increase and sustain mass participation in
sport and recreational activities in the provinces, with greater emphasis on provincial and district
academies. The baseline reduction on this grant in 2015/16 is R12.5 million. It is allocated R1.7 billion
over the MTEF period.
Transport grants
The public transport operations grant subsidises commuter bus services. It supports provinces to ensure
that contractual obligations are met and services are efficiently provided. The public transport contracting
and regulatory functions may be assigned to certain metropolitan municipalities during 2015/16. If this
takes place, funds for this grant will be transferred directly to the assigned municipality. The baseline
reduction on this grant in 2015/16 amounted to R113.3 million. The grant is allocated R15.6 billion over
the MTEF period.
The provincial roads maintenance grant consists of three components. The largest component enables
provinces to expand their maintenance activities. The other components allow provinces to repair roads
damaged by floods and rehabilitate roads that are heavily used in support of electricity production. Grant
allocations are determined using a formula based on provincial road networks, road traffic and weather
conditions. These factors reflect the different costs of maintaining road networks in each province. The
grant requires provinces to follow best practices for planning and to use and regularly update road asset
management systems.
In future the grant will be allocated based on performance. The model’s indicators – vehicle operating
costs and remaining asset lifespan – have been finalised and the performance component will inform future
grant allocations. An amount of R149 million has been reprioritised out of this grant over the 2015 MTEF
2015 BUDGET REVIEW
30
period in anticipation of the transfer of the R573 Moloto Road from provinces to SANRAL. The agency
will perform urgent upgrades to improve the road’s safety as part of its non-tolled network once the
provincial governments in Gauteng, Mpumalanga and Limpopo formally transfer the road. The baseline
reduction on this grant in 2015/16 is R219.1 million. The total allocation for the MTEF period is
R30.8 billion, including ring-fenced allocations of R1 billion for the repair of infrastructure damaged by
floods.
Part 5: Local government fiscal framework and allocations
The local government fiscal framework responds to the constitutional assignment of powers and functions
to this sphere of government. The framework refers to all resources available to municipalities to meet
their expenditure responsibilities. National transfers account for a relatively small proportion of the local
government fiscal framework, with the majority of local government revenues being raised by
municipalities themselves through their substantial revenue-raising powers, including property rates and
service charges. However, the proportion of revenue from transfers and own revenues varies dramatically
across municipalities, with poor rural municipalities receiving most of their revenue from transfers, while
urban municipalities raise the majority of their own revenues. This differentiation in the way municipalities
are funded will continue in the period ahead.
The 2015 MTEF does not significantly alter the structure of transfers to local government. Instead, it
makes several small changes as part of the ongoing policy reforms and baseline reductions outlined in the
2014 Medium Term Budget Policy Statement. Despite the reductions, allocations to municipalities continue
to grow in real terms, with significant growth in water and sanitation and electricity grants. This emphasis
on basic services aligns with the back-to-basics approach to local government announced by the Minister
of Cooperative Governance in 2014. The local government fiscal framework as a whole – including all
transfers and own revenues – is structured to support the achievement of the National Development Plan’s
goals.
The first phase of the review of local government infrastructure grants is complete and its outcomes have
begun to be implemented. The recommendation to rationalise grants, for example, has led to the
consolidation of two public transport grants to cities. Elsewhere, the emphasis on enhanced life-cycle asset
management is reflected in new conditions allowing certain grant funds to be used for refurbishment.
Planned changes to individual conditional grants over the 2015 MTEF period are discussed in detail below
and more extensive reforms will follow the second phase of the review.
This section outlines the transfers made to local government and how these funds are distributed between
municipalities. Funds raised by national government are transferred to municipalities through conditional
and unconditional grants. National transfers to municipalities are published to enable them to plan fully for
their 2015/16 budgets, and to promote better accountability and transparency by ensuring that all national
allocations are included in municipal budgets.
Transfers to local government
Over the 2015 MTEF period, R313.7 billion will be transferred directly to local government and a further
R31.9 billion has been allocated to indirect grants. Direct transfers to local government in 2015/16 account
for 9.1 per cent of national government’s non-interest expenditure. When indirect transfers are added to
this, total spending on local government increases to 10 per cent of national non-interest expenditure.
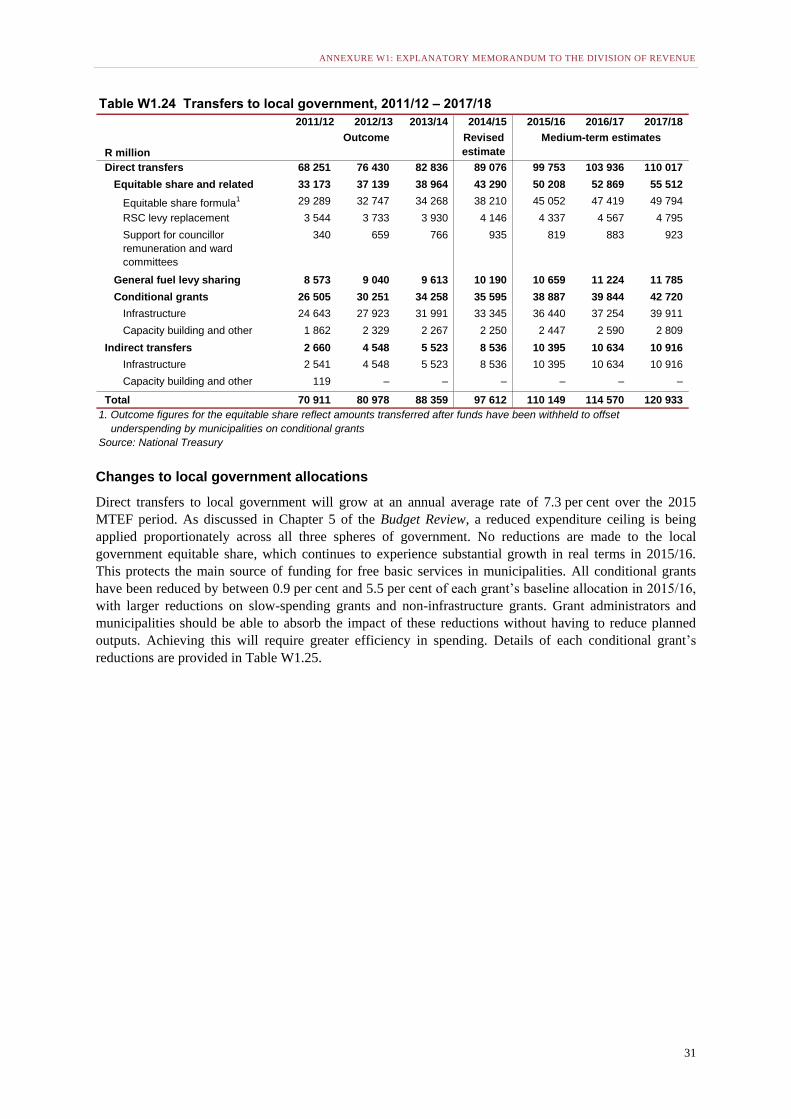
ANNEXURE W1: EXPLANATORY MEMORANDUM TO THE DIVISION OF REVENUE
31
Changes to local government allocations
Direct transfers to local government will grow at an annual average rate of 7.3 per cent over the 2015
MTEF period. As discussed in Chapter 5 of the Budget Review, a reduced expenditure ceiling is being
applied proportionately across all three spheres of government. No reductions are made to the local
government equitable share, which continues to experience substantial growth in real terms in 2015/16.
This protects the main source of funding for free basic services in municipalities. All conditional grants
have been reduced by between 0.9 per cent and 5.5 per cent of each grant’s baseline allocation in 2015/16,
with larger reductions on slow-spending grants and non-infrastructure grants. Grant administrators and
municipalities should be able to absorb the impact of these reductions without having to reduce planned
outputs. Achieving this will require greater efficiency in spending. Details of each conditional grant’s
reductions are provided in Table W1.25.
Table W1.24 Transfers to local government, 2011/12 – 2017/18
2011/12 2012/13 2013/14 2014/15 2015/16 2016/17 2017/18
R million
Revised
estimate
Direct transfers 68 251 76 430 82 836 89 076 99 753 103 936 110 017
Equitable share and related 33 173 37 139 38 964 43 290 50 208 52 869 55 512
Equitable share formula1 29 289 32 747 34 268 38 210 45 052 47 419 49 794
RSC levy replacement 3 544 3 733 3 930 4 146 4 337 4 567 4 795
Support for councillor
remuneration and ward
committees
340 659 766 935 819 883 923
General fuel levy sharing
with metros
8 573 9 040 9 613 10 190 10 659 11 224 11 785
Conditional grants 26 505 30 251 34 258 35 595 38 887 39 844 42 720
Infrastructure 24 643 27 923 31 991 33 345 36 440 37 254 39 911
Capacity building and other 1 862 2 329 2 267 2 250 2 447 2 590 2 809
Indirect transfers 2 660 4 548 5 523 8 536 10 395 10 634 10 916
Infrastructure 2 541 4 548 5 523 8 536 10 395 10 634 10 916
Capacity building and other 119 – – – – – –
Total 70 911 80 978 88 359 97 612 110 149 114 570 120 933
1. Outcome figures for the equitable share reflect amounts transferred after funds have been withheld to offset
underspending by municipalities on conditional grants
Source: National Treasury
Outcome Medium-term estimates
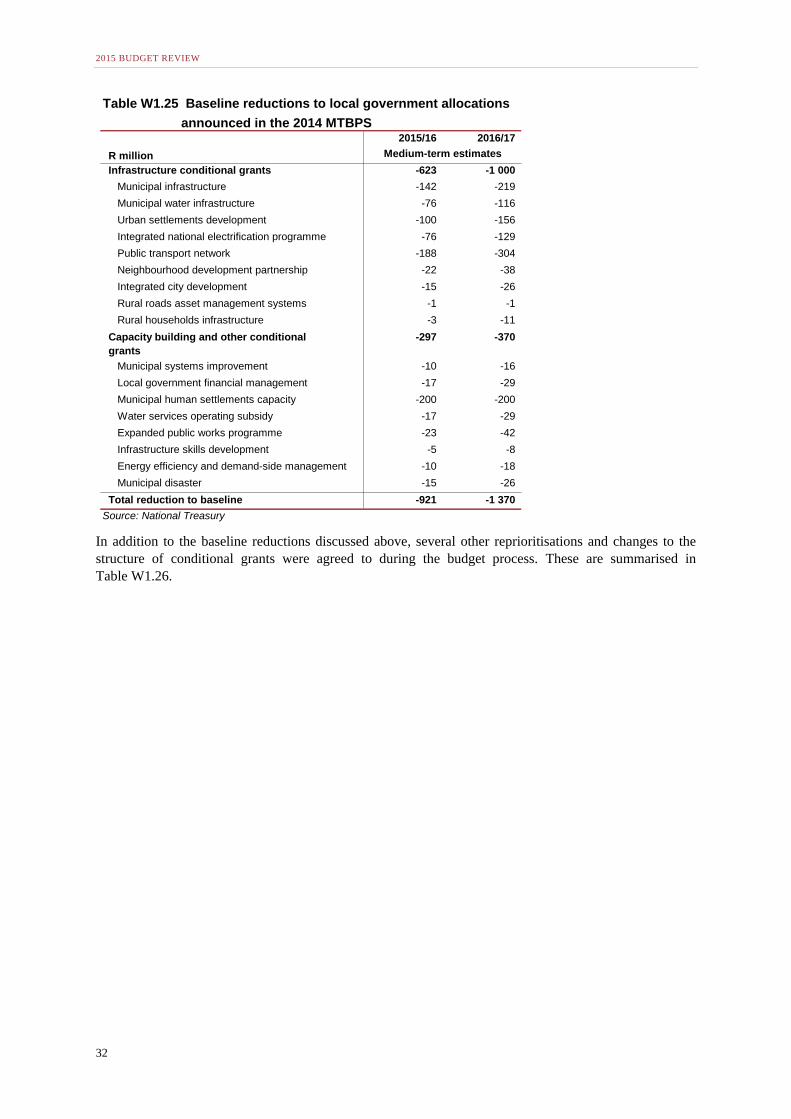
2015 BUDGET REVIEW
32
In addition to the baseline reductions discussed above, several other reprioritisations and changes to the
structure of conditional grants were agreed to during the budget process. These are summarised in
Table W1.26.
Table W1.25 Baseline reductions to local government allocations
announced in the 2014 MTBPS2015/16 2016/17
R million
Infrastructure conditional grants -623 -1 000
Municipal infrastructure -142 -219
Municipal water infrastructure -76 -116
Urban settlements development -100 -156
Integrated national electrification programme -76 -129
Public transport network -188 -304
Neighbourhood development partnership -22 -38
Integrated city development -15 -26
Rural roads asset management systems -1 -1
Rural households infrastructure -3 -11
Capacity building and other conditional
grants
-297 -370
Municipal systems improvement -10 -16
Local government financial management -17 -29
Municipal human settlements capacity -200 -200
Water services operating subsidy -17 -29
Expanded public works programme
integrated grant for municipalities
-23 -42
Infrastructure skills development -5 -8
Energy efficiency and demand-side management -10 -18
Municipal disaster -15 -26
Total reduction to baseline -921 -1 370
Source: National Treasury
Medium-term estimates
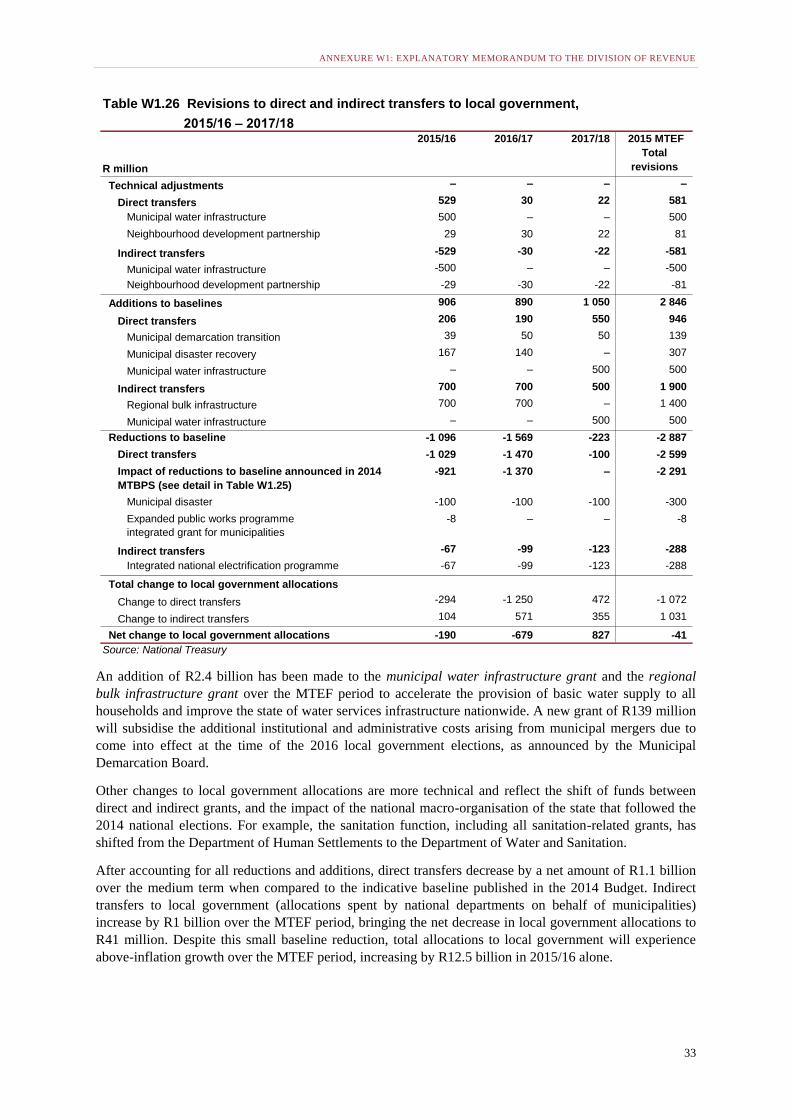
ANNEXURE W1: EXPLANATORY MEMORANDUM TO THE DIVISION OF REVENUE
33
An addition of R2.4 billion has been made to the municipal water infrastructure grant and the regional
bulk infrastructure grant over the MTEF period to accelerate the provision of basic water supply to all
households and improve the state of water services infrastructure nationwide. A new grant of R139 million
will subsidise the additional institutional and administrative costs arising from municipal mergers due to
come into effect at the time of the 2016 local government elections, as announced by the Municipal
Demarcation Board.
Other changes to local government allocations are more technical and reflect the shift of funds between
direct and indirect grants, and the impact of the national macro-organisation of the state that followed the
2014 national elections. For example, the sanitation function, including all sanitation-related grants, has
shifted from the Department of Human Settlements to the Department of Water and Sanitation.
After accounting for all reductions and additions, direct transfers decrease by a net amount of R1.1 billion
over the medium term when compared to the indicative baseline published in the 2014 Budget. Indirect
transfers to local government (allocations spent by national departments on behalf of municipalities)
increase by R1 billion over the MTEF period, bringing the net decrease in local government allocations to
R41 million. Despite this small baseline reduction, total allocations to local government will experience
above-inflation growth over the MTEF period, increasing by R12.5 billion in 2015/16 alone.
Table W1.26 Revisions to direct and indirect transfers to local government,
2015/16 – 2017/18
R million
2015/16 2016/17 2017/18 2015 MTEF
Total
revisions
Technical adjustments – – – –
Direct transfers 529 30 22 581
Municipal water infrastructure
grant
500 – – 500
Neighbourhood development partnership 29 30 22 81
Indirect transfers -529 -30 -22 -581
Municipal water infrastructure -500 – – -500
Neighbourhood development partnership -29 -30 -22 -81
Additions to baselines 906 890 1 050 2 846
Direct transfers 206 190 550 946
Municipal demarcation transition 39 50 50 139
Municipal disaster recovery 167 140 – 307
Municipal water infrastructure – – 500 500
Indirect transfers 700 700 500 1 900
Regional bulk infrastructure 700 700 – 1 400
Municipal water infrastructure – – 500 500
Reductions to baseline -1 096 -1 569 -223 -2 887
Direct transfers -1 029 -1 470 -100 -2 599
Impact of reductions to baseline announced in 2014
MTBPS (see detail in Table W1.25)
-921 -1 370 – -2 291
Municipal disaster -100 -100 -100 -300
Expanded public works programme
integrated grant for municipalities
-8 – – -8
Indirect transfers -67 -99 -123 -288
Integrated national electrification programme -67 -99 -123 -288
Total change to local government allocations
Change to direct transfers -294 -1 250 472 -1 072
Change to indirect transfers 104 571 355 1 031
Net change to local government allocations -190 -679 827 -41
Source: National Treasury
2015 BUDGET REVIEW
34
The local government equitable share
In terms of section 227 of the Constitution, local government is entitled to an equitable share of nationally
raised revenue to enable it to provide basic services and perform its allocated functions. The local
government equitable share is an unconditional transfer that supplements the revenue that municipalities
can raise themselves (including property rates and service charges). The equitable share provides funding
for municipalities to deliver free basic services to poor households and subsidises the cost of
administration and other core services for those municipalities that have the least potential to cover these
costs from their own revenues.
Over the 2015 MTEF period, the local government equitable share, including the RSC/JSB levies
replacement grant and special support for councillor remuneration and ward committees, amounts to
R158.6 billion – R50.2 billion in 2015/16, R52.9 billion in 2016/17, and R55.5 billion in 2017/18.
Formula for allocating the local government equitable share
The share of national revenue allocated to local government through the equitable share is determined in
the national budget process and endorsed by Cabinet (the vertical division). Local government’s equitable
share is divided among the country’s 278 municipalities using a formula (the horizontal division) to ensure
objectivity.
A new formula for the local government equitable share was introduced in 2013/14, following a review of
the previous formula by the National Treasury, the Department of Cooperative Governance and SALGA,
in partnership with the FFC and Statistics South Africa. The new formula is based on data from the 2011
Census, which resulted in major changes to some allocations. As a result, new allocations are being phased
in over a five-year period, ending in 2017/18. The local government equitable share formula’s principles
and objectives were set out in detail in the Explanatory Memorandum to the 2013 Division of Revenue.
Structure of the local government equitable share formula
The formula uses demographics and other data to determine each municipality’s share of the local
government equitable share. It has three parts, made up of five components:
The first part of the formula consists of the basic services component, which provides for the cost of
free basic services for poor households.
The second part enables municipalities with limited resources to afford basic administrative and
governance capacity, and perform core municipal functions. It does this through three components:
The institutional component provides a subsidy for basic municipal administrative costs.
The community services component provides funds for other core municipal services not included
under basic services.
The revenue adjustment factor ensures that funds from this part of the formula are only provided to
municipalities with limited potential to raise their own revenue. Municipalities that are least able to
fund these costs from their own revenues should receive the most funding.
The third part of the formula provides predictability and stability through the correction and
stabilisation factor, which ensures that all of the formula’s guarantees can be met.
Each of these components is described in detail in the subsections that follow. The formula’s structure is
summarised in the box.
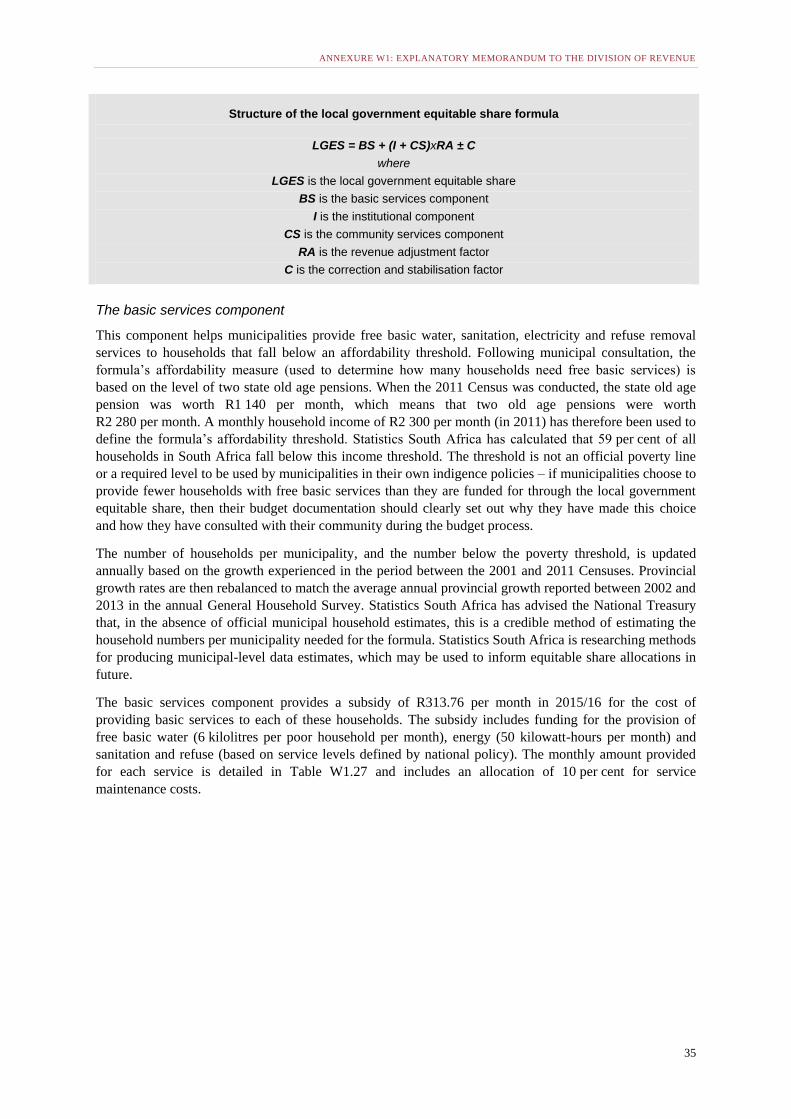
ANNEXURE W1: EXPLANATORY MEMORANDUM TO THE DIVISION OF REVENUE
35
Structure of the local government equitable share formula
LGES = BS + (I + CS)xRA ± C
where
LGES is the local government equitable share
BS is the basic services component
I is the institutional component
CS is the community services component
RA is the revenue adjustment factor
C is the correction and stabilisation factor
The basic services component
This component helps municipalities provide free basic water, sanitation, electricity and refuse removal
services to households that fall below an affordability threshold. Following municipal consultation, the
formula’s affordability measure (used to determine how many households need free basic services) is
based on the level of two state old age pensions. When the 2011 Census was conducted, the state old age
pension was worth R1 140 per month, which means that two old age pensions were worth
R2 280 per month. A monthly household income of R2 300 per month (in 2011) has therefore been used to
define the formula’s affordability threshold. Statistics South Africa has calculated that 59 per cent of all
households in South Africa fall below this income threshold. The threshold is not an official poverty line
or a required level to be used by municipalities in their own indigence policies – if municipalities choose to
provide fewer households with free basic services than they are funded for through the local government
equitable share, then their budget documentation should clearly set out why they have made this choice
and how they have consulted with their community during the budget process.
The number of households per municipality, and the number below the poverty threshold, is updated
annually based on the growth experienced in the period between the 2001 and 2011 Censuses. Provincial
growth rates are then rebalanced to match the average annual provincial growth reported between 2002 and
2013 in the annual General Household Survey. Statistics South Africa has advised the National Treasury
that, in the absence of official municipal household estimates, this is a credible method of estimating the
household numbers per municipality needed for the formula. Statistics South Africa is researching methods
for producing municipal-level data estimates, which may be used to inform equitable share allocations in
future.
The basic services component provides a subsidy of R313.76 per month in 2015/16 for the cost of
providing basic services to each of these households. The subsidy includes funding for the provision of
free basic water (6 kilolitres per poor household per month), energy (50 kilowatt-hours per month) and
sanitation and refuse (based on service levels defined by national policy). The monthly amount provided
for each service is detailed in Table W1.27 and includes an allocation of 10 per cent for service
maintenance costs.
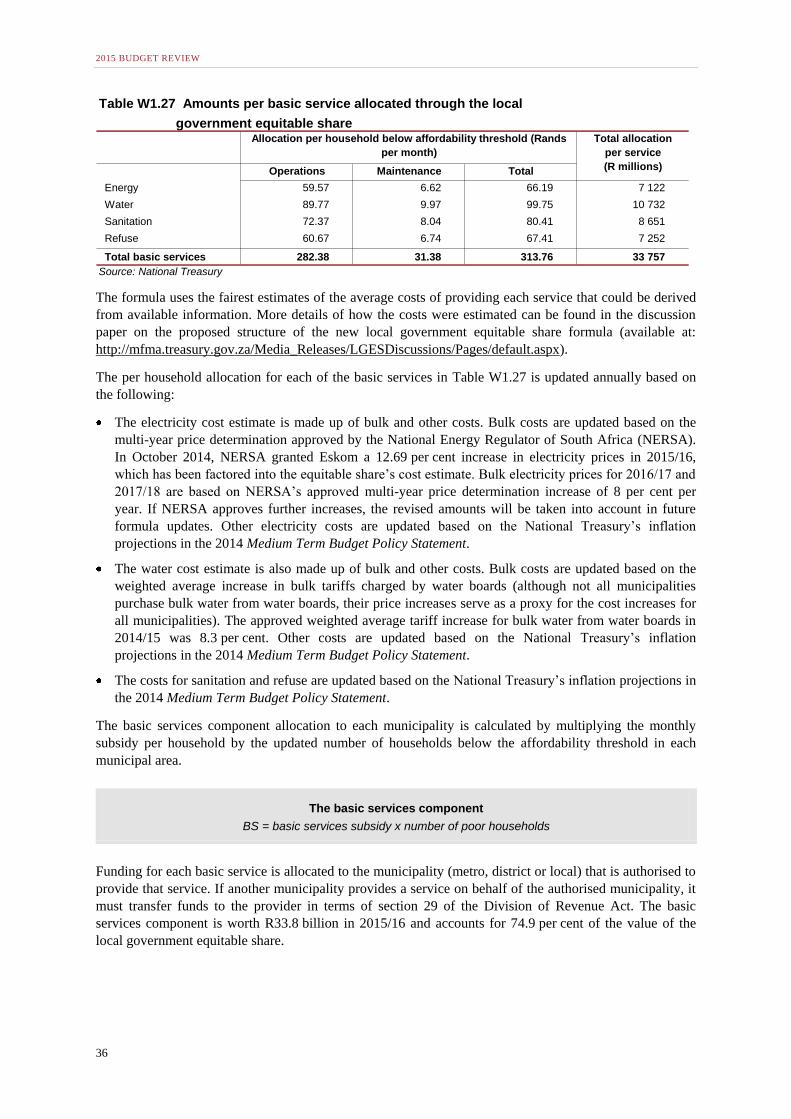
2015 BUDGET REVIEW
36
The formula uses the fairest estimates of the average costs of providing each service that could be derived
from available information. More details of how the costs were estimated can be found in the discussion
paper on the proposed structure of the new local government equitable share formula (available at:
http://mfma.treasury.gov.za/Media_Releases/LGESDiscussions/Pages/default.aspx).
The per household allocation for each of the basic services in Table W1.27 is updated annually based on
the following:
The electricity cost estimate is made up of bulk and other costs. Bulk costs are updated based on the
multi-year price determination approved by the National Energy Regulator of South Africa (NERSA).
In October 2014, NERSA granted Eskom a 12.69 per cent increase in electricity prices in 2015/16,
which has been factored into the equitable share’s cost estimate. Bulk electricity prices for 2016/17 and
2017/18 are based on NERSA’s approved multi-year price determination increase of 8 per cent per
year. If NERSA approves further increases, the revised amounts will be taken into account in future
formula updates. Other electricity costs are updated based on the National Treasury’s inflation
projections in the 2014 Medium Term Budget Policy Statement.
The water cost estimate is also made up of bulk and other costs. Bulk costs are updated based on the
weighted average increase in bulk tariffs charged by water boards (although not all municipalities
purchase bulk water from water boards, their price increases serve as a proxy for the cost increases for
all municipalities). The approved weighted average tariff increase for bulk water from water boards in
2014/15 was 8.3 per cent. Other costs are updated based on the National Treasury’s inflation
projections in the 2014 Medium Term Budget Policy Statement.
The costs for sanitation and refuse are updated based on the National Treasury’s inflation projections in
the 2014 Medium Term Budget Policy Statement.
The basic services component allocation to each municipality is calculated by multiplying the monthly
subsidy per household by the updated number of households below the affordability threshold in each
municipal area.
Funding for each basic service is allocated to the municipality (metro, district or local) that is authorised to
provide that service. If another municipality provides a service on behalf of the authorised municipality, it
must transfer funds to the provider in terms of section 29 of the Division of Revenue Act. The basic
services component is worth R33.8 billion in 2015/16 and accounts for 74.9 per cent of the value of the
local government equitable share.
Table W1.27 Amounts per basic service allocated through the local
government equitable share
Operations Maintenance Total
Energy 59.57 6.62 66.19 7 122
Water 89.77 9.97 99.75 10 732
Sanitation 72.37 8.04 80.41 8 651
Refuse 60.67 6.74 67.41 7 252
Total basic services 282.38 31.38 313.76 33 757
Source: National Treasury
Allocation per household below affordability threshold (Rands
per month)
Total allocation
per service
(R millions)
The basic services component
BS = basic services subsidy x number of poor households
ANNEXURE W1: EXPLANATORY MEMORANDUM TO THE DIVISION OF REVENUE
37
The institutional component
To provide basic services to households, municipalities need to be able to run a basic administration. Most
municipalities should be able to fund the majority of their administration costs with their own revenue.
But, because poor households are not able to contribute in full, the equitable share includes an institutional
support component to help meet some of these costs. To ensure that this component supports
municipalities with limited own-revenue-raising abilities, a revenue adjustment factor is applied so that a
larger proportion of the allocation is received by municipalities with less potential to raise their own
revenue. The revenue adjustment factor is described in more detail later in this annexure.
This component consists of a base allocation of R5.6 million, which goes to every municipality, and an
additional amount that is based on the number of council seats in each municipality. This reflects the
relative size of a municipality’s administration and is not intended to fund the costs of councillors only (the
number of seats recognised for the formula is determined by the Minister of Cooperative Governance and
Traditional Affairs). The base component acknowledges that there are some fixed costs that all
municipalities face.
The institutional component
I = base allocation + [allocation per councillor * number of council seats]
The institutional component accounts for 10 per cent of the equitable share formula and is worth
R4.5 billion in 2015/16. This component is also complemented by special support for councillor
remuneration in poor municipalities, which is not part of the equitable share formula (described in more
detail later).
The community services component
This component funds services that benefit communities rather than individual households (which are
provided for in the basic services component). It includes funding for municipal health services, fire
services, municipal roads, cemeteries, planning, storm water management, street lighting and parks. To
ensure this component assists municipalities with limited own-revenue-raising abilities, a revenue
adjustment factor is applied so that these municipalities receive a larger proportion of the allocation.
The allocation for this component is split between district and local municipalities, because both provide
community services. In 2015/16, the allocation to district and metropolitan municipalities for municipal
health and related services is R7.81 per household per month. The component’s remaining funds are
allocated to local and metropolitan municipalities based on the number of households in each municipality.
The community services component
CS = [municipal health and related services allocation x number of households] + [other services allocation x number of households]
The community services component accounts for 15 per cent of the equitable share formula and is worth
R6.8 billion in 2015/16.
The revenue adjustment factor
The Constitution gives local government substantial own-revenue-raising powers (particularly through
property rates and surcharges on services). Municipalities are expected to fund most of their own
administrative costs and cross-subsidise some services for indigent residents. Given the varied levels of
poverty across South Africa, the formula does not expect all municipalities to be able to generate similar
amounts of own revenue. A revenue adjustment factor is applied to the institutional and community
services components of the formula to ensure that these funds assist municipalities that are least likely to
be able to fund these functions from their own revenues.
2015 BUDGET REVIEW
38
To account for the varying fiscal capacities of municipalities, this component is based on a per capita index
using the following factors from the 2011 Census:
Total income of all individuals/households in a municipality (as a measure of economic activity and
earning)
Reported property values
Number of households on traditional land
Unemployment rate
Proportion of poor households as a percentage of the total number of households in the municipality.
Based on this index, municipalities were ranked according to their per capita revenue-raising potential. The
top 10 per cent of municipalities have a revenue adjustment factor of zero, which means that they do not
receive an allocation from the institutional and community services components. The 25 per cent of
municipalities with the lowest scores have a revenue adjustment factor of 100 per cent, which means that
they receive their full allocation from the institutional and community services components. Municipalities
between the bottom 25 per cent and top 10 per cent have a revenue adjustment factor applied on a sliding
scale, so that those with higher per capita revenue-raising potential receive a lower revenue adjustment
factor and those with less potential receive a larger revenue adjustment factor.
The revenue adjustment factor is not based on the actual revenues municipalities collect. This component
therefore does not create any perverse incentive for municipalities to under-collect potential own revenues
to receive a higher equitable share.
Because district municipalities do not collect own revenues from property rates, the revenue adjustment
factor applied to these municipalities is based on the RSC/JSB levies replacement grant allocations. This
grant replaces a source of own revenue previously collected by district municipalities and it is still treated
as an own-revenue source in many respects. Similar to the revenue adjustment factor for local and
metropolitan municipalities, the factor applied to district municipalities is based on their per capita
RSC/JSB levies replacement grant allocations. District municipalities are given revenue adjustment factors
on a sliding scale – those with a higher per capita RSC/JSB levies replacement grant allocation receive a
lower revenue adjustment factor, while those with lower allocations receive a larger revenue adjustment
factor.
Correction and stabilisation factor
Providing municipalities with predictable and stable equitable allocations is one of the principles of the
equitable share formula. Indicative allocations are published for the second and third years of the MTEF
period to ensure predictability. To provide stability for municipal planning, while giving national
government flexibility to account for overall budget constraints and amend the formula, municipalities are
guaranteed to receive at least 90 per cent of the indicative allocation for the middle year of the MTEF
period.
A new equitable share formula was introduced in 2013/14 using updated 2011 Census data. As a result,
some municipalities will experience large changes in their equitable share allocations. To smooth the
impact of these changes and give municipalities time to adjust (both for municipalities with increasing and
decreasing allocations), the new allocations are being phased in over five years, from 2013/14 to 2017/18.
For municipalities with smaller allocations under the new formula, the phase-in mechanism measures the
difference between the municipality’s old and new allocations and closes this gap by 20 per cent each year.
This means that in the first year a municipality only experienced a change equivalent to 20 per cent of the
gap between their allocations under the old and new formulas, in the second year they completed
40 per cent of the change, in the third year (2015/16) they will complete 60 per cent, in 2016/17 they will
complete 80 per cent, and in 2017/18 – the final year of the 2015 MTEF period – their allocation will be
determined entirely through the new formula.
To provide for this phase-in approach, while staying within the limits of the equitable share, municipalities
with larger allocations will also have their increases phased in over five years. The total top-up amount
ANNEXURE W1: EXPLANATORY MEMORANDUM TO THE DIVISION OF REVENUE
39
needed to fund the phasing in for municipalities with declining allocations is calculated and deducted from
those that do not require a top-up in proportion to their “surplus”. This means that municipalities with
larger allocations will have some of those gains delayed over the phase-in period.
Ensuring the formula balances
The formula is structured so that all of the available funds are allocated. The basic services component is
determined by the number of poor households per municipality and the estimated cost of free basic
services, so it cannot be manipulated. This means that the balancing of the formula to the available
resources must take place in the second part of the formula, which includes the institutional and
community services components. The formula automatically determines the value of the allocation per
council seat in the institutional component and the allocation per household for other services in the
community services component to ensure that it balances. Significant increases in the cost of basic service
provision – due to escalating bulk electricity prices for example – is fully funded by the formula, but this
will result in slower growth in the institutional and community services allocations.
Potential future refinements to the formula
Although the local government equitable share formula has been through extensive consultations and
technical work, national government continues to work with stakeholders to improve the formula. Areas of
work include:
Exploring the introduction of factors to account for costs related to the size of the land area served and
settlement types in municipalities.
Developing differentiated costing variables to take account of the different costs of services in various
circumstances. SALGA and the FFC have completed the first phase of a project that could provide the
basis for calculating such variables in future. This work will continue in 2015/16.
Exploring the creation of separate sub-components for fire services and municipal health services
within the community services component. This would enhance transparency in allocations, although
funds for the fire services function would need to be allocated to the municipality (district or local)
authorised for this function within a specific area. The process can only be completed after the National
Disaster Management Centre has completed its consideration of policy and legislative changes for fire
services.
Government is committed to considering all proposed refinements to the formula, but another full review
is not envisaged until the current formula has been fully phased in and municipalities have had time to
adjust to the new allocations.
Details of new allocations
In addition to the three-year formula allocations published in the Division of Revenue Bill, a copy of the
formula, including the data used for each municipality and each component, is
published online (http://mfma.treasury.gov.za/Media_Releases/LGESDiscussions/Pages/default.aspx).
Other unconditional allocations
RSC/JSB levies replacement grant
Before 2006, district municipalities raised levies on local businesses through an RSC or JSB levy. This
source of revenue was replaced in 2006/07 with the RSC/JSB levies replacement grant, which was
allocated to all district and metropolitan municipalities based on the amounts they had previously collected
through the levies (the RSC/JSB levies replacement grant for metropolitan municipalities has since been
replaced by the sharing of the general fuel levy). The grant’s value increases every year. In 2015/16, the
grant increases by 7.4 per cent a year for district municipalities authorised for water and sanitation and
2.5 per cent for unauthorised district municipalities. The different rates recognise the various service
delivery responsibilities of these district municipalities.
2015 BUDGET REVIEW
40
Special support for councillor remuneration and ward committees
Councillors’ salaries are subsidised in poor municipalities. The total value of the support provided in
2015/16 is R818.9 million, calculated separately to the local government equitable share and in addition to
the funding for governance costs provided in the institutional component. The level of support for each
municipality is allocated based on a system gazetted by the Minister of Cooperative Governance and
Traditional Affairs, which classifies municipal councils into six grades based on their total income and
population size. Special support is provided to the lowest three grades of municipal councils (the smallest
and poorest municipalities). During 2014, gradings for all municipalities were recalculated using data from
the 2011 Census. The revised gradings, approved by Members of the Executive Council for Cooperative
Governance and collated by the national Department of Cooperative Governance, have been used to update
the allocations for the 2015 MTEF period. The use of 2011 Census data means that a number of
municipalities increased their grading levels and are consequently no longer eligible to receive the special
support for councillor remuneration. These funds have been returned to the local government equitable
share formula to be allocated to all municipalities.
A subsidy of 90 per cent of the gazetted maximum remuneration for a part-time councillor is provided for
every councillor in grade 1 municipalities, 80 per cent for grade 2 municipalities and 70 per cent for
grade 3 municipalities. Because the new maximum limits for councillor remuneration had not been
gazetted when the 2015/16 allocations were determined, the level of subsidies provided for that year are
based on the 2014/15 maximums plus inflation. In addition to this support for councillor remuneration,
each local municipality in grades 1 to 3 receives an allocation to provide stipends of R500 per month to
10 members of each ward committee in their municipality. Each municipality’s allocation for this special
support is published in the appendices to the Division of Revenue Bill.
Conditional grants to local government
National government allocates funds to local government through a variety of conditional grants. These
grants fall into two main groups: infrastructure and capacity building. The total value of conditional grants
directly transferred to local government increases from R38.9 billion in 2015/16 to R39.8 billion in
2016/17 and R42.7 billion in 2017/18.
Infrastructure conditional grants to local government
National transfers for infrastructure, including indirect or in-kind allocations to entities executing specific
projects in municipalities, amount to R145.5 billion over the 2015 MTEF period.
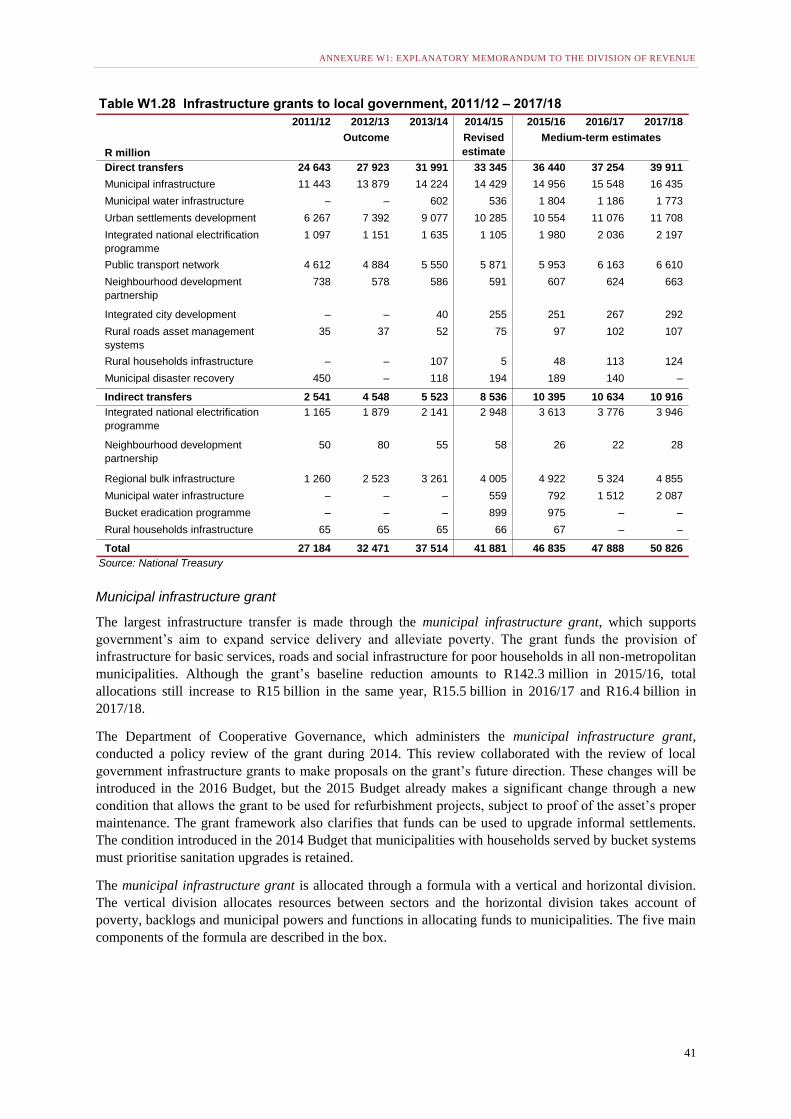
ANNEXURE W1: EXPLANATORY MEMORANDUM TO THE DIVISION OF REVENUE
41
Municipal infrastructure grant
The largest infrastructure transfer is made through the municipal infrastructure grant, which supports
government’s aim to expand service delivery and alleviate poverty. The grant funds the provision of
infrastructure for basic services, roads and social infrastructure for poor households in all non-metropolitan
municipalities. Although the grant’s baseline reduction amounts to R142.3 million in 2015/16, total
allocations still increase to R15 billion in the same year, R15.5 billion in 2016/17 and R16.4 billion in
2017/18.
The Department of Cooperative Governance, which administers the municipal infrastructure grant,
conducted a policy review of the grant during 2014. This review collaborated with the review of local
government infrastructure grants to make proposals on the grant’s future direction. These changes will be
introduced in the 2016 Budget, but the 2015 Budget already makes a significant change through a new
condition that allows the grant to be used for refurbishment projects, subject to proof of the asset’s proper
maintenance. The grant framework also clarifies that funds can be used to upgrade informal settlements.
The condition introduced in the 2014 Budget that municipalities with households served by bucket systems
must prioritise sanitation upgrades is retained.
The municipal infrastructure grant is allocated through a formula with a vertical and horizontal division.
The vertical division allocates resources between sectors and the horizontal division takes account of
poverty, backlogs and municipal powers and functions in allocating funds to municipalities. The five main
components of the formula are described in the box.
Table W1.28 Infrastructure grants to local government, 2011/12 – 2017/18
2011/12 2012/13 2013/14 2014/15 2015/16 2016/17 2017/18
R million
Revised
estimate
Direct transfers 24 643 27 923 31 991 33 345 36 440 37 254 39 911
Municipal infrastructure 11 443 13 879 14 224 14 429 14 956 15 548 16 435
Municipal water infrastructure – – 602 536 1 804 1 186 1 773
Urban settlements development 6 267 7 392 9 077 10 285 10 554 11 076 11 708
Integrated national electrification
programme
1 097 1 151 1 635 1 105 1 980 2 036 2 197
Public transport network 4 612 4 884 5 550 5 871 5 953 6 163 6 610
Neighbourhood development
partnership
738 578 586 591 607 624 663
Integrated city development – – 40 255 251 267 292
Rural roads asset management
systems
35 37 52 75 97 102 107
Rural households infrastructure – – 107 5 48 113 124
Municipal disaster recovery 450 – 118 194 189 140 –
Indirect transfers 2 541 4 548 5 523 8 536 10 395 10 634 10 916
Integrated national electrification
programme
1 165 1 879 2 141 2 948 3 613 3 776 3 946
Neighbourhood development
partnership
50 80 55 58 26 22 28
Regional bulk infrastructure 1 260 2 523 3 261 4 005 4 922 5 324 4 855
Municipal water infrastructure – – – 559 792 1 512 2 087
Bucket eradication programme – – – 899 975 – –
Rural households infrastructure 65 65 65 66 67 – –
Total 27 184 32 471 37 514 41 881 46 835 47 888 50 826
Source: National Treasury
Outcome Medium-term estimates
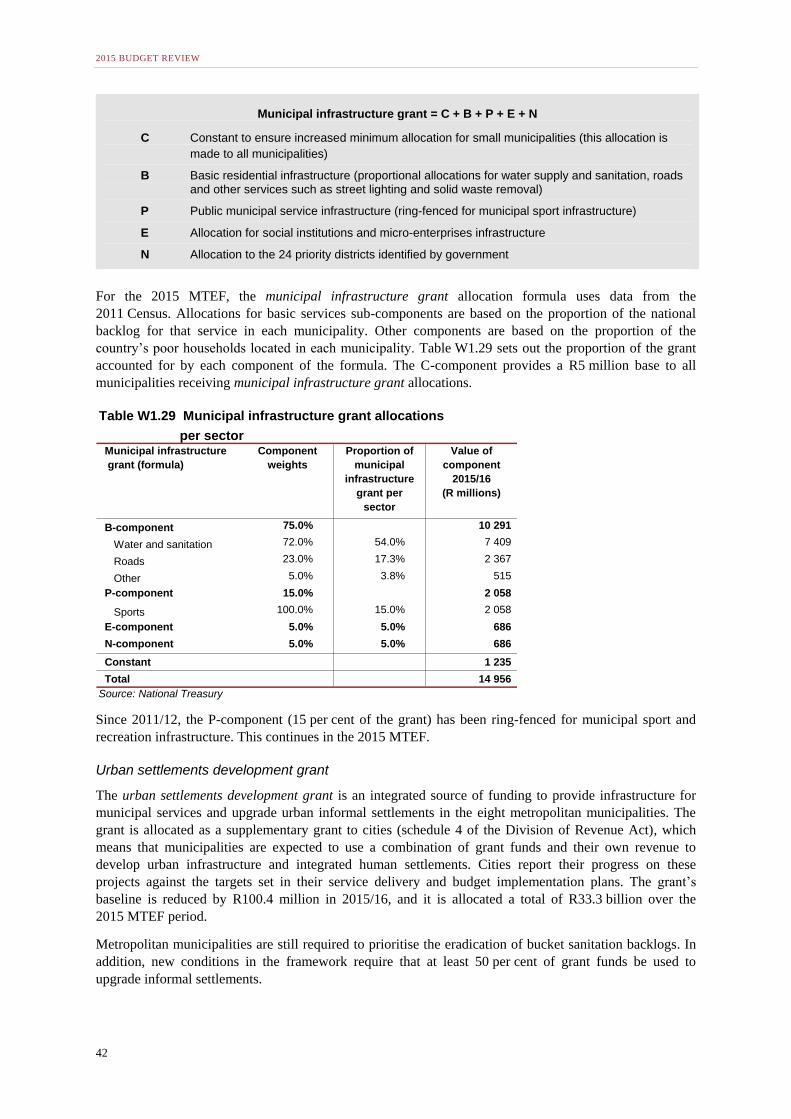
2015 BUDGET REVIEW
42
Municipal infrastructure grant = C + B + P + E + N
C Constant to ensure increased minimum allocation for small municipalities (this allocation is
made to all municipalities)
B Basic residential infrastructure (proportional allocations for water supply and sanitation, roads and other services such as street lighting and solid waste removal)
P Public municipal service infrastructure (ring-fenced for municipal sport infrastructure)
E Allocation for social institutions and micro-enterprises infrastructure
N Allocation to the 24 priority districts identified by government
For the 2015 MTEF, the municipal infrastructure grant allocation formula uses data from the
2011 Census. Allocations for basic services sub-components are based on the proportion of the national
backlog for that service in each municipality. Other components are based on the proportion of the
country’s poor households located in each municipality. Table W1.29 sets out the proportion of the grant
accounted for by each component of the formula. The C-component provides a R5 million base to all
municipalities receiving municipal infrastructure grant allocations.
Since 2011/12, the P-component (15 per cent of the grant) has been ring-fenced for municipal sport and
recreation infrastructure. This continues in the 2015 MTEF.
Urban settlements development grant
The urban settlements development grant is an integrated source of funding to provide infrastructure for
municipal services and upgrade urban informal settlements in the eight metropolitan municipalities. The
grant is allocated as a supplementary grant to cities (schedule 4 of the Division of Revenue Act), which
means that municipalities are expected to use a combination of grant funds and their own revenue to
develop urban infrastructure and integrated human settlements. Cities report their progress on these
projects against the targets set in their service delivery and budget implementation plans. The grant’s
baseline is reduced by R100.4 million in 2015/16, and it is allocated a total of R33.3 billion over the
2015 MTEF period.
Metropolitan municipalities are still required to prioritise the eradication of bucket sanitation backlogs. In
addition, new conditions in the framework require that at least 50 per cent of grant funds be used to
upgrade informal settlements.
Table W1.29 Municipal infrastructure grant allocations
per sector Municipal infrastructure
grant (formula)
Component
weights
Proportion of
municipal
infrastructure
grant per
sector
Value of
component
2015/16
(R millions)
B-component 75.0% 10 291
Water and sanitation 72.0% 54.0% 7 409
Roads 23.0% 17.3% 2 367
Other 5.0% 3.8% 515
P-component 15.0% 2 058
Sports 100.0% 15.0% 2 058
E-component 5.0% 5.0% 686
N-component 5.0% 5.0% 686
Constant 1 235
Total 14 956
Source: National Treasury
ANNEXURE W1: EXPLANATORY MEMORANDUM TO THE DIVISION OF REVENUE
43
Integrated cities development grant
The grant provides a financial incentive for metropolitan municipalities to focus their use of infrastructure
investment and regulatory instruments to achieve more compact and efficient urban spaces. Cities are
required to submit built environment performance plans for this grant, including a brief strategic overview
of the city’s plans for the built environment, with a focus on the infrastructure grants that form part of the
capital budget. The plan should show how the municipality will ensure alignment between its different
grant-funded programmes and how it will address related policy and regulatory matters. All projects
funded by sector-specific infrastructure grants, including the urban settlements development grant, the
public transport infrastructure grant, the neighbourhood development partnership grant and the integrated
national electrification programme grant, must form part of a metropolitan municipality’s built
environment performance plan. The grant’s baseline reduction amounts to R14.7 million in 2015/16 and it
is allocated R810.2 million over the 2015 MTEF period.
Neighbourhood development partnership grant
The neighbourhood development partnership grant supports cities in developing and implementing urban
network plans. The aim is to create a platform for third-party public and private investment, which will
improve the quality of life in township urban hubs. Projects in towns and rural areas are implemented in
conjunction with the Department of Rural Development and Land Reform to support catalytic projects in
these areas. The baseline reduction on this grant in 2015/16 is R22.1 million. The grant is allocated
R2 billion over the MTEF period, which consists of R1.9 billion for the capital (direct) grant and
R75.8 million for the technical assistance (indirect) grant.
Municipal water infrastructure grant
This grant was introduced in 2013/14 to accelerate the delivery of clean water to communities that do not
have access to basic water services. The grant, administered by the Department of Water and Sanitation,
provides funding for various projects, including the construction of new infrastructure and the
refurbishment and extension of existing water schemes. It has both direct and indirect components. In areas
where municipalities have the capacity to implement projects themselves, funds will be transferred through
a direct grant. In other areas, the Department of Water and Sanitation will implement projects on behalf of
municipalities through an indirect grant. As with other indirect grants, the national department is required
to transfer skills to the municipalities benefiting from the indirect grant, so that they will be able to
implement projects themselves in future. In 2015/16, R500 million is shifted from the indirect to the direct
portion of the grant as municipal capacity to deliver improves. Following a reprioritisation within the
department, an addition of R1 billion will be made available in 2017/18, which is split equally between the
direct and indirect components.
The grant’s baseline is reduced by R76.3 million in 2015/16. It has a total allocation of R9.2 billion over
the 2015 MTEF period, consisting of R4.8 billion and R4.4 billion for the direct and indirect components
respectively.
Following the outcomes of the first phase of the local government infrastructure grant review, the
municipal water infrastructure grant is one of several water and sanitation grants that will be restructured
over the 2015 MTEF period. This grant is expected to merge with other water and sanitation grants for a
more consolidated water services funding package to municipalities. Further details will be announced in
the 2015 Medium Term Budget Policy Statement.
Regional bulk infrastructure grant
This indirect grant supplements the financing of the social component of regional bulk water and sanitation
infrastructure. It targets projects that cut across several municipalities or large bulk projects within one
municipality. The grant funds the bulk infrastructure needed to provide reticulated water and sanitation
services to individual households. It may also be used to appoint service providers to carry out feasibility
studies, related planning or management studies for infrastructure projects. A parallel programme on the
budget of the Department of Water and Sanitation also funds water boards for the construction of bulk
2015 BUDGET REVIEW
44
infrastructure. Though not part of the division of revenue, these projects still form part of the Department
of Water and Sanitation’s larger programme of subsidising the construction of regional bulk infrastructure
for water and sanitation.
Following reprioritisation in the department, additions of R700 million in 2015/16 and a further
R700 million in 2016/17 have been made to the grant, bringing its total value to R15.1 billion over the
2015 MTEF period.
Rural households infrastructure grant
The rural households infrastructure grant funds the provision of on-site solutions for sanitation services
for rural households where piped infrastructure is not feasible. The grant is now managed by the
Department of Water and Sanitation, as a result of the shift of the sanitation function from the Department
of Human Settlements. The grant has both direct and indirect components. In areas where municipalities
have the capacity to implement projects themselves, funds will be transferred through the direct grant. In
other areas, the Department of Water and Sanitation will implement projects on behalf of municipalities
through an indirect grant. The baseline reduction on this grant in 2015/16 amounts to R2.8 million. It is
allocated R353.2 million over the 2015 MTEF period and will be subject to the aforementioned
restructuring of water and sanitation grants.
Bucket eradication programme grant
The bucket eradication programme grant – previously the indirect human settlements development grant
to provinces under the Department of Human Settlements – is an indirect grant to municipalities
administered by the Department of Water and Sanitation. It retains the same purpose of eradicating bucket
sanitation systems, but it is now better aligned with functional arrangements, given that sanitation is a
municipal function. The bucket eradication programme was established in 2014 for a period of two years,
which is why this grant has an allocation of R975.4 million for 2015/16 only. Several other grants also
fund the upgrading of sanitation backlogs, including the municipal infrastructure grant, the urban
settlements development grant and the rural households infrastructure grant.
Integrated national electrification programme
The national electrification programme has been instrumental in providing 85 per cent of all households
with access to electricity, as reported in the 2011 Census. To sustain progress in connecting poor
households to electricity, government will spend R17.5 billion over the next three years on the programme,
representing average annual growth of 14.9 per cent over the MTEF period. Of this, municipalities are
allocated R6.2 billion and Eskom is allocated R11.3 billion to spend on behalf of municipalities through an
indirect grant. The baseline reduction on this grant in 2015/16 amounts to R75.7 million.
Public transport network grant
The public transport network grant, administered by the Department of Transport, helps cities create or
improve public transport systems in line with the National Land Transport Act (2009) and the Public
Transport Strategy. This includes all integrated public transport network infrastructure, such as bus rapid
transit systems, conventional bus services and upgrades for pedestrian and cycling infrastructure. It also
subsidises the operations of these services. The grant is allocated R18.7 billion over the 2015 MTEF period.
This grant has been created through the merger of two separate grants: the public transport network
operations grant and the public transport infrastructure grant, for operational and infrastructure
expenditure respectively. This consolidation is the first step towards changing the implicit incentives in the
grant structure, so that cities are encouraged to plan for systems that will meet their public transport needs
while still being financially sustainable over the long term. The grant will still have separate operational
and capital windows but it will be easier to shift funds between these windows. As a result, cities will have
to trade-off increased capital funding from the grant against the need to make greater contributions from
their own funds to the operating costs of their networks. During 2015, the grant’s allocation method and
rules will be further refined as part of the review of local government infrastructure grants.
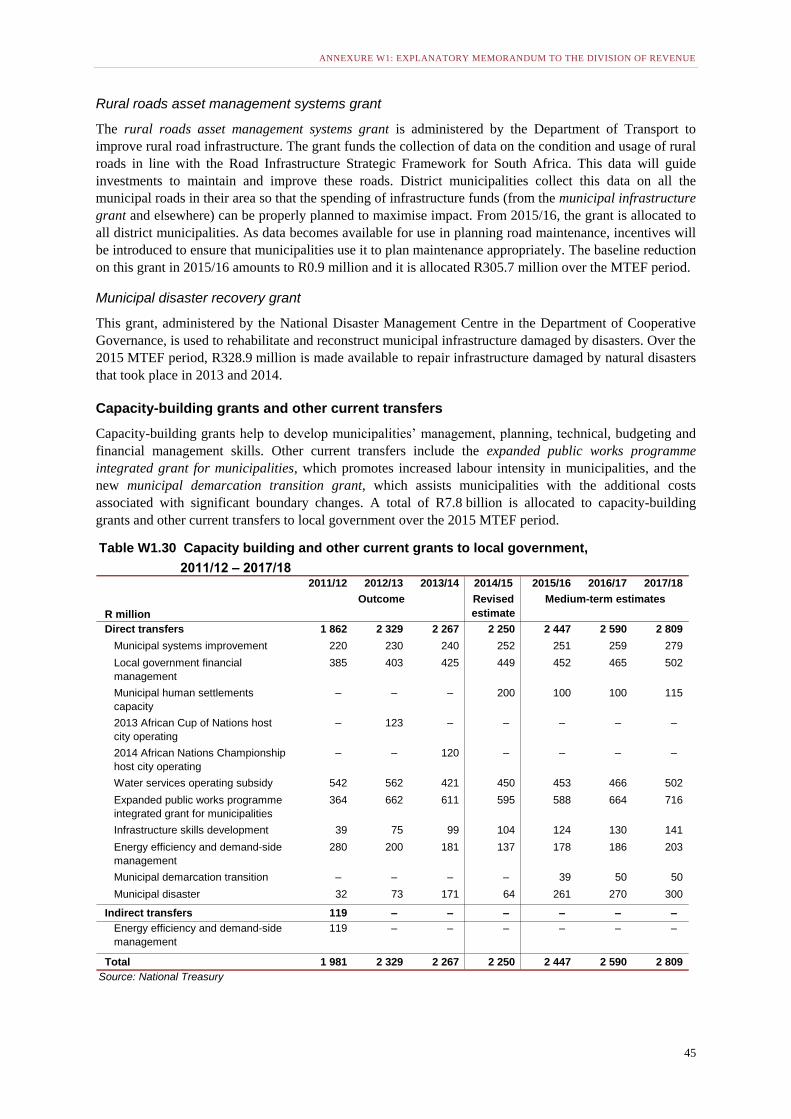
ANNEXURE W1: EXPLANATORY MEMORANDUM TO THE DIVISION OF REVENUE
45
Rural roads asset management systems grant
The rural roads asset management systems grant is administered by the Department of Transport to
improve rural road infrastructure. The grant funds the collection of data on the condition and usage of rural
roads in line with the Road Infrastructure Strategic Framework for South Africa. This data will guide
investments to maintain and improve these roads. District municipalities collect this data on all the
municipal roads in their area so that the spending of infrastructure funds (from the municipal infrastructure
grant and elsewhere) can be properly planned to maximise impact. From 2015/16, the grant is allocated to
all district municipalities. As data becomes available for use in planning road maintenance, incentives will
be introduced to ensure that municipalities use it to plan maintenance appropriately. The baseline reduction
on this grant in 2015/16 amounts to R0.9 million and it is allocated R305.7 million over the MTEF period.
Municipal disaster recovery grant
This grant, administered by the National Disaster Management Centre in the Department of Cooperative
Governance, is used to rehabilitate and reconstruct municipal infrastructure damaged by disasters. Over the
2015 MTEF period, R328.9 million is made available to repair infrastructure damaged by natural disasters
that took place in 2013 and 2014.
Capacity-building grants and other current transfers
Capacity-building grants help to develop municipalities’ management, planning, technical, budgeting and
financial management skills. Other current transfers include the expanded public works programme
integrated grant for municipalities, which promotes increased labour intensity in municipalities, and the
new municipal demarcation transition grant, which assists municipalities with the additional costs
associated with significant boundary changes. A total of R7.8 billion is allocated to capacity-building
grants and other current transfers to local government over the 2015 MTEF period.
Table W1.30 Capacity building and other current grants to local government,
2011/12 – 2017/182011/12 2012/13 2013/14 2014/15 2015/16 2016/17 2017/18
R million
Revised
estimate
Direct transfers 1 862 2 329 2 267 2 250 2 447 2 590 2 809
Municipal systems improvement 220 230 240 252 251 259 279
Local government financial
management
385 403 425 449 452 465 502
Municipal human settlements
capacity
– – – 200 100 100 115
2013 African Cup of Nations host
city operating
– 123 – – – – –
2014 African Nations Championship
host city operating
– – 120 – – – –
Water services operating subsidy 542 562 421 450 453 466 502
Expanded public works programme
integrated grant for municipalities
364 662 611 595 588 664 716
Infrastructure skills development 39 75 99 104 124 130 141
Energy efficiency and demand-side
management
280 200 181 137 178 186 203
Municipal demarcation transition – – – – 39 50 50
Municipal disaster 32 73 171 64 261 270 300
Indirect transfers 119 – – – – – –
Energy efficiency and demand-side
management
119 – – – – – –
Total 1 981 2 329 2 267 2 250 2 447 2 590 2 809
Source: National Treasury
Outcome Medium-term estimates
2015 BUDGET REVIEW
46
Municipal human settlements capacity grant
This grant, administered by the Department of Human Settlements, funds capacity building for the
development of human settlements in metropolitan municipalities. It was introduced in 2014/15 to fund
capacity for the six metropolitan municipalities that were due to be assigned the housing function. The
assignment process for this function has been held in abeyance, so the grant will now be extended to all
eight metropolitan municipalities to build their capacity to deliver and subsidise the operational costs of
administering human settlement programmes. Due to the changed focus of this grant, a larger baseline
reduction has been effected on it than on other grants. In 2015/16, the baseline reduction on this grant is
R200 million. The grant has allocations of R100 million in 2015/16, R100 million in 2016/17 and
R115 million in 2017/18.
Municipal demarcation transition grant
The municipal demarcation transition grant, administered by the Department of Cooperative Governance,
assists municipalities with additional costs that may arise during the transition to the new municipal
boundaries due to come into effect after the 2016 local government elections. Only municipalities affected
by type C boundary changes, involving amalgamations and category changes in terms of the Municipal
Demarcation Board classifications, will receive allocations. The grant is therefore only allocated to the
municipalities in KwaZulu-Natal and Gauteng that are affected by municipal mergers. This transitional
grant has been introduced for a period of three years. It has been allocated R39 million in 2015/16,
R50 million in 2016/17 and R50 million in 2017/18.
Local government financial management grant
The local government financial management grant, managed by the National Treasury, funds the
placement of financial management interns and the modernisation of financial management systems. This
includes building in-house municipal capacity to implement multi-year budgeting, linking integrated
development plans to budgets, and producing quality and timely in-year and annual reports. The grant
supports municipalities in the implementation of the Municipal Finance Management Act and also
provides funds for the implementation of the municipal standard chart of accounts. The grant’s baseline is
reduced by R17.3 million in 2015/16. Total allocations amount to R1.4 billion over the 2015 MTEF
period.
Infrastructure skills development grant
The infrastructure skills development grant develops capacity within municipalities by creating a
sustainable pool of young professionals with technical skills related to municipal services, such as water,
electricity and town planning. The grant places interns in municipalities, so they can complete the
requirements of the relevant statutory council within their respective built environment fields. The interns
can be hired by any municipality at the end of their internship. The grant’s baseline reduction in 2015/16
amounts to R4.8 million and it is allocated R395.7 million over the 2015 MTEF period.
Municipal systems improvement grant
This grant helps municipalities perform their functions and stabilise institutional and governance systems,
as required in the Municipal Systems Act (2000) and related legislation. The grant’s baseline is reduced by
R9.6 million in 2015/16. It is administered by the Department of Cooperative Governance and is allocated
R788.9 million over the 2015 MTEF period.
Expanded public works programme integrated grant for municipalities
This grant promotes the use of labour-intensive methods in delivering municipal infrastructure and
services. It is allocated through a formula based on past performance, which creates an incentive for
municipalities. The formula has an extra weighting to give bigger allocations to poor, rural municipalities.
R8.5 million in 2015/16 was reprioritised out of this grant during the 2015 budget process. The baseline
ANNEXURE W1: EXPLANATORY MEMORANDUM TO THE DIVISION OF REVENUE
47
reduction on this grant in 2015/16 amounts to R22.8 million and it is allocated R2 billion over the 2015
MTEF period.
The energy efficiency and demand-side management grant
The energy efficiency and demand-side management grant funds selected municipalities to implement
energy-efficiency projects, with a focus on public lighting and energy-efficient municipal infrastructure. In
the 2015 MTEF period, the Department of Energy will monitor and verify grant-funded projects to ensure
greater consistency in the procurement of accredited verification services. The grant’s baseline is reduced
by R10.4 million in 2015/16 and it is allocated R566.8 million over the 2015 MTEF period.
The water services operating subsidy grant
The water services operating subsidy grant funds the refurbishment of water schemes previously owned
and managed by the national Department of Water and Sanitation. The grant used to have an indirect
component that funded the costs of staff transfers to municipalities, but this is no longer needed because no
further staff transfers are anticipated. Staff remaining with the national department will be paid using the
R142.6 million that has been allocated to the department’s budget baseline.
The baseline reduction on the remaining direct portion of the grant is R17.3 million in 2015/16. It is
allocated R1.4 billion over the 2015 MTEF period and will be subject to the aforementioned restructuring
of water and sanitation grants.
Municipal disaster grant
The municipal disaster grant is administered by the National Disaster Management Centre in the
Department of Cooperative Governance as an unallocated grant to local government. The centre is able to
disburse disaster-response funds immediately – without the need for the transfers to be gazetted first. Due
to past underspending on this grant, R300 million has been reprioritised out of the grant over the 2015
MTEF period. To ensure that sufficient funds are available in the event of disasters, section 26 of the
Division of Revenue Bill allows for funds allocated to the provincial disaster grant to be transferred to
municipalities if funds in the municipal disaster grant have already been exhausted, and vice versa. The
bill also allows for more than one transfer to be made to areas affected by disasters, so that initial
emergency aid can be provided before a full assessment of damages and costs is complete. The baseline
reduction on this grant in 2015/16 amounts to R15.3 million. Over the MTEF period, R831.4 million is
available for disbursement through this grant.
Part 6: Future work on provincial and municipal fiscal frameworks
The fiscal frameworks for provincial and local government encompass all their revenue sources and
expenditure responsibilities. As underlying social and economic trends evolve and the assignment of
intergovernmental functions change, so must the fiscal frameworks. The National Treasury, together with
relevant stakeholders, conducts continuous reviews to ensure that provinces and municipalities have an
appropriate balance of available revenues and expenditure responsibilities, while taking account of the
resources available and the principles of predictability and stability. This part of the annexure describes the
main areas of work to be undertaken during 2015/16 as part of the ongoing review and refinement of the
intergovernmental fiscal framework. Provinces and municipalities will be consulted on all proposed
changes to the fiscal frameworks.
The role of provinces and local government in promoting economic development
Provinces and municipalities play a crucial role in advancing the economic development of their respective
precincts. Fully functional, well-equipped schools will produce a vibrant and employable workforce, which
promotes higher employment. Smarter health systems develop and maintain the health of the workforce.
Provincial agriculture departments’ support to farmers can stimulate rural development. The provision of
provincial and municipal roads and public transport services ensures mobility for goods and workers, while
2015 BUDGET REVIEW
48
basic municipal services such as water, electricity and refuse removal, as well as business licencing and
environmental health functions, enable businesses to operate and grow. Well-managed procurement can
maximise developmental impact without compromising efficiencies.
Government in all three spheres must work with businesses and other relevant stakeholders to provide an
enabling environment for the faster and more inclusive economic growth called for in the National
Development Plan. From 2015, national and provincial treasuries will work together through a task team of
the Technical Committee on Finance to better define the role provinces should play in promoting economic
development. This will enable provinces to maximise their impact on provincial economies in future.
Local government infrastructure grants review
The local government infrastructure grant system is being reviewed to improve the efficiency and
effectiveness of infrastructure grants to municipalities. The National Treasury is leading the review in
collaboration with the Department of Cooperative Governance, the Department of Planning, Monitoring
and Evaluation, the FFC and SALGA through a working group and a steering committee. The first phase
of the review was completed in September 2014, when the Budget Forum endorsed a set of principles for
the grant system and a broad outline of the reforms’ direction. A working paper detailing the draft
recommendations is available for comment on the National Treasury’s Municipal Finance Management
Act website (http://mfma.treasury.gov.za/Media_Releases/ReviewOfLGInfrastructureGrants/Pages/
default_final.aspx).
The second phase of the review continues in 2015 to develop the draft recommendations for reform. Based
on the Budget Forum’s endorsement, the reforms will broadly focus on the following areas:
Rationalising the number of grants that each municipality receives
Greater differentiation in the types of grants and levels of oversight for different municipalities
Life-cycle asset management to sustain the functionality of existing infrastructure
Strengthening administrative oversight to avoid ad-hoc proliferation of grants
Standardising reporting to increase accountability
Improving performance monitoring and benchmarking.
Small changes to certain grants have already been implemented to align with the strategic direction of the
reforms. Following further analysis and stakeholder engagement, the review’s working group and steering
committee will use the draft recommendations to develop final reforms that will be discussed at the Budget
Forum. The outcomes will be announced in October 2015, at the time of the Medium Term Budget Policy
Statement, to prepare municipalities and other role-players for a phased implementation of reforms over
the 2016 MTEF period.
Municipal demarcations
As described in part 5 of this annexure, a new municipal demarcation transition grant was introduced in
the 2015 MTEF. In 2015/16, allocations are divided equally across the municipalities affected by
amalgamations and category changes to prepare for the demarcations. Funds remain unallocated in the
outer years, but work will continue in 2015 to develop appropriate criteria for allocating funds in 2016/17
and 2017/18 to the new municipalities that will come into effect following the 2016 local government
elections.
These new municipalities do not yet legally exist, so they do not have indicative allocations for 2016/17
and 2017/18 in the 2015 Division of Revenue Bill. The 2011 Census data will have to be recalculated for
the new municipal areas to determine indicative allocations for large formula-driven allocations such as the
local government equitable share and the municipal infrastructure grant. Statistics South Africa has
already been asked to recalculate this data and the National Treasury will work with transferring officers to
develop indicative allocations for the newly formed municipalities. These allocations will be published on
the Municipal Finance Management Act website and shared with the relevant municipalities during 2015.
ANNEXURE W1: EXPLANATORY MEMORANDUM TO THE DIVISION OF REVENUE
49
This will enable improved planning and budgeting before the demarcations come into effect, which will
help ensure that service delivery is not adversely affected by grant allocation uncertainty.
As per its first circular of 2015, the Municipal Demarcation Board is considering the request of the
Minister of Cooperative Governance and Traditional Affairs to re-determine the boundaries of a number of
additional municipalities. Should further demarcations result from this process, the National Treasury will
work with relevant stakeholders and consult the Budget Forum on how the local government fiscal
framework should respond. Any changes will be implemented in the 2016 Budget.
Supporting cities to promote urban spatial transformation and economic growth
Cities, through delivery of infrastructure and services, play an important role in creating a conducive
environment for inclusive growth, job creation and poverty eradication. To achieve this will require well-
managed spatial transformation of cities. Government is exploring changes to the fiscal and regulatory
structures for urban municipalities to ensure that they have sufficient and effective instruments to mobilise
revenue for financing municipal strategic infrastructure capable of promoting growth.
Potential changes to the structure of the fiscal framework include:
Consolidating urban grants and enhancing the use of performance incentives with transfers, such as
with the integrated cities development grant (this work will form part of the review of local
government infrastructure grants).
Enabling greater flexibility in the use of grants to accelerate the implementation of catalytic
investments.
Enabling cities to leverage grant and own-revenue funds over a longer period for strategic projects.
These measures will be complemented by reviews of, and potential changes to, the regulatory structures
for development charges, municipal borrowing and metropolitan municipalities’ own-revenue powers.
Any potential changes to the fiscal and regulatory systems will also be accompanied by additional
technical support to further strengthen the capacity of cities to take advantage of these changes. The Cities
Support Programme is coordinating initiatives in this area. Cities are already receiving expanded project
preparation support to help them build a pipeline of strategic investment projects that can attract private
finance. In addition, the Development Bank of Southern Africa is increasing its assistance to give cities
better access to funding for strategic projects by enhancing their appraisal and supervision arrangements or
extending the average debt maturity.
Regulating development charges
A development charge is a once-off infrastructure access fee imposed on a land owner as a condition of
approving a land development that will substantially increase the use of or need for municipal
infrastructure engineering services. Development charges are based on the concept that urban growth and
expanded land use creates the need for additional infrastructure services, therefore the developer should
pay the incidence costs. This prevents the financial burden from being imposed on municipalities or
existing communities through higher tariffs and rates.
In 2009, the National Treasury, in conjunction with metropolitan municipalities and other stakeholders,
began to develop a national policy framework for municipal development charges. The National Treasury
is amending the Municipal Fiscal Powers and Functions Act (2007) to incorporate the regulation of
development charges. Consultations with relevant stakeholders on the draft policy framework for
development charges will take place in 2015 and a draft bill will be published by mid-2015.
Reforming municipal borrowing
Long-term borrowing can be an effective way for municipalities to finance infrastructure development.
However, responsible borrowing requires an appropriate institutional framework and financial controls.
The Policy Framework for Municipal Borrowing and Financial Emergencies (1999) and the Municipal
2015 BUDGET REVIEW
50
Finance Management Act set a range of measures to facilitate responsible municipal borrowing. These
measures deal with issues such as sovereign risk, credit enhancements, maturities, avoidance of direct
government assistance, and liquidity through the development of secondary markets.
Despite these measures, there are still some bottlenecks that impede the full participation of municipalities
in the debt market to mobilise resources for infrastructure development. In October 2014, the National
Treasury started a two-year review of the system of municipal borrowing to expand its scope. During this
period, it will analyse the existing policy and regulatory framework, strengthen partnerships with financial
institutions, improve monitoring and evaluation, and design municipal capacity-building programmes and
strategies for responsible municipal borrowing. To date, the National Treasury has conducted consultation
sessions with private lenders, investors and credit rating agencies to better understand the existing
challenges. In 2015/16, government will work with the Development Bank of Southern Africa to further
expand the scope for private lending to municipalities, including measures to improve liquidity in the
municipal bond market and extend bond maturities. These measures include:
Municipal infrastructure bonds
Municipal bond underwriting by the Development Bank of Southern Africa
Innovations in project finance (such as tax increment financing and special district areas).
Reviewing own-revenue sources for metropolitan municipalities
Government is reviewing metropolitan municipalities’ own-revenue sources to assess whether they are
adequate to meet service delivery and development mandates. A task team consisting of the National
Treasury, the Department of Cooperative Governance, SALGA, the FFC, and metropolitan municipalities
was established in 2014. The review seeks to answer the following questions:
Are metropolitan municipalities’ budgets complying with the principle of matching revenue sources
with corresponding expenditure categories?
To what extent are metropolitan municipalities maximising the full scope of existing own-revenue
sources?
Are existing sources of revenue buoyant, adequate and sustainable for metropolitan municipalities to
execute their present expenditure responsibilities, and are they sustainable in the medium to long term?
What are the challenges that prevent metropolitan municipalities from optimising their use of existing
revenue sources?
Is the sharing of the general fuel levy an appropriate long-term revenue source? Metropolitan
municipalities have raised concerns that the long-term effects of sharing a revenue source based on fuel
consumption is contrary to their mandate of encouraging the use of public transport.
Based on the review’s outcomes, recommendations will be made to Budget Forum in October 2015 for
reforms to the local government fiscal framework that better allow metropolitan municipalities to meet
their mandate. Parallel to this process, the National Treasury is developing a local government fiscal
decentralisation framework that will outline the different types of own-revenue sources applicable to
different types of South African municipalities. These sources will be considered in line with existing
legislation.
Municipal Property Rates Amendment Act
The Municipal Property Rates Act (2004), which is administered by the Department of Cooperative
Governance, regulates the power of municipalities to impose rates on properties. The act was amended
through the Municipal Property Rates Amendment Act (2014), which will come into effect on 1 July 2015.
The amendment act improves transparency in the categorisation of property and the determination of rates
for each property category, which strengthens oversight. The amendments provide for the property rates
liability to be phased out over a five-year period on the following properties: national, provincial and other
public roads; water or sewer pipes; railway lines; runways or aprons at national or provincial airports; and
ANNEXURE W1: EXPLANATORY MEMORANDUM TO THE DIVISION OF REVENUE
51
breakwaters, sea walls, channels and basins. These exclusions are made because of the importance of these
types of infrastructure in enabling economic growth and social change. The act also strengthens its
regulatory, monitoring and reporting provisions, which in turn will improve its implementation and
minimise legal ambiguities. The Department of Cooperative Governance will implement the regulatory
framework that will give effect to the amendment act in due course.