welcome! curriculum forum - esc-20 foru… · · 2015-04-282015-04-29 · 2015-2016 curriculum...
TRANSCRIPT

Welcome!
Curriculum ForumApril 29, 2015


Instructional Services
Spring/Summer
Professional Development http://esc20.net/default.aspx?name=ci_cf.ISPD

2015-2016 Curriculum Forum Dates
September 9, 20158:30 a.m.-11:30 a.m.• Curriculum Forum
1:00-4:00-• Regional Math Coordinator’s Meetings• Alamo Area Regional Science Leaders • Leaders In Literacy • Social Studies Leadership Forum• RtI (9/9/2015 and 2/3/2016 Only)
October 28, 2015
February 3, 2016
April 27, 2016
September 9, 2016

Special Education
UpdatesErin Kelts and Catherine Wilson

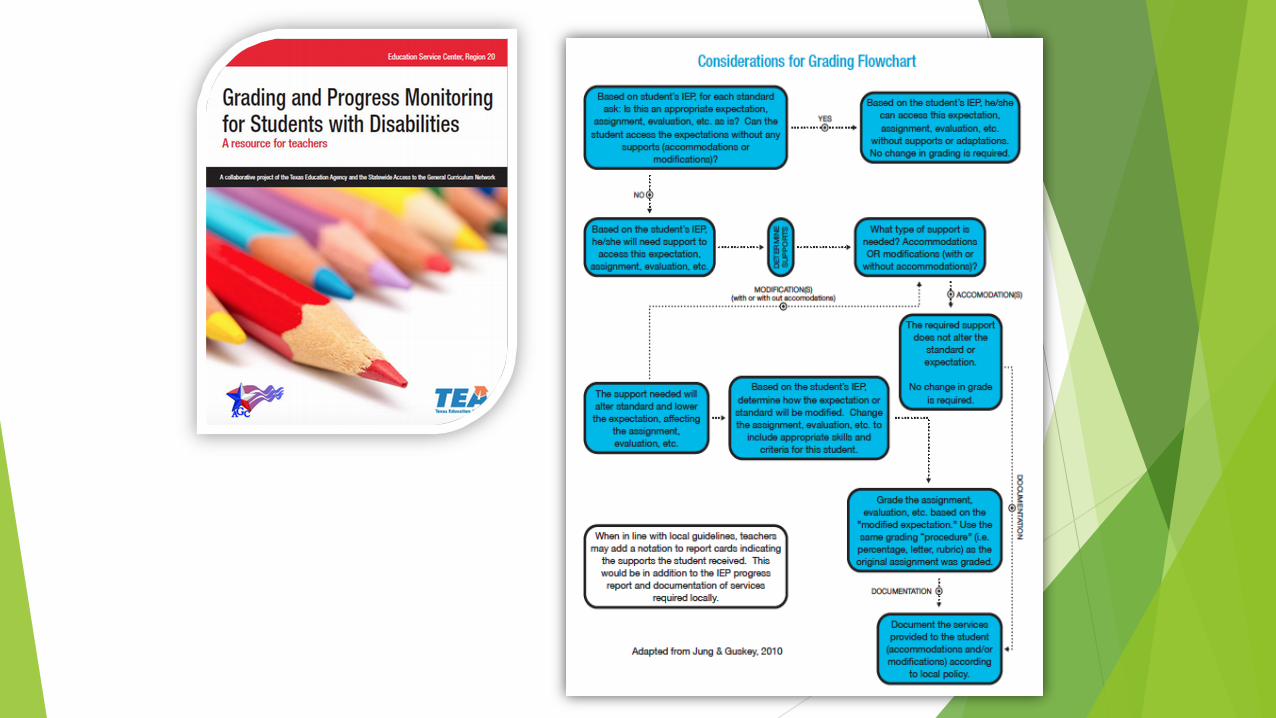
New State Guidance on Grading Students
with Special Needs

Catherine Wilson
Educational Specialist,
AGC
Erin M. Kelts
Project Manager, AGC Network
210.370.5664

Texas’ State Guidance Document
on Grading
www.esc20.net/agcnetwork

Grading
Guidance
Document
Now Added


Upcoming iLearning
Sessions:
• May 13, 2015
• October 5, 2015
• January 20, 2016
*Client can contract the
session and customize
to meet LEA’s needs.

A+ Grading & Progress Monitoring
for Students with Disabilities
Workshop Outline: Legal Citations as they apply to Texas Schools
Grading Philosophies: Defining the purpose and meaning of grades
The Who and What...What decisions can you make, who can make them and who’s responsible for what?
Inclusive Grading Practices: Flowchart for Grading and Accommodations/Modifications
Progress Monitoring and CBM’s
Best Practices for Schools
Facilitating change at the classroom and campus level...

Senate Bill 149Alicia Thomas, PH.D
Moak, Casey, & Associates

SAT RedesignMelany Franklin
http://www.esc20.net/users/0130/docs/Curriculum%20Forum%204.29.15/rSAT%20presentation%20updated%204-21-15.pdf

Break!

Accountability Update Cheri Hendrick
Accountability & Assessment Specialist

Curriculum ForumApril 29, 2015
Cheri HendrickAccountability and Assessment Specialist, School Support
(210)370-5451

Grade 5 & 8 Reading Results

Student Success Initiative (SSI)
• Results received by April 20, 2015 in the Texas Assessment Management System (online reports only)
• 2014-15 SSI Manual– Timeline page 9, by April 27:
• Notify parent of results for the STAAR grade 5 or 8 reading assessment
• As well as plans for accelerated instruction for students who did not meet the passing standard
• Retest Tuesday, May 12, 2015

STAAR Results for 2015

May 22: only raw scores will be reported– Excluded in state accountability– TBD method of inclusion in federal accountability
Mid June: bridge study cut scores published
Mid July: Consolidated Accountability File (CAF) data file will contain bridge study results for:– Phase-in 1 Level II, – Final Level II and – Level III
September 2015: updated CSRs delivered to schools
Grades 3-8 Math STAAR Results

23
New Summary Reports for 2015
When calculating all tests, for example all Reading tests, make sure you include at the versions of the test. Summary Reports are not consolidated.
STAAR Grade 5 Reading Page 1
STAAR Grade 5 Summary Page 13
STAAR Spanish Grade 5 Summary Page 14
STAAR L Grade 5 Summary Page 15
STAAR Modified Grade 5 Summary Page 16
STAAR Alternate will
be reported with the
May Grades 3-8 and
June EOC reports

2015 Accountability and the
Commissioner of Education Final Decisions
posted April 8, 2015
Summary of Final Decisions for 2015 State Accountability

We have multiple Accountability Systems,including Federal.
2012 – first year of STAARno state accountability, however we had federal
accountability (it was the last year of AYP)

Assessments included in
2015 State Accountability

• Excluded from all 4 indexes and distinction designations– All STAAR A
– All STAAR Alternate 2
– Grades 3-8 Math
2015 Assessments &State Accountability
• Included: Reading, grades 3-8
Writing, grades 4 & 7
English I & II
Algebra I
Science, grades 5 & 8
Biology
o Social Studies, grade 8
o U.S. History

2015 State Accountability Targets

Non-AEA State Accountability TargetsAEA: Alternative Education Accountability
+ 5 Same as 2014
Meet: Index 1 OR Index 2* AND Index 3 AND Index 4

Alternative Education Accountability (AEA) State Accountability Targets
+ 5 Same as 2014
2015 AEA registration closed April 16, 2015
Meet: Index 1 OR Index 2* AND Index 3 AND Index 4

ELL parent denials in 2015 State
Accountability

In 2014, these students were excluded from
accountability because they did not have an ELL
progress measure as a result of parental denials.
2015 Distinction Designations


Changes to the Indexes for 2015

Overview of Performance Index Framework (one page)http://ritter.tea.state.tx.us/perfreport/account/2015/materials.html
In 2015 Met: Index 1 or
Index 2, Index 3
and Index 4

2015 Index 1: Student Achievement2015Target: non-AEA 60 / AEA 35
37
Index 1: Student Achievement is a snapshot of performance across subjects, on both general and alternative assessments, at the satisfactory performance standard.
Student Group: All Students– No minimum size
Combined over All Subjects: Reading, Mathematics, Writing, Science and Social Studies
Performance Standards: Phase-in 1 Level II (Satisfactory)– STAAR A, STAAR Alternate 2 and Grades 3-8 Math excluded
End of Course: – July ’14: English I & II, Algebra I, Biology & U.S. History
– Fall ’14: English I & II, Algebra I, Biology & U.S. History
– Spring ’15: English I & II, Algebra I, Biology & U.S. History
Substitute Assessments for STAAR EOC tests are included

38
Index 2: Student Progress
2015 Grade 7 Writing - 2012 Grade 4 Writing

39
2015 Index 2: Student Progress2015 Target: 5th percentile based on campus type, district 5th percentile across all campus typesIndex 2: Student Progress separates measures of student progress from measures of student achievement to provide an opportunity for diverse campuses to show the improvements they are making independent of overall achievement levels.
Ten student groups: All students Seven race/ethnicity groups Students with Disabilities English Language Learners (ELL)
The ELL subgroup will include current and monitored students
Combined across Subject Areas: Reading, Mathematics & Writing STAAR A, STAAR Alternate 2 and Grades 3-8 Math excluded
Writing included in 2015
Points based on weighted performance: One point given for each percentage of tests at the Met progress level An additional point given for each percentage of tests at the Exceeded progress
level

40
40
2015 Index 3: Closing Performance Gaps2015 Target: non-AEA Elem 28; MS 27; HS/K-12 31; District 28
AEA 11
Index 3: Closing Performance Gaps emphasizes advanced academic achievement of the economically disadvantaged student group and the lowest performing race/ethnicity student groups at each campus and district.
By Subject Area: Reading, Mathematics, Writing, Science, and Social Studies Student STAAR A, STAAR Alternate 2 and Grades 3-8 Math excluded
Student Groups: Economically Disadvantaged - No minimum size Two Lowest Performing Race/Ethnicity Groups
Based on 2014 Index 1 All Subjects Minimum size: 25 tests in Reading and Math
Points based on STAAR performance: One point for each percentage of tests at Phase-in 1 Level II (Satisfactory) One additional point for each percentage of tests at the Level III Advanced

41
2015 Index 4: Postsecondary ReadinessIndex 4: Postsecondary Readiness includes measures of high school completion and STAAR performance at the postsecondary readiness standard. This index emphasizes the importance of attaining a high school diploma that prepares students with the foundation necessary for success in college, the workforce, job training programs, or the military.
2015 Index 4 non-AEA Targets: Elementary Schools: 12 Middle Schools: 13 High Schools/K-12: 57
(based on all four components)* Districts: 57
(based on all four components)*
If all four components (STAAR Final Level II, Graduation Score, Graduation Plan, and College-Ready Graduates) are not available for high schools or districts, evaluate only the STAAR Final Level II performance at the following Index 4 targets: High Schools/K-12: 21* Districts: 13
2014 Index 4 AEA Targets: Both Components (STAAR
& Graduation/Dropout Rate): 33
Graduation/Dropout Rate Component: 45
Bonus: RHSP/DAP & College-Ready Graduates

42
2015 Index 4: Postsecondary Readiness2015 non-AEA Targets: Elem 12, MS 13, HS/K-12 & Districts 57*
(*based on 4 components)
STAAR Score: STAAR Percent Met Final Level ll on two or more tests for All Students and race/ethnicity student groups
Eight student groups: All students Seven race/ethnicity groups
Combined All Subjects: Reading, Mathematics, Writing, Science and Social Studies STAAR A, STAAR Alternate 2 and Grades 3-8 Math excluded Students tested on one subject area only must meet the final Level II
performance standard for that subject area. Students tested on only two subject areas must meet the final Level II
performance standard for both subject areas.
Only include EOC tests for students that tested for the FIRST time in 2014-15 accountability cycle July 2014, Fall 2014 and Spring 2015 Student EOC results for students that tested for the first time prior to the
2014-15 accountability cycle are not included in Index 4
Substitute Assessments for STAAR EOC tests are included

43
2015 Index 4: Postsecondary Readiness2015 Targets: Elem 12, MS 13,
HS/K-12 & Districts 57* (*based on 4 components)
Graduation Rate: Combined performance across graduation/dropout rates for:
Grade 9-12 Class of 2014 Four-Year Graduation Rate or
Grade 9-12 Class of 2013 Five-Year Graduation Rate whichever contributes the most points to the index Proposed that Foundations graduates be included
Ten student groups: All students Seven race/ethnicity groups Students with Disabilities English Language Learners (ELL)(ever LEP in HS)
2015 Index 4: Postsecondary Readiness2015 non-AEA Targets: Elem 12, MS 13, HS/K-12 & Districts 57*
(*based on 4 components)

44
2015 Index 4: Postsecondary Readiness2015 Targets: Elem 12, MS 13,
HS/K-12 & Districts 57* (*based on 4 components)
2015 Index 4: Postsecondary Readiness2015 non-AEA Targets: Elem 12, MS 13, HS/K-12 & Districts 57*
(*based on 4 components)
Graduation Plan ComponentClass of 2014 Four-year Recommended High School Program/Distinguished Achievement Program (RHSP/DAP) Rate Four-year Longitudinal Graduation Cohort
- began 9th grade in 2010-11
- No four-year longitudinal graduation cohort – use annual
percent of 2013-14 RHSP/DAP graduates
Proposed: Foundations graduates are excluded
Student groups: All students Seven race/ethnicity groups

45
Index 4: Postsecondary Readiness
2015 Postsecondary Readiness IndicatorThe 2014 Postsecondary Indicator (College-Ready Graduates) is expanded to include additional credit for students in other postsecondary readiness activities.
The 2015 Postsecondary Indicator will be defined as the percent of annually reported graduates that meet any one of three criteria, detailed below.
Student groups: All students Seven race/ethnicity groups
Indicator definitionNumber of annual graduates reported for school year 2013–14 that either:
1) meet TSI criteria in both reading/ELA and mathematics on TAKS, SAT, or ACTOR
2) completing and earning credit for at least two advanced/dual enrollment courses, OR
3) enrolling in a career and technical education (CTE) coherent sequence of courses as part of a four-yr. plan of study to take 2 or more CTE courses for 3 or more credits
-----------------------------------------------divided by--------------------------------------------
Number of annual graduates reported for school year 2013–14
2015 Index 4: Postsecondary Readiness2015 non-AEA Targets: Elem 12, MS 13, HS/K-12 & Districts 57* (*based on 4 components)

46
System Safeguards2015 Accountability System Safeguard Measures and Targets
IndicatorAll
StudentsAfrican Amer.
Amer. Indian
Asian HispanicPacific
IslanderWhite
Two or More Races
Eco.Disadv.
Curr & Mon ELL
Special Ed.
Performance – 2015 State Targets *
Reading TBD TBD TBD TBD TBD TBD TBD TBD TBD TBD TBD
Mathematics TBD TBD TBD TBD TBD TBD TBD TBD TBD TBD TBD
Writing TBD TBD TBD TBD TBD TBD TBD TBD TBD TBD TBD
Science TBD TBD TBD TBD TBD TBD TBD TBD TBD TBD TBD
Social Studies TBD TBD TBD TBD TBD TBD TBD TBD TBD TBD TBD
Performance – 2015 Federal Targets
Reading 83% 83% 83% 83% 83% 83% 83% 83% 83% 83% 83%
Mathematics 83% 83% 83% 83% 83% 83% 83% 83% 83% 83% 83%
Participation Rates
Reading 95% 95% 95% 95% 95% 95% 95% 95% 95% 95% 95%
Mathematics 95% 95% 95% 95% 95% 95% 95% 95% 95% 95% 95%
Federal Graduation Rates (including improvement targets)
4-year 83% 83% 83% 83% 83% 83% 83% 83% 83% 83% 83%
5-year 88% 88% 88% 88% 88% 88% 88% 88% 88% 88% 88%
District Limits on Use of Alternative Assessment Results
Reading: STAAR Alt 2 1% Not Applicable
Math: STAAR Alt 2 1% Not Applicable
* 2015 State Performance Targets will correspond to the performance target for 2015 Index 1: Student Achievement.
2015 no 2% cap only the 1% cap for Alternate 2
Excluded:- Grades 3-8 Math
- all STAAR A and
- all STAAR Alt 260

47
2015 Distinction Designations
Student Progress (based on Index 2)
Closing Performance Gaps (based on Index 3)
Academic Achievement in: Reading/English Language Arts Mathematics Science Social Studies
Postsecondary Readiness for campuses and districts
Per Texas Education Code (TEC) §39.201, alternative education campuses (AECs) evaluated under AEA provisions are not eligible for distinction designations.

48
Locally-Determined Accountability Ratings
Community and Student Engagement (TEC 39.0545)
Beginning with the 2013-14 school year, districts are required to evaluate community and student engagement for the district and each of their campuses and assign a rating.
Districts are required to assign a performance rating of exemplary, recognized, acceptable, or unacceptable based on locally-determined criteria. The performance ratings are based on criteria developed by a local committee. The agency is not permitted to determine the criteria that can be used for these evaluations.
For the 2014-15 school year, TEA will again collect the locally-determined ratings for the 2014-15 school year in the summer 2015 PEIMS Submission 3 for the district and each campus in the district. TEA will report these ratings publicly by October 1, 2015.
Summer 2015 PEIMS Submission 3 is
due to ESC-20 by June 18, 2015

The Impact of Critical Success FactorsMark Cantu
Educational Specialist
School Support

Texas Accountability Intervention System

IMPROVE ACADEMIC PERFORMANCE
Academic performance is the foundational Critical Success
Factor. By ensuring the Critical Success Factors of teacher
quality, effective leadership, data driven instructional
decisions, productive community and parent involvement,
efficient use of learning time, and maintaining a positive
school climate, campuses can increase performance for all
students.

INCREASE THE USE OF QUALITY DATA
The use of quality data to drive instructional decisions can lead to improved student performance (Wayman, 2005); (Wayman, Cho, & Johnston, 2007); (Wohlstetter, Datnow, & Park, 2008).
This CSF emphasizes effective uses of multiple sources of disaggregated data. However, it is not necessarily the amount of data utilized, but rather how the information is used (Hamilton, et al., 2009). For example, academic achievement can improve when teachers create regular opportunities to share data with individual students (Black & Williams, 2005).
Therefore, it is not only the use of data to drive instructional decision-making that is significant, but also the ongoing communication of data with others that provides the greatest opportunity for data to have a positive impact on student learning outcomes.
INCREASE LEADERSHIP EFFECTIVENESS
Leadership effectiveness targets the need for leadership on
campus to exhibit characteristics and skills known to
promote and implement positive educational change. Of the
elements proven to have the greatest degree of impact on
student achievement, school leadership is second only to
classroom instruction.
Examples of successful school turnaround efforts without
effective leadership are rare (Leithwood, Louis, Anderson, &
Wahlstrom, 2004).

INCREASE LEARNING TIME
Research promotes a three-pronged approached to Increased
Learning Time that includes the following elements: (a) increased
academic learning time; (b) increased enrichment activities; (c)
and increased teacher collaboration and professional
development. Increased learning time necessitates strategies that
maximize the number of sustained, engaging instructional
minutes, the result of which is “higher academic achievement,
especially for disadvantaged students” (Jez & Wassmer, 2011;
Gettinger & Seibert 2002).
To be utilized successfully, increased learning time must be
applied strategically. Effective strategies include providing a
rigorous, well-rounded education that prepares students for
college, improving teacher training, improving and aligning the
curriculum, reducing distractions, year-round schedules, block

INCREASE FAMILY AND COMMUNITY
ENGAGEMENT
Family and community engagement calls for increased opportunities for input from parents and the community, as well as the necessity for effective communication and access to community services. Parent, family and community involvement has a direct correlation with academic achievement and school improvement.
When school staff, parents, families, and surrounding communities work together to support academic achievement, students tend to earn higher grades, attend school longer and more regularly, and eventually enroll in programs of higher education (Barton, 2003).

IMPROVE SCHOOL CLIMATE
The connection between school climate and student achievement has been well established in research. Focusing on the development of a campus’ climate as a learning environment is fundamental to improved teacher morale and student achievement (Nomura, 1999). Formally assessing and addressing school climate is essential to any schools’ effort toward successful reform, achievement, and making a difference for underprivileged student groups (California P-16 Council, 2008).
Indicators of a positive school climate and welcoming learning environment are increased attendance and reduced discipline referrals. Increased attendance in extracurricular activities is another sign that students feel supported by an affirming school climate (Scales & Leffert, 1999).

INCREASE TEACHER QUALITY
Teacher quality focuses on the need to recruit and retain effective teachers while supporting and enhancing the knowledge and skills of current staff with job-embedded professional development. Over two decades of research has demonstrated a clear connection between teacher quality and increased student performance. The evidence shows that low-income students are more likely to benefit from instruction by a highly effective teacher than are their more advantaged peers (Nye, Konstantoupoulos, & Hedges, 2004).
Students enrolled in successive classes taught by effective teachers show greater gains in student performance than student groups taught by less effective teachers (Sanders & Rivers, 1996). LEAs and campuses can have a direct impact on student achievement.

Up Coming Session:
Critical Success Factors (CSFs) in Depth
May 5, 2015
8:30 A.M. – 11:30 A.M.
Workshop # CP150505-H01
Price: Free


What’s Wrong Here?
Let’s watch an interaction between Michelle, the
subject matter expert, and her manager, Bruce. They
are meeting to discuss a project plan. If you’re
Michelle, how are you feeling and what different
issues are you facing in this conversation?


What Makes a Conversation Crucial? Three elements.

The Silence to Violence Continuum
We Make a Fool’s Choice. When facing a crucial conversation, we often feel we have to choose between responding with silence or with violence.
We assume we can either share our honest opinion OR be respectful.
We are blind to the dialogue option.

Common Examples
So, we know “why” we toggle between silence and violence. But, “when” do we go to
silence and violence?
• What are the common crucial conversations we experience where we see people going
to silence or violence?
• What are the consequences?

Crucial Conversations
Let’s listen as Joseph Grenny, one of the authors of
Crucial Conversations, introduces the research behind it.


When we start having these
conversations effectively, we will see our
issues get solved and our bottom line
improve.


Thank You For Joining Us!