welcome to the webinar! we will start within a few · worldwide • network of 50.000+ solar pv ......
TRANSCRIPT

Welcome to the webinar!
We will start within a few minutes
Agenda• Introduction
Shushan Khachatryan (Solarplaza)
• Dive into the dynamic and evolving Solar PV market in Asia; Which markets are the most promising for the year ahead
Benjamin Attia– GTM Research
• Tracking country investment attractiveness for solar energy; Strategies to create bankable PV projects in Asia
Rohan Singh
• Q&A
• End of the webinar

Unlocking Solar Capital Asia
28-29 September 2017 /// Singapore
200+ executives connect and engage in in-depth discussions to solve LATAM's solar energy funding gap - and get projects realized
• 200+ international finance and project development executives
• Regional focused approach: Covering all countries from Southeast Asia to Central Asia
• 50+ leading experts on stage sharing their vision, expertise and experience
• Guaranteed match-making through our customized software, interactive breaks and a matchmaking session

• Established in 2004
• 80 events organized
• In 25+ countries worldwide
• Network of 50.000+ solar PV professionals
About Solarplaza
"Empowering professionals in solar business development by building the most valuable solar PV network"

Practical notes
• Technical issues? Use chatbox
• The presentation slides will be available afterwards

Benjamin Attia
• ANALYST- GTM RESEARCH

Rohan Singh
• MANAGING PARTNER ASIA - FINERGREEN

Q&A time
Website: asia.unlockingsolarcapital.com
Shushan Khachatryan
• Email: [email protected]
• Skype: shushan.solarplaza
• Phone: +31 10 302 7909

The Solar Future NL18 May 2017Baarn, The Netherlandswww.thesolarfuture.nl
Upcoming Events
Unlocking Solar Capital Asia28-29 September 2017
Singapore
asia.unlockingsolarcapital.com
Renewable Energy Trade Mission Iran17-21 September 2017Tehran, Iranwww.retrademissioniran.com
Solar Asset Management Asia8-9 June 2017
Tokyo, Japan
www.solarassetmanagement.asia
Unlocking Solar Capital LATAM15-16 June 2017
Miami, USA
latam.unlockingsolarcapital.com

Overview of Asian Solar PV Market and Financing Opportunities
SolarPlaza Webinar: Unlocking Solar Capital Asia
Benjamin Attia
Analyst, Global Solar Demand
12 May 2017

1
GTM Research is the premier market intelligence provider on the
decarbonization and decentralization of energy
CleanGeneration
GridModernization
CustomerEvolution
We guide companies leading
the electricity transformation
GTM RESEARCH

2
GTM RESEARCH
UpstreamFrom production to shipments of modules
Solar Research End-to-end coverage of the global solar market
Ingot
Wafer Cells
Polysilicon
Solar Systems & TechnologiesTo the components and costs of solar systems
DownstreamTo installations, and what’s driving them
• Inverters
• Racking
• Soft costs
• Emerging technologies
• Demand
• Competitive Landscape
• Policy & Regulatory
• System Economics

3
Q2 2017 Regional Demand Outlook: Asian Markets Comprise 65% of Global Demand
Global PV Demand by Region, 2007-2022E
6.8 7.7 8.8 10.0 12.1 13.9 15.3
44.3 41.3 37.9 35.3 30.8 28.7 28.3
5.3 10.2 10.0 11.3 13.2 15.1 15.72.0
2.0 2.6 3.2 4.2 5.3 6.51.8
2.8 5.1 7.0 9.09.6
11.21.6
2.4 5.87.1
7.89.7
11.5
15.513.1
12.014.2
16.418.0
19.4
0.60.9
1.31.7
1.9
2.4
3.0
0.6 0.9
1.21.4
1.7
2.0
77.8 80.984.5
91.196.8
104.4112.8
0
20
40
60
80
100
120
140
2016 2017E 2018E 2019E 2020E 2021E 2022E
An
nu
al In
stal
led
PV
(G
Wd
c)
Europe East Asia South Asia Southeast Asia MENAT Latin America North America Sub-Saharan Africa West Africa
Cumulative Forecast 2017-2022 = 572.9 GW
2017-2022E CAGR = 6.9%

4
Poll: Nearly all Asian solar markets are FIT-driven. Can FITs in emerging economies support long-term sustainable market growth?
Yes, FITs provide a predictable and stable incentive.
Yes, but only with long-term political commitment to renewables.
No, the FIT era is being replaced by competitive procurement and
represents necessary but burdensome policy.
No, policy uncertainty around Asian FITs introduces too much risk.
–A
–B
–C
–D

5
FITs in Southeast Asia Vary in Differential Relative to Power Prices
$0.078 $0.075
$0.217
$0.080 $0.091
$0.079
$0.194
$0.097
$0.077 $0.081
$0.172
$0.069
$0.152
$0.175
$0.153
$0.090
$0.00
$0.05
$0.10
$0.15
$0.20
$0.25
Malaysia Indonesia Philippines Vietnam
USD
/kW
h
Residential Commercial Industrial Average FIT
Residential, Commercial, and Industrial Retail Power Prices and Average Solar FIT, USD/kWh

6
29 Reverse Auction or Tender Procurement Programs Launched or Planned in 2017 so far
*Some markets not pictured due to scale: Bermuda, Cape Verde, CaymanIslands, El Salvador, French West Indies, Martinique, Palestine, Singapore, Qatar
Global: Markets With Tendering or Auction Schemes in Place, Under Discussion, or in Planning Stages, Q2 2017*
Tendering or Auction Scheme in Place
Tendering or Auction Scheme Discussed or Planned
By the numbers:
48 national markets where
tendering or auction scheme is in place, up from 32 in H2 2016
25 national markets where
tendering or auction scheme has been discussed or planned, up from 14 in H2 2016
Source: GTM Research Global Solar Demand Monitor Q2 2017

7
• East Asia: Demand peaked in
2016 at 44.3 GW
• China: Record-breaking 2016
with 34.23 GW installed
• Japan: Policy shift in Japan
restrains future growth, peaked
in 2015
• Australia: Utility-scale boom
through 2019 driven by Large-
Scale RET
• Taiwan: Aggressive targets and
local manufacturing contribute to
robust market
East Asia: China Far Exceeded Expectations in 2016, but Regional Growth Outlook Is Weak
East Asia PV Demand, 2016-2022E
15.1
34.231.5
28.726.6
24.1 22.1 21.4
10.9
7.8
7.1
5.6
4.2
3.32.8 2.5
27.7
44.3
41.3
37.935.3
30.828.7 28.3
25%
60%
-7% -8%-7%
-13%
-7%-1%
-20%
-10%
0%
10%
20%
30%
40%
50%
60%
70%
0
5
10
15
20
25
30
35
40
45
50
2015 2016 2017E 2018E 2019E 2020E 2021E 2022E
GW
dc
China Japan Australia Taiwan Rest of East Asia Annual Growth
Cumulative Forecast 2017-2022 = 202.4 GW
2017-2022E CAGR = -7.3%
Source: GTM Research Global Solar Demand Monitor Q2 2017
8
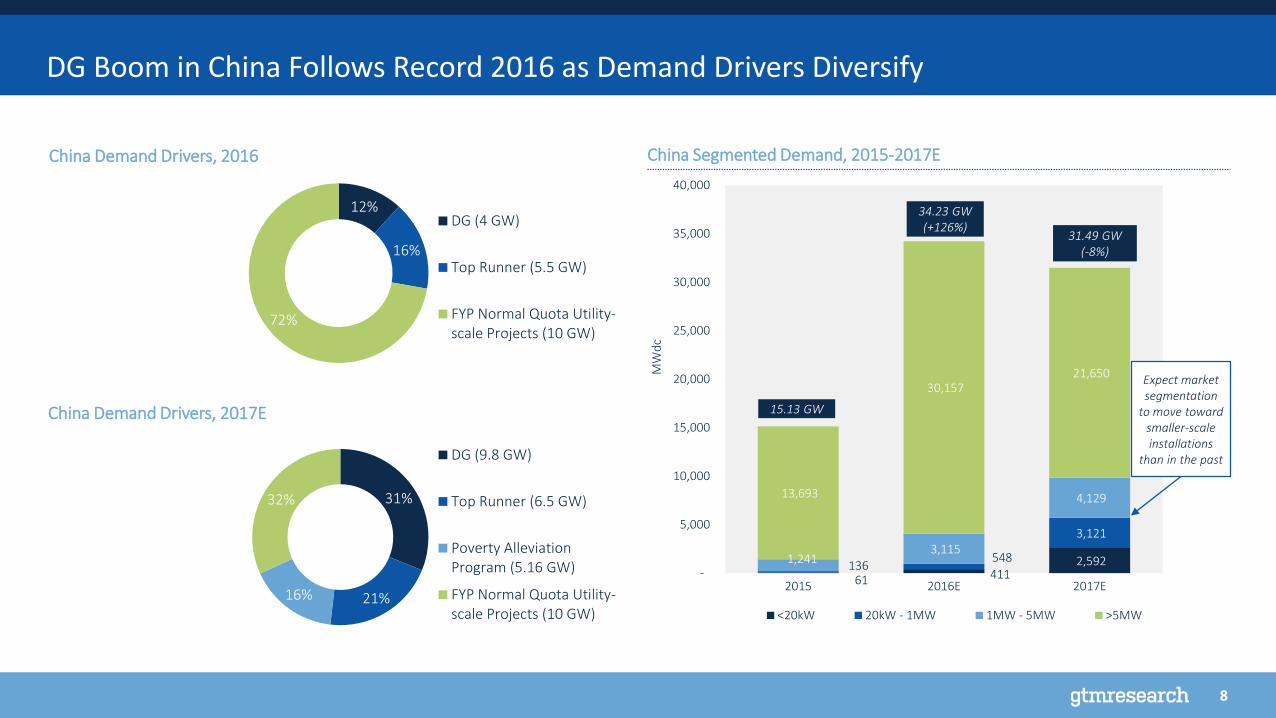
DG Boom in China Follows Record 2016 as Demand Drivers Diversify
61 411 2,592 136
548
3,121
1,241 3,115
4,129 13,693
30,157 21,650
-
5,000
10,000
15,000
20,000
25,000
30,000
35,000
40,000
2015 2016E 2017E
MW
dc
<20kW 20kW - 1MW 1MW - 5MW >5MW
15.13 GW
34.23 GW(+126%)
31.49 GW(-8%)
Expect market segmentation
to move toward smaller-scale installations
than in the past
China Segmented Demand, 2015-2017E
12%
16%
72%
DG (4 GW)
Top Runner (5.5 GW)
FYP Normal Quota Utility-scale Projects (10 GW)
China Demand Drivers, 2017E
China Demand Drivers, 2016
31%
21%16%
32%
DG (9.8 GW)
Top Runner (6.5 GW)
Poverty AlleviationProgram (5.16 GW)
FYP Normal Quota Utility-scale Projects (10 GW)

9
Scenario 1: FITs remain and step
down gradually, slowly replaced with
competitive procurement to stem
curtailment and combat
backpayment issues. Behind-the-
Meter DG boom.
Scenario 2: Instead of next FIT cut
cycle on June 30, 2018, FIT is
scrapped entirely and NEA shifts
entirely to centrally managed
competitive reverse auction
program. Could lead to massive
installation rush in Q4.
NEA’s Opaque Policy Environment Leaves Two Likely Scenarios for Chinese Demand
34230 33,413
30,221
27,980
25,450
23,439 23,013
31,492
28,673
26,572
24,100
22,112 21,387
24,563
19,784
17,538 15,665 15,036 14,330
50
5,050
10,050
15,050
20,050
25,050
30,050
35,050
40,050
2016 2017E 2018E 2019E 2020E 2021E 2022E
MW
dc
Inst
alle
d
Upside Scenario Base Scenario Downside Scenario
2017-2022 Potential Upside = 9.1GW2017-2022 Potential Downside = 47.5 GW
CAGR = -7.2%
CAGR = -10.2%
CAGR = -7.4%
China PV Demand Scenarios, 2017-2022

10
2077 1927 20611539 1427 1129 1270 1144 1028 925
2764
4389 4298
2942 27122144 1693
1340 1166 1050
1467
24993497
27982498
1975
1058
653500 450
158
501
1050
486500
395
212
13183
75
6,467
9,316
10,905
7,765 7,136
5,643
4,232
3,267 2,777 2,499
-
2,000
4,000
6,000
8,000
10,000
12,000
2013 2014 2015E 2016E 2017E 2018E 2019E 2020E 2021E 2022E
MW
dc
Inst
alle
d
<20kW 20kW - 1MW 1MW - 5MW >5MW
Japan PV Demand, 2013-2022E
Source: GTM Research Global Solar Demand Monitor Q1 2017
Challenge of land access and labor costs will limit potential
for development of >5 MW projects
Tendering + FIT regime begins on April 1, 2017
Japan: Uncertainty Surrounding Policy Shift Likely to Spawn a Healthy Secondary Market
• METI’s Competitive Reverse
Auction Program is capping new
demand
• Over half of the massive >50 GW
FIT-approved pipeline cancelled
• First auction expected next
quarter, 500 MW, ceiling price 21
¥/kWh
• 2017-2022E: -19% CAGR
11
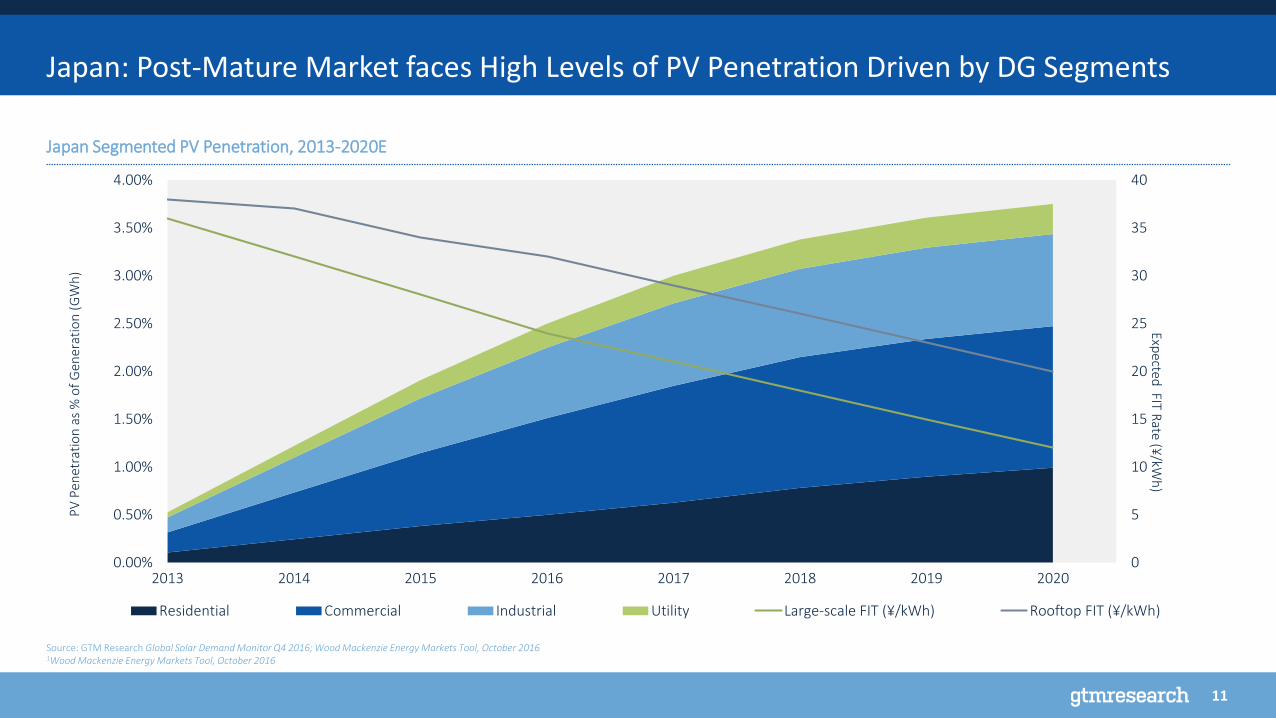
Japan: Post-Mature Market faces High Levels of PV Penetration Driven by DG Segments
Source: GTM Research Global Solar Demand Monitor Q4 2016; Wood Mackenzie Energy Markets Tool, October 20161Wood Mackenzie Energy Markets Tool, October 2016
Japan Segmented PV Penetration, 2013-2020E
0
5
10
15
20
25
30
35
40
0.00%
0.50%
1.00%
1.50%
2.00%
2.50%
3.00%
3.50%
4.00%
2013 2014 2015 2016 2017 2018 2019 2020
Expected
FIT Rate (¥
/kWh
)
PV
Pen
etra
tio
n a
s %
of
Gen
erat
ion
(G
Wh
)
Residential Commercial Industrial Utility Large-scale FIT (¥/kWh) Rooftop FIT (¥/kWh)

12
2.1
4.9
9.4 8.910.0
11.613.0 13.2
0.2
0.2
0.50.6
0.8
0.9
1.1 1.3
2.2
5.3
10.2 10.0
11.3
13.2
15.115.7138%
136%
92%
-1%
13%17% 14%
4%
-20%
0%
20%
40%
60%
80%
100%
120%
140%
160%
0
2
4
6
8
10
12
14
16
18
2015 2016 2017E 2018E 2019E 2020E 2021E 2022E
GW
dc
India Pakistan Bangladesh Rest of South Asia Annual Growth
South Asia: 92% Growth in India Drives the Region, Reaching 15 GW Annually by 2021
Source: GTM Research Global Solar Demand Monitor Q1 2017
South Asia PV Demand, 2016-2022E
Cumulative Forecast 2017-2022 = 75.5 GW
2017-2022E CAGR = 9.1%
• India is set to become the third
largest global market in 2017
• Aggressive tender bid
competition at Rewa and Bhadla
(Rs. 2.62/kWh), lowest global
module prices leading to margin
squeeze
• Pakistan has over 2.4 GW utility-
scale pipeline, NEPRA tenders
coming later this year
• Financing risks surrounding lack
of local debt and tight margins
for EPCs

13
India Doubled Its Solar Parks Target to 40 GW Amid Infrastructure Delays
Source: SECI, GTM Research Global Solar Demand Monitor Q1 2017
India’s Solar Parks Approved Capacity by State, Q1 2017
4000
3351
2750
2000
1500
1000 1000
700600
500 500 500 500 500 499
200
0
500
1000
1500
2000
2500
3000
3500
4000
4500
Capacity (MW)
MW
Ap
pro
ved
Andhra Pradesh Rajasthan Madhya Pradesh Karnataka Maharastra Himachal Pradesh Odisha Gujarat
Uttar Pradesh Chhattisgarh Haryana Tamil Nadu Telangana West Bengal Other States Kerala

14
• Southeast Asia: Policy uncertainty in
Thailand, the Philippines, Malaysia,
Indonesia, and Vietnam limits
region’s growth potential
• Vietnam: Local cell manufacturing
capacity and ripe market conditions
have materialized into a 5 GW
pipeline, but Decision 11 introduces
major project risks.
• Thailand: Despite only 40%
subscription to the self- consumption
program, Thailand will install 4.6 GW
by 2022. Agriculture Co-op program
tender could see over 500 MW.
• Malaysia: NEM Policy and utility-
scale tenders feed expectation that
national target will be well exceeded.
Southeast Asia: Foreign Investment in Thailand, Malaysia Is Driving 6.5 GW Market by 2022
Source: GTM Research Global Solar Demand Monitor Q2 2017
Southeast Asia PV Demand, 2016-2022E
Cumulative Forecast 2017-2022 = 25.73 GW
2017-2022E CAGR = 21.9%
0.7 0.8 0.9 1.0 1.1 1.2 1.40.7
1.00.4
0.6 0.70.8
0.91.1
0.30.4
0.40.5
0.7
0.8
0.2
0.30.5
0.7
0.9
1.2
0.3
0.4
0.7
1.1
1.5
2.1
1.1
2.0 2.0
2.6
3.2
4.2
5.3
6.5
59%
82%
2%
32%
22%
30%
27% 23%
0%
10%
20%
30%
40%
50%
60%
70%
80%
90%
0
1
2
3
4
5
6
7
2015 2016 2017E 2018E 2019E 2020E 2021E 2022E
GW
dc
Philippines Thailand Malaysia Indonesia Rest of Southeast Asia Annual Growth

15
Philippine Approved Solar Projects Pipeline is over 4 GW
Source: SECI, GTM Research Global Solar Demand Monitor Q2 2017, Department of Energy
Philippines Department of Energy Approved Project Pipeline, 2017
0
65.7
28.515
338
465
1179
0 200 400 600 800 1000 1200 1400
Mindanao
Visayas
Luzon
MWdcApproved COD H1 2017
The Department of Energy also has over 2.13 GW of
pending project applications

16
Over Two-Thirds of Vietnam’s >5 GW Announced Pipeline is from Local Developers
Source: SECI, GTM Research Global Solar Demand Monitor Q1 2017
Investment Origin for Vietnam’s 5,064 MW Pipeline, Q2 2017
68%
16%
10%
3% 2%
1%
Vietnam
South Korea
United States
Canada
India
China
AES Corporation (United States) has been granteda license to develop 300-500 MW in the Dak Lak region
Led by EVN and Xuan ThienDaklak for over 3.1 GW of Vietnam’s announced pipeline
South Korean investment announcements total 844 MW, from the likes of Hanwa Qcells, ShinsungSolar, and Solkiss.

17
Key Takeaways and Stats:
• Asian Markets will comprise 65% of Global PV Demand in 2017.
• China’s NEA holds significantly concentrated power over the global supply-demand balance, but
demand drivers are diversifying, reducing risk and increasing allocation transparency.
• India is set to be the third largest global market in 2017 with 9.4 GW of demand.
• Most Asian demand is still FIT-driven, though the transition to competitive procurement is being led
by Malaysia, Japan, and Thailand.
• Policy uncertainty around Decision 11 in Vietnam and Minister Decree No. 12/2017 in Indonesia, as
well as the non-renewal of Round 3 FITs in the Philippines are introducing risk to large multi-GW
pipelines.
Wrap Up: Enormous Opportunity in Asian Markets, but Limited by Policy Uncertainty
5
3
2
1
4

Prepared For:
12 May 2017
Analyst, Global Solar Markets
Benjamin Attia
Thank you!
@solarbenattia

Strategic Advisory
Debt Advisory
Equity Advisory
Str
ictly c
on
fidential
SOLARPLAZA WEBINAR
Overview of Asian Solar PV market and Financing opportunities
12/05/17

FINERGREEN| NEW ENERGY FINANCIAL ADVISORS
FINERGREEN
ACTIVITIES
Debt advisory Debt structuring
Support in negotiation
Due Diligences & legal documentation monitoring
Equity advisory Buy-side / Sell-side equity advisory on
greenfield and brownfield projects
Sourcing of investors in the Renewable Energy sector
Strategic advisory
Enterprise valuation
Market screening & target selection
Support in negotiation & advisors coordination
FINERGREEN is a French financial advisor, founded in 2013 and dedicated to renewable energies and energy efficiency projects (solar, wind, biogas, hydroelectricity).
GEOGRAPHICAL COVERAGE
459 M €
CLOSED TRANSACTIONS
706 PLANTS
FINANCED PROJECTS
215 MWp
DELIVERED POWER
2

FINERGREEN| NEW ENERGY FINANCIAL ADVISORS
ASIA – CONTEXT
900 500
STRONG AMBITIONS except… ▶ Access to financing solutions remains difficult to small
or mid-size projects.
▶ Local developers used to have a strong footprint but face a lack of experience in renewables deals structuring.
▶ New additional sources of financing should inflow the
Asian continent and respond therefore to this growing demand
▶ Provide guidance to project developers to structure their projects so as to be in line with international standards will be a key component to the bankability of the project
GW to be installed by 2030
million people to give electricity access to
147 bn USD/year required to invest
in renewables
3

FINERGREEN| NEW ENERGY FINANCIAL ADVISORS
ASIAN SOLAR INVESTMENT ATTRACTIVENESS
4
MONGOLIA
CHINA
VIETNAM
INDIA
SRI LANKA
MYANMAR
INDONESIA
PHILIPPINES
THAILAND
LAOS CAMBODIA
MALAYSIA
20-25% electricity generation by 2020
Feed-in-tariff
9% capacity from RE by 2018
Auctions, tax benefit
100% target by 2030 FiT enacted in 1997 Capital subsidies
15-18% target by 2020 Tax benefits
2 GW PV by 2020 Feed-in-tariff
800 MW PV by 2020 Feed-in-tariff 100% RE target
110 GW capacity by 2020
Feed-in-tariff
700MW PV by 2025 <1% RE share in 2017
1.35 GW PV by 2020 Feed-in-tariff
500 MW PV by 2020 Feed-in-tariff
5 GW PV by 2025 Feed-in-tariff
30% target by 2025

FINERGREEN| NEW ENERGY FINANCIAL ADVISORS
ASIAN SOLAR CAPITAL ATTRACTIVENESS
5
A broad range of diverse sources of funding can help bridging the gap with the capital requirements
FEW EXAMPLES
Pakistan’s hydropower plant USD 955m.Sukuk issue marked one of the largest infrastructure deals in the country to use Islamic financing
Meezan Bank Pakistan finances energy projects Alternative financing solutions available with Multilateral institutions State Bank of Pakistan SBP Financing Scheme for Renewable Energy
Malaysian government encourages Sharia’-compliant financing Energy related financing:
Green Technology Financing Scheme: The scheme could benefit companies who are producers and users of green technology.
New institutions Asian Infrastructure Investment Bank (AIIB), New Development Bank Green Sukuk scheme which promotes and develop Shari'ah-compliant financial products to
invest in climate change solutions National Rural and Renewable Energy Programme (NRREP), Scaling Up Renewable Energy
Programme in Low Income Countries (SREP), ElectriFI encouraged by the European Union… Development of additional commercial banks locally that could provide project financing
solutions
Pakistan
Malaysia

FINERGREEN| NEW ENERGY FINANCIAL ADVISORS
WHAT BANKABILITY REFERS TO? (1/2)
6
Financial parameters
Regional specificities
Technology & Strong
know-how
Makes the project financially viable until completion
Careful selection of clients / project developers based on their past experience
Give attention to all the assumptions including potential change in regulation (i.e. introduction of GST in India….)
Financing mechanism
Explore all sources of capital available for the project
Enables to adapt the technology at the local/regional level
How the product/plant will operate over its lifespan
Are there any guarantees or certification standards that verify the product/plant will work
Combines centralized processes and locally delegated tasks supported both by
local & international entities
How the non-recourse financing solutions is adaptable in Asian landscape?
What are the regional components differences from matured markets or other emerging countries?

FINERGREEN| NEW ENERGY FINANCIAL ADVISORS
WHAT BANKABILITY REFERS TO ? (2/2)
7
A solar PV project is considered bankable if lenders are willing to finance it taking into account:
SERVICE PROVIDERS
•Certified technology •Secured energy yields &
economic returns
INVESTORS
•Tax incentives •Project stability •Risks & Mitigants •Legal, technical & economic securities
PROJECT DEVELOPERS
•Track record •Attractiveness for investors / banks •Project stability
MODULE PRODUCERS
•Track record •Tier-1, 2…
•Certified quality
LENDERS
KEY CRITERIAS
Stable & predictable cash-flows
Coverage ratios satisfied (DSCR, DSRA…)
Non or limited-recourse finance
Leverage ratio taking into account the exposure reached by the lender in terms of country exposure, sub-sector exposure, credit rating exposure…
Risks & mitigations
Guarantees
FINERGREEN| NEW ENERGY FINANCIAL ADVISORS
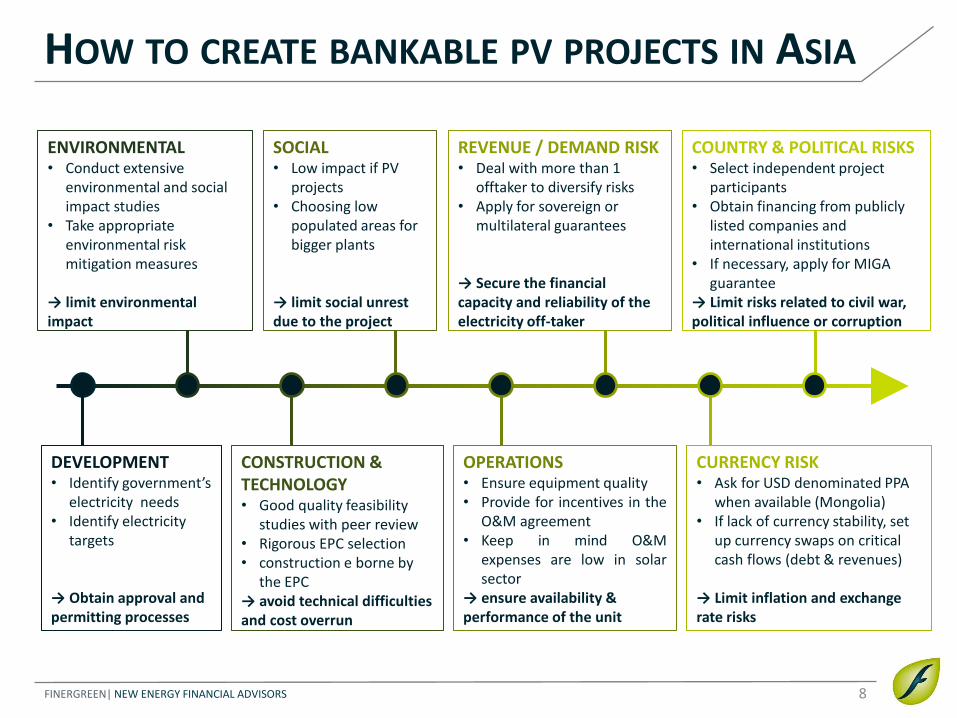
HOW TO CREATE BANKABLE PV PROJECTS IN ASIA
8
DEVELOPMENT • Identify government’s
electricity needs • Identify electricity
targets
→ Obtain approval and permitting processes
CONSTRUCTION & TECHNOLOGY • Good quality feasibility
studies with peer review • Rigorous EPC selection • construction e borne by
the EPC → avoid technical difficulties and cost overrun
OPERATIONS • Ensure equipment quality • Provide for incentives in the
O&M agreement • Keep in mind O&M
expenses are low in solar sector
→ ensure availability & performance of the unit
ENVIRONMENTAL • Conduct extensive
environmental and social impact studies
• Take appropriate environmental risk mitigation measures
→ limit environmental impact
SOCIAL • Low impact if PV
projects • Choosing low
populated areas for bigger plants
→ limit social unrest due to the project
REVENUE / DEMAND RISK • Deal with more than 1
offtaker to diversify risks • Apply for sovereign or
multilateral guarantees
→ Secure the financial capacity and reliability of the electricity off-taker
CURRENCY RISK • Ask for USD denominated PPA
when available (Mongolia) • If lack of currency stability, set
up currency swaps on critical cash flows (debt & revenues)
→ Limit inflation and exchange rate risks
COUNTRY & POLITICAL RISKS • Select independent project
participants • Obtain financing from publicly
listed companies and international institutions
• If necessary, apply for MIGA guarantee
→ Limit risks related to civil war, political influence or corruption

FINERGREEN| NEW ENERGY FINANCIAL ADVISORS
OUR RETURN ON EXPERIENCE IN ASIA
9
₹ CURRENCY RISK YIELD FACTOR DEBT (RE) FINANCING
We refinanced a USD denominated loan into a rupee denominated financing to suit the project’s revenue scheme.
▶ Mitigate therefore the
currency risk ▶ Economy of cash that
has been re-invested
After careful due-diligences, we convinced our client (IPP) to change panels from tier-2 quality up to tier-1 for part of the plant
▶ Give comfort to potential investors on the quality of the plant and its productivity
Once a project has been in operation for a couple of years, operational risks are perceived as lower which gives room for refinancing at better conditions
▶ Optimized debt structure allowed our client to refine its strategy in terms of investment / OPEX

FINERGREEN| NEW ENERGY FINANCIAL ADVISORS
TWO RECENT BUSINESS CASES
10
Decision No. 11 dated of April 2017 on the mechanism for encouragement of the development of solar power projects in Vietnam
Decision No.12/2017 dated of early 2017 from Regulation of Minister of Energy and Mineral Resources on the Utilization of Renewable Energy Resources for Electricity Supply
The regulation is a very good starting point of course. However, Decision No. 11 leaves a number of issues unresolved, which may have an impact on the bankability of solar projects:
• No mechanism for direct corporate PPAs
• Uncertainty after 30 June 2019
• Model PPA for solar power projects
This decision aimed at lowering the FiT at 85 - 100% of the National Utility’s regional generation cost, which causes bankability issues for a number of RE projects already developed
On specific sectors like hydro, direct selection is authorized which leaves room to some uncertainty
Conflicts with other regulations
Decision 12 is silent as to escalation…
Vietnam Indonesia

FINERGREEN| NEW ENERGY FINANCIAL ADVISORS
ASIA: A POTENTIAL NEEDS TO BE CAPTURED…
11
SOME LEADS Foster regional coordination and measures likewise in other regions (Western Africa for instance)
Leverage on international standardized organizations such as Terrawatt initiative, International Solar Alliance, etc.
Increase the coordination between public entities, local communities, and private institutions
Give additional guidelines to public entity to support them in drafting key documents like PPA, FiT…
Give additional guidelines to private companies like commercial banks who initiate the creation of a project financing department and need assistance to assess their 1st projects
Develop off-grid solutions and related financing solutions
CHALLENGES Increase the promotion of solar power and Renewable Energy in Asia
Make Renewables more affordable & viable in terms of implementation, risk mitigations, financing costs, …
Keep the growth pace in Renewables for some leading countries such as China, India, Thailand,…
Help Governments reaching their respective targets in Renewable Energy
Should new entrants countries at the end follow the model of advanced countries like India? Is it really doable in Myanmar?
Bring 24/7 power to local communities in remote areas

FINERGREEN| NEW ENERGY FINANCIAL ADVISORS
CONTACTS
Rohan SINGH Managing Partner - Asia
Mobile : +33 (0)7 87 77 76 22
12

www.finergreen.fr