welspun india 52w high/low (inr) retailers 80 84/21 180
TRANSCRIPT
C
onsu
mer
Dis
cre
tionary
In
dia
84
March 30, 2021
THIS REPORT HAS BEEN PREPARED BY KIM ENG SECURITIES INDIA PVT LTD
SEE PAGE 11 FOR IMPORTANT DISCLOSURES AND ANALYST CERTIFICATIONS
Jigar Shah [email protected] (91) 22 4223 2632
Neerav Dalal [email protected] (91) 22 4223 2606
Welspun India (WLSI IN)
Clear ESG targets for 2025-2030
Home textile major has strong ESG ambition We recently hosted WLSI’s management to discuss its ESG practices and
ambitions. It is one of the largest home textile companies globally and the
No.1 in India. Exports make up 88% of revenue. Despite key ESG issues in
the textile sector (such as alleged human rights violation and
environmental pollution), WLSI has a good track record and practices to
address these. Its ambition to become ‘carbon neutral’ and ‘freshwater
positive’ by 2030 is quite bold within and outside the textile sector.
Clear plan and strategy for 2030 ESG roadmap WLSI has direct emissions amounting to c. 900kt CO2e pa. It aims to shift
to 100% renewable energy by 2030 by replacing 40-45MW captive thermal
power plant. This would be done by investing in roof-top and large- scale
solar capacity and grid power purchase through third party. The company
generates a cash profit of INR9b pa, which would enable it to finance this
transition. The bulk of its solar capacity would come in the state of Gujarat
where it has surplus land. The shift in its energy mix and cut in emissions
may not be linear but would be largely through reductions.
Initiatives on waste, supply chain, gender diversity WLSI is recycling 81% of its hazardous and 13% of non-hazardous waste. It
aims to achieve 100% recycling of waste by 2025. It sources 31% of total as
sustainable cotton by supporting 13,000 farmers. By 2030 it aims to
support 500,000 farmers and source 100% sustainable cotton. Women form
25% of its workforce of 20,000 and a large number of them are engaged in
making hand-crafted textile. The company is certified SA-8000 for human
rights and has to undergo frequent client audits by retailers such as
Walmart, Amazon, Costco, Tesco, Ikea and Sainsbury’s.
WLSI’s ESG targets are clearer than peers In our comparison of ESG practices by textile and apparel companies in
India we noticed WLSI has the clearest path and strategy regarding ESG
targets in the medium to long term. The textile sector is the 2nd most
polluting globally and it’s responsible for 2% of global GHG emissions,
which warrants urgency in sustainable practices. WLSI’s efforts to
decarbonize with proactive ESG practices are in line with the global trend
of decline in ‘fast fashion’ and clear preference for sustainable textile
products by millennials/Gen Z.
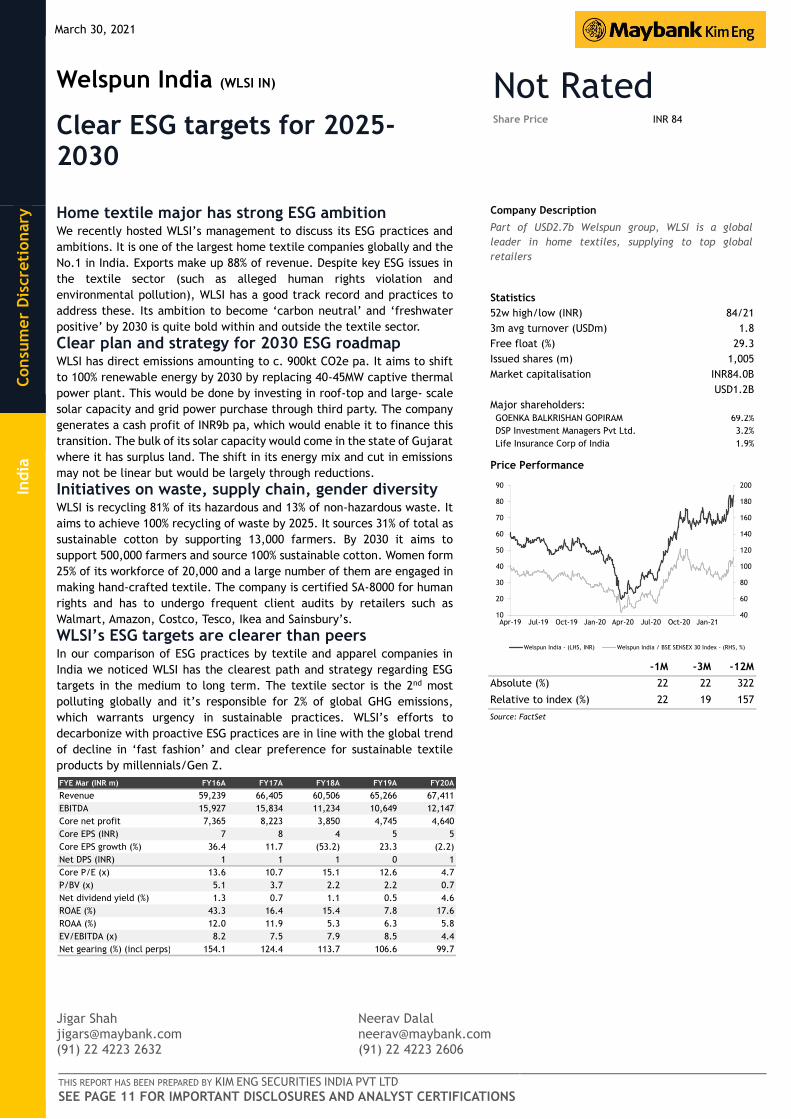
Share Price INR 84
Not Rated
Company Description
Statistics
52w high/low (INR)
3m avg turnover (USDm)
Free float (%)
Issued shares (m)
Market capitalisation
Major shareholders:
69.2%
3.2%
1.9%
1,005
1.8
Part of USD2.7b Welspun group, WLSI is a global
leader in home textiles, supplying to top global
retailers
GOENKA BALKRISHAN GOPIRAM
DSP Investment Managers Pvt Ltd.
Life Insurance Corp of India
84/21
29.3
INR84.0B
USD1.2B
Price Performance
40
60
80
100
120
140
160
180
200
10
20
30
40
50
60
70
80
90
Apr-19 Jul-19 Oct-19 Jan-20 Apr-20 Jul-20 Oct-20 Jan-21
Welspun India - (LHS, INR) Welspun India / BSE SENSEX 30 Index - (RHS, %)
-1M -3M -12M
Absolute (%) 22 22 322
Relative to index (%) 22 19 157
Source: FactSet
FYE Mar (INR m) FY16A FY17A FY18A FY19A FY20A
Revenue 59,239 66,405 60,506 65,266 67,411
EBITDA 15,927 15,834 11,234 10,649 12,147
Core net profit 7,365 8,223 3,850 4,745 4,640
Core EPS (INR) 7 8 4 5 5
Core EPS growth (%) 36.4 11.7 (53.2) 23.3 (2.2)
Net DPS (INR) 1 1 1 0 1
Core P/E (x) 13.6 10.7 15.1 12.6 4.7
P/BV (x) 5.1 3.7 2.2 2.2 0.7
Net dividend yield (%) 1.3 0.7 1.1 0.5 4.6
ROAE (%) 43.3 16.4 15.4 7.8 17.6
ROAA (%) 12.0 11.9 5.3 6.3 5.8
EV/EBITDA (x) 8.2 7.5 7.9 8.5 4.4
Net gearing (%) (incl perps) 154.1 124.4 113.7 106.6 99.7
March 30, 2021 2
Welspun India
Company Profile Fig 1: Welspun India Snapshot
Business Company milestones WLSI is part of the USD2.7b Welspun Group. It is a global
leader in the home textile sector catering to top global
retailers in Europe and the US.
WLSI is consistently ranked No.1 as a home textile supplier
to the US from India. 1 in every 5 towels and 1 in 9 Bed
sheets sold in the US is made by WLSI.
Revenue break-up into segments: ie
Home textile - 91%
Advanced textile - 4%
Flooring - 5%
1994:2010: Transforming from being a textile manufacturer
to world’s No.1 integrated home textile manufacturer.
2010:2020: Transforming from a manufacturing company to
brand-oriented, direct-to-consumer company.
2020 onwards: Evolving into Welspun 2.0 with focus on
brands, e-commerce, ESG, innovation, and digitalization.
Board and senior management Quarterly results summary WLSI’s board of directors consists of 7 members. Of these,
3 are promoter/family members. Independent directors are
57% of total board and women form 29% of the board. The
audit committee is chaired by an independent director,
although the remuneration committee is chaired by the
non-independent chairman.
Average tenure of independent and non-independent
directors is 6.9 and 25.2 years as at March’21.
Rajesh Mandawewala (Managing Director) – Promoter of
Welspun Group, he is a Chartered Accountant by profession and
has over 35 years of experience in industries varying from
textiles to SAW pipes.
Dipali Goenka (CEO & Jt. MD) – She has been spearheading the
company since 2002. She completed management course at
Harvard Business School in 2005.
Sanjeev Sancheti (President) - joined the company in July
2020. He has 29 years of experience in finance, accounts and
corporate strategy, which includes experience in mergers &
acquisitions, alliances, divestment and alternative strategies.
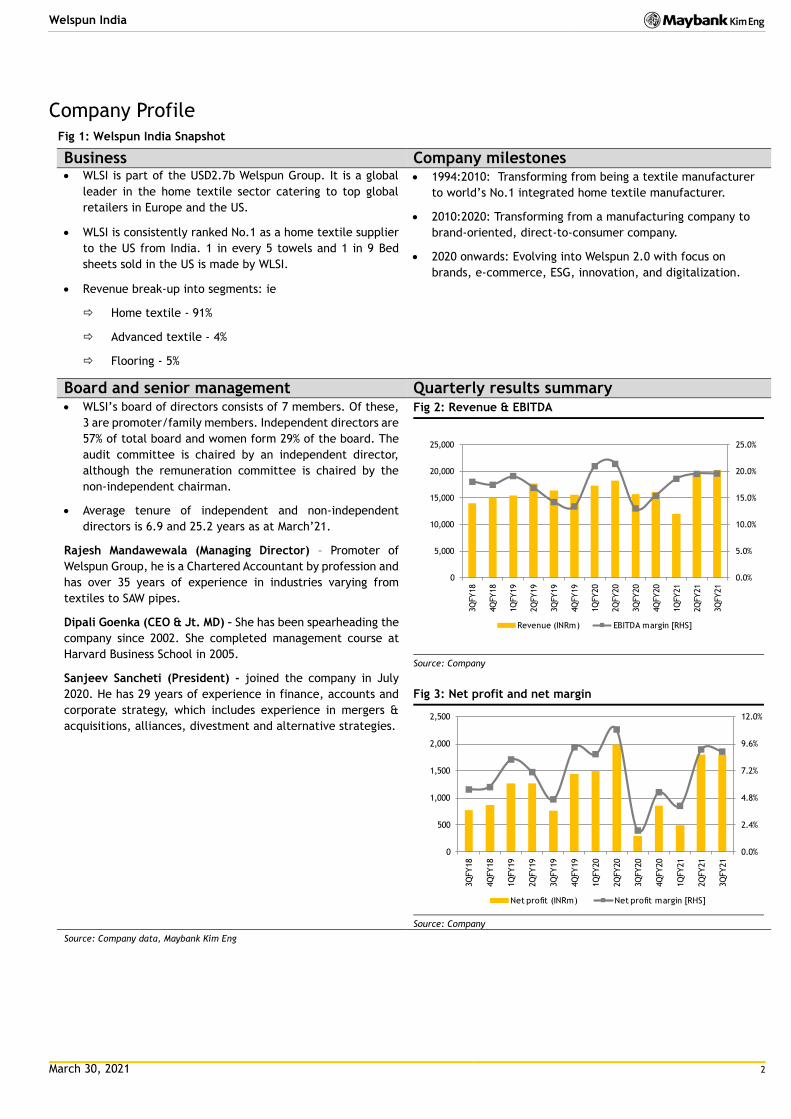
Fig 2: Revenue & EBITDA
Source: Company
Fig 3: Net profit and net margin
Source: Company
Source: Company data, Maybank Kim Eng
0.0%
5.0%
10.0%
15.0%
20.0%
25.0%
0
5,000
10,000
15,000
20,000
25,000
3Q
FY18
4Q
FY18
1Q
FY19
2Q
FY19
3Q
FY19
4Q
FY19
1Q
FY20
2Q
FY20
3Q
FY20
4Q
FY20
1Q
FY21
2Q
FY21
3Q
FY21
Revenue (INRm) EBITDA margin [RHS]
0.0%
2.4%
4.8%
7.2%
9.6%
12.0%
0
500
1,000
1,500
2,000
2,500
3Q
FY18
4Q
FY18
1Q
FY19
2Q
FY19
3Q
FY19
4Q
FY19
1Q
FY20
2Q
FY20
3Q
FY20
4Q
FY20
1Q
FY21
2Q
FY21
3Q
FY21
Net profit (INRm) Net profit margin [RHS]
March 30, 2021 3
Welspun India
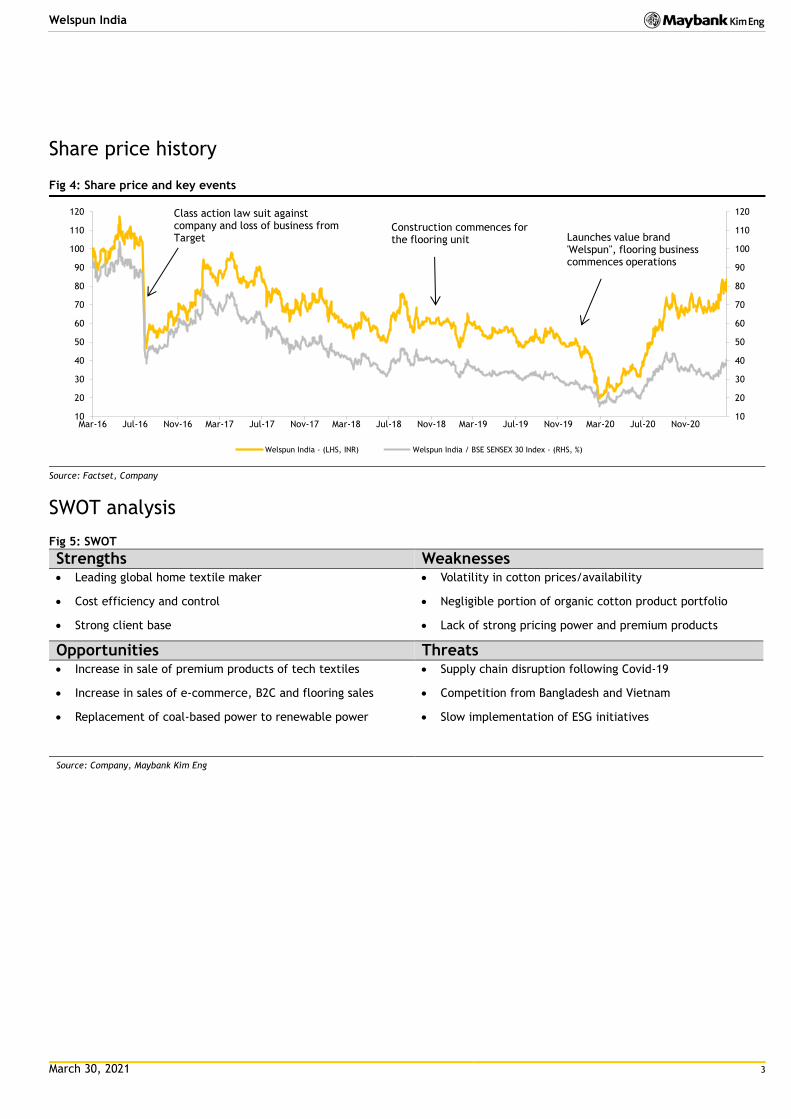
Share price history
Fig 4: Share price and key events
Source: Factset, Company
SWOT analysis
Fig 5: SWOT
Strengths Weaknesses Leading global home textile maker
Cost efficiency and control
Strong client base
Volatility in cotton prices/availability
Negligible portion of organic cotton product portfolio
Lack of strong pricing power and premium products
Opportunities Threats
Increase in sale of premium products of tech textiles
Increase in sales of e-commerce, B2C and flooring sales
Replacement of coal-based power to renewable power
Supply chain disruption following Covid-19
Competition from Bangladesh and Vietnam
Slow implementation of ESG initiatives
Source: Company, Maybank Kim Eng
10
20
30
40
50
60
70
80
90
100
110
120
10
20
30
40
50
60
70
80
90
100
110
120
Mar-16 Jul-16 Nov-16 Mar-17 Jul-17 Nov-17 Mar-18 Jul-18 Nov-18 Mar-19 Jul-19 Nov-19 Mar-20 Jul-20 Nov-20
Welspun India - (LHS, INR) Welspun India / BSE SENSEX 30 Index - (RHS, %)
Class action law suit against company and loss of business from Target Launches value brand
'Welspun", flooring business commences operations
Construction commences for the flooring unit

March 30, 2021 4
Welspun India
Financial snapshot
Fig 6: Revenue growth is slow and EBITDA margin down vs FY16
Source: Company
Fig 7: Exports form over 80% of revenue consistently
Source: Company
Fig 8: Top 10 clients account for over 60% of revenue
Source: Company
Fig 9: Recurring net profit and margin down vis a vis FY17
Source: Company
Fig 10: Net debt and net debt/equity are coming down
Source: Company
Fig 11: ROE and ROCE are improving slowly
Source: Factset
0.0%
6.0%
12.0%
18.0%
24.0%
30.0%
0
16,000
32,000
48,000
64,000
80,000
FY15 FY16 FY17 FY18 FY19 FY20
Revenue (INRm) EBITDA margin [RHS]
0%
20%
40%
60%
80%
100%
FY15 FY16 FY17 FY18 FY19 FY20
International Domestic
0.0%
16.0%
32.0%
48.0%
64.0%
80.0%
FY16 FY17 FY18 FY19 FY20
Top 10 clients
0.0%
3.0%
6.0%
9.0%
12.0%
15.0%
0
2,000
4,000
6,000
8,000
10,000
FY15 FY16 FY17 FY18 FY19 FY20
Net profit (INRm) Net profit margin [RHS]
0.0
0.4
0.8
1.2
1.6
2.0
0
6,400
12,800
19,200
25,600
32,000
FY15 FY16 FY17 FY18 FY19 FY20
Net debt (INRm) Net debt/Equity (x, RHS)
0.0%
10.0%
20.0%
30.0%
40.0%
50.0%
FY15 FY16 FY17 FY18 FY19 FY20
ROE ROCE
March 30, 2021 5
Welspun India
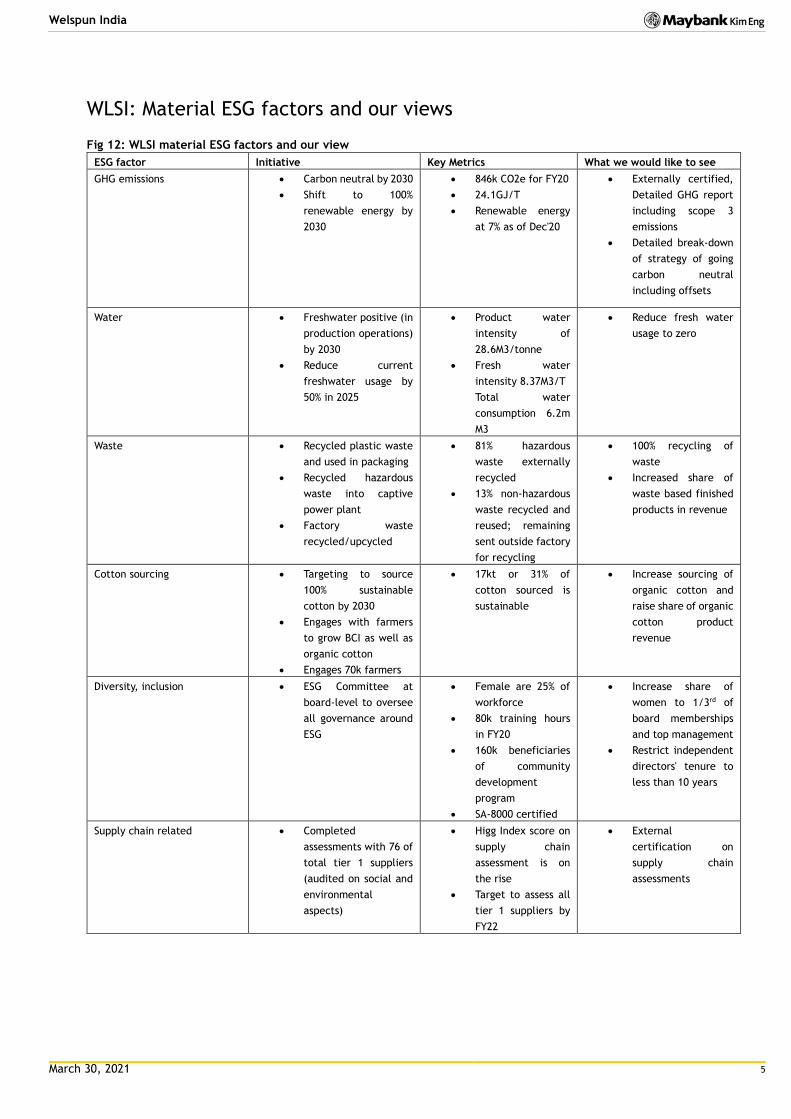
WLSI: Material ESG factors and our views
Fig 12: WLSI material ESG factors and our view
ESG factor Initiative Key Metrics What we would like to see
GHG emissions Carbon neutral by 2030
Shift to 100%
renewable energy by
2030
846k CO2e for FY20
24.1GJ/T
Renewable energy
at 7% as of Dec'20
Externally certified,
Detailed GHG report
including scope 3
emissions
Detailed break-down
of strategy of going
carbon neutral
including offsets
Water Freshwater positive (in
production operations)
by 2030
Reduce current
freshwater usage by
50% in 2025
Product water
intensity of
28.6M3/tonne
Fresh water
intensity 8.37M3/T
Total water
consumption 6.2m
M3
Reduce fresh water
usage to zero
Waste Recycled plastic waste
and used in packaging
Recycled hazardous
waste into captive
power plant
Factory waste
recycled/upcycled
81% hazardous
waste externally
recycled
13% non-hazardous
waste recycled and
reused; remaining
sent outside factory
for recycling
100% recycling of
waste
Increased share of
waste based finished
products in revenue
Cotton sourcing Targeting to source
100% sustainable
cotton by 2030
Engages with farmers
to grow BCI as well as
organic cotton
Engages 70k farmers
17kt or 31% of
cotton sourced is
sustainable
Increase sourcing of
organic cotton and
raise share of organic
cotton product
revenue
Diversity, inclusion ESG Committee at
board-level to oversee
all governance around
ESG
Female are 25% of
workforce
80k training hours
in FY20
160k beneficiaries
of community
development
program
SA-8000 certified
Increase share of
women to 1/3rd of
board memberships
and top management
Restrict independent
directors' tenure to
less than 10 years
Supply chain related Completed
assessments with 76 of
total tier 1 suppliers
(audited on social and
environmental
aspects)
Higg Index score on
supply chain
assessment is on
the rise
Target to assess all
tier 1 suppliers by
FY22
External
certification on
supply chain
assessments

March 30, 2021 6
Welspun India
Fig 13: Comparison with peers on various ESG parameters
ESG Metrics Aditya Birla
Fashions
Vardhman Textiles Page Industries Arvind Ltd Welspun India
GHG emissions FY20 - 60,038 tCO2 NA FY20 - 12,774 tCO2 FY19 - 732,862 tCO2
FY20 - 846,954 tCO2
Water Water neutral across facilities in FY20
3 effluent treatment plants and 8 sewage
treatment plants
76.2% of water recycled and
reused, 100% of sewage water reused
Commissioned 8MLD sewage recycling plant. Zero liquid discharge plant with 18ML/day capacity
Targets to be fresh water neutral by 2030 vs 10 KL/MT as of Dec'20
Waste Zero waste to landfill achieved across own facilities for non-hazardous waste
Disposal of hazardous solid waste is done only through authorized
disposal facilities
Zero waste to landfill by FY22. To establish a Restricted Substances List Policy to minimise
hazardous waste
All textile non-hazardous waste is sent to recyclers
81% of hazardous waste was recycled externally. Target Zero waste to landfill by 2025
Carbon neutrality target
NA NA NA NA Carbon neutral by 2030
Renewable energy 25% of energy requirement is met from renewable
sources
In the process of setting up 8.75 MW solar energy installations
Has solar rooftop project commissioned with generating capacity of 50 kW. Biomass used for
steam generation
Total solar energy capacity of 25MW. Target to increase
it to 40 MW
Targets to be 100% renewable energy by 2030 vs 7% as of
Dec'20
Packaging 87% sustainable packaging
NA Collaborated with SAAHAS a non-profit organization. SAAHAS is to collect and recycle or co-process plastic of equivalent amount to the plastic waste generated by PAGE’s packaging
Recycling of packaging material
Moving to sustainable packaging by reducing PVC and using recycled / recyclable material. 85% packaging sourced is certified sustainable
Better Cotton Initiative / Organic / recycled
Association with Cotton 2040 and Better Cotton Initiative. Recycled polyester using PET bottles. 10% products by volume to be recycled by
2025
13,949 farmers covered as of FY20 under Project Pragati, usage of organic and recycled cotton and recycled fabric
90% of critical fabric suppliers are OEKO TEX certified
Sustainable farming operations cover 80,000 farmers in FY20. Production of recycled denim, renewable wood, recycled polyester
etc.
Targets to have 100% sustainable cotton by 2030 vs 29% as of Dec'20. Targets to cover 100k farmers vs 13,029 as of Dec'20
Vendor code of conduct
90% of total vendors covered for code of
conduct audit
NA To cover 20% of domestic suppliers under sustainability assessment by FY21
and 100% by 2025
Higg Index score of 76-89 across
facilities
Assessed 76 tier 1 suppliers for ESG. Target to complete assessment of all tier 1s by FY22. Higg Index score for Anjar factory at 96%
and Vapi at 85.2%
Board diversity 12.5% of directors are women. Independent directors form 50% of the eight board members.
22% of directors are women. Independent directors form 56% of the nine member board.
6.7% of directors are women. Independent directors form 47% of the 15 member
board.
11% of directors are women. Independent directors form 56% of the 9 member board.
28.5% of directors are women. Independent directors form 57% of the 7 member board.
Controversies NA In May 2020, over 400 migrant workers held a protest over alleged worker exploitation claims
The Norwegian sovereign fund - Government Pension Fund Global recommended excluding PAGE from investment highlighting "systemic human right abuses" at its Bengaluru unit
There have been worker strikes in factory in July 2012, Jan 2013 and Oct 2015
FY17 - Class action lawsuit in the US for inappropriate labelling and use of low quality Egyptian cotton settled for USD36m. Target cancelling its
contract
Sustainalytics ESG Risk Rating *
13.2 12.9 14.8 20.2 17.6
*Sustainalytics score – lower is better risk score.
March 30, 2021 7
Welspun India
Notes:
1. OEKO-TEX certification ensures that the materials used in products are free from
harmful substances, from yarn to the finished fabric and are produced in facilities
that are in environmentally and socially sound condition.
2. WRAP certification is issued post thorough evaluation of production facilities
based on 12 principles of social compliance.
3. Higg Index is an apparel and footwear industry self-assessment standard for
assessing environmental and social sustainability throughout supply chain.
4. With regard to the recent issue about the labour practices in China’s Uighyur
province and decision of Western Brands to stop sourcing from this region, we
checked the implications with WLSI. WLSI clarified that it does not source cotton
from China and that its sales to Western brands are for their local stores only. At
this point of time, it has no impact from this issue in the textile sector.
From the above comparison of ESG practices of the textile sector including
apparels, WLSI stands out in terms of its targets to go carbon neutral, freshwater
neutral and 100% renewable energy use in the next decade. It has comparable or
better disclosures than peers in the sector.
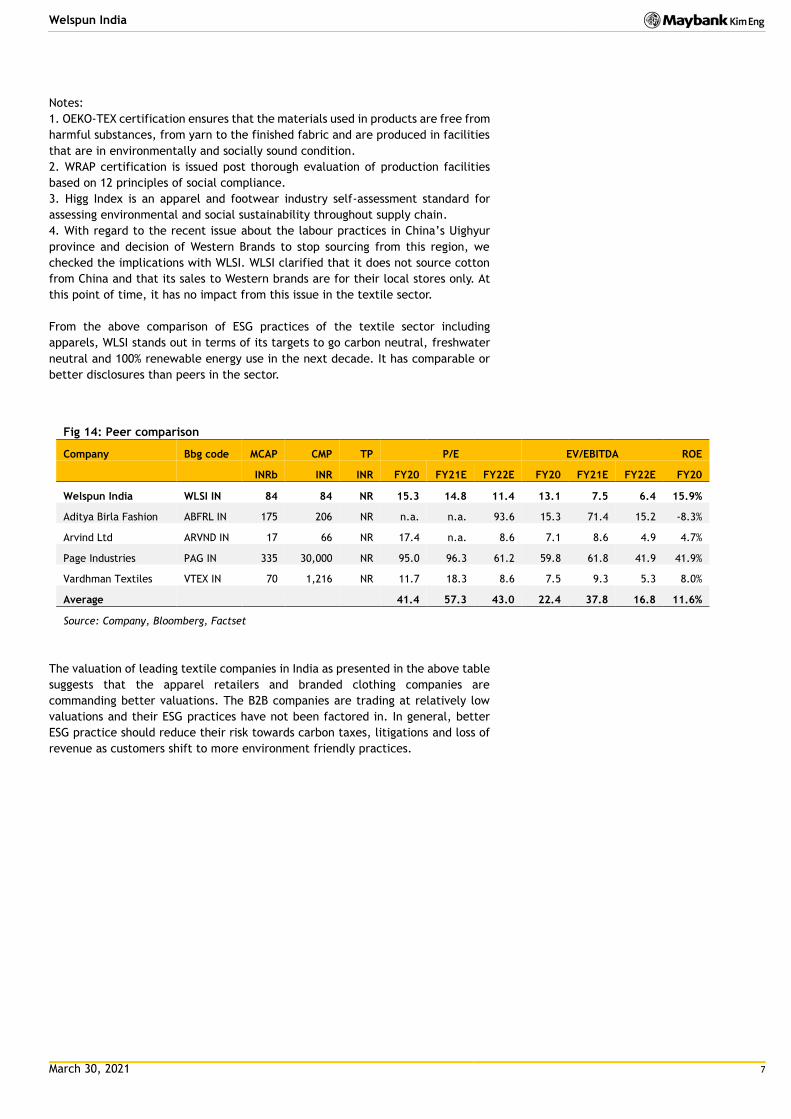
Fig 14: Peer comparison
Company Bbg code MCAP CMP TP P/E EV/EBITDA ROE
INRb INR INR FY20 FY21E FY22E FY20 FY21E FY22E FY20
Welspun India WLSI IN 84 84 NR 15.3 14.8 11.4 13.1 7.5 6.4 15.9%
Aditya Birla Fashion ABFRL IN 175 206 NR n.a. n.a. 93.6 15.3 71.4 15.2 -8.3%
Arvind Ltd ARVND IN 17 66 NR 17.4 n.a. 8.6 7.1 8.6 4.9 4.7%
Page Industries PAG IN 335 30,000 NR 95.0 96.3 61.2 59.8 61.8 41.9 41.9%
Vardhman Textiles VTEX IN 70 1,216 NR 11.7 18.3 8.6 7.5 9.3 5.3 8.0%
Average 41.4 57.3 43.0 22.4 37.8 16.8 11.6%
Source: Company, Bloomberg, Factset
The valuation of leading textile companies in India as presented in the above table
suggests that the apparel retailers and branded clothing companies are
commanding better valuations. The B2B companies are trading at relatively low
valuations and their ESG practices have not been factored in. In general, better
ESG practice should reduce their risk towards carbon taxes, litigations and loss of
revenue as customers shift to more environment friendly practices.

March 30, 2021 8
Welspun India
FYE 31 Mar FY16A FY17A FY18A FY19A FY20A
Key Metrics
P/E (reported) (x) 13.4 23.1 19.7 28.5 9.9
Core P/E (x) 13.6 10.7 15.1 12.6 4.7
P/BV (x) 5.1 3.7 2.2 2.2 0.7
P/NTA (x) 5.6 4.0 2.4 2.4 0.8
Net dividend yield (%) 1.3 0.7 1.1 0.5 4.6
FCF yield (%) 2.8 2.1 3.7 3.2 19.5
EV/EBITDA (x) 8.2 7.5 7.9 8.5 4.4
EV/EBIT (x) 10.7 11.0 14.3 14.5 7.3
INCOME STATEMENT (INR m)
Revenue 59,238.5 66,405.4 60,505.8 65,266.2 67,410.9
EBITDA 15,926.6 15,834.0 11,234.0 10,648.6 12,146.7
Depreciation (3,718.2) (5,054.2) (5,041.7) (4,357.6) (4,810.9)
Amortisation 0.0 0.0 0.0 0.0 0.0
EBIT 12,208.3 10,779.7 6,192.3 6,291.0 7,335.8
Net interest income /(exp) (1,463.6) (777.1) (595.4) (774.6) (826.1)
Associates & JV 0.0 0.0 0.0 0.0 0.0
Exceptionals 0.0 (4,647.5) 0.0 (2,647.0) 434.2
Other pretax income 0.0 0.0 0.0 0.0 0.0
Pretax profit 10,744.7 5,355.1 5,596.9 2,869.4 6,943.9
Income tax (3,253.5) (1,731.4) (1,614.9) (607.7) (1,700.4)
Minorities (126.2) (48.1) (132.3) (163.4) (169.8)
Discontinued operations 0.0 0.0 0.0 0.0 0.0
Reported net profit 7,365.0 3,575.6 3,849.7 2,098.3 5,073.7
Core net profit 7,365.0 8,223.1 3,849.7 4,745.3 4,639.6
BALANCE SHEET (INR m)
Cash & Short Term Investments 1,489.5 2,856.7 2,661.0 2,728.0 4,740.9
Accounts receivable 8,499.0 9,600.6 9,309.9 10,768.1 10,861.6
Inventory 11,046.4 12,810.0 13,053.8 13,342.3 15,287.2
Property, Plant & Equip (net) 33,391.1 35,574.6 33,157.3 35,579.0 37,611.5
Intangible assets 1,925.1 1,879.3 2,270.1 2,367.4 2,296.9
Investment in Associates & JVs 0.0 0.0 0.0 0.0 0.0
Other assets 9,140.1 10,562.0 11,796.4 12,637.9 12,304.8
Total assets 65,491.2 73,283.2 72,248.6 77,422.8 83,102.8
ST interest bearing debt 13,532.6 11,720.8 12,579.6 14,080.2 17,977.5
Accounts payable 6,652.3 7,517.3 6,446.5 7,041.3 8,978.5
LT interest bearing debt 18,945.5 21,392.9 20,227.6 19,023.8 17,231.3
Other liabilities 6,248.0 8,325.0 6,471.0 8,775.0 8,346.0
Total Liabilities 45,378.7 48,956.4 45,724.9 48,920.1 52,533.7
Shareholders Equity 19,700.5 23,971.5 26,056.7 27,793.2 29,720.5
Minority Interest 412.0 355.3 467.0 709.4 848.6
Total shareholder equity 20,112.5 24,326.8 26,523.7 28,502.6 30,569.1
Total liabilities and equity 65,491.2 73,283.2 72,248.6 77,422.8 83,102.8
CASH FLOW (INR m)
Pretax profit 10,744.7 5,355.1 5,596.9 2,869.4 6,943.9
Depreciation & amortisation 3,718.2 5,054.2 5,041.7 4,357.6 4,810.9
Adj net interest (income)/exp 2,140.2 1,269.8 1,137.7 1,305.9 1,692.9
Change in working capital (530.0) (1,522.2) (4,462.8) 2,535.3 (1,577.3)
Cash taxes paid (2,393.4) (1,066.5) (1,342.5) (1,244.5) (1,616.3)
Other operating cash flow (27.5) 61.2 (16.1) 73.0 (703.0)
Cash flow from operations 13,280.0 8,321.9 5,450.2 8,068.7 7,772.2
Capex (10,522.2) (6,469.7) (3,269.8) (6,170.5) (3,505.4)
Free cash flow 2,757.7 1,852.3 2,180.4 1,898.2 4,266.8
Dividends paid (2,443.4) (63.4) (783.4) (787.3) (1,574.7)
Equity raised / (purchased) 0.5 (127.8) 0.0 0.4 0.0
Change in Debt (1,181.9) 454.6 (303.0) 299.1 966.1
Other invest/financing cash flow (2,300.6) (718.3) (1,307.3) (1,344.1) (1,662.5)
Effect of exch rate changes 0.0 (30.3) 17.7 0.7 17.0
Net cash flow (3,167.7) 1,367.2 (195.6) 67.0 2,012.7
March 30, 2021 9
Welspun India
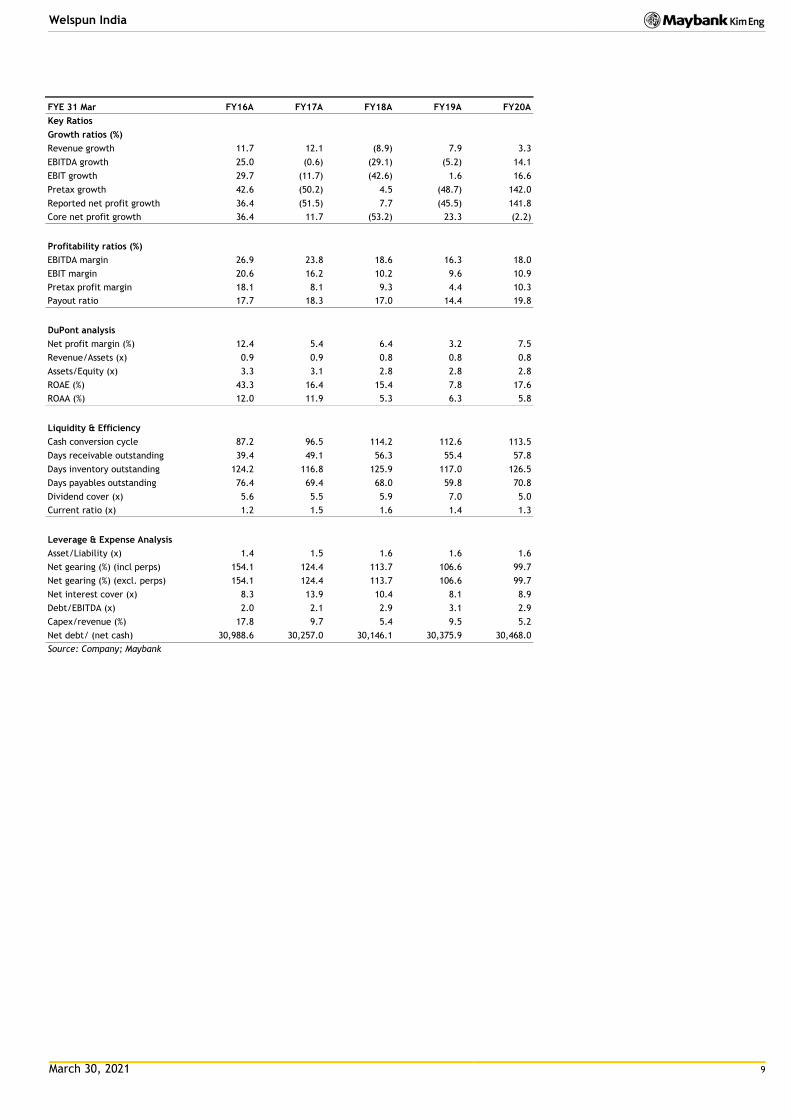
FYE 31 Mar FY16A FY17A FY18A FY19A FY20A
Key Ratios
Growth ratios (%)
Revenue growth 11.7 12.1 (8.9) 7.9 3.3
EBITDA growth 25.0 (0.6) (29.1) (5.2) 14.1
EBIT growth 29.7 (11.7) (42.6) 1.6 16.6
Pretax growth 42.6 (50.2) 4.5 (48.7) 142.0
Reported net profit growth 36.4 (51.5) 7.7 (45.5) 141.8
Core net profit growth 36.4 11.7 (53.2) 23.3 (2.2)
Profitability ratios (%)
EBITDA margin 26.9 23.8 18.6 16.3 18.0
EBIT margin 20.6 16.2 10.2 9.6 10.9
Pretax profit margin 18.1 8.1 9.3 4.4 10.3
Payout ratio 17.7 18.3 17.0 14.4 19.8
DuPont analysis
Net profit margin (%) 12.4 5.4 6.4 3.2 7.5
Revenue/Assets (x) 0.9 0.9 0.8 0.8 0.8
Assets/Equity (x) 3.3 3.1 2.8 2.8 2.8
ROAE (%) 43.3 16.4 15.4 7.8 17.6
ROAA (%) 12.0 11.9 5.3 6.3 5.8
Liquidity & Efficiency
Cash conversion cycle 87.2 96.5 114.2 112.6 113.5
Days receivable outstanding 39.4 49.1 56.3 55.4 57.8
Days inventory outstanding 124.2 116.8 125.9 117.0 126.5
Days payables outstanding 76.4 69.4 68.0 59.8 70.8
Dividend cover (x) 5.6 5.5 5.9 7.0 5.0
Current ratio (x) 1.2 1.5 1.6 1.4 1.3
Leverage & Expense Analysis
Asset/Liability (x) 1.4 1.5 1.6 1.6 1.6
Net gearing (%) (incl perps) 154.1 124.4 113.7 106.6 99.7
Net gearing (%) (excl. perps) 154.1 124.4 113.7 106.6 99.7
Net interest cover (x) 8.3 13.9 10.4 8.1 8.9
Debt/EBITDA (x) 2.0 2.1 2.9 3.1 2.9
Capex/revenue (%) 17.8 9.7 5.4 9.5 5.2
Net debt/ (net cash) 30,988.6 30,257.0 30,146.1 30,375.9 30,468.0
Source: Company; Maybank

March 30, 2021 10
Welspun India
Research Offices
ECONOMICS
Suhaimi ILIAS Chief Economist Malaysia | Philippines | Global (603) 2297 8682 [email protected]
CHUA Hak Bin Regional Thematic Macroeconomist (65) 6231 5830 [email protected]
LEE Ju Ye Singapore | Thailand | Indonesia (65) 6231 5844 [email protected]
Linda LIU Singapore | Vietnam | Cambodia | Myanmar | Laos (65) 6231 5847 [email protected]
Dr Zamros DZULKAFLI (603) 2082 6818 [email protected]
Ramesh LANKANATHAN (603) 2297 8685 [email protected]
William POH (603) 2297 8683 [email protected]
FX
Saktiandi SUPAAT Head of FX Research (65) 6320 1379 [email protected]
Christopher WONG (65) 6320 1347 [email protected]
TAN Yanxi (65) 6320 1378 [email protected]
Fiona LIM (65) 6320 1374 [email protected]
STRATEGY
Anand PATHMAKANTHAN
ASEAN (603) 2297 8783 [email protected]
FIXED INCOME
Winson PHOON, ACA (65) 6340 1079 [email protected]
SE THO Mun Yi (603) 2074 7606 [email protected]
REGIONAL EQUITIES
Anand PATHMAKANTHAN Head of Regional Equity Research (603) 2297 8783 [email protected]
WONG Chew Hann, CA Head of ASEAN Equity Research (603) 2297 8686 [email protected]
ONG Seng Yeow Research, Technology & Innovation (65) 6231 5839 [email protected]
MALAYSIA
Anand PATHMAKANTHAN Head of Research (603) 2297 8783 [email protected] • Strategy
Desmond CH’NG, BFP, FCA (603) 2297 8680
[email protected] • Banking & Finance
LIAW Thong Jung (603) 2297 8688 [email protected] • Oil & Gas Services- Regional • Automotive
ONG Chee Ting, CA (603) 2297 8678 [email protected] • Plantations - Regional
YIN Shao Yang, CPA (603) 2297 8916 [email protected] • Gaming – Regional • Media • Aviation
TAN Chi Wei, CFA (603) 2297 8690 [email protected] • Power • Telcos
WONG Wei Sum, CFA (603) 2297 8679 [email protected] • Property
LEE Yen Ling (603) 2297 8691 [email protected] • Glove • Ports • Shipping • Healthcare • Petrochemicals
Kevin WONG (603) 2082 6824 [email protected] • REITs • Technology
Jade TAM (603) 2297 8687 [email protected] • Consumer Staples & Discretionary
Fahmi FARID (603) 2297 8676 [email protected] • Software
TEE Sze Chiah Head of Retail Research (603) 2082 6858 [email protected]
Nik Ihsan RAJA ABDULLAH, MSTA, CFTe (603) 2297 8694 [email protected] • Chartist
Amirah AZMI (603) 2082 8769 [email protected] • Retail Research
SINGAPORE
Thilan WICKRAMASINGHE Head of Research (65) 6231 5840 [email protected] • Banking & Finance - Regional • Consumer
CHUA Su Tye (65) 6231 5842 [email protected] • REITs - Regional
LAI Gene Lih, CFA (65) 6231 5832 [email protected] • Technology • Healthcare
Kareen CHAN (65) 6231 5926 [email protected] • Transport • Telcos
Eric ONG (65) 6231 5924 [email protected] • Retail Research
Matthew SHIM (65) 6231 5929 [email protected]
• Retail Research
INDIA
Jigar SHAH Head of Research (91) 22 4223 2632 [email protected] • Strategy • Oil & Gas • Automobile • Cement
Neerav DALAL (91) 22 4223 2606 [email protected] • Software Technology • Telcos
Kshitiz PRASAD (91) 22 4223 2607 [email protected] • Banks
Vikram RAMALINGAM (91) 22 4223 2607 [email protected] • Automobile • Media
INDONESIA
Isnaputra ISKANDAR Head of Research (62) 21 8066 8680 [email protected] • Strategy • Metals & Mining • Cement • Autos • Consumer • Utility
Rahmi MARINA (62) 21 8066 8689 [email protected] • Banking & Finance
Aurellia SETIABUDI (62) 21 8066 8691 [email protected] • Property
Willy GOUTAMA (62) 21 8066 8500 [email protected] • Consumer
PHILIPPINES
Jacqui De JESUS Head of Research (63) 2 8849 8844 [email protected] • Strategy • Conglomerates
Romel LIBO-ON (63) 2 8849 8844 [email protected] • Property • Telcos
Fredrick De GUZMAN (63) 2 8849 8847 [email protected] • Consumer
Bernadine B BAUTISTA (63) 2 8849 8847 [email protected] • Utilities
Rachelleen RODRIGUEZ, CFA (63) 2 8849 8843 [email protected] • Banking & Finance
THAILAND
Maria LAPIZ Head of Institutional Research Dir (66) 2257 0250 | (66) 2658 6300 ext 1399 [email protected] • Strategy • Consumer • Materials • Services
Jesada TECHAHUSDIN, CFA (66) 2658 6300 ext 1395 [email protected] • Banking & Finance
Kaushal LADHA, CFA (66) 2658 6300 ext 1392 [email protected] • Oil & Gas – Regional • Petrochemicals - Regional • Utilities
Vanida GEISLER, CPA (66) 2658 6300 ext 1394 [email protected] • Property • REITs
Yuwanee PROMMAPORN (66) 2658 6300 ext 1393 Yuwanee.P @maybank-ke.co.th • Services • Healthcare
Ekachai TARAPORNTIP Head of Retail Research (66) 2658 5000 ext 1530 [email protected]
Surachai PRAMUALCHAROENKIT (66) 2658 5000 ext 1470 [email protected] • Auto • Conmat • Contractor • Steel
Suttatip PEERASUB (66) 2658 5000 ext 1430 [email protected] • Food & Beverage • Commerce
Jaroonpan WATTANAWONG (66) 2658 5000 ext 1404 [email protected] • Transportation • Small cap
Thanatphat SUKSRICHAVALIT (66) 2658 5000 ext 1401 [email protected] • Media • Electronics
Wijit ARAYAPISIT (66) 2658 5000 ext 1450 [email protected] • Strategist
Theerasate PROMPONG (66) 2658 5000 ext 1400 [email protected] • Equity Portfolio Strategist
Apiwat TAVESIRIVATE (66) 2658 5000 ext 1310 [email protected] • Chartist and TFEX
VIETNAM
Quan Trong Thanh (84 28) 44 555 888 ext 8184 [email protected] • Banks
Hoang Huy, CFA (84 28) 44 555 888 ext 8181 [email protected] • Strategy
Le Nguyen Nhat Chuyen (84 28) 44 555 888 ext 8082
[email protected] • Oil & Gas
Nguyen Thi Sony Tra Mi (84 28) 44 555 888 ext 8084 [email protected] • Consumer
Tyler Manh Dung Nguyen (84 28) 44 555 888 ext 8180 [email protected] • Utilities • Property
Nguyen Thi Ngan Tuyen Head of Retail Research (84 28) 44 555 888 ext 8081 [email protected] • Food & Beverage • Oil & Gas • Banking
Nguyen Thanh Lam (84 28) 44 555 888 ext 8086 [email protected] • Technical Analysis

March 30, 2021 11
Welspun India
APPENDIX I: TERMS FOR PROVISION OF REPORT, DISCLAIMERS AND DISCLOSURES
DISCLAIMERS This research report is prepared for general circulation and for information purposes only and under no circumstances should it be considered or intended as an offer to s ell or a solicitation of an offer to buy the securities referred to herein. Investors should note that values of such securities, i f any, may fluctuate and that each security’s price or value may rise or fall. Opinions or recommendations contained herein are in form of technical ratings and fundamental ratings. Technical ratings may differ fr om fundamental ratings as technical valuations apply different methodologies and are purely based on price and volume-related information extracted from the relevant jurisdiction’s stock exchange in the equity analysis. Accordingly, investors’ returns may be less than the original sum invested. Past performance is not necessarily a guide to future performance. This report is not intended to provide personal investment advice and does not take into account the specific investment objectives, the financial situation and the particular needs of persons who may receive or read this report. Investors should therefore seek financial, legal and other advice regarding the appropriateness of investing in any securities or the investment strategies discussed or recommended in this report.
The information contained herein has been obtained from sources believed to be reliable but such sources have not been independently verified by Maybank Investment Bank Berhad, its subsidiary and affiliates (collectively, “MKE”) and consequently no representation is made as to the accuracy or completeness of this report by MKE and it should not be relied upon as such. Accordingly, MKE and its officers, directors, associates, connected parties and/or employees (collectively, “Representatives”) shall not be liable for any direct, indirect or consequential losses or damages that may arise from the use or reliance of this report. Any information, opinions or recommendations contained herein are subject to change at any time, without prior notice.
This report may contain forward looking statements which are often but not always identified by the use of words such as “anticipate”, “believe”, “estimate”, “intend”, “plan”, “expect”, “forecast”, “predict” and “project” and statements that an event or result “may”, “will”, “can”, “should”, “could” or “might” occur or be achieved and other similar expressions. Such forward looking statements are based on assumptions made and information currently available to us and are subject to certain risks and uncertainties that could cause the actual results to differ materially from those expressed in any forward looking statements. Readers are cautioned not to place undue relevance on these forward-looking statements. MKE expressly disclaims any obligation to update or revise any such forward looking statements to reflect new information, events or circumstances after the date of this publication or to reflect the occurrence of unanticipated events.
MKE and its officers, directors and employees, including persons involved in the preparation or issuance of this report, may, to the extent permitted by law, from time to time participate or invest in financing transactions with the issuer(s) of the securities mentioned in this report, perform services for or solic it business from such issuers, and/or have a position or holding, or other material interest, or effect transactions, in such securities or options thereon, or other investments related thereto. In addition, it may make markets in the securities mentioned in the material presented in this report. One or more directors, officers and/or employees of MKE may be a director of the issuers of the securities mentioned in this report to the extent permitted by law.
This report is prepared for the use of MKE’s clients and may not be reproduced, altered in any way, transmitted to, copied or distributed to any other party in whole or in part in any form or manner without the prior express written consent of MKE and MKE and its Representatives accepts no liability whatsoever for t he actions of third parties in this respect.
This report is not directed to or intended for distribution to or use by any person or entity who is a citizen or resident of or located in any locality, state, country or other jurisdiction where such distribution, publication, availability or use would be contrary to law or regulation. This report is for distribution only under such circumstances as may be permitted by applicable law. The securities described herein may not be eligible for sale in all jurisdictions or to certain categor ies of investors. Without prejudice to the foregoing, the reader is to note that additional disclaimers, warnings or qualifications may apply based on geographical location of the person or entity receiving this repor t.
Malaysia Opinions or recommendations contained herein are in the form of technical ratings and fundamental ratings. Technical ratings may differ from fundamental ratings as technical valuations apply different methodologies and are purely based on price and volume-related information extracted from Bursa Malaysia Securities Berhad in the equity analysis.
Singapore This report has been produced as of the date hereof and the information herein may be subject to change. Maybank Kim Eng Research Pte. Ltd. (“Maybank KERPL”) in Singapore has no obligation to update such information for any recipient. For distribution in Singapore, recipients of this report are to contact Maybank KERPL in Singapore in respect of any matters arising from, or in connection with, this report. If the recipient of this report is not an accredited investor, expert investor or institutional investor (as defined under Section 4A of the Singapore Securities and Futures Act), Maybank KERPL shall be legally liable for the contents of this report, with such liability being limited to the extent (if any) as permitted by law.
Thailand Except as specifically permitted, no part of this presentation may be reproduced or distributed in any manner without the prior written permission of Maybank Kim Eng Securities (Thailand) Public Company Limited. Maybank Kim Eng Securities (Thailand) Public Company Limited (“MBKET”) accepts no liability whatsoever for the actions of third parties in this respect.
Due to different characteristics, objectives and strategies of institutional and retail investors, the research products of MBKET Institutional and Retail Research departments may differ in either recommendation or target price, or both. MBKET reserves the rights to disseminate MBKET Retail Research reports to institutional investors who have requested to receive it. If you are an authorised recipient, you hereby tacitly acknowledge that the research reports from MBKET Retail Research are first produced in Thai and there is a time lag in the release of the translated English version.
The disclosure of the survey result of the Thai Institute of Directors Association (“IOD”) regarding corporate governance is made pursuant to the policy of the Office of the Securities and Exchange Commission. The survey of the IOD is based on the information of a company listed on the Stock Exchange of Thailand and the market for Alternative Investment disclosed to the public and able to be accessed by a general public investor. The result, therefore, is from the perspective of a third party. It is not an evaluation of operation and is not based on inside information. The survey result is as of the date appearing in the Corporate Governance Report of Thai Listed Companies. As a result, the survey may be changed after that date. MBKET does not confirm nor certify the accuracy of such survey result.
The disclosure of the Anti-Corruption Progress Indicators of a listed company on the Stock Exchange of Thailand, which is assessed by Thaipat Institute, is made in order to comply with the policy and sustainable development plan for the listed companies of the Office of the Securities and Exchange Commission. Thaipat Institute made this assessment based on the information received from the listed company, as stipulated in the form for the assessment of Anti-corruption which refers to the Annual Registration Statement (Form 56-1), Annual Report (Form 56-2), or other relevant documents or reports of such listed company. The assessment result is therefore made from the perspective o f Thaipat Institute that is a third party. It is not an assessment of operation and is not based on any inside information. Since this assessment is only the assessment result as of the date appearing in the assessment result, it may be changed after that date or when there is any change to the relevant information. Nevertheless, MBKET does not confirm, verify, or certify the accuracy and completeness of the assessment result.
US This third-party research report is distributed in the United States (“US”) to Major US Institutional Investors (as defined in Rule 15a-6 under the Securities Exchange Act of 1934, as amended) only by Maybank Kim Eng Securities USA Inc (“Maybank KESUSA”), a broker-dealer registered in the US (registered under Section 15 of the Securities Exchange Act of 1934, as amended). All responsibility for the distribution of this report by Maybank KESUSA in the US shall be borne by Maybank KESUSA. This report is not directed at you if MKE is prohibited or restricted by any legislation or regulation in any jurisdiction from making it available to you. You should satisfy yourself before reading it that Maybank KESUSA is permitted to provide research material concerning investments to you under relevant legislation and regulations. All U.S. persons receiving and/or accessing this report and wishing to effect transactions in any security mentioned within must do so with: Maybank Kim Eng Securities USA Inc. 400 Park Avenue, 11th Floor, New York, New York 10022, 1-(212) 688-8886 and not with, the issuer of this report.
March 30, 2021 12
Welspun India
Disclosure of Interest
Malaysia: MKE and its Representatives may from time to time have positions or be materially interested in the securities referred to herein and may further act as market maker or may have assumed an underwriting commitment or deal with such securities and may also perform or seek to perform investment banking services, advisory and other services for or relating to those companies. Singapore: As of 30 March 2021, Maybank KERPL and the covering analyst do not have any interest in any companies recommended in this research report. Thailand: MBKET may have a business relationship with or may possibly be an issuer of derivative warrants on the securities /companies mentioned in the research report. Therefore, Investors should exercise their own judgment before making any investment decisions. MBKET, its associates, directors, connected parties and/or employees may from time to time have interests and/or underwriting commitments in the securities mentioned in this report. Hong Kong: As of 30 March 2021, KESHK and the authoring analyst do not have any interest in any companies recommended in this research report. India: As of 30 March 2021, and at the end of the month immediately preceding the date of publication of the research report, KESI, authoring analyst o r their associate / relative does not hold any financial interest or any actual or beneficial ownership in any shares or having any conflict of interest in the subject companies except as otherwise disclosed in the research report.
In the past twelve months KESI and authoring analyst or their associate did not receive any compensation or other benefits from the subject companies or third party in connection with the research report on any account what so ever except as otherwise disclosed in the research report.
MKE may have, within the last three years, served as manager or co-manager of a public offering of securities for, or currently may make a primary market in issues of, any or all of the entities mentioned in this report or may be providing, or have provided within the previous 12 months, significant advice or investment services in relation to the investment concerned or a related investment and may receive compensation for the services provided from the companies covered in this report.
OTHERS
Analyst Certification of Independence
The views expressed in this research report accurately reflect the analyst’s personal views about any and all of the subject securities or issuers; and no part of the research analyst’s compensation was, is or will be, directly or indirectly, related to the specific recommendations or views expressed in the report.
Reminder
Structured securities are complex instruments, typically involve a high degree of risk and are intended for sale only to soph isticated investors who are capable of understanding and assuming the risks involved. The market value of any structured security may be affected by changes in economic, financial and politic al factors (including, but not limited to, spot and forward interest and exchange rates), time to maturity, market conditions and volatility and the credit quality of any issuer or reference issuer. Any investor interested in purchasing a structured product should conduct its own analysis of the product and consult with its own professional advisers as to the risks involved in making such a purchase.
No part of this material may be copied, photocopied or duplicated in any form by any means or redistributed without the prior consent of MKE.
Definition of Ratings
Maybank Kim Eng Research uses the following rating system
BUY Return is expected to be above 10% in the next 12 months (including dividends)
HOLD Return is expected to be between 0% to 10% in the next 12 months (including dividends)
SELL Return is expected to be below 0% in the next 12 months (including dividends)
Applicability of Ratings
The respective analyst maintains a coverage universe of stocks, the list of which may be adjusted according to needs. Investment ratings are only applicable to the stocks which form part of the coverage universe. Reports on companies which are not part of the coverage do not carry investment ratings as we do not actively follow developments in these companies.
UK This document is being distributed by Maybank Kim Eng Securities (London) Ltd (“Maybank KESL”) which is authorized and regulated, by the Financial Conduct Authority and is for Informational Purposes only. This document is not intended for distribution to anyone defined as a Retail Client under the Financial Services and Markets Act 2000 within the UK. Any inclusion of a third party link is for the recipients convenience only, and that the firm does not take any responsibility for its comments or accuracy, and that access to such links is at the individuals own risk. Nothing in this report should be considered as constituting legal, accounting or tax advice, and that for accurate guidance r ecipients should consult with their own independent tax advisers.
DISCLOSURES
Legal Entities Disclosures Malaysia: This report is issued and distributed in Malaysia by Maybank Investment Bank Berhad (15938- H) which is a Participating Organization of Bursa Malaysia Berhad and a holder of Capital Markets and Services License issued by the Securities Commission in Malaysia. Singapore: This report is distributed in Singapore by Maybank KERPL (Co. Reg No 198700034E) which is regulated by the Monetary Authority of Singapore. Indonesia: PT Maybank Kim Eng Securities (“PTMKES”) (Reg. No. KEP-251/PM/1992) is a member of the Indonesia Stock Exchange and is regulated by the Financial Services Authority (Indonesia). Thailand: MBKET (Reg. No.0107545000314) is a member of the Stock Exchange of Thailand and is regulated by the Ministry of Finance and the Securities and Exchange Commission. Philippines: Maybank ATRKES (Reg. No.01-2004-00019) is a member of the Philippines Stock Exchange and is regulated by the Securities and Exchange Commission. Vietnam: Maybank Kim Eng Securities Limited (License Number: 117/GP-UBCK) is licensed under the State Securities Commission of Vietnam. Hong Kong: KESHK (Central Entity No AAD284) is regulated by the Securities and Futures Commission. India: Kim Eng Securities India Private Limited (“KESI”) is a participant of the National Stock Exchange of India Limited and the Bombay Stock Exchange and is regulated by Securities and Exchange Board of India (“SEBI”) (Reg. No. INZ000010538). KESI is also registered with SEBI as Category 1 Merchant Banker (Reg. No. INM 000011708) and as Research Analyst (Reg No: INH000000057) US: Maybank KESUSA is a member of/ and is authorized and regulated by the FINRA – Broker ID 27861. UK: Maybank KESL (Reg No 2377538) is authorized and regulated by the Financial Conduct Authority.
March 30, 2021 13
Welspun India
Malaysia Maybank Investment Bank Berhad
(A Participating Organisation of
Bursa Malaysia Securities Berhad)
33rd Floor, Menara Maybank,
100 Jalan Tun Perak,
50050 Kuala Lumpur
Tel: (603) 2059 1888;
Fax: (603) 2078 4194
Singapore Maybank Kim Eng Securities Pte Ltd
Maybank Kim Eng Research Pte Ltd
50 North Canal Road
Singapore 059304
Tel: (65) 6336 9090
London Maybank Kim Eng Securities
(London) Ltd
PNB House
77 Queen Victoria Street
London EC4V 4AY, UK
Tel: (44) 20 7332 0221
Fax: (44) 20 7332 0302
New York Maybank Kim Eng Securities USA
Inc
400 Park Avenue, 11th Floor
New York, New York 10022,
U.S.A.
Tel: (212) 688 8886
Fax: (212) 688 3500
Stockbroking Business:
Level 8, Tower C, Dataran Maybank,
No.1, Jalan Maarof
59000 Kuala Lumpur
Tel: (603) 2297 8888
Fax: (603) 2282 5136
Hong Kong Kim Eng Securities (HK) Ltd
28/F, Lee Garden Three,
1 Sunning Road, Causeway Bay,
Hong Kong
Tel: (852) 2268 0800
Fax: (852) 2877 0104
Indonesia PT Maybank Kim Eng Securities
Sentral Senayan III, 22nd Floor
Jl. Asia Afrika No. 8
Gelora Bung Karno, Senayan
Jakarta 10270, Indonesia
Tel: (62) 21 2557 1188
Fax: (62) 21 2557 1189
India Kim Eng Securities India Pvt Ltd
1101, 11th floor, A Wing, Kanakia
Wall Street, Chakala, Andheri -
Kurla Road, Andheri East,
Mumbai City - 400 093, India
Tel: (91) 22 6623 2600
Fax: (91) 22 6623 2604
Philippines Maybank ATR Kim Eng Securities Inc.
17/F, Tower One & Exchange Plaza
Ayala Triangle, Ayala Avenue
Makati City, Philippines 1200
Tel: (63) 2 8849 8888
Fax: (63) 2 8848 5738
Thailand Maybank Kim Eng Securities
(Thailand) Public Company Limited
999/9 The Offices at Central World,
20th - 21st Floor,
Rama 1 Road Pathumwan,
Bangkok 10330, Thailand
Tel: (66) 2 658 6817 (sales)
Tel: (66) 2 658 6801 (research)
Vietnam Maybank Kim Eng Securities Limited
4A-15+16 Floor Vincom Center Dong
Khoi, 72 Le Thanh Ton St. District 1
Ho Chi Minh City, Vietnam
Tel : (84) 844 555 888
Fax : (84) 8 38 271 030
Saudi Arabia In association with
Anfaal Capital
Ground Floor, KANOO Building
No.1 - Al-Faisaliyah,Madina Road,
P.O.Box 126575 Jeddah 21352
Kingdom of Saudi Arabia
Tel: (966) 920023423
South Asia Sales Trading Kevin Foy
Regional Head Sales Trading
Tel: (65) 6636-3620
US Toll Free: 1-866-406-7447
North Asia Sales Trading Andrew Lee
Tel: (852) 2268 0283
US Toll Free: 1 877 837 7635
Indonesia Iwan Atmadjaja [email protected] (62) 21 8066 8555
London Greg Smith [email protected] Tel: (44) 207-332-0221
New York James Lynch [email protected] Tel: (212) 688 8886
India Sanjay Makhija [email protected] Tel: (91)-22-6623-2629
Philippines Keith Roy [email protected] Tel: (63) 2 848-5288
www.maybank-ke.com | www.maybank-keresearch.com