52w high/low (sgd) buy singapore telecommunications
TRANSCRIPT

2.40
February 10, 2021
Tele
com
munic
ati
ons
Sin
gapore
THIS REPORT HAS BEEN PREPARED BY MAYBANK KIM ENG RESEARCH
SEE PAGE 11 FOR IMPORTANT DISCLOSURES AND ANALYST CERTIFICATIONS
Co. Reg No: 198700034E MICA (P) : 099/03/2012
ESG Tear Sheet Insert
Kareen Chan [email protected] (65) 6231 5926
Singapore Telecommunications (ST SP)
Sequential recovery
Maintain BUY on deep value
9MFY21 EBIT is on track to meet MKE/consensus estimates. Maintain BUY and SOTP-based TP of SGD2.88. We think the worst is over as we see earnings recovering sequentially due to: i) gradual ARPU recovery post-Covid; ii) potential 5G ARPU uplift of 1.9% YoY from FY23-26E; iii) BHARTI driving associates’ recovery. Singtel remains our Top Pick in the Singapore telco space. We see deep value in Singtel as the market is ascribing almost zero value to its SG and Australia operations, while offering 5.3% FY22E yield. This is followed by NetLink NBN Trust (NETLINK SP, CP: SGD0.955, BUY, TP: SGD1.11).
No changes to our forecasts
3QFY21 revenue of SGD4.2b fell 3% YoY but rose 9% QoQ due to strong demand for premium handsets (mainly iPhones). In addition, the decline in roaming and prepaid revenues was cushioned by the growth in subscription for the ‘Optus Choice’ customised data plans in Australia, which drove up post-paid ARPU by 2.7% QoQ. 9MFY20 revenue achieved 77%/76% of MKE/consensus. Operational EBITDA fell 14% YoY due to a narrower EBITDA margin of 23.7% (3QFY20: 26.6%, 2QFY21: 25.9%) as a result of a lower sales mix of National Broadband Network (NBN) migration. Meanwhile, EBIT reached 72%/76% of MKE/consensus estimates. We make no changes to our forecasts.
BHARTI takes the driving seat
Among the associates, green shoot is emerging for BHARTI (BHARTI IN, CP: INR595, BUY, TP: INR750) as 9MFY21 pre-tax loss narrowed significantly by 90.4% YoY to SGD35m. Additionally, we noted that BHARTI continues to outperform its peers across most operating metrics in India, recording the highest quarterly revenue due to strong customer additions. Our India telco analyst Neerav believes tariff hikes and 4G adoption from a low base will continue to be catalysts to drive BHARTI’s turnaround. We estimate India’s sector ARPU to grow 2-3% QoQ within 6 months and BHARTI to account for 18% of Singtel’s FY22E associates earnings. We believe BHARTI’s performance could drive recovery in regional associates’ contribution.
NCS may pose upside surprise
Enterprise revenue remained resilient despite disruptions to businesses caused by Covid-19. This was driven by strong ICT revenue growth of 7.9% YoY, led by NCS and Australia Enterprise as customers stepped up on digitalisation efforts. In particular, revenue from NCS was SGD809m (+75% QoQ and +79% YoY). While Group CEO Mr Yuen Kuan Moon has yet to announce his strategy, the recent restructuring of NCS to operate as an autonomous unit signals Singtel’s focus on the division.
Share Price SGD 2.40
12m Price Target SGD 2.88 (+20%)
Previous Price Target SGD 2.88
BUY
Company Description
Statistics
52w high/low (SGD)
3m avg turnover (USDm)
Free float (%)
Issued shares (m)
Market capitalisation
Major shareholders:
51.9%
5.7%
3.3%
16,515
63.6
Singtel is the largest integrated telecommunications
service provider in Singapore and has significant
share in Australia, India and ASEAN
Temasek Holdings
Central Provident Fund
Capital Research
3.34/2.00
42.4
SGD39.6B
USD29.9B
Price Performance
80
85
90
95
100
105
110
115
120
2.00
2.20
2.40
2.60
2.80
3.00
3.20
3.40
3.60
Feb-19 May-19 Aug-19 Nov-19 Feb-20 May-20 Aug-20 Nov-20
Singtel - (LHS, SGD) Singtel / Straits Times Index - (RHS, %)
-1M -3M -12M
Absolute (%) (2) 8 (27)
Relative to index (%) (1) (0) (21)
Source: FactSet
FYE Mar (SGD m) FY19A FY20A FY21E FY22E FY23E
Revenue 17,372 16,541 15,207 15,810 16,119
EBITDA 4,691 4,540 3,853 4,206 4,321
Core net profit 2,994 2,455 1,663 2,770 3,280
Core FDEPS (cts) 18.3 15.0 10.2 17.0 20.1
Core FDEPS growth(%) 0.0 (18.0) (32.3) 66.6 18.4
Net DPS (cts) 17.5 17.5 9.7 12.7 15.1
Core FD P/E (x) 16.5 16.9 23.6 14.2 12.0
P/BV (x) 1.8 1.5 1.5 1.5 1.5
Net dividend yield (%) 5.8 6.9 4.0 5.3 6.3
ROAE (%) 10.4 3.8 6.2 10.2 11.8
ROAA (%) 6.2 5.0 3.4 5.7 6.6
EV/EBITDA (x) 12.7 12.0 13.5 12.0 11.4
Net gearing (%) (incl perps) 34.1 49.1 48.3 41.9 35.2
Consensus net profit - - 2,023 2,615 2,845
MKE vs. Consensus (%) - - (17.8) 5.9 15.3

February 10, 2021 2
Singapore Telecommunications
Value Proposition
Telco conglomerate whose companies have significant, if
not leading, shares in their markets.
High-growth phase for wireless segment has passed.
Competition is generally on the rise in this segment in
most markets.
Enterprise and digital services to provide next legs of
growth while cash is harvested from wireless leadership to
support investments and capex.
Healthy balance sheet backs fixed DPS payout ratio of
75%. Proceeds from sale of non-core assets are partly
committed to exceptional payouts.
Singtel’s SOTP breakdown
Source: Maybank Kim Eng
Price Drivers
Historical share price trend
Source: Company, Maybank Kim Eng
1. Proposal for fourth mobile licence. Bharti’s profits
started to taper off.
2. TPG won licence in a general spectrum auction.
3. Proposal to increase effective stake in Bharti to 39.5%.
Share price continued to be pressured by competitive
environment.
4. Australia wireless pricing went through industry-wide
reflation.
5. Earnings marred by weakness in ARPU on the back of
lower usage of roaming and data given travel restriction
and work-from-home arrangements.
Financial Metrics
We forecast EBITDA to grow at 5.9% CAGR over FY21-23E
due to earnings recovery following Covid-19.
Pretax associate income could contribute to bottom line
by growing 27% over the same period, led by Bharti’s swing
to net profit from net loss.
We expect net debt to EBITDA, including associate
dividends, to remain healthy at 1.6x-2.2x in FY21-23E;
providing support to its fixed DPS commitment.
Free cash flow, dividends and capex
Source: Company, Maybank Kim Eng
Swing Factors
Upside
Strong growth in enterprise and digital.
Stronger–than-expected ARPU due to easing in price
competition in countries it operates in.
Faster-than-expected monetisation of 5G development.
Downside
Further wireless margin compression triggered by
competition in Singapore and / or Australia.
Worse-than-expected cannibalisation of wireless voice,
SMS and roaming by data.
Failure to monetise 5G development.
Valuat io n Valuat io n metho d Valuat io n Exch rate Valuat io n P er share % o f
(LC ) (SGD / LC ) (SGD m) (SGD ) to tal
SingTel DCF (6.9% WACC, 0% TG,
0.90 beta)
17,339 1.00 17,339 1.06 37%
Optus DCF (6.0% WACC, 0% TG,
0.71 beta)
9,808 1.00 9,808 0.60 21%
(Less) Consol Net Debt -13,173 -0.81
Sub T o tal 27,147 13,974 0.86 30%
Valuat io n metho d Valuat io n Exch rate Valuat io n P er share % o f
(LC ) (S$ / LC ) (SGD m) (SGD ) to tal
A sso ciates &
InvestmentsTelkomsel (Indonesia) 70% of M arket Cap listed
Telkom
64,558,849 10,807 5,974 0.37 13%
Bharti A irtel (India) DCF (8.9% WACC, 0.25%
TG,1.0 beta)
1,041,806 54.00 19,293 1.18 41%
AIS (Thailand) DCF (7.0% WACC, 2% TG,
1.0 beta)
158,640 22.98 6,903 0.42 15%
Globe (Philippines) M arket Cap 125,285 35.80 3,500 0.21 7%
Intouch (Thailand) SOTP (AIS TP and mkt cap
of THCOM TB)
44,374 22.98 1,931 0.12 4%
NetLink NBN Trust
(Singapore)
DDM (COE 6%, 0% LTG, 0.5
beta)
1,034 1.00 1,034 0.06 2%
SingPost (Singapore) M arket Cap 237 1.00 237 0.01 1%
Sub T o tal 38,635 2.38 83%
A sso ciates' value 15% discount -0.36
T o tal Equity Value 52,608 2.88 100%
60
80
100
120
140
160
2.00
2.50
3.00
3.50
4.00
4.50
Nov-15 Nov-16 Nov-17 Nov-18 Nov-19
Singtel - (LHS, SGD) Singtel / Straits Times Index - (RHS, %)
-1,000
0
1,000
2,000
3,000
4,000
5,000
Free cashflow, SGD'm Dividends, SGD'm
Capex, SGD'm
1
1 2 3 5
4
February 10, 2021 3
Singapore Telecommunications
Business Model & Industry Issues
Singtel is most exposed to cybersecurity and personal data leakage risks given its nature of business. There have been
minor lapses due to IT, process and human errors over the years, and Singtel was penalised for an immaterial sum.
Going forward, Singtel will continue to educate its staff and improve practices and processes to minimise data breaches.
As Singtel is in the business of connectivity, it is supporting digital inclusion through connecting communities and supporting
the disadvantaged.
Notably in FY20, the telco supported migrant workers with free remittance service and their WiFi and mobile data needs. It
also provided refurbished laptops and data SIMs to disadvantaged students for their home-based learning. In Australia,
Optus scaled up “Donate Your Data” to support disadvantaged students by offering them free mobile data access for online
learning.
Singtel displays no exceptional risks for a telco operator for ESG and is in line with peers in tackling ESG issues.
Material E issues
Achieved carbon emissions intensity reduction of 70% in
2020, well exceeding our 2030 target of 50%.
Over 84% of waste generated disposed via reuse, recycling
or incineration with energy recovered.
Only Southeast Asian company among a pioneer group of
28 global companies in July 2019 that committed to
keeping global temperature increase within 1.5°C and net
zero emissions by 2050.
Key G metrics and issues
Board consists of 10 directors, of which one is
executive officer (MD/CEO), the remaining are non-
executive & independent directors (including
Chairman). 30% are female directors.
The nomination, audit, investment and remuneration
committees are chaired by independent directors.
Key management/directors’ compensation accounted
for 9.4%/1.3% of total employee compensation in 2019.
There has been no corruption cases reported for the
past three years.
Cyber security and data leakage risks. Conducts its
businesses in strict adherence to data protection laws –
the Personal Data Protection Act in Singapore and the
Privacy Act and Telecommunications Act in Australia.
There have been minor lapses due to IT, process and
human errors. Singtel will continue to educate its staff
and improve practices and processes to minimise data
breaches.
Material S issues
28% of female employees in middle and top management.
Singtel was included in the 2020 Bloomberg Gender-
Equality Index and the Refinitiv Global Diversity &
Inclusion Index 2019 and named as one of the top 10
employers for Gender Diversity at The Leonie Awards
2019.
Total training investment of SGD21.9m and pledged
SGD45m to boost the digital skills of its workforce through
company-wide initiatives over three years.
Zero fatality rate across Singtel and Optus in FY20.
To promote digital inclusion, Optus has launched “Donate
Your Data” in Australia to help disadvantaged young
people bridge the digital divide.
Singtel also supported 1,000 vulnerable seniors under
CareLine 24-hour telephone befriending service with free
mobile phone services to promote digital inclusion and
well-being.
February 10, 2021 4
Singapore Telecommunications
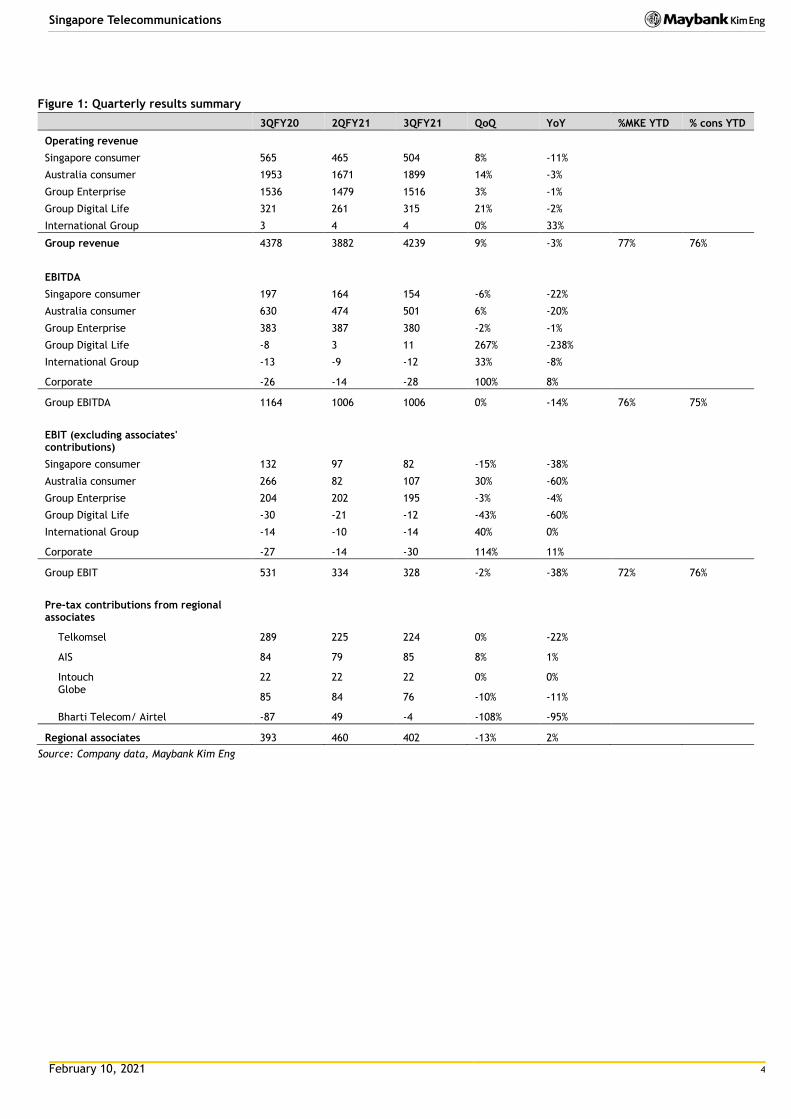
Figure 1: Quarterly results summary
3QFY20 2QFY21 3QFY21 QoQ YoY %MKE YTD % cons YTD
Operating revenue
Singapore consumer 565 465 504 8% -11%
Australia consumer 1953 1671 1899 14% -3%
Group Enterprise 1536 1479 1516 3% -1%
Group Digital Life 321 261 315 21% -2%
International Group 3 4 4 0% 33%
Group revenue 4378 3882 4239 9% -3% 77% 76%
EBITDA
Singapore consumer 197 164 154 -6% -22%
Australia consumer 630 474 501 6% -20%
Group Enterprise 383 387 380 -2% -1%
Group Digital Life -8 3 11 267% -238%
International Group -13 -9 -12 33% -8%
Corporate -26 -14 -28 100% 8%
Group EBITDA 1164 1006 1006 0% -14% 76% 75%
EBIT (excluding associates' contributions)
Singapore consumer 132 97 82 -15% -38%
Australia consumer 266 82 107 30% -60%
Group Enterprise 204 202 195 -3% -4%
Group Digital Life -30 -21 -12 -43% -60%
International Group -14 -10 -14 40% 0%
Corporate -27 -14 -30 114% 11%
Group EBIT 531 334 328 -2% -38% 72% 76%
Pre-tax contributions from regional associates
Telkomsel 289 225 224 0% -22%
AIS 84 79 85 8% 1%
Intouch 22 22 22 0% 0% Globe
85 84 76 -10% -11%
Bharti Telecom/ Airtel -87 49 -4 -108% -95%
Regional associates 393 460 402 -13% 2%
Source: Company data, Maybank Kim Eng
February 10, 2021 5
Singapore Telecommunications
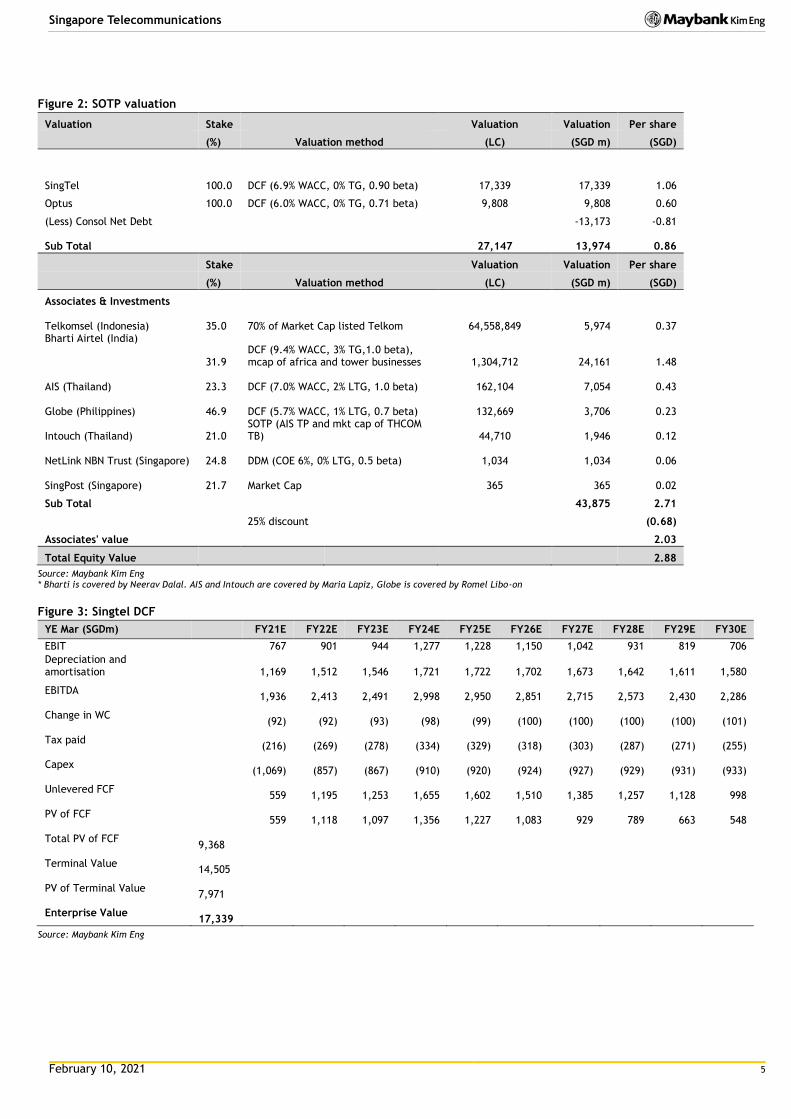
Figure 2: SOTP valuation
Valuation Stake Valuation Valuation Per share
(%) Valuation method (LC) (SGD m) (SGD)
SingTel 100.0 DCF (6.9% WACC, 0% TG, 0.90 beta) 17,339 17,339 1.06
Optus 100.0 DCF (6.0% WACC, 0% TG, 0.71 beta) 9,808 9,808 0.60
(Less) Consol Net Debt
-13,173 -0.81
Sub Total 27,147
13,974 0.86
Stake Valuation Valuation Per share
(%) Valuation method (LC) (SGD m) (SGD)
Associates & Investments
Telkomsel (Indonesia) 35.0 70% of Market Cap listed Telkom 64,558,849
5,974 0.37
Bharti Airtel (India) 31.9
DCF (9.4% WACC, 3% TG,1.0 beta), mcap of africa and tower businesses 1,304,712 24,161 1.48
AIS (Thailand) 23.3 DCF (7.0% WACC, 2% LTG, 1.0 beta) 162,104
7,054 0.43
Globe (Philippines) 46.9 DCF (5.7% WACC, 1% LTG, 0.7 beta) 132,669
3,706 0.23
Intouch (Thailand) 21.0
SOTP (AIS TP and mkt cap of THCOM TB) 44,710
1,946 0.12
NetLink NBN Trust (Singapore) 24.8 DDM (COE 6%, 0% LTG, 0.5 beta) 1,034
1,034 0.06
SingPost (Singapore) 21.7 Market Cap 365
365 0.02
Sub Total 43,875 2.71
25% discount (0.68)
Associates' value 2.03
Total Equity Value 2.88
Source: Maybank Kim Eng * Bharti is covered by Neerav Dalal. AIS and Intouch are covered by Maria Lapiz, Globe is covered by Romel Libo-on
Figure 3: Singtel DCF
YE Mar (SGDm) FY21E FY22E FY23E FY24E FY25E FY26E FY27E FY28E FY29E FY30E
EBIT 767 901 944 1,277 1,228 1,150 1,042 931 819 706
Depreciation and amortisation
1,169
1,512
1,546
1,721
1,722
1,702
1,673
1,642
1,611
1,580
EBITDA
1,936
2,413
2,491
2,998
2,950
2,851
2,715
2,573
2,430
2,286
Change in WC
(92)
(92)
(93)
(98)
(99)
(100)
(100)
(100)
(100)
(101)
Tax paid
(216)
(269)
(278)
(334)
(329)
(318)
(303)
(287)
(271)
(255)
Capex
(1,069)
(857)
(867)
(910)
(920)
(924)
(927)
(929)
(931)
(933)
Unlevered FCF
559
1,195
1,253
1,655
1,602
1,510
1,385
1,257
1,128
998
PV of FCF
559
1,118
1,097
1,356
1,227
1,083
929
789
663
548
Total PV of FCF 9,368
Terminal Value 14,505
PV of Terminal Value 7,971
Enterprise Value 17,339
Source: Maybank Kim Eng

February 10, 2021 6
Singapore Telecommunications
Figure 4: Optus DCF
YE Mar (SGDm) FY21E FY22E FY23E FY24E FY25E FY26E FY27E FY28E FY29E FY30E
EBIT 511 601 629 852 819 767 694 620 546 471 Depreciation and amortisation
1,406
1,192
1,201
1,110
1,142
1,193
1,249
1,307
1,366
1,426
EBITDA
1,917
1,793
1,831
1,961
1,961
1,959
1,943
1,928
1,912
1,897
Change in WC
243
393
381
455
374
368
360
(3,102)
84
86
Tax paid
(296)
(277)
(282)
(303)
(303)
(302)
(300)
(297)
(295)
(293)
Capex
(1,131)
(1,343)
(1,333)
(1,290)
(1,404)
(1,146)
(1,139)
(1,133)
(955)
(949)
Unlevered FCF
734
566
596
824
629
879
864
(2,605)
746
741
PV of FCF
734
534
531
692
498
657
609
(1,733)
468
439
Total PV of FCF 3,429
Terminal Value 10,773
PV of Terminal Value 6,379
Enterprise Value 9,808
Less: net debt
Equity Value 9,808
Equity Value Per Share 0.60
Source: Maybank Kim Eng
Figure 5: Singapore DCF parameters
Parameter
Risk Free Rate 2.5%
Market risk premium 6.5%
Beta (x) 0.90
Cost of Equity (%) 8.4%
Cost of Debt (%) 3.2%
Gearing (x) 0.40
WACC (%) 6.9%
Terminal Growth (%) 0.0%
Source: Maybank Kim Eng
Figure 6: Optus DCF parameters
Parameter
Risk Free Rate 2.5%
Market risk premium 6.5%
Beta (x) 0.71
Cost of Equity (%) 7.1%
Cost of Debt (%) 3.2%
Gearing (x) 0.40
WACC (%) 6.0%
Terminal Growth (%) 0.0%
Source: Maybank Kim Eng
February 10, 2021 7
Singapore Telecommunications
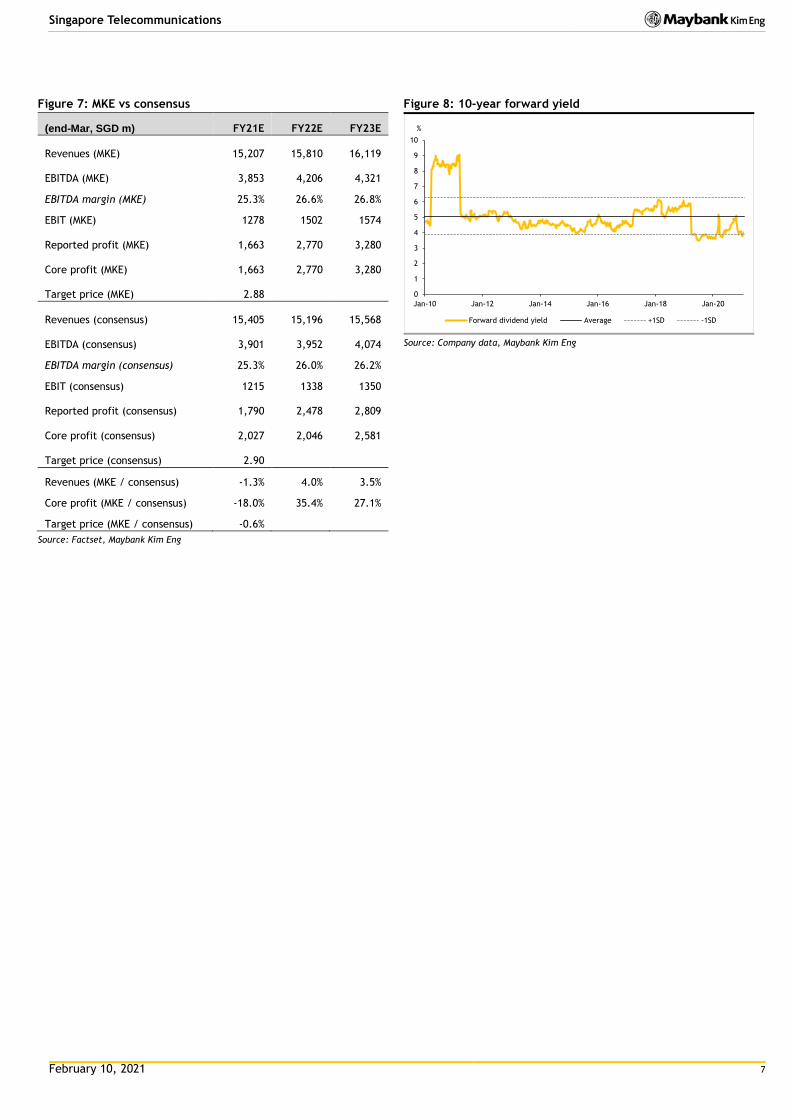
Figure 7: MKE vs consensus
(end-Mar, SGD m) FY21E FY22E FY23E
Revenues (MKE)
15,207
15,810
16,119
EBITDA (MKE)
3,853
4,206
4,321
EBITDA margin (MKE) 25.3% 26.6% 26.8%
EBIT (MKE) 1278 1502 1574
Reported profit (MKE)
1,663
2,770
3,280
Core profit (MKE)
1,663
2,770
3,280
Target price (MKE)
2.88
Revenues (consensus)
15,405
15,196
15,568
EBITDA (consensus)
3,901
3,952
4,074
EBITDA margin (consensus) 25.3% 26.0% 26.2%
EBIT (consensus) 1215 1338 1350
Reported profit (consensus)
1,790
2,478
2,809
Core profit (consensus)
2,027
2,046
2,581
Target price (consensus)
2.90
Revenues (MKE / consensus) -1.3% 4.0% 3.5%
Core profit (MKE / consensus) -18.0% 35.4% 27.1%
Target price (MKE / consensus) -0.6%
Source: Factset, Maybank Kim Eng
Figure 8: 10-year forward yield
Source: Company data, Maybank Kim Eng
0
1
2
3
4
5
6
7
8
9
10
Jan-10 Jan-12 Jan-14 Jan-16 Jan-18 Jan-20
%
Forward dividend yield Average +1SD -1SD
February 10, 2021 8
Singapore Telecommunications
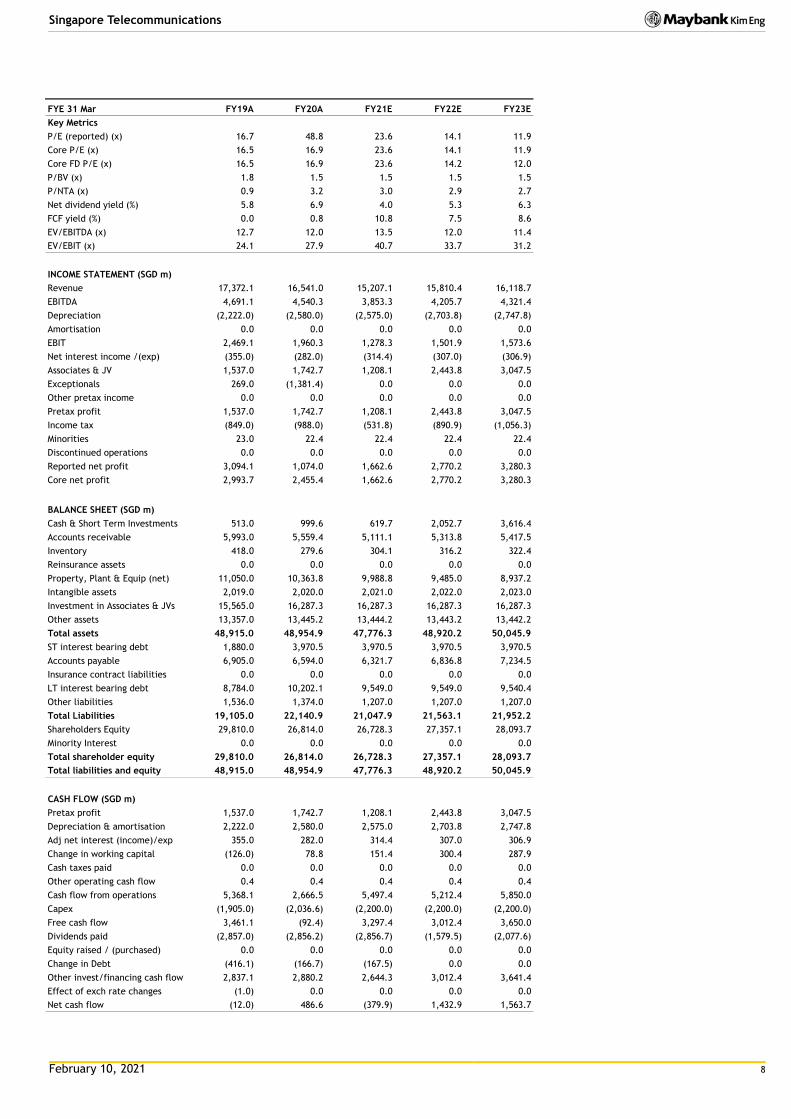
FYE 31 Mar FY19A FY20A FY21E FY22E FY23E
Key Metrics
P/E (reported) (x) 16.7 48.8 23.6 14.1 11.9
Core P/E (x) 16.5 16.9 23.6 14.1 11.9
Core FD P/E (x) 16.5 16.9 23.6 14.2 12.0
P/BV (x) 1.8 1.5 1.5 1.5 1.5
P/NTA (x) 0.9 3.2 3.0 2.9 2.7
Net dividend yield (%) 5.8 6.9 4.0 5.3 6.3
FCF yield (%) 0.0 0.8 10.8 7.5 8.6
EV/EBITDA (x) 12.7 12.0 13.5 12.0 11.4
EV/EBIT (x) 24.1 27.9 40.7 33.7 31.2
INCOME STATEMENT (SGD m)
Revenue 17,372.1 16,541.0 15,207.1 15,810.4 16,118.7
EBITDA 4,691.1 4,540.3 3,853.3 4,205.7 4,321.4
Depreciation (2,222.0) (2,580.0) (2,575.0) (2,703.8) (2,747.8)
Amortisation 0.0 0.0 0.0 0.0 0.0
EBIT 2,469.1 1,960.3 1,278.3 1,501.9 1,573.6
Net interest income /(exp) (355.0) (282.0) (314.4) (307.0) (306.9)
Associates & JV 1,537.0 1,742.7 1,208.1 2,443.8 3,047.5
Exceptionals 269.0 (1,381.4) 0.0 0.0 0.0
Other pretax income 0.0 0.0 0.0 0.0 0.0
Pretax profit 1,537.0 1,742.7 1,208.1 2,443.8 3,047.5
Income tax (849.0) (988.0) (531.8) (890.9) (1,056.3)
Minorities 23.0 22.4 22.4 22.4 22.4
Discontinued operations 0.0 0.0 0.0 0.0 0.0
Reported net profit 3,094.1 1,074.0 1,662.6 2,770.2 3,280.3
Core net profit 2,993.7 2,455.4 1,662.6 2,770.2 3,280.3
BALANCE SHEET (SGD m)
Cash & Short Term Investments 513.0 999.6 619.7 2,052.7 3,616.4
Accounts receivable 5,993.0 5,559.4 5,111.1 5,313.8 5,417.5
Inventory 418.0 279.6 304.1 316.2 322.4
Reinsurance assets 0.0 0.0 0.0 0.0 0.0
Property, Plant & Equip (net) 11,050.0 10,363.8 9,988.8 9,485.0 8,937.2
Intangible assets 2,019.0 2,020.0 2,021.0 2,022.0 2,023.0
Investment in Associates & JVs 15,565.0 16,287.3 16,287.3 16,287.3 16,287.3
Other assets 13,357.0 13,445.2 13,444.2 13,443.2 13,442.2
Total assets 48,915.0 48,954.9 47,776.3 48,920.2 50,045.9
ST interest bearing debt 1,880.0 3,970.5 3,970.5 3,970.5 3,970.5
Accounts payable 6,905.0 6,594.0 6,321.7 6,836.8 7,234.5
Insurance contract liabilities 0.0 0.0 0.0 0.0 0.0
LT interest bearing debt 8,784.0 10,202.1 9,549.0 9,549.0 9,540.4
Other liabilities 1,536.0 1,374.0 1,207.0 1,207.0 1,207.0
Total Liabilities 19,105.0 22,140.9 21,047.9 21,563.1 21,952.2
Shareholders Equity 29,810.0 26,814.0 26,728.3 27,357.1 28,093.7
Minority Interest 0.0 0.0 0.0 0.0 0.0
Total shareholder equity 29,810.0 26,814.0 26,728.3 27,357.1 28,093.7
Total liabilities and equity 48,915.0 48,954.9 47,776.3 48,920.2 50,045.9
CASH FLOW (SGD m)
Pretax profit 1,537.0 1,742.7 1,208.1 2,443.8 3,047.5
Depreciation & amortisation 2,222.0 2,580.0 2,575.0 2,703.8 2,747.8
Adj net interest (income)/exp 355.0 282.0 314.4 307.0 306.9
Change in working capital (126.0) 78.8 151.4 300.4 287.9
Cash taxes paid 0.0 0.0 0.0 0.0 0.0
Other operating cash flow 0.4 0.4 0.4 0.4 0.4
Cash flow from operations 5,368.1 2,666.5 5,497.4 5,212.4 5,850.0
Capex (1,905.0) (2,036.6) (2,200.0) (2,200.0) (2,200.0)
Free cash flow 3,461.1 (92.4) 3,297.4 3,012.4 3,650.0
Dividends paid (2,857.0) (2,856.2) (2,856.7) (1,579.5) (2,077.6)
Equity raised / (purchased) 0.0 0.0 0.0 0.0 0.0
Change in Debt (416.1) (166.7) (167.5) 0.0 0.0
Other invest/financing cash flow 2,837.1 2,880.2 2,644.3 3,012.4 3,641.4
Effect of exch rate changes (1.0) 0.0 0.0 0.0 0.0
Net cash flow (12.0) 486.6 (379.9) 1,432.9 1,563.7
February 10, 2021 9
Singapore Telecommunications
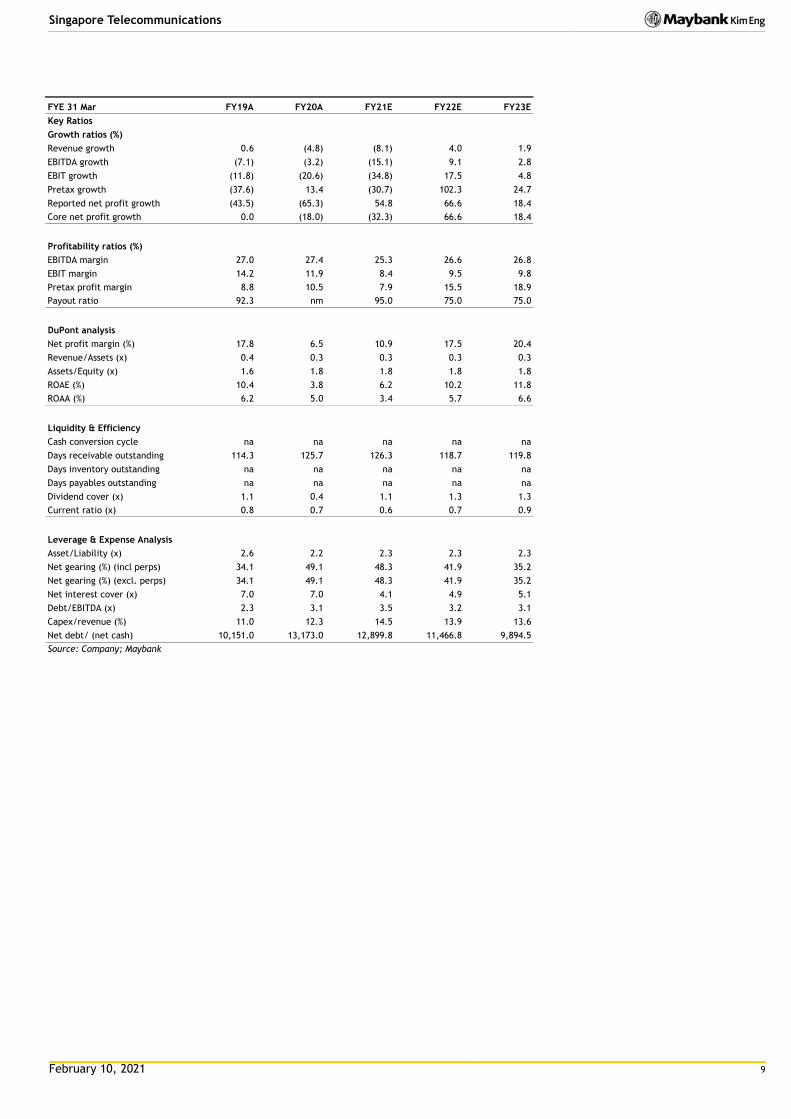
FYE 31 Mar FY19A FY20A FY21E FY22E FY23E
Key Ratios
Growth ratios (%)
Revenue growth 0.6 (4.8) (8.1) 4.0 1.9
EBITDA growth (7.1) (3.2) (15.1) 9.1 2.8
EBIT growth (11.8) (20.6) (34.8) 17.5 4.8
Pretax growth (37.6) 13.4 (30.7) 102.3 24.7
Reported net profit growth (43.5) (65.3) 54.8 66.6 18.4
Core net profit growth 0.0 (18.0) (32.3) 66.6 18.4
Profitability ratios (%)
EBITDA margin 27.0 27.4 25.3 26.6 26.8
EBIT margin 14.2 11.9 8.4 9.5 9.8
Pretax profit margin 8.8 10.5 7.9 15.5 18.9
Payout ratio 92.3 nm 95.0 75.0 75.0
DuPont analysis
Net profit margin (%) 17.8 6.5 10.9 17.5 20.4
Revenue/Assets (x) 0.4 0.3 0.3 0.3 0.3
Assets/Equity (x) 1.6 1.8 1.8 1.8 1.8
ROAE (%) 10.4 3.8 6.2 10.2 11.8
ROAA (%) 6.2 5.0 3.4 5.7 6.6
Liquidity & Efficiency
Cash conversion cycle na na na na na
Days receivable outstanding 114.3 125.7 126.3 118.7 119.8
Days inventory outstanding na na na na na
Days payables outstanding na na na na na
Dividend cover (x) 1.1 0.4 1.1 1.3 1.3
Current ratio (x) 0.8 0.7 0.6 0.7 0.9
Leverage & Expense Analysis
Asset/Liability (x) 2.6 2.2 2.3 2.3 2.3
Net gearing (%) (incl perps) 34.1 49.1 48.3 41.9 35.2
Net gearing (%) (excl. perps) 34.1 49.1 48.3 41.9 35.2
Net interest cover (x) 7.0 7.0 4.1 4.9 5.1
Debt/EBITDA (x) 2.3 3.1 3.5 3.2 3.1
Capex/revenue (%) 11.0 12.3 14.5 13.9 13.6
Net debt/ (net cash) 10,151.0 13,173.0 12,899.8 11,466.8 9,894.5
Source: Company; Maybank
February 10, 2021 10
Singapore Telecommunications
Research Offices
ECONOMICS
Suhaimi ILIAS Chief Economist Malaysia | Philippines | Global (603) 2297 8682 [email protected]
CHUA Hak Bin Regional Thematic Macroeconomist (65) 6231 5830 [email protected]
LEE Ju Ye Singapore | Thailand | Indonesia (65) 6231 5844 [email protected]
Linda LIU Singapore | Vietnam | Cambodia | Myanmar | Laos (65) 6231 5847 [email protected]
Dr Zamros DZULKAFLI (603) 2082 6818 [email protected]
Ramesh LANKANATHAN (603) 2297 8685 [email protected]
William POH (603) 2297 8683 [email protected]
FX
Saktiandi SUPAAT Head of FX Research (65) 6320 1379 [email protected]
Christopher WONG (65) 6320 1347 [email protected]
TAN Yanxi (65) 6320 1378 [email protected]
Fiona LIM (65) 6320 1374 [email protected]
STRATEGY
Anand PATHMAKANTHAN
ASEAN (603) 2297 8783 [email protected]
FIXED INCOME
Winson PHOON, ACA (65) 6812 8807 [email protected]
SE THO Mun Yi (603) 2074 7606 [email protected]
REGIONAL EQUITIES
Anand PATHMAKANTHAN Head of Regional Equity Research (603) 2297 8783 [email protected]
WONG Chew Hann, CA Head of ASEAN Equity Research (603) 2297 8686 [email protected]
ONG Seng Yeow Research, Technology & Innovation (65) 6231 5839 [email protected]
MALAYSIA
Anand PATHMAKANTHAN Head of Research (603) 2297 8783 [email protected] • Strategy
Desmond CH’NG, BFP, FCA (603) 2297 8680 [email protected] • Banking & Finance
LIAW Thong Jung (603) 2297 8688 [email protected] • Oil & Gas Services- Regional • Automotive
ONG Chee Ting, CA (603) 2297 8678 [email protected] • Plantations - Regional
YIN Shao Yang, CPA (603) 2297 8916 [email protected] • Gaming – Regional • Media • Aviation
TAN Chi Wei, CFA (603) 2297 8690 [email protected] • Power • Telcos
WONG Wei Sum, CFA (603) 2297 8679 [email protected] • Property
LEE Yen Ling (603) 2297 8691 [email protected] • Glove • Ports • Shipping • Healthcare • Petrochemicals
Kevin WONG (603) 2082 6824 [email protected] • REITs • Technology
Jade TAM (603) 2297 8687 [email protected] • Consumer Staples & Discretionary
Fahmi FARID (603) 2297 8676 [email protected] • Software
TEE Sze Chiah Head of Retail Research (603) 2082 6858 [email protected]
Nik Ihsan RAJA ABDULLAH, MSTA, CFTe (603) 2297 8694 [email protected] • Chartist
Amirah AZMI (603) 2082 8769 [email protected] • Retail Research
SINGAPORE
Thilan WICKRAMASINGHE Head of Research (65) 6231 5840 [email protected] • Banking & Finance - Regional • Consumer
CHUA Su Tye (65) 6231 5842 [email protected] • REITs - Regional
LAI Gene Lih, CFA (65) 6231 5832 [email protected] • Technology • Healthcare
Kareen CHAN (65) 6231 5926 [email protected] • Transport • Telcos
TAN Chin Poh Head of Retail Research (65) 6231 5928 [email protected]
Eric ONG (65) 6231 5924 [email protected] • Retail Research
Matthew SHIM (65) 6231 5929 [email protected] • Retail Research
INDIA
Jigar SHAH Head of Research (91) 22 4223 2632 [email protected] • Strategy • Oil & Gas • Automobile • Cement
Neerav DALAL (91) 22 4223 2606 [email protected] • Software Technology • Telcos
Kshitiz PRASAD (91) 22 4223 2607 [email protected] • Banks
Vikram RAMALINGAM (91) 22 4223 2607 [email protected] • Automobile • Media
INDONESIA
Isnaputra ISKANDAR Head of Research (62) 21 8066 8680 [email protected] • Strategy • Metals & Mining • Cement • Autos • Consumer • Utility
Rahmi MARINA (62) 21 8066 8689 [email protected] • Banking & Finance
Aurellia SETIABUDI (62) 21 8066 8691 [email protected] • Property
Willy GOUTAMA (62) 21 8066 8500 [email protected]
• Consumer
PHILIPPINES
Jacqui De JESUS Head of Research (63) 2 8849 8844 [email protected] • Strategy • Conglomerates
Romel LIBO-ON (63) 2 8849 8844 [email protected] • Property • Telcos
Fredrick De GUZMAN (63) 2 8849 8847 [email protected] • Consumer
Bernadine B BAUTISTA (63) 2 8849 8847 [email protected] • Utilities
Rachelleen RODRIGUEZ, CFA (63) 2 8849 8843 [email protected] • Banking & Finance
THAILAND
Maria LAPIZ Head of Institutional Research Dir (66) 2257 0250 | (66) 2658 6300 ext 1399 [email protected] • Strategy • Consumer • Materials • Services
Jesada TECHAHUSDIN, CFA (66) 2658 6300 ext 1395 [email protected] • Banking & Finance
Kaushal LADHA, CFA (66) 2658 6300 ext 1392 [email protected] • Oil & Gas – Regional • Petrochemicals - Regional • Utilities
Vanida GEISLER, CPA (66) 2658 6300 ext 1394 [email protected] • Property • REITs
Yuwanee PROMMAPORN (66) 2658 6300 ext 1393 Yuwanee.P @maybank-ke.co.th • Services • Healthcare
Ekachai TARAPORNTIP Head of Retail Research (66) 2658 5000 ext 1530 [email protected]
Surachai PRAMUALCHAROENKIT (66) 2658 5000 ext 1470 [email protected] • Auto • Conmat • Contractor • Steel
Suttatip PEERASUB (66) 2658 5000 ext 1430 [email protected] • Food & Beverage • Commerce
Jaroonpan WATTANAWONG (66) 2658 5000 ext 1404 [email protected] • Transportation • Small cap
Thanatphat SUKSRICHAVALIT (66) 2658 5000 ext 1401 [email protected] • Media • Electronics
Wijit ARAYAPISIT (66) 2658 5000 ext 1450 [email protected] • Strategist
Theerasate PROMPONG (66) 2658 5000 ext 1400 [email protected] • Equity Portfolio Strategist
Apiwat TAVESIRIVATE (66) 2658 5000 ext 1310 [email protected] • Chartist and TFEX
VIETNAM
Quan Trong Thanh
(84 28) 44 555 888 ext 8184 [email protected] • Banks
Hoang Huy, CFA (84 28) 44 555 888 ext 8181 [email protected] • Strategy
Le Nguyen Nhat Chuyen (84 28) 44 555 888 ext 8082 [email protected] • Oil & Gas
Nguyen Thi Sony Tra Mi (84 28) 44 555 888 ext 8084 [email protected] • Consumer
Tyler Manh Dung Nguyen (84 28) 44 555 888 ext 8180 [email protected] • Utilities • Property
Nguyen Thi Ngan Tuyen Head of Retail Research (84 28) 44 555 888 ext 8081 [email protected] • Food & Beverage • Oil & Gas • Banking
Nguyen Thanh Lam (84 28) 44 555 888 ext 8086 [email protected] • Technical Analysis
February 10, 2021 11
Singapore Telecommunications
APPENDIX I: TERMS FOR PROVISION OF REPORT, DISCLAIMERS AND DISCLOSURES
DISCLAIMERS This research report is prepared for general circulation and for information purposes only and under no circumstances should it be considered or intended as an offer to sell or a solicitation of an offer to buy the securities referred to herein. Investors should note that values of such securities, if any, may fluctuate and that each secu rity’s price or value may rise or fall. Opinions or recommendations contained herein are in form of technical ratings and fundamental ratings. Technical ratings may differ from fundamental ratings as technical valuations apply different methodologies and are purely based on price and volume-related information extracted from the relevant jurisdiction’s stock exchange in the equity analysis. Accordingly, investors’ returns may be less than the original sum invested. Past performance is not necessarily a guide to future performance. This report is not intended to provide personal investment advice and does not take into account the specific investment objectives, the financial situation and the particular needs of persons who may receive or read this report. I nvestors should therefore seek financial, legal and other advice regarding the appropriateness of investing in any securities or the investment strategies discussed or recommended in this report.
The information contained herein has been obtained from sources believed to be reliable but such sources have not been independently verified by Maybank Investment Bank Berhad, its subsidiary and affiliates (collectively, “MKE”) and consequently no representation is made as to the accuracy or completeness of this report by MKE and it should not be relied upon as such. Accordingly, MKE and its officers, directors, associates, connected parties and/or employees (collectively, “Representatives”) shall not be liable for any direct, indirect or consequential losses or damages that may arise from the use or reliance of this report. Any information, opinions or recommendations contained herein are subject to change at any time, without prior notice.
This report may contain forward looking statements which are often but not always identified by the use of words such as “ant icipate”, “believe”, “estimate”, “intend”, “plan”, “expect”, “forecast”, “predict” and “project” and statements that an event or result “may”, “will”, “can”, “should”, “could” or “might” occur or be achieved and other similar expressions. Such forward looking statements are based on assumptions made and information currently available to us and are subject to certain risks and uncertainties that could cause the actual results to differ materially from those expressed in any forward looking statements. Readers are cautioned not to place undue relevance on these forward-looking statements. MKE expressly disclaims any obligation to update or revise any such forward looking statements to reflect new information, events or circumstances af ter the date of this publication or to reflect the occurrence of unanticipated events.
MKE and its officers, directors and employees, including persons involved in the preparation or issuance of this report, may, to the extent permitted by law, from time to time participate or invest in financing transactions with the issuer(s) of the securities mentioned in this report, perform services for or solicit business from such issuers, and/or have a position or holding, or other material interest, or effect transactions, in such securities or options thereon, or other investments related thereto. In addition, it may make markets in the securities mentioned in the material presented in this report. One or more directors, officers and/or employees of MKE may be a director of the issue rs of the securities mentioned in this report to the extent permitted by law.
This report is prepared for the use of MKE’s clients and may not be reproduced, altered in any way, transmitted to, copied or distr ibuted to any other party in whole or in part in any form or manner without the prior express written consent of MKE and MKE and its Representatives accepts no liability whatsoever for the actions of third parties in this respect.
This report is not directed to or intended for distribution to or use by any person or entity who is a citizen or resident of or located in any locality, state, country or other jurisdiction where such distribution, publication, availability or use would be contrary to law or regulation. This report is for distribution only under such circumstances as may be permitted by applicable law. The securities described herein may not be eligible for sale in all jurisdictions or to certain categories of investors. Without prejudice to the f oregoing, the reader is to note that additional disclaimers, warnings or qualifications may apply based on geographical location of the person or entity receiving this report.
Malaysia Opinions or recommendations contained herein are in the form of technical ratings and fundamental ratings. Technical ratings may differ from fundamental ratings as technical valuations apply different methodologies and are purely based on price and volume-related information extracted from Bursa Malaysia Securities Berhad in the equity analysis.
Singapore This report has been produced as of the date hereof and the information herein may be subject to change. Maybank Kim Eng Research Pte. Ltd. (“Maybank KERPL”) in Singapore has no obligation to update such information for any recipient. For distribution in Singapore, recipients of this report are to contact Maybank KERPL in Singapore in respect of any matters arising from, or in connection with, this report. If the recipient of this report is not an accredited investor, expert investor or i nstitutional investor (as defined under Section 4A of the Singapore Securities and Futures Act), Maybank KERPL shall be legally liable for the contents of this report, with such liability being limited to the extent (if any) as permitted by law.
Thailand Except as specifically permitted, no part of this presentation may be reproduced or distributed in any manner without the prior written permission of Maybank Kim Eng Securities (Thailand) Public Company Limited. Maybank Kim Eng Securities (Thailand) Public Company Limited (“MBKET”) accepts no liability whatsoeve r for the actions of third parties in this respect.
Due to different characteristics, objectives and strategies of institutional and retail investors, the research products of MBKET Inst itutional and Retail Research departments may differ in either recommendation or target price, or both. MBKET reserves the rights to disseminate MBKET Retail Research reports to institutional investors who have requested to receive it. If you are an authorised recipient, you hereby tacitly acknowledge that the research reports from MBKET Retail Research are first pr oduced in Thai and there is a time lag in the release of the translated English version.
The disclosure of the survey result of the Thai Institute of Directors Association (“IOD”) regarding corporate governance is made pursuant to the policy of the Office of the Securities and Exchange Commission. The survey of the IOD is based on the information of a company listed on the Stock Exchange of Thailand and the market for Alternative Investment disclosed to the public and able to be accessed by a general public investor. The result, therefore, is from the perspective of a third party. It is not an evaluation of operation and is not based on inside information. The survey result is as of the date appearing in the Corporate Governance Report of Thai Listed Companies. As a result, the survey may be changed after that date. MBKET does not confirm nor certify the accuracy of such survey result.
The disclosure of the Anti-Corruption Progress Indicators of a listed company on the Stock Exchange of Thailand, which is assessed by Thaipat Institute, is made in order to comply with the policy and sustainable development plan for the listed companies of the Office of the Securities and Exchange Commission. Tha ipat Institute made this assessment based on the information received from the listed company, as stipulated in the form for the assessment of Anti-corruption which refers to the Annual Registration Statement (Form 56-1), Annual Report (Form 56-2), or other relevant documents or reports of such listed company. The assessment result is therefore made from the perspective of Thaipat Institute that is a third party. It is not an assessment of operation and is not based on any inside information. Since this assessment is only the assessment result as of the date appearing in the assessment result, it may be changed after that date or when there is any change to the relevant information. Nevertheless, MBKET does not confirm, verify, or certify the accuracy and completeness of the assessment result.
US This third-party research report is distributed in the United States (“US”) to Major US Institutional Investors (as defined in Rule 15a-6 under the Securities Exchange Act of 1934, as amended) only by Maybank Kim Eng Securities USA Inc (“Maybank KESUSA”), a broker-dealer registered in the US (registered under Section 15 of the Securities Exchange Act of 1934, as amended). All responsibility for the distribution of this report by Maybank KESUSA in the US shall be borne by Maybank KESUSA. This report is not directed at you if MKE is prohibited or restricted by any legislation or regulation in any jurisdiction from making it available to you. You should satisfy yourself before reading it that Maybank KESUSA is permitted to provide research material concerning investments to you under relevant legislation and regulations. All U.S. persons receiving and/or accessing this report and wishing to effect transactions in any security mentioned within must do so with: Maybank Kim Eng Securities USA Inc. 400 Park Avenue, 11th Floor, New York, New York 10022, 1-(212) 688-8886 and not with, the issuer of this report.
February 10, 2021 12
Singapore Telecommunications
Disclosure of Interest
Malaysia: MKE and its Representatives may from time to time have positions or be materially interested in the securities referred to he rein and may further act as market maker or may have assumed an underwriting commitment or deal with such securities and may also perform or seek to perform investment banking services, advisory and other services for or relating to those companies. Singapore: As of 10 February 2021, Maybank KERPL and the covering analyst do not have any interest in any companies recommended in this research report. Thailand: MBKET may have a business relationship with or may possibly be an issuer of derivative warrants on the securities /companies mentioned in the research report. Therefore, Investors should exercise their own judgment before making any investment decisions. MBKET, its associates, directors, connected parties and/or employees may from time to time have interests and/or underwriting commitments in the securities mentioned in this report. Hong Kong: As of 10 February 2021, KESHK and the authoring analyst do not have any interest in any companies recommended in this research report. India: As of 10 February 2021, and at the end of the month immediately preceding the date of publication of the research report, KESI, authoring analyst or their associate / relative does not hold any financial interest or any actual or beneficial ownership in any shares or having any conflict of interest in the subject companies except as otherwise disclosed in the research report.
In the past twelve months KESI and authoring analyst or their associate did not receive any compensation or other benefits from the subject companies or third party in connection with the research report on any account what so ever except as otherwise disclosed in the research report.
MKE may have, within the last three years, served as manager or co-manager of a public offering of securities for, or currently may make a primary market in issues of, any or all of the entities mentioned in this report or may be providing, or have provided within the previous 12 months, significant advice or investment services in relation to the inves tment concerned or a related investment and may receive compensation for the services provided from the companies covered in this report.
OTHERS
Analyst Certification of Independence
The views expressed in this research report accurately reflect the analyst’s personal views about any and all of the subject securities or issuers; and no part of the research analyst’s compensation was, is or will be, directly or indirectly, related to the specific recommendations or views expressed in the report.
Reminder
Structured securities are complex instruments, typically involve a high degree of risk and are intended for sale only to soph isticated investors who are capable of understanding and assuming the risks involved. The market value of any structured security may be affected by changes in economic, financial and political factors (including, but not limited to, spot and forward interest and exchange rates), time to maturity, market conditions and volatility and the credit quality of any issuer or reference issuer. Any investor interested in purchasing a structured product should conduct its own analysis of the product and consult with its own professional advisers as to the risks involved in making such a purchase.
No part of this material may be copied, photocopied or duplicated in any form by any means or redistributed without the prior consent of MKE.
UK This document is being distributed by Maybank Kim Eng Securities (London) Ltd (“Maybank KESL”) which is authorized and regula ted, by the Financial Conduct Authority and is for Informational Purposes only. This document is not intended for distribution to anyone defined as a Retail Client under the Financial Services and Markets Act 2000 within the UK. Any inclusion of a third party link is for the recipients convenience only, and that the firm does not take any responsibility for its comments or accuracy, and that access to such links is at the individuals own risk. Nothing in this report should be considered as constituting legal, accounting or tax advice, and that f or accurate guidance recipients should consult with their own independent tax advisers.
DISCLOSURES
Legal Entities Disclosures Malaysia: This report is issued and distributed in Malaysia by Maybank Investment Bank Berhad (15938- H) which is a Participating Organization of Bursa Malaysia Berhad and a holder of Capital Markets and Services License issued by the Securities Commission in Malaysia. Singapore: This report is distributed in Singapore by Maybank KERPL (Co. Reg No 198700034E) which is regulated by the Monetary Authority of Singapore. Indonesia: PT Maybank Kim Eng Securities (“PTMKES”) (Reg. No. KEP-251/PM/1992) is a member of the Indonesia Stock Exchange and is regulated by the Financial Services Authority (Indonesia). Thailand: MBKET (Reg. No.0107545000314) is a member of the Stock Exchange of Thailand and is regulated by the Ministry of Finance and the Securities and Exchange Commission. Philippines: Maybank ATRKES (Reg. No.01-2004-00019) is a member of the Philippines Stock Exchange and is regulated by the Securities and Exchange Commission. Vietnam: Maybank Kim Eng Securities Limited (License Number: 117/GP-UBCK) is licensed under the State Securities Commission of Vietnam. Hong Kong: KESHK (Central Entity No AAD284) is regulated by the Securities and Futures Commission. India: Kim Eng Securities India Private Limited (“KESI”) is a participant of the National Stock Exchange of India Limited and the Bombay Stock Exchange and is regulated by Securities and Exchange Board of India (“SEBI”) (Reg. No. INZ000010538). KESI is also registered with SEBI as Category 1 Merchant Banker (Reg. No. INM 000011708) and as Research Analyst (Reg No: INH000000057) US: Maybank KESUSA is a member of/ and is authorized and regulated by the FINRA – Broker ID 27861. UK: Maybank KESL (Reg No 2377538) is authorized and regulated by the Financial Conduct Authority.
February 10, 2021 13
Singapore Telecommunications
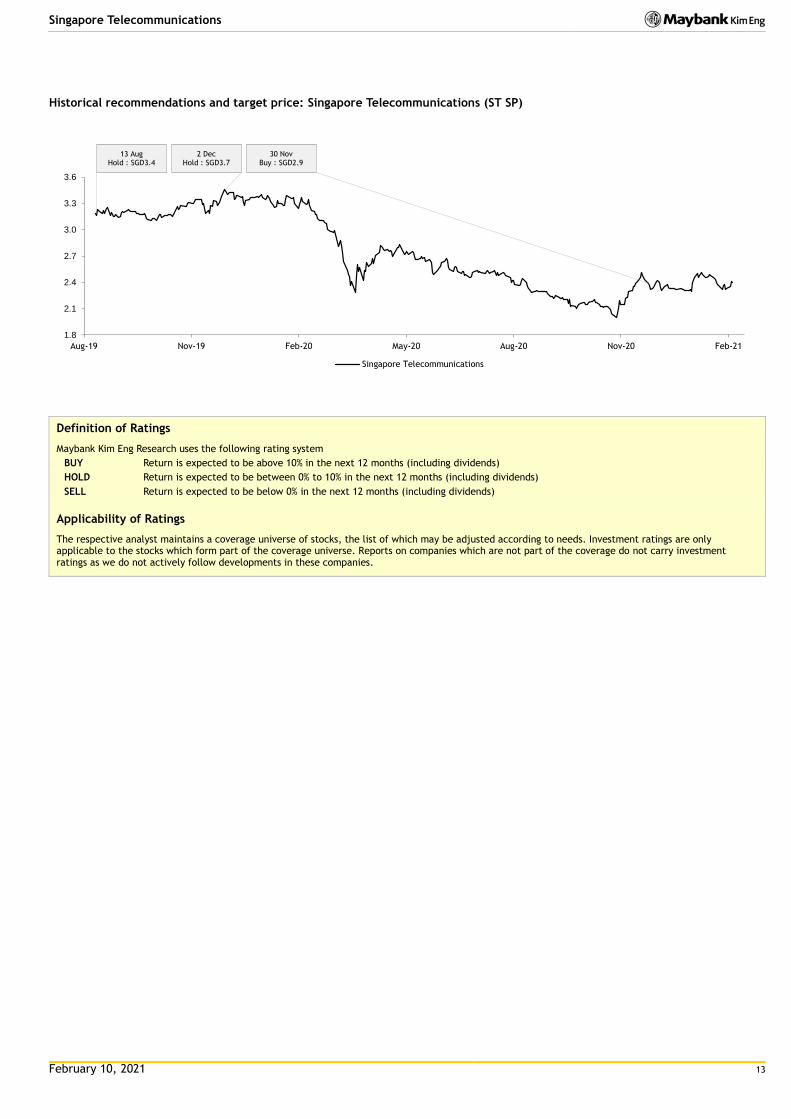
Historical recommendations and target price: Singapore Telecommunications (ST SP)
Definition of Ratings
Maybank Kim Eng Research uses the following rating system
BUY Return is expected to be above 10% in the next 12 months (including dividends)
HOLD Return is expected to be between 0% to 10% in the next 12 months (including dividends)
SELL Return is expected to be below 0% in the next 12 months (including dividends)
Applicability of Ratings
The respective analyst maintains a coverage universe of stocks, the list of which may be adjusted according to needs. Investment ratings are only applicable to the stocks which form part of the coverage universe. Reports on companies which are not part of the coverage do not carry investment ratings as we do not actively follow developments in these companies.
1.8
2.1
2.4
2.7
3.0
3.3
3.6
Aug-19 Nov-19 Feb-20 May-20 Aug-20 Nov-20 Feb-21
Singapore Telecommunications
13 Aug Hold : SGD3.4
2 Dec Hold : SGD3.7
30 Nov Buy : SGD2.9

February 10, 2021 14
Singapore Telecommunications
Malaysia Maybank Investment Bank Berhad
(A Participating Organisation of
Bursa Malaysia Securities Berhad)
33rd Floor, Menara Maybank,
100 Jalan Tun Perak,
50050 Kuala Lumpur
Tel: (603) 2059 1888;
Fax: (603) 2078 4194
Singapore Maybank Kim Eng Securities Pte Ltd
Maybank Kim Eng Research Pte Ltd
50 North Canal Road
Singapore 059304
Tel: (65) 6336 9090
London Maybank Kim Eng Securities
(London) Ltd
PNB House
77 Queen Victoria Street
London EC4V 4AY, UK
Tel: (44) 20 7332 0221
Fax: (44) 20 7332 0302
New York Maybank Kim Eng Securities USA
Inc
400 Park Avenue, 11th Floor
New York, New York 10022,
U.S.A.
Tel: (212) 688 8886
Fax: (212) 688 3500
Stockbroking Business:
Level 8, Tower C, Dataran Maybank,
No.1, Jalan Maarof
59000 Kuala Lumpur
Tel: (603) 2297 8888
Fax: (603) 2282 5136
Hong Kong Kim Eng Securities (HK) Ltd
28/F, Lee Garden Three,
1 Sunning Road, Causeway Bay,
Hong Kong
Tel: (852) 2268 0800
Fax: (852) 2877 0104
Indonesia PT Maybank Kim Eng Securities
Sentral Senayan III, 22nd Floor
Jl. Asia Afrika No. 8
Gelora Bung Karno, Senayan
Jakarta 10270, Indonesia
Tel: (62) 21 2557 1188
Fax: (62) 21 2557 1189
India Kim Eng Securities India Pvt Ltd
1101, 11th floor, A Wing, Kanakia
Wall Street, Chakala, Andheri -
Kurla Road, Andheri East,
Mumbai City - 400 093, India
Tel: (91) 22 6623 2600
Fax: (91) 22 6623 2604
Philippines Maybank ATR Kim Eng Securities Inc.
17/F, Tower One & Exchange Plaza
Ayala Triangle, Ayala Avenue
Makati City, Philippines 1200
Tel: (63) 2 8849 8888
Fax: (63) 2 8848 5738
Thailand Maybank Kim Eng Securities
(Thailand) Public Company Limited
999/9 The Offices at Central World,
20th - 21st Floor,
Rama 1 Road Pathumwan,
Bangkok 10330, Thailand
Tel: (66) 2 658 6817 (sales)
Tel: (66) 2 658 6801 (research)
Vietnam Maybank Kim Eng Securities Limited
4A-15+16 Floor Vincom Center Dong
Khoi, 72 Le Thanh Ton St. District 1
Ho Chi Minh City, Vietnam
Tel : (84) 844 555 888
Fax : (84) 8 38 271 030
Saudi Arabia In association with
Anfaal Capital
Ground Floor, KANOO Building
No.1 - Al-Faisaliyah,Madina Road,
P.O.Box 126575 Jeddah 21352
Kingdom of Saudi Arabia
Tel: (966) 920023423
South Asia Sales Trading Kevin Foy
Regional Head Sales Trading
Tel: (65) 6636-3620
US Toll Free: 1-866-406-7447
North Asia Sales Trading Andrew Lee
Tel: (852) 2268 0283
US Toll Free: 1 877 837 7635
Indonesia Iwan Atmadjaja [email protected] (62) 21 8066 8555
London Greg Smith [email protected] Tel: (44) 207-332-0221
New York James Lynch [email protected] Tel: (212) 688 8886
India Sanjay Makhija [email protected] Tel: (91)-22-6623-2629
Philippines Keith Roy [email protected] Tel: (63) 2 848-5288
www.maybank-ke.com | www.maybank-keresearch.com