statistics frencken group ltd 52w high/low (sgd) hold 2.49/1
TRANSCRIPT

2.36
November 16, 2021
Technolo
gy
Sin
gapore
THIS REPORT HAS BEEN PREPARED BY MAYBANK KIM ENG RESEARCH
SEE PAGE 8 FOR IMPORTANT DISCLOSURES AND ANALYST CERTIFICATIONS
Co. Reg No: 198700034E MICA (P) : 099/03/2012
Tear Sheet Insert
Gene Lih Lai, CFA [email protected] (65) 6231 5832
Frencken Group Ltd (FRKN SP)
Time for a breather
D/G to HOLD as short-term risk reward turns neutral
3Q21 PATMI of SGD14.8m (+10.7% YoY) was in line. 9M21 PATMI accounted
for 74% of our/consensus’ FY21E. We cut FY21-23E EPS by 1-6% to factor i)
slower 4Q21 business momentum than we previously expected; and ii)
higher cost environment. Our TP falls to SGD2.50 (15.5x FY22E P/E), and
we downgrade to Hold as we believe risk-reward is now balanced. Prefer
AEM and UMS for exposure for Singapore tech.
3Q21 summary
3Q21 revenue rose 18.7% YoY, driven by semicon (+42.7%), medical
(+21.8%), analytical (+29%), and consumer electronics (+18.1%). These
were offset by industrial automation (-17%) and automotive (-5.6%). Gross
margin fell 0.5ppt YoY to 17.1% due to higher material and freight cost.
2H21 revenue stable HoH
Frencken now expects 2H21 revenue to be stable HoH, from a “moderate
increase” previously. In particular, the automotive segment is now
expected to soften HoH from “stable”. Guidance for most other segments
are unchanged, i.e. semiconductor (stable HoH), medical and analytical
(higher HoH) and industrial automation (lower HoH). Frencken’s medical
customer have recently blamed “chips and ships” for lowering guidance
recently, and we suspect Frencken’s sales potential may have been capped
there as well.
Still positive for the longer run
Our forecast reflects assumptions where i) some of 4Q21 sales is pushed
out into 2022 amid supply side bottlenecks; and ii) lowered gross margins
on account of higher input costs. While we are neutral in the short term,
we remain optimistic about Frencken’s long term potential with a breadth
of new products with stronger value add translating to revenue and margin
expansion in coming years. The demand outlook from most customers,
such as in semicon, medical and analytical remain encouraging too. Key
risk to our view is if supply chain disruptions persist for longer than
expected, and or if costs pass through is not as high as we anticipated.
[Prior:BUY]
Share Price SGD 2.36
12m Price Target SGD 2.50 (+8%)
Previous Price Target SGD 2.63
HOLD
Company Description
Statistics
52w high/low (SGD)
3m avg turnover (USDm)
Free float (%)
Issued shares (m)
Market capitalisation
Major shareholders:
6.2%
6.1%
5.7%
427
5.3
Frencken manufactures components and modules for
various industries including semiconductor, life
sciences, automotive and industrial automation.
Micro Compact Sdn. Bhd.
Precico Holdings Sdn. Bhd.
GOOI FAMILY
2.49/1.02
59.8
SGD1.0B
USD746M
Price Performance
50
100
150
200
250
300
0.00
0.50
1.00
1.50
2.00
2.50
Nov-19 Feb-20 May-20 Aug-20 Nov-20 Feb-21 May-21 Aug-21
Frencken Group - (LHS, SGD) Frencken Group / Straits Times Index - (RHS, %)
-1M -3M -12M
Absolute (%) 5 6 125
Relative to index (%) 4 4 89
Source: FactSet
FYE Dec (SGD m) FY19A FY20A FY21E FY22E FY23E
Revenue 659 621 750 850 904
EBITDA 80 80 95 109 123
Core net profit 47 49 59 69 77
Core FDEPS (cts) 11.0 11.5 13.7 16.1 18.1
Core FDEPS growth(%) 36.2 4.8 19.4 17.7 12.1
Net DPS (cts) 3.0 3.4 4.1 4.8 5.4
Core FD P/E (x) 8.4 11.5 17.2 14.6 13.1
P/BV (x) 1.3 1.7 2.7 2.4 2.1
Net dividend yield (%) 3.2 2.6 1.7 2.1 2.3
ROAE (%) 15.1 13.6 16.5 17.3 17.2
ROAA (%) 9.6 9.2 9.8 10.4 10.6
EV/EBITDA (x) 4.0 5.7 9.5 8.1 7.1
Net gearing (%) (incl perps) net cash net cash net cash net cash net cash
Consensus net profit - - 60 71 78
MKE vs. Consensus (%) - - (2.9) (3.0) (0.7)

November 16, 2021 2
Frencken Group Ltd
Value Proposition
Technology hardware manufacturer that specialises in
complex components.
High-mix, low-volume, high complexity for mechatronics
segment.
Customers are sticky, given: i) decades-long working
relationships; ii) complementary competencies; and iii)
mutual dependency (sole-source for some critical products).
We expect Frencken to leverage its relationships with
customers to introduce products with greater value-add, in
turn driving margins further.
Diverse end markets with room for margin expansion
Source: Company
Price Drivers
Historical share price trend
Source: Company, Maybank Kim Eng
1. 1Q17 core net profit doubled to SGD6.1m, driven by
strength in semiconductor and analytical subdivisions.
2. General derating of the Singapore tech sector amid
initial US-China tensions.
3. Reported FY18 core net profit of SGD34m (+47% YoY) on
strength from industrial automation.
4. Reported 3Q19 core net profit of SGD31m (+35%) on
strength from industrial automation and semiconductor.
General tech sector rerating amid initial signs of global
semiconductor recovery.
5. Frencken’s semiconductor segment is beneficiary of chip
shortages
Financial Metrics
Over the medium term, we expect earnings to be driven by
revenue growth and margin optimisation through new
products and improving efficiencies.
Net cash balance sheet and strong cash flow should provide
resilience amid economic uncertainties.
Historically pays out 30% of earnings as dividends. We expect
this trend to continue.
EPS, FCF per share and DPS
Source: Company, Maybank Kim Eng
Swing Factors
Upside
Stronger-than-expected semiconductor and industrial
automation contributions.
Robust margin accretion from new products and
improving efficiencies.
Improving institutional interest, which could help the
stock rerate towards peers’ valuations.
Downside
Erosion in revenue resilience due to on-going economic
weakness.
Supply chain disruptions that impede Frencken’s
production ability and revenue recognition.
Lower-than-expected dividend pay-out.
0
5
10
0
500
1000
2013 2014 2015 2016 2017 2018 2019 2020 2021E2022E2023E
%SGDm
Semiconductor MedicalAnalytical Industrial AutomationOthers (Mechatronics) AutomotiveConsumer & industrial Others (IMS)Tooling Core net margin
0
200
400
600
800
1000
1200
1400
0.00
0.50
1.00
1.50
2.00
2.50
3.00
Jan-1
5
Jan-1
6
Jan-1
7
Jan-1
8
Jan-1
9
Jan-2
0
Jan-2
1
SGD
FRKN SP - Price FRKN SP/ FSSTI - (RHS)
0.00
0.05
0.10
0.15
0.20
0.25
2013 2014 2015 2016 2017 2018 2019 2020 2021E 2022E 2023E
SGD
Core EPS FCF per share DPS
1 2
3 4
5

November 16, 2021 3
Frencken Group Ltd
Risk Rating & Score¹ Not Rated
Score Momentum² na
Last Updated na
Controversy Score³ na
Business Model & Industry Issues
The nature of Frencken’s business in the electronics and automotive manufacturing supply chains exposes it to risks including
environmental, workplace safety, and conflict of interest. Frencken has not faced any fines or non-monetary sanctions pertaining
environmental nor socioeconomic laws and regulations in 2020.
From an environment perspective, Frencken’s Eco-PVD offering can be seen as a more environmentally friendly approach for
automotive coating. While Frencken does not use recycled materials currently, it may do so in the future subject to customers’
requirements.
From a governance and socioeconomic perspective, Frencken is adopting industry best practices, including those set by
customers, as these facilitate smooth business.
Material E issues
Environmental risks - Frencken’s production process
involves non-renewable materials and waste generation.
Non-compliance of rules and laws may severely impact the
environment of local communities.
In 2020, Frencken had zero fines and non-monetary
sanctions for non-compliance with environmental laws
and/or regulations.
Areas for potential improvement include i) increased use of
recycled materials, contingent on customer approval; ii)
increased efficiency of water and electric usage.
Opportunities - Frencken’s proprietary eco-PVD coating
technology is more environmentally friendly than
traditional PVD methods. Frencken is optimistic of long-
term prospects for this offering.
Key G metrics and issues
Board consists of six directors, of whom one is an executive
director (CEO), one is a non-executive, non-independent
chairman, and four are independent (67%). All directors
are male.
The nominating, audit and remuneration committees are
chaired by independent directors.
Chairman Mr. Gooi Soon Chai’s deemed stake in the
company is c.22%.
Three independent directors have served more than nine
years from date of appointments. Frencken states that
their independence is not in any way affected by their
length of service.
Professional background of independent directors includes
law, accounting, consultancy and electronics engineering.
Key management/ directors’ compensation accounted for
3.8%/1.3% of total employee compensation in 2020. (2019:
3.6%/ 1.2%).
Related-party transactions were immaterial (<1% of
profit).
Auditor is Deloitte & Touche LLP which was appointed in
2014.
Former non-independent non-executive chairman Mr. Larry
Low resigned in 2016 and pared his stake from 8.14% to
4.74% in 2018. Mr. Low is the father of fugitive Jho Low.
However, this development has no impact to the
governance nor operations of the company as current
management and board are independent of Mr. Low.
Material S issues
Employee health and safety risks. Frencken benchmarks its
occupational safety and health practices against industry
best practices. E.g. the Bangi (Malaysia) plant is in
compliance with Agilent Supplier Environmental, Health
and Safety and Social Responsibility guidelines.
Employee safety remains of paramount importance for
Frencken with proper mitigation measures implemented.
In 2020, Frencken’s injury rate was 0.15%. (2019: 0.078%).
Employees underwent an average of 1.5-14 hours of training
in 2020 across technical, occupational health and safety and
strategic topics.
Male employees account for 34.2% of the workforce.
Socioeconomic risks. To ensure smooth business operations,
Frencken i) adheres to all applicable laws and regulations
and ii) upholds strong ethical standards. This safeguards
trust with stakeholders and avoids liability due to non-
compliance.
¹Risk Rating & Score - derived by Sustainalytics and assesses the company’s exposure to unmanaged ESG risks. Scores range between 0 - 50 in order of increasing severity with low/high scores & ratings representing negligible/significant risk to the company’s enterprise value, respectively, from ESG-driven financial impacts. ²Score Momentum - indicates changes to the company's score since the last update – a negative integer indicates a company’s improving risk score; a positive integer indicates a deterioration. ³Controversy Score - reported periodically by Sustainalytics in the event of material ESG-related incident(s), with the impact severity scores of these events ranging from Category 0-5 (0 - no reports; 1 - negligible risks; ...; 5 - poses serious risks & indicative of potential structural deficiencies at the company).
November 16, 2021 4
Frencken Group Ltd
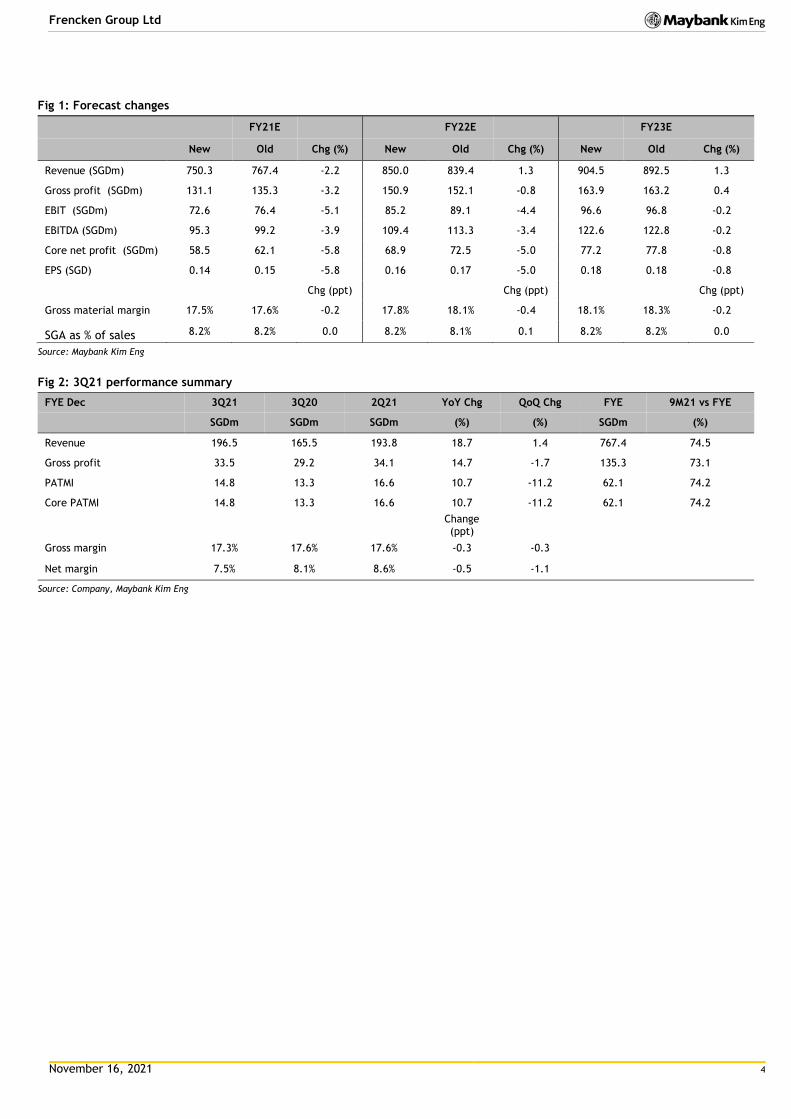
Fig 1: Forecast changes
FY21E FY22E FY23E
New Old Chg (%) New Old Chg (%) New Old Chg (%)
Revenue (SGDm) 750.3 767.4 -2.2 850.0 839.4 1.3 904.5 892.5 1.3
Gross profit (SGDm) 131.1 135.3 -3.2 150.9 152.1 -0.8 163.9 163.2 0.4
EBIT (SGDm) 72.6 76.4 -5.1 85.2 89.1 -4.4 96.6 96.8 -0.2
EBITDA (SGDm) 95.3 99.2 -3.9 109.4 113.3 -3.4 122.6 122.8 -0.2
Core net profit (SGDm) 58.5 62.1 -5.8 68.9 72.5 -5.0 77.2 77.8 -0.8
EPS (SGD) 0.14 0.15 -5.8 0.16 0.17 -5.0 0.18 0.18 -0.8
Chg (ppt)
Chg (ppt)
Chg (ppt)
Gross material margin 17.5% 17.6% -0.2 17.8% 18.1% -0.4 18.1% 18.3% -0.2
SGA as % of sales 8.2% 8.2% 0.0 8.2% 8.1% 0.1 8.2% 8.2% 0.0
Source: Maybank Kim Eng
Fig 2: 3Q21 performance summary
FYE Dec 3Q21 3Q20 2Q21 YoY Chg QoQ Chg FYE 9M21 vs FYE
SGDm SGDm SGDm (%) (%) SGDm (%)
Revenue 196.5 165.5 193.8 18.7 1.4 767.4 74.5
Gross profit 33.5 29.2 34.1 14.7 -1.7 135.3 73.1
PATMI 14.8 13.3 16.6 10.7 -11.2 62.1 74.2
Core PATMI 14.8 13.3 16.6 10.7 -11.2 62.1 74.2
Change (ppt)
Gross margin 17.3% 17.6% 17.6% -0.3 -0.3
Net margin 7.5% 8.1% 8.6% -0.5 -1.1
Source: Company, Maybank Kim Eng
November 16, 2021 5
Frencken Group Ltd
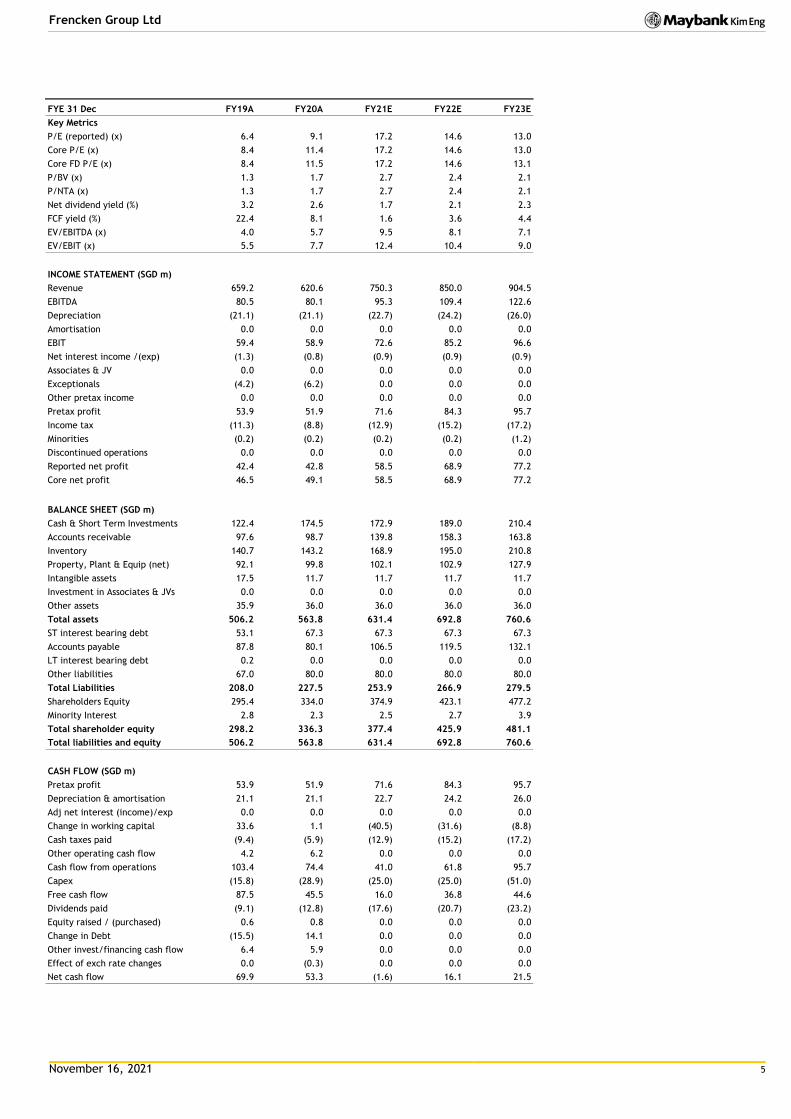
FYE 31 Dec FY19A FY20A FY21E FY22E FY23E
Key Metrics
P/E (reported) (x) 6.4 9.1 17.2 14.6 13.0
Core P/E (x) 8.4 11.4 17.2 14.6 13.0
Core FD P/E (x) 8.4 11.5 17.2 14.6 13.1
P/BV (x) 1.3 1.7 2.7 2.4 2.1
P/NTA (x) 1.3 1.7 2.7 2.4 2.1
Net dividend yield (%) 3.2 2.6 1.7 2.1 2.3
FCF yield (%) 22.4 8.1 1.6 3.6 4.4
EV/EBITDA (x) 4.0 5.7 9.5 8.1 7.1
EV/EBIT (x) 5.5 7.7 12.4 10.4 9.0
INCOME STATEMENT (SGD m)
Revenue 659.2 620.6 750.3 850.0 904.5
EBITDA 80.5 80.1 95.3 109.4 122.6
Depreciation (21.1) (21.1) (22.7) (24.2) (26.0)
Amortisation 0.0 0.0 0.0 0.0 0.0
EBIT 59.4 58.9 72.6 85.2 96.6
Net interest income /(exp) (1.3) (0.8) (0.9) (0.9) (0.9)
Associates & JV 0.0 0.0 0.0 0.0 0.0
Exceptionals (4.2) (6.2) 0.0 0.0 0.0
Other pretax income 0.0 0.0 0.0 0.0 0.0
Pretax profit 53.9 51.9 71.6 84.3 95.7
Income tax (11.3) (8.8) (12.9) (15.2) (17.2)
Minorities (0.2) (0.2) (0.2) (0.2) (1.2)
Discontinued operations 0.0 0.0 0.0 0.0 0.0
Reported net profit 42.4 42.8 58.5 68.9 77.2
Core net profit 46.5 49.1 58.5 68.9 77.2
BALANCE SHEET (SGD m)
Cash & Short Term Investments 122.4 174.5 172.9 189.0 210.4
Accounts receivable 97.6 98.7 139.8 158.3 163.8
Inventory 140.7 143.2 168.9 195.0 210.8
Property, Plant & Equip (net) 92.1 99.8 102.1 102.9 127.9
Intangible assets 17.5 11.7 11.7 11.7 11.7
Investment in Associates & JVs 0.0 0.0 0.0 0.0 0.0
Other assets 35.9 36.0 36.0 36.0 36.0
Total assets 506.2 563.8 631.4 692.8 760.6
ST interest bearing debt 53.1 67.3 67.3 67.3 67.3
Accounts payable 87.8 80.1 106.5 119.5 132.1
LT interest bearing debt 0.2 0.0 0.0 0.0 0.0
Other liabilities 67.0 80.0 80.0 80.0 80.0
Total Liabilities 208.0 227.5 253.9 266.9 279.5
Shareholders Equity 295.4 334.0 374.9 423.1 477.2
Minority Interest 2.8 2.3 2.5 2.7 3.9
Total shareholder equity 298.2 336.3 377.4 425.9 481.1
Total liabilities and equity 506.2 563.8 631.4 692.8 760.6
CASH FLOW (SGD m)
Pretax profit 53.9 51.9 71.6 84.3 95.7
Depreciation & amortisation 21.1 21.1 22.7 24.2 26.0
Adj net interest (income)/exp 0.0 0.0 0.0 0.0 0.0
Change in working capital 33.6 1.1 (40.5) (31.6) (8.8)
Cash taxes paid (9.4) (5.9) (12.9) (15.2) (17.2)
Other operating cash flow 4.2 6.2 0.0 0.0 0.0
Cash flow from operations 103.4 74.4 41.0 61.8 95.7
Capex (15.8) (28.9) (25.0) (25.0) (51.0)
Free cash flow 87.5 45.5 16.0 36.8 44.6
Dividends paid (9.1) (12.8) (17.6) (20.7) (23.2)
Equity raised / (purchased) 0.6 0.8 0.0 0.0 0.0
Change in Debt (15.5) 14.1 0.0 0.0 0.0
Other invest/financing cash flow 6.4 5.9 0.0 0.0 0.0
Effect of exch rate changes 0.0 (0.3) 0.0 0.0 0.0
Net cash flow 69.9 53.3 (1.6) 16.1 21.5

November 16, 2021 6
Frencken Group Ltd
FYE 31 Dec FY19A FY20A FY21E FY22E FY23E
Key Ratios
Growth ratios (%)
Revenue growth 5.3 (5.8) 20.9 13.3 6.4
EBITDA growth 12.6 (0.5) 19.0 14.8 12.0
EBIT growth 31.7 (0.7) 23.1 17.4 13.4
Pretax growth 34.2 (3.8) 38.1 17.6 13.5
Reported net profit growth 41.1 1.1 36.6 17.7 12.1
Core net profit growth 37.1 5.4 19.3 17.7 12.1
Profitability ratios (%)
EBITDA margin 12.2 12.9 12.7 12.9 13.6
EBIT margin 9.0 9.5 9.7 10.0 10.7
Pretax profit margin 8.2 8.4 9.5 9.9 10.6
Payout ratio 30.0 34.2 30.0 30.0 30.0
DuPont analysis
Net profit margin (%) 6.4 6.9 7.8 8.1 8.5
Revenue/Assets (x) 1.3 1.1 1.2 1.2 1.2
Assets/Equity (x) 1.7 1.7 1.7 1.6 1.6
ROAE (%) 15.1 13.6 16.5 17.3 17.2
ROAA (%) 9.6 9.2 9.8 10.4 10.6
Liquidity & Efficiency
Cash conversion cycle 97.2 97.5 93.7 98.6 101.6
Days receivable outstanding 58.3 56.9 57.2 63.1 64.1
Days inventory outstanding 93.8 99.2 90.7 93.7 98.6
Days payables outstanding 54.9 58.7 54.2 58.2 61.2
Dividend cover (x) 3.3 2.9 3.3 3.3 3.3
Current ratio (x) 2.0 2.0 2.1 2.2 2.3
Leverage & Expense Analysis
Asset/Liability (x) 2.4 2.5 2.5 2.6 2.7
Net gearing (%) (incl perps) net cash net cash net cash net cash net cash
Net gearing (%) (excl. perps) net cash net cash net cash net cash net cash
Net interest cover (x) 45.9 70.3 79.6 93.5 106.0
Debt/EBITDA (x) 0.7 0.8 0.7 0.6 0.5
Capex/revenue (%) 2.4 4.7 3.3 2.9 5.6
Net debt/ (net cash) (69.2) (107.1) (105.5) (121.6) (143.1)
Source: Company; Maybank
November 16, 2021 7
Frencken Group Ltd
Research Offices
ECONOMICS
Suhaimi ILIAS Chief Economist Malaysia | Philippines | Global (603) 2297 8682 [email protected]
CHUA Hak Bin Regional Thematic Macroeconomist (65) 6231 5830 [email protected]
LEE Ju Ye Singapore | Thailand | Indonesia (65) 6231 5844 [email protected]
Linda LIU Singapore | Vietnam | Cambodia | Myanmar | Laos (65) 6231 5847 [email protected]
Dr Zamros DZULKAFLI (603) 2082 6818 [email protected]
FX
Saktiandi SUPAAT Head of FX Research (65) 6320 1379 [email protected]
Christopher WONG (65) 6320 1347 [email protected]
TAN Yanxi (65) 6320 1378 [email protected]
Fiona LIM (65) 6320 1374 [email protected]
STRATEGY
Anand PATHMAKANTHAN
ASEAN (603) 2297 8783 [email protected]
FIXED INCOME
Winson PHOON, ACA (65) 6340 1079 [email protected]
SE THO Mun Yi (603) 2074 7606 [email protected]
REGIONAL EQUITIES
Anand PATHMAKANTHAN Head of Regional Equity Research (603) 2297 8783 [email protected]
WONG Chew Hann, CA Head of ASEAN Equity Research (603) 2297 8686 [email protected]
ONG Seng Yeow Research, Technology & Innovation (65) 6231 5839 [email protected]
MALAYSIA
Anand PATHMAKANTHAN Head of Research (603) 2297 8783 [email protected] • Strategy
WONG Chew Hann, CA (603) 2297 8686
[email protected] • Non-Bank Financials (stock exchange) • Construction & Infrastructure
Desmond CH’NG, BFP, FCA (603) 2297 8680 [email protected] • Banking & Finance
LIAW Thong Jung (603) 2297 8688 [email protected] • Oil & Gas Services- Regional • Automotive
ONG Chee Ting, CA (603) 2297 8678 [email protected] • Plantations - Regional
YIN Shao Yang, CPA (603) 2297 8916 [email protected] • Gaming – Regional • Media • Aviation • Non-Bank Financials
TAN Chi Wei, CFA (603) 2297 8690 [email protected] • Power • Telcos
WONG Wei Sum, CFA (603) 2297 8679 [email protected] • Property • Glove
Jade TAM (603) 2297 8687 [email protected] • Consumer Staples & Discretionary
Fahmi FARID (603) 2297 8676 [email protected] • Software
Syifaa’ Nur FARAH (603) 2297 8675 [email protected] • Construction • Renewable Energy • REITs
Arvind JAYARATNAM (603) 2297 8692 [email protected] • Ports • Shipping • Petrochemicals • Technology
TEE Sze Chiah Head of Retail Research (603) 2082 6858 [email protected]
Nik Ihsan RAJA ABDULLAH, MSTA, CFTe (603) 2297 8694 [email protected] • Chartist
Amirah AZMI (603) 2082 8769 [email protected] • Retail Research
SINGAPORE
Thilan WICKRAMASINGHE Head of Research (65) 6231 5840 [email protected] • Banking & Finance - Regional • Consumer
CHUA Su Tye (65) 6231 5842 [email protected] • REITs - Regional
LAI Gene Lih, CFA (65) 6231 5832 [email protected] • Technology • Healthcare
Kareen CHAN (65) 6231 5926 [email protected] • Transport • Telcos • Consumer
Eric ONG (65) 6231 5924 [email protected] • SMIDs
Matthew SHIM (65) 6231 5929 [email protected]
• REITs
PHILIPPINES
Jacqui de JESUS Head of Research (63) 2 8849 8840 [email protected] • Strategy • Conglomerates
Rachelleen RODRIGUEZ, CFA (63) 2 8849 8843 [email protected] • Banking & Finance • Transport • Telcos
Daphne SZE (63) 2 8849 8847 [email protected] • Consumer
Miguel SEVIDAL (63) 2 8849 8844 [email protected] • REITs • Property
VIETNAM
Quan Trong Thanh Head of Research (84 28) 44 555 888 ext 8184 [email protected] • Banks
Hoang Huy, CFA (84 28) 44 555 888 ext 8181 [email protected] • Strategy • Technology • Industrials
Le Nguyen Nhat Chuyen (84 28) 44 555 888 ext 8082 [email protected] • Oil & Gas • Logistics
Nguyen Thi Sony Tra Mi (84 28) 44 555 888 ext 8084 [email protected] • Consumer
Tyler Manh Dung Nguyen (84 28) 44 555 888 ext 8085 [email protected] • Utilities • Property
Nguyen Thi Ngan Tuyen Head of Retail Research (84 28) 44 555 888 ext 8081 [email protected] • Retail Research
Nguyen Thanh Lam (84 28) 44 555 888 ext 8086 [email protected] • Technical Analysis
INDIA
Jigar SHAH Head of Research (91) 22 4223 2632 [email protected] • Strategy • Oil & Gas • Automobile • Cement
Neerav DALAL (91) 22 4223 2606 [email protected] • Software Technology • Telcos
Vikram RAMALINGAM (91) 22 4223 2607 [email protected] • Automobile • Media
INDONESIA
Rahmi MARINA (62) 21 8066 8689 [email protected] • Banking & Finance
Willy GOUTAMA (62) 21 8066 8500 [email protected] • Consumer
Farah OKTAVIANI (62) 21 8066 8691 [email protected] • Construction
THAILAND
Maria LAPIZ Head of Institutional Research Dir (66) 2257 0250 | (66) 2658 6300 ext 1399 [email protected] • Strategy • Consumer • Materials • Services
Jesada TECHAHUSDIN, CFA (66) 2658 6300 ext 1395 [email protected] • Banking & Finance
Kaushal LADHA, CFA, CESGA (66) 2658 6300 ext 1392 [email protected] • Oil & Gas – Regional • Petrochemicals - Regional • Utilities
Vanida GEISLER, CPA (66) 2658 6300 ext 1394 [email protected] • Property • REITs
Yuwanee PROMMAPORN (66) 2658 6300 ext 1393 Yuwanee.P @maybank-ke.co.th • Services • Healthcare
Ekachai TARAPORNTIP Head of Retail Research (66) 2658 5000 ext 1530 [email protected]
Surachai PRAMUALCHAROENKIT (66) 2658 5000 ext 1470 [email protected] • Auto • Conmat • Contractor • Steel
Suttatip PEERASUB (66) 2658 5000 ext 1430 [email protected] • Food & Beverage • Commerce
Jaroonpan WATTANAWONG (66) 2658 5000 ext 1404 [email protected] • Transportation • Small cap
Thanatphat SUKSRICHAVALIT (66) 2658 5000 ext 1401 [email protected]
• Media • Electronics
Wijit ARAYAPISIT (66) 2658 5000 ext 1450 [email protected] • Strategist
Theerasate PROMPONG (66) 2658 5000 ext 1400 [email protected] • Equity Portfolio Strategist
Apiwat TAVESIRIVATE (66) 2658 5000 ext 1310 [email protected] • Chartist and TFEX

November 16, 2021 8
Frencken Group Ltd
APPENDIX I: TERMS FOR PROVISION OF REPORT, DISCLAIMERS AND DISCLOSURES
DISCLAIMERS This research report is prepared for general circulation and for information purposes only and under no circumstances should it be considered or intended as an offer to sell or a sol icitation of an offer to buy the securities referred to herein. Investors should note that values of such securities, if any, may fluctuate and that each security’s price or value may rise or fall. Opinions or recommendations contained herein are in form of technical ratings and fundamental ratings. Technical ratings may differ from fundamental ratings as technical valuations apply different methodologies and are purely based on price and volume-related information extracted from the relevant jurisdiction’s stock exchange in the equity analysis. Accordingly, investors’ returns may be less than the original sum invested. Past performance is not necessarily a guide to future performance. This report is not intended to provide personal investment advice and does not take into account the specific investment objectives, the financial situation and the particular needs of persons who may receive or read this report. Investors should therefore seek financial, legal and other advice regarding the appropriateness of investing in any securities or the investment strategies d iscussed or recommended in this report.
The information contained herein has been obtained from sources believed to be reliable but such sources have not been independently verified by Maybank Inves tment Bank Berhad, its subsidiary and affiliates (collectively, “MKE”) and consequently no representation is made as to the accuracy or completeness of this report by MKE and it should not be relied upon as such. Accordingly, MKE and its officers, directors, associates, connected parties and/or employees (collectively, “Representatives”) shall not be liable for any direct, indirect or consequential losses or damages that may arise from the use or reliance of this report. Any information, opinions or recommendations contained herein are subject to change at any time, without prior notice.
This report may contain forward looking statements which are often but not always identified by the use of words such as “anticipate”, “believe”, “estimate”, “intend”, “plan”, “expect”, “forecast”, “predict” and “project” and statements that an event or result “may”, “will”, “can”, “should”, “could” or “might” occur or be achieved and other similar expressions. Such forward looking statements are based on assumptions made and information currently available to us and are subject to certain risks and uncertainties that could cause the actual results to differ materially from those expressed in any forward looking statements. Readers are cautioned not to place undue relevance on these forward-looking statements. MKE expressly disclaims any obligation to update or revise any such forward looking statements to reflect new information, events or circumstances after the date of this publication or to reflect the occurrence of unanticipated events.
MKE and its officers, directors and employees, including persons involved in the preparation or issuance of this report, may, to the extent permitted by law, from time to time participate or invest in financing transactions with the issuer(s) of the securities mentioned in this report, perform services for or solic it business from such issuers, and/or have a position or holding, or other material interest, or effect transactions, in such securities or options thereon, or other investments related thereto. In addition, it may make markets in the securities mentioned in the material presented in this report. One or more directors, officers and/or employees of MKE may be a director of the issuers of the securities mentioned in this repor t to the extent permitted by law.
This report is prepared for the use of MKE’s clients and may not be reproduced, altered in any way, transmitted to, copied or distributed to any other party in whole or in part in any form or manner without the prior express written consent of MKE and MKE and its Representatives accepts no liability whatsoever for t he actions of third parties in this respect.
This report is not directed to or intended for distribution to or use by any person or entity who is a citizen or resident of or located in any locality, state, country or other jurisdiction where such distribution, publication, availability or use would be contrary to law or regulation. This report is for distribution only under such circumstances as may be permitted by applicable law. The securities described herein may not be eligible for sale in all jurisdictions or to certain categories of investors. Without prejudice to the foregoing, the reader is to note that additional disclaimers, warnings or qualifications may apply based on geographical location of the person or entity receiving this repor t.
Malaysia Opinions or recommendations contained herein are in the form of technical ratings and fundamental ratings. Technical ratings may differ from fundamental ratings as technical valuations apply different methodologies and are purely based on price and volume-related information extracted from Bursa Malaysia Securities Berhad in the equity analysis.
Singapore This report has been produced as of the date hereof and the information herein may be subject to change. Maybank Kim Eng Research Pte. Ltd. (“Maybank KERPL”) in Singapore has no obligation to update such information for any recipient. For distribution in Singapore, recipients of this report are to contact Maybank KERPL in Singapore in respect of any matters arising from, or in connection with, this report. If the recipient of this report is not an accredited investor, expert investor or institutional investor (as defined under Section 4A of the Singapore Securities and Futures Act), Maybank KERPL shall be legally liable for the contents of this report, with such liability being limited to the extent (if any) as permitted by law.
Thailand Except as specifically permitted, no part of this presentation may be reproduced or distributed in any manner without the prior written permission of Maybank Kim Eng Securities (Thailand) Public Company Limited. Maybank Kim Eng Securities (Thailand) Public Company Limited (“MBKET”) accepts no liability whatsoever for the actions of third parties in this respect.
Due to different characteristics, objectives and strategies of institutional and retail investors, the research products of MBKET Institutional and Retail Research departments may differ in either recommendation or target price, or both. MBKET reserves the rights to disseminate MBKET Retail Research reports to institutional investors who have requested to receive it. If you are an authorised recipient, you hereby tacitly acknowledge that the research reports from MBKET Retail Research are first pr oduced in Thai and there is a time lag in the release of the translated English version.
The disclosure of the survey result of the Thai Institute of Directors Association (“IOD”) regarding corporate governance is made pursuant to the policy of the Office of the Securities and Exchange Commission. The survey of the IOD is based on the information of a company listed on the Stock Exchange of Thailand and the market for Alternative Investment disclosed to the public and able to be accessed by a general public investor. The result, therefore, is from the perspective of a third party. It is not an evaluation of operation and is not based on inside information. The survey result is as of the date appearing in the Corporate Governance Report of Thai Listed Companies. As a result, the survey may be changed after that date. MBKET does not confirm nor certify the accuracy of such survey result.
The disclosure of the Anti-Corruption Progress Indicators of a listed company on the Stock Exchange of Thailand, which is assessed by Thaipat Institute, is made in order to comply with the policy and sustainable development plan for the listed companies of the Office of the Securities and Exchange Commission. Tha ipat Institute made this assessment based on the information received from the listed company, as stipulated in the form for the assessment of Anti-corruption which refers to the Annual Registration Statement (Form 56-1), Annual Report (Form 56-2), or other relevant documents or reports of such listed company. The assessment result is therefore made from the perspective of Thaipat Institute that is a third party. It is not an assessment of operation and is not based on any inside information. Since this assessment is only the assessment result as of the date appearing in the assessment result, it may be changed after that date or when there is any change to the relevant information. Nevertheless, MBKET does not confirm, verify, or certify the accuracy and completeness of the assessment result.
US This third-party research report is distributed in the United States (“US”) to Major US Institutional Investors (as defined in Rule 15a-6 under the Securities Exchange Act of 1934, as amended) only by Maybank Kim Eng Securities USA Inc (“Maybank KESUSA”), a broker-dealer registered in the US (registered under Section 15 of the Securities Exchange Act of 1934, as amended). All responsibility for the distribution of this report by Maybank KESUSA in the US shall be borne by Maybank KESUSA. This report is not directed at you if MKE is prohibited or restricted by any legislation or regulation in any jurisdiction from making it available to you. You should satisfy yourself before reading it that Maybank KESUSA is permitted to provide research material concerning investments to you under relevant legislation and regulations. All U.S. persons receiving and/or accessing this report and wishing to effect transactions in any security mentioned within must do so with: Maybank Kim Eng Securities USA Inc. 400 Park Avenue, 11th Floor, New York, New York 10022, 1-(212) 688-8886 and not with, the issuer of this report.

November 16, 2021 9
Frencken Group Ltd
Disclosure of Interest Malaysia: MKE and its Representatives may from time to time have positions or be materially interested in the securities referred to herein and may further act as market maker or may have assumed an underwriting commitment or deal with such securities and may also perform or seek to perform investment banking services, advisory and other services for or relating to those companies.
Singapore: As of 16 November 2021, Maybank KERPL and the covering analyst do not have any interest in any companies recommended in this research report.
Thailand: MBKET may have a business relationship with or may possibly be an issuer of derivative warrants on the securities /companies mentioned in the research report. Therefore, Investors should exercise their own judgment before making any investment decisions. MBKET, its associates, directors, connected parties and/or employees may from time to time have interests and/or underwriting commitments in the securities mentioned in this report.
Hong Kong: As of 16 November 2021, KESHK and the authoring analyst do not have any interest in any companies recommended in this research report.
India: As of 16 November 2021, and at the end of the month immediately preceding the date of publication of the research report, KESI, authoring analyst o r their associate / relative does not hold any financial interest or any actual or beneficial ownership in any shares or having any conflict of interest in the subject companies except as otherwise disclosed in the research report.
In the past twelve months KESI and authoring analyst or their associate did not receive any compensation or other benefits from the subject companies or third party in connection with the research report on any account what so ever except as otherwise disclosed in the research report.
MKE may have, within the last three years, served as manager or co-manager of a public offering of securities for, or currently may make a primary market in issues of, any or all of the entities mentioned in this report or may be providing, or have provided within the previous 12 months, significant advice or investment services in relation to the investment concerned or a related investment and may receive compensation for the services provided from the companies covered in this report.
OTHERS
Analyst Certification of Independence
The views expressed in this research report accurately reflect the analyst’s personal views about any and all of the subject securities or issuers; and no part of the research analyst’s compensation was, is or will be, directly or indirectly, related to the specific recommendations or views expressed in the report.
Reminder
Structured securities are complex instruments, typically involve a high degree of risk and are intended for sale only to soph isticated investors who are capable of understanding and assuming the risks involved. The market value of any structured security may be affected by changes in economic, financial and political factors (including, but not limited to, spot and forward interest and exchange rates), time to maturity, market conditions and volatility and the credit quality of any issuer or reference issuer. Any investor interested in purchasing a structured product should conduct its own analysis of the product and consult with its own professional advisers as to the risks involved in making such a purchase.
No part of this material may be copied, photocopied or duplicated in any form by any means or redistributed without the prior consent of MKE.
UK This document is being distributed by Maybank Kim Eng Securities (London) Ltd (“Maybank KESL”) which is authorized and regulated, by the Financial Conduct Authority and is for Informational Purposes only. This document is not intended for distribution to anyone defined as a Retail Client under the Financial Services and Markets Act 2000 within the UK. Any inclusion of a third party link is for the recipients convenience only, and that the firm does not take any responsibility for its comments or accuracy, and that access to such links is at the individuals own risk. Nothing in this report should be considered as constituting legal, accounting or tax advice, and that for accurate guidance recipients should consult with their own independent tax advisers.
DISCLOSURES
Legal Entities Disclosures Malaysia: This report is issued and distributed in Malaysia by Maybank Investment Bank Berhad (15938- H) which is a Participating Organization of Bursa Malaysia Berhad and a holder of Capital Markets and Services License issued by the Securities Commission in Malays ia. Singapore: This report is distributed in Singapore by Maybank KERPL (Co. Reg No 198700034E) which is regulated by the Monetary Authority of Singapore. Indonesia: PT Maybank Kim Eng Securities (“PTMKES”) (Reg. No. KEP-251/PM/1992) is a member of the Indonesia Stock Exchange and is regulated by the Financial Services Authority (Indonesia). Thailand: MBKET (Reg. No.0107545000314) is a member of the Stock Exchange of Thailand and is regulated by the Ministry of Finance and the Securities and Exchange Commission. Philippines: Maybank ATRKES (Reg. No.01-2004-00019) is a member of the Philippines Stock Exchange and is regulated by the Securities and Exchange Commission. Vietnam: Maybank Kim Eng Securities Limited (License Number: 117/GP-UBCK) is licensed under the State Securities Commission of Vietnam. Hong Kong: KESHK (Central Entity No AAD284) is regulated by the Securities and Futures Commission. India: Kim Eng Securities India Private Limited (“KESI”) is a participant of the National Stock Exchange of India Limited and the Bombay Stock Exchange and is regulated by Securities and Exchange Board of India (“SEBI”) (Reg. No. INZ000010538). KESI is also registered with SEBI as Category 1 Merchant Banker (Reg. No. INM 000011708) and as Research Analyst (Reg No: INH000000057) US: Maybank KESUSA is a member of/ and is authorized and regulated by the FINRA – Broker ID 27861. UK: Maybank KESL (Reg No 2377538) is authorized and regulated by the Financial Conduct Authority.

November 16, 2021 10
Frencken Group Ltd
Historical recommendations and target price: Frencken Group Ltd (FRKN SP)
Definition of Ratings
Maybank Kim Eng Research uses the following rating system
BUY Return is expected to be above 10% in the next 12 months (including dividends)
HOLD Return is expected to be between 0% to 10% in the next 12 months (including dividends)
SELL Return is expected to be below 0% in the next 12 months (including dividends)
Applicability of Ratings
The respective analyst maintains a coverage universe of stocks, the list of which may be adjusted according to needs. Investment ratings are only applicable to the stocks which form part of the coverage universe. Reports on companies which are not part of the coverage do not carry investment ratings as we do not actively follow developments in these companies.
0.0
0.5
1.0
1.5
2.0
2.5
Nov-18 Feb-19 May-19 Aug-19 Nov-19 Feb-20 May-20 Aug-20 Nov-20 Feb-21 May-21 Aug-21 Nov-21
Frencken Group Ltd
13 Jul Buy : SGD1.2
19 Aug Buy : SGD1.3
12 Nov Buy : SGD1.4
15 Mar Buy : SGD1.7
3 Jun Buy : SGD2.0
16 Aug Buy : SGD2.6

November 16, 2021 11
Frencken Group Ltd
Malaysia Maybank Investment Bank Berhad
(A Participating Organisation of
Bursa Malaysia Securities Berhad)
33rd Floor, Menara Maybank,
100 Jalan Tun Perak,
50050 Kuala Lumpur
Tel: (603) 2059 1888;
Fax: (603) 2078 4194
Singapore Maybank Kim Eng Securities Pte Ltd
Maybank Kim Eng Research Pte Ltd
50 North Canal Road
Singapore 059304
Tel: (65) 6336 9090
London Maybank Kim Eng Securities
(London) Ltd
PNB House
77 Queen Victoria Street
London EC4V 4AY, UK
Tel: (44) 20 7332 0221
Fax: (44) 20 7332 0302
New York Maybank Kim Eng Securities USA
Inc
400 Park Avenue, 11th Floor
New York, New York 10022,
U.S.A.
Tel: (212) 688 8886
Fax: (212) 688 3500
Stockbroking Business:
Level 8, Tower C, Dataran Maybank,
No.1, Jalan Maarof
59000 Kuala Lumpur
Tel: (603) 2297 8888
Fax: (603) 2282 5136
Hong Kong Kim Eng Securities (HK) Ltd
28/F, Lee Garden Three,
1 Sunning Road, Causeway Bay,
Hong Kong
Tel: (852) 2268 0800
Fax: (852) 2877 0104
Indonesia PT Maybank Kim Eng Securities
Sentral Senayan III, 22nd Floor
Jl. Asia Afrika No. 8
Gelora Bung Karno, Senayan
Jakarta 10270, Indonesia
Tel: (62) 21 2557 1188
Fax: (62) 21 2557 1189
India Kim Eng Securities India Pvt Ltd
1101, 11th floor, A Wing, Kanakia
Wall Street, Chakala, Andheri -
Kurla Road, Andheri East,
Mumbai City - 400 093, India
Tel: (91) 22 6623 2600
Fax: (91) 22 6623 2604
Philippines Maybank ATR Kim Eng Securities Inc.
17/F, Tower One & Exchange Plaza
Ayala Triangle, Ayala Avenue
Makati City, Philippines 1200
Tel: (63) 2 8849 8888
Fax: (63) 2 8848 5738
Thailand Maybank Kim Eng Securities
(Thailand) Public Company Limited
999/9 The Offices at Central World,
20th - 21st Floor,
Rama 1 Road Pathumwan,
Bangkok 10330, Thailand
Tel: (66) 2 658 6817 (sales)
Tel: (66) 2 658 6801 (research)
Vietnam Maybank Kim Eng Securities Limited
4A-15+16 Floor Vincom Center Dong
Khoi, 72 Le Thanh Ton St. District 1
Ho Chi Minh City, Vietnam
Tel : (84) 844 555 888
Fax : (84) 8 38 271 030
Saudi Arabia In association with
Anfaal Capital
Ground Floor, KANOO Building
No.1 - Al-Faisaliyah,Madina Road,
P.O.Box 126575 Jeddah 21352
Kingdom of Saudi Arabia
Tel: (966) 920023423
Sales Trading Kevin Foy
Regional Head Sales Trading
Tel: (65) 6636-3620
US Toll Free: 1-866-406-7447
Indonesia Iwan Atmadjaja [email protected] (62) 21 8066 8555
London Greg Smith [email protected] Tel: (44) 207-332-0221
New York James Lynch [email protected] Tel: (212) 688 8886
India Sanjay Makhija [email protected] Tel: (91)-22-6623-2629
Philippines Keith Roy [email protected] Tel: (63) 2 848-5288
www.maybank-ke.com | www.maybank-keresearch.com