0.85 175 statistics 52w high/low (sgd) 0.80 hold 0.69/0.53 165
TRANSCRIPT
0.64
May 31, 2021
Technolo
gy
Sin
gapore
THIS REPORT HAS BEEN PREPARED BY MAYBANK KIM ENG RESEARCH
SEE PAGE 9 FOR IMPORTANT DISCLOSURES AND ANALYST CERTIFICATIONS
Co. Reg No: 198700034E MICA (P) : 099/03/2012
Tear Sheet Insert
Gene Lih Lai, CFA [email protected] (65) 6231 5832
Valuetronics (VALUE SP)
Bottom may be nearing
2HFY21 beat, but expect challenging FY22E; HOLD
VALUE’s 2HFY21 PATMI of HKD95.6m (+28% YoY) was ahead of our
estimates, largely due to stronger than expected ICE momentum in
4QFY21. Although VALUE expects FY22 to be more challenging than FY21,
we raise FY22-23E EPS by 10-13%, as we believe the worst of customer
allocation losses may be over. Our TP of SGD0.60 is based on 10.6x FY22E
P/E (30% discount to SG-peers), from 10x blended FY21-22E previously.
Maintain HOLD.
ICE strength offset CE weakness in 2HFY21
Revenue rose 20.2% YoY to HKD1.19b, as industrial and commercial
electronics (ICE) rose 36% YoY, benefitting from logistics and printing
customers on the back of the Covid-19 driven e-commerce boom. This was
also aided by the delayed switch over of the automotive customer to a
new vendor for the US allocation of products. In contrast, consumer
electronics (CE) was affected by the customer’s switch over to another
supplier in ASEAN for its US-allocation, as well as weaker end-market sales.
Gross margin improved 1ppt YoY to 16.9% due to favourable shift in product
mix.
Worst of allocation losses could be over
VALUE is expecting significantly lower FY22E performance on the back of:
i) full effects from the loss of allocation from an automotive customer, ii)
Covid-19 driven demand uncertainty; and iii) components shortage and
rising components prices. With strong customer satisfaction and VALUE’s
expansion in Vietnam, we think the worst of customer allocation losses
could be over, and this is reflected in our increase of FY22-23E EPS.
Vietnam expansion on track
The construction of the Vietnam campus remains on track, and VALUE
expects mass production to begin in 4QFY22. VALUE remains confident that
Vietnam is an important long-term growth driver, as this allows it to be a
regional player; we see this as an important proposition in courting new
customers. We continue to view that a return to growth would be a key
catalyst for the stock to re-rate given still lingering uncertainties from
components shortages and Covid-19 demand risk.
Share Price SGD 0.64
12m Price Target SGD 0.60 (-3%)
Previous Price Target SGD 0.58
HOLD
Company Description
Statistics
52w high/low (SGD)
3m avg turnover (USDm)
Free float (%)
Issued shares (m)
Market capitalisation
Major shareholders:
17.5%
7.4%
5.0%
434
0.6
Valuetronics is a HK based electronics manufacturing
services provider with two facilities in China.
TSE CHONG HING
CHOW KOK KIT
HSBC Global Asset Management (Hong Kong)
0.69/0.53
70.7
SGD277.8M
USD210M
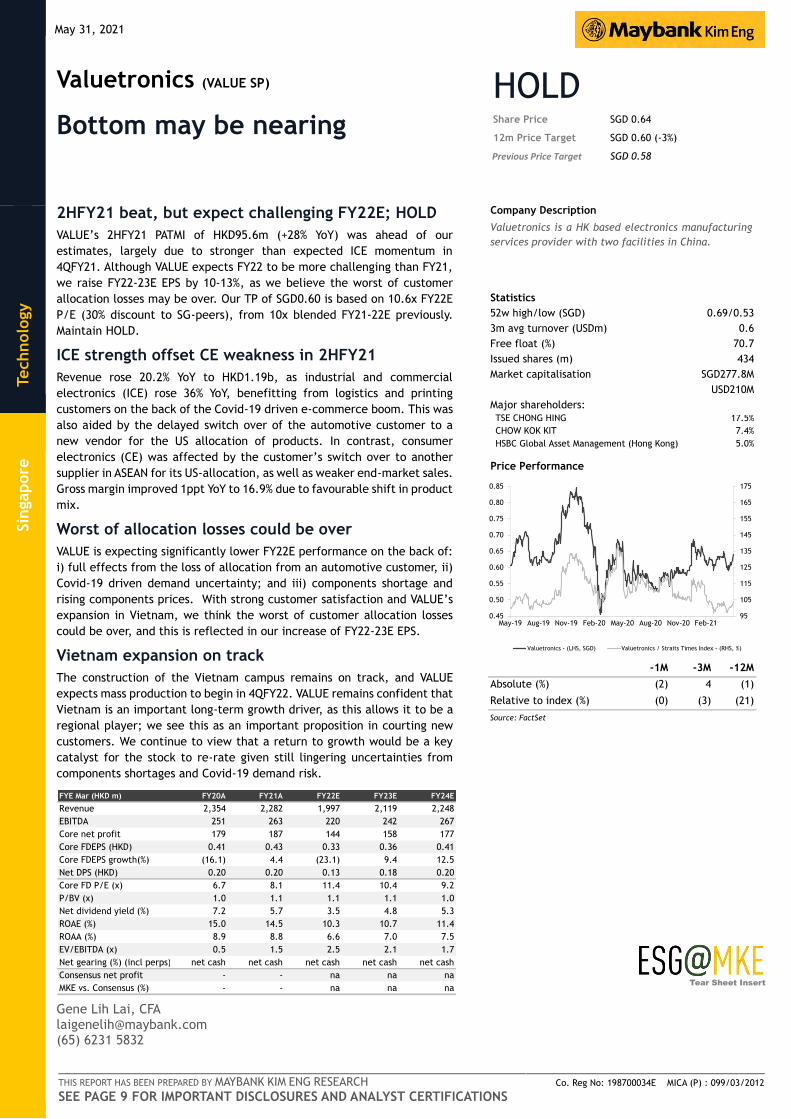
Price Performance
95
105
115
125
135
145
155
165
175
0.45
0.50
0.55
0.60
0.65
0.70
0.75
0.80
0.85
May-19 Aug-19 Nov-19 Feb-20 May-20 Aug-20 Nov-20 Feb-21
Valuetronics - (LHS, SGD) Valuetronics / Straits Times Index - (RHS, %)
-1M -3M -12M
Absolute (%) (2) 4 (1)
Relative to index (%) (0) (3) (21)
Source: FactSet
FYE Mar (HKD m) FY20A FY21A FY22E FY23E FY24E
Revenue 2,354 2,282 1,997 2,119 2,248
EBITDA 251 263 220 242 267
Core net profit 179 187 144 158 177
Core FDEPS (HKD) 0.41 0.43 0.33 0.36 0.41
Core FDEPS growth(%) (16.1) 4.4 (23.1) 9.4 12.5
Net DPS (HKD) 0.20 0.20 0.13 0.18 0.20
Core FD P/E (x) 6.7 8.1 11.4 10.4 9.2
P/BV (x) 1.0 1.1 1.1 1.1 1.0
Net dividend yield (%) 7.2 5.7 3.5 4.8 5.3
ROAE (%) 15.0 14.5 10.3 10.7 11.4
ROAA (%) 8.9 8.8 6.6 7.0 7.5
EV/EBITDA (x) 0.5 1.5 2.5 2.1 1.7
Net gearing (%) (incl perps) net cash net cash net cash net cash net cash
Consensus net profit - - na na na
MKE vs. Consensus (%) - - na na na
May 31, 2021 2
Valuetronics
Value Proposition
An EMS company that manufactures products, such as IOT
bulbs and in-car connectivity modules, which are in the early
part of their product life cycles.
For certain high mix, low-volume projects, VALUE receives
lump-sum pricing, which tend to have better margins. High-
mix products make up half of revenues.
Strengths are design-for-manufacturing and flexibility in
adapting to timing and production needs of customers.
Consistently delivered double-digit ROEs.
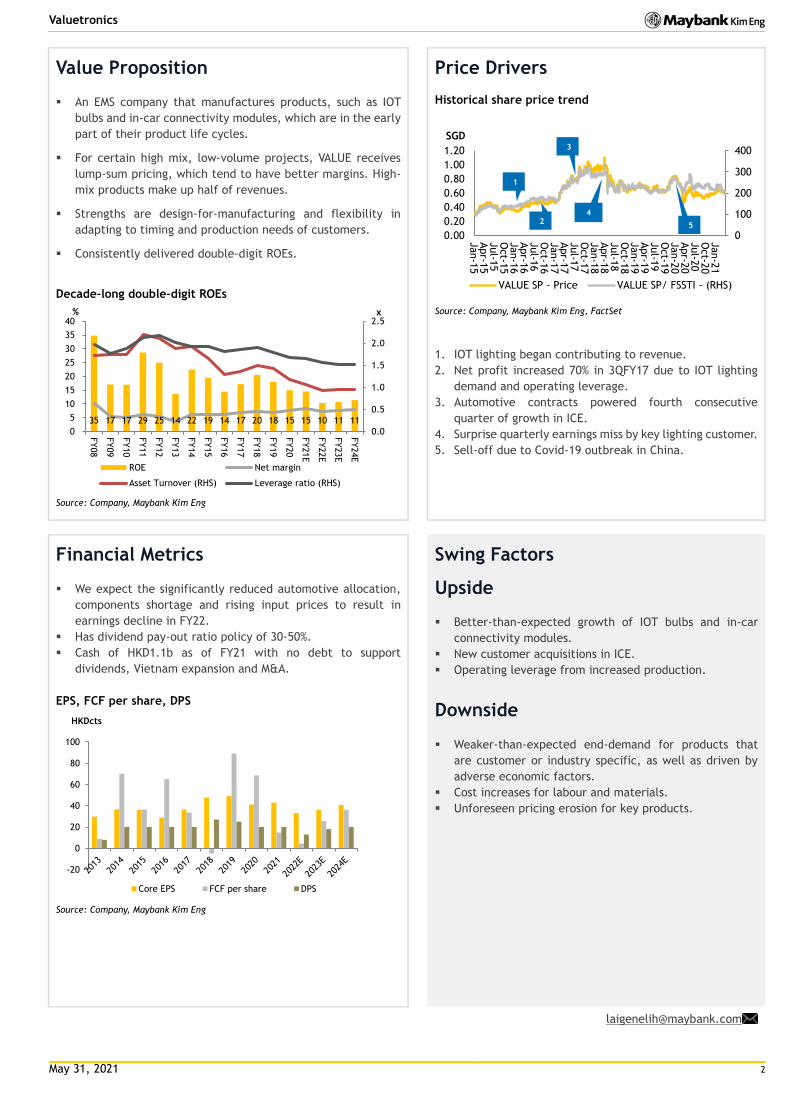
Decade-long double-digit ROEs
Source: Company, Maybank Kim Eng
Price Drivers
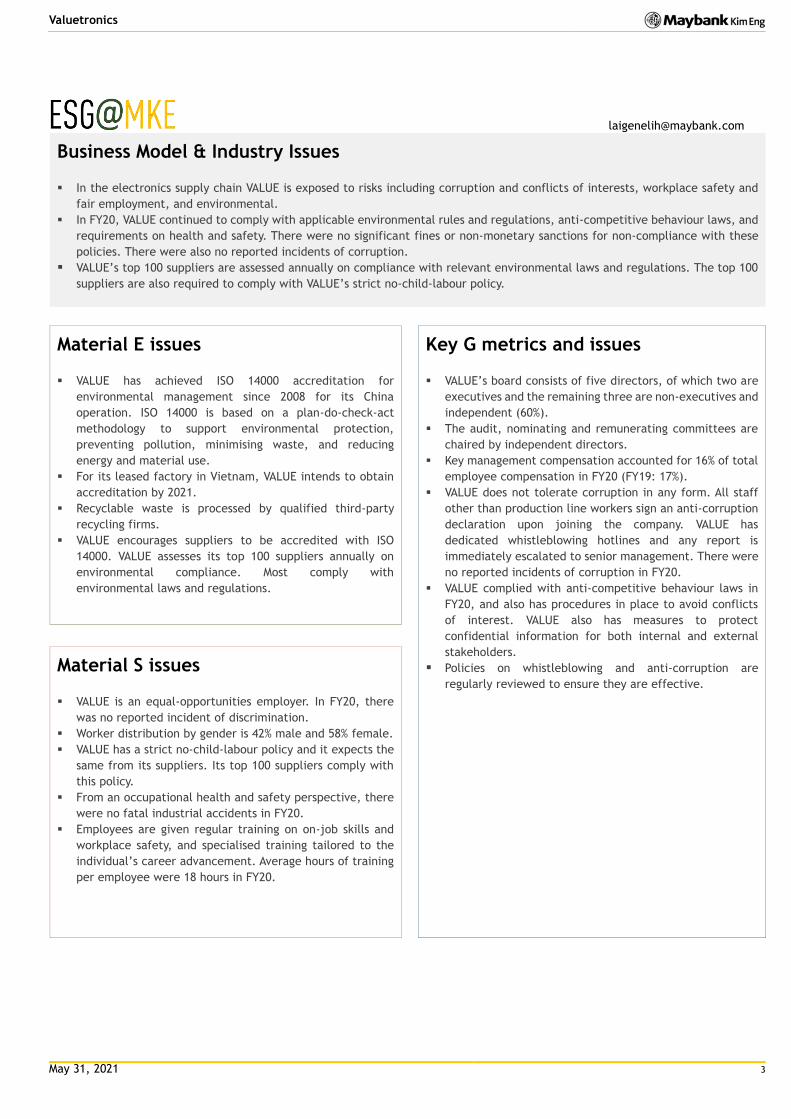
Historical share price trend
Source: Company, Maybank Kim Eng, FactSet
1. IOT lighting began contributing to revenue.
2. Net profit increased 70% in 3QFY17 due to IOT lighting
demand and operating leverage.
3. Automotive contracts powered fourth consecutive
quarter of growth in ICE.
4. Surprise quarterly earnings miss by key lighting customer.
5. Sell-off due to Covid-19 outbreak in China.
Financial Metrics
We expect the significantly reduced automotive allocation,
components shortage and rising input prices to result in
earnings decline in FY22.
Has dividend pay-out ratio policy of 30-50%.
Cash of HKD1.1b as of FY21 with no debt to support
dividends, Vietnam expansion and M&A.
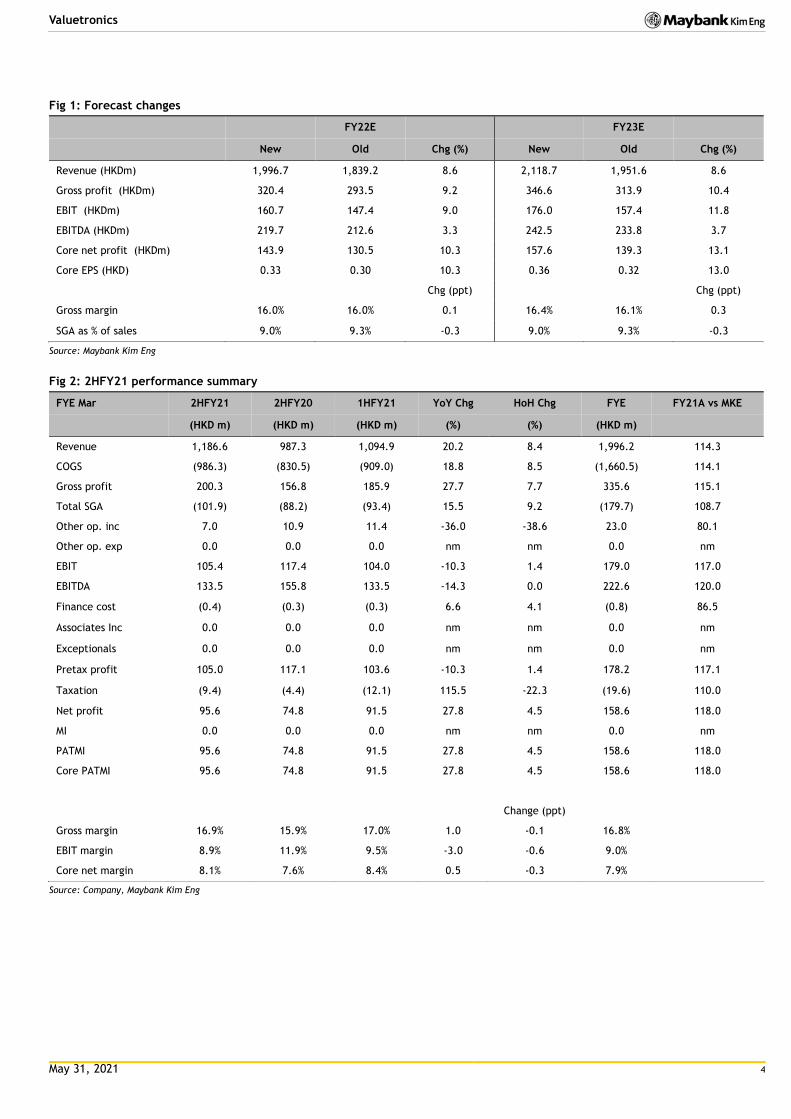
EPS, FCF per share, DPS
Source: Company, Maybank Kim Eng
Swing Factors
Upside
Better-than-expected growth of IOT bulbs and in-car
connectivity modules.
New customer acquisitions in ICE.
Operating leverage from increased production.
Downside
Weaker-than-expected end-demand for products that
are customer or industry specific, as well as driven by
adverse economic factors.
Cost increases for labour and materials.
Unforeseen pricing erosion for key products.
35 17 17 29 25 14 22 19 14 17 20 18 15 15 10 11 11
0.0
0.5
1.0
1.5
2.0
2.5
0
5
10
15
20
25
30
35
40
FY08
FY09
FY10
FY11
FY12
FY13
FY14
FY15
FY16
FY17
FY18
FY19
FY20
FY21E
FY22E
FY23E
FY24E
x%
ROE Net margin
Asset Turnover (RHS) Leverage ratio (RHS)
0
100
200
300
400
0.00
0.20
0.40
0.60
0.80
1.00
1.20
Jan-1
5Apr-1
5Jul-1
5O
ct-1
5Jan-1
6Apr-1
6Jul-1
6O
ct-1
6Jan-1
7Apr-1
7Jul-1
7O
ct-1
7Jan-1
8Apr-1
8Jul-1
8O
ct-1
8Jan-1
9Apr-1
9Jul-1
9O
ct-1
9Jan-2
0Apr-2
0Jul-2
0O
ct-2
0Jan-2
1
SGD
VALUE SP - Price VALUE SP/ FSSTI - (RHS)
-20
0
20
40
60
80
100
HKDcts
Core EPS FCF per share DPS
1
2
3
4
5
May 31, 2021 3
Valuetronics
Business Model & Industry Issues
In the electronics supply chain VALUE is exposed to risks including corruption and conflicts of interests, workplace safety and
fair employment, and environmental.
In FY20, VALUE continued to comply with applicable environmental rules and regulations, anti-competitive behaviour laws, and
requirements on health and safety. There were no significant fines or non-monetary sanctions for non-compliance with these
policies. There were also no reported incidents of corruption.
VALUE’s top 100 suppliers are assessed annually on compliance with relevant environmental laws and regulations. The top 100
suppliers are also required to comply with VALUE’s strict no-child-labour policy.
Material E issues
VALUE has achieved ISO 14000 accreditation for
environmental management since 2008 for its China
operation. ISO 14000 is based on a plan-do-check-act
methodology to support environmental protection,
preventing pollution, minimising waste, and reducing
energy and material use.
For its leased factory in Vietnam, VALUE intends to obtain
accreditation by 2021.
Recyclable waste is processed by qualified third-party
recycling firms.
VALUE encourages suppliers to be accredited with ISO
14000. VALUE assesses its top 100 suppliers annually on
environmental compliance. Most comply with
environmental laws and regulations.
Key G metrics and issues
VALUE’s board consists of five directors, of which two are
executives and the remaining three are non-executives and
independent (60%).
The audit, nominating and remunerating committees are
chaired by independent directors.
Key management compensation accounted for 16% of total
employee compensation in FY20 (FY19: 17%).
VALUE does not tolerate corruption in any form. All staff
other than production line workers sign an anti-corruption
declaration upon joining the company. VALUE has
dedicated whistleblowing hotlines and any report is
immediately escalated to senior management. There were
no reported incidents of corruption in FY20.
VALUE complied with anti-competitive behaviour laws in
FY20, and also has procedures in place to avoid conflicts
of interest. VALUE also has measures to protect
confidential information for both internal and external
stakeholders.
Policies on whistleblowing and anti-corruption are
regularly reviewed to ensure they are effective.
Material S issues
VALUE is an equal-opportunities employer. In FY20, there
was no reported incident of discrimination.
Worker distribution by gender is 42% male and 58% female.
VALUE has a strict no-child-labour policy and it expects the
same from its suppliers. Its top 100 suppliers comply with
this policy.
From an occupational health and safety perspective, there
were no fatal industrial accidents in FY20.
Employees are given regular training on on-job skills and
workplace safety, and specialised training tailored to the
individual’s career advancement. Average hours of training
per employee were 18 hours in FY20.
May 31, 2021 4
Valuetronics
Fig 1: Forecast changes
FY22E FY23E
New Old Chg (%) New Old Chg (%)
Revenue (HKDm) 1,996.7 1,839.2 8.6 2,118.7 1,951.6 8.6
Gross profit (HKDm) 320.4 293.5 9.2 346.6 313.9 10.4
EBIT (HKDm) 160.7 147.4 9.0 176.0 157.4 11.8
EBITDA (HKDm) 219.7 212.6 3.3 242.5 233.8 3.7
Core net profit (HKDm) 143.9 130.5 10.3 157.6 139.3 13.1
Core EPS (HKD) 0.33 0.30 10.3 0.36 0.32 13.0
Chg (ppt)
Chg (ppt)
Gross margin 16.0% 16.0% 0.1 16.4% 16.1% 0.3
SGA as % of sales 9.0% 9.3% -0.3 9.0% 9.3% -0.3
Source: Maybank Kim Eng
Fig 2: 2HFY21 performance summary
FYE Mar 2HFY21 2HFY20 1HFY21 YoY Chg HoH Chg FYE FY21A vs MKE
(HKD m) (HKD m) (HKD m) (%) (%) (HKD m)
Revenue 1,186.6 987.3 1,094.9 20.2 8.4 1,996.2 114.3
COGS (986.3) (830.5) (909.0) 18.8 8.5 (1,660.5) 114.1
Gross profit 200.3 156.8 185.9 27.7 7.7 335.6 115.1
Total SGA (101.9) (88.2) (93.4) 15.5 9.2 (179.7) 108.7
Other op. inc 7.0 10.9 11.4 -36.0 -38.6 23.0 80.1
Other op. exp 0.0 0.0 0.0 nm nm 0.0 nm
EBIT 105.4 117.4 104.0 -10.3 1.4 179.0 117.0
EBITDA 133.5 155.8 133.5 -14.3 0.0 222.6 120.0
Finance cost (0.4) (0.3) (0.3) 6.6 4.1 (0.8) 86.5
Associates Inc 0.0 0.0 0.0 nm nm 0.0 nm
Exceptionals 0.0 0.0 0.0 nm nm 0.0 nm
Pretax profit 105.0 117.1 103.6 -10.3 1.4 178.2 117.1
Taxation (9.4) (4.4) (12.1) 115.5 -22.3 (19.6) 110.0
Net profit 95.6 74.8 91.5 27.8 4.5 158.6 118.0
MI 0.0 0.0 0.0 nm nm 0.0 nm
PATMI 95.6 74.8 91.5 27.8 4.5 158.6 118.0
Core PATMI 95.6 74.8 91.5 27.8 4.5 158.6 118.0
Change (ppt)
Gross margin 16.9% 15.9% 17.0% 1.0 -0.1 16.8%
EBIT margin 8.9% 11.9% 9.5% -3.0 -0.6 9.0%
Core net margin 8.1% 7.6% 8.4% 0.5 -0.3 7.9%
Source: Company, Maybank Kim Eng
May 31, 2021 5
Valuetronics
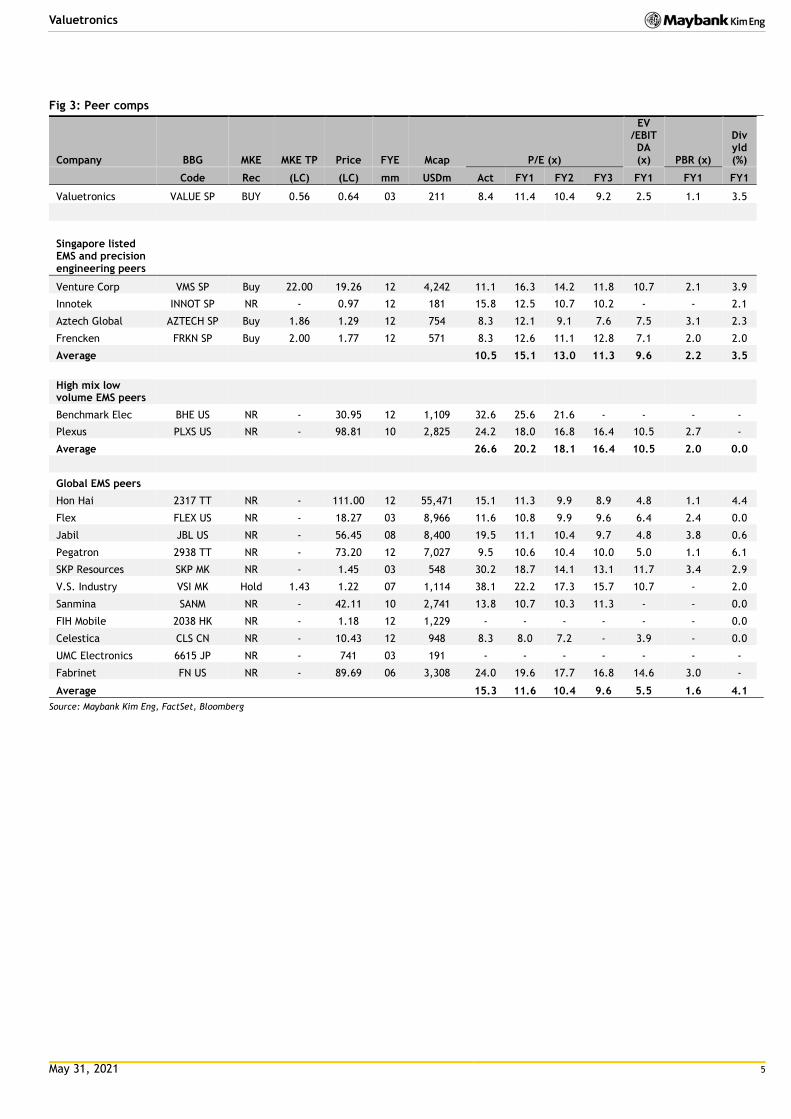
Fig 3: Peer comps
Company BBG MKE MKE TP Price FYE Mcap P/E (x)
EV /EBITDA (x) PBR (x)
Div yld (%)
Code Rec (LC) (LC) mm USDm Act FY1 FY2 FY3 FY1 FY1 FY1
Valuetronics VALUE SP BUY 0.56 0.64 03 211 8.4 11.4 10.4 9.2 2.5 1.1 3.5
Singapore listed EMS and precision engineering peers
Venture Corp VMS SP Buy 22.00 19.26 12 4,242 11.1 16.3 14.2 11.8 10.7 2.1 3.9
Innotek INNOT SP NR - 0.97 12 181 15.8 12.5 10.7 10.2 - - 2.1
Aztech Global AZTECH SP Buy 1.86 1.29 12 754 8.3 12.1 9.1 7.6 7.5 3.1 2.3
Frencken FRKN SP Buy 2.00 1.77 12 571 8.3 12.6 11.1 12.8 7.1 2.0 2.0
Average 10.5 15.1 13.0 11.3 9.6 2.2 3.5
High mix low volume EMS peers
Benchmark Elec BHE US NR - 30.95 12 1,109 32.6 25.6 21.6 - - - -
Plexus PLXS US NR - 98.81 10 2,825 24.2 18.0 16.8 16.4 10.5 2.7 -
Average 26.6 20.2 18.1 16.4 10.5 2.0 0.0
Global EMS peers
Hon Hai 2317 TT NR - 111.00 12 55,471 15.1 11.3 9.9 8.9 4.8 1.1 4.4
Flex FLEX US NR - 18.27 03 8,966 11.6 10.8 9.9 9.6 6.4 2.4 0.0
Jabil JBL US NR - 56.45 08 8,400 19.5 11.1 10.4 9.7 4.8 3.8 0.6
Pegatron 2938 TT NR - 73.20 12 7,027 9.5 10.6 10.4 10.0 5.0 1.1 6.1
SKP Resources SKP MK NR - 1.45 03 548 30.2 18.7 14.1 13.1 11.7 3.4 2.9
V.S. Industry VSI MK Hold 1.43 1.22 07 1,114 38.1 22.2 17.3 15.7 10.7 - 2.0
Sanmina SANM NR - 42.11 10 2,741 13.8 10.7 10.3 11.3 - - 0.0
FIH Mobile 2038 HK NR - 1.18 12 1,229 - - - - - - 0.0
Celestica CLS CN NR - 10.43 12 948 8.3 8.0 7.2 - 3.9 - 0.0
UMC Electronics 6615 JP NR - 741 03 191 - - - - - - -
Fabrinet FN US NR - 89.69 06 3,308 24.0 19.6 17.7 16.8 14.6 3.0 -
Average 15.3 11.6 10.4 9.6 5.5 1.6 4.1
Source: Maybank Kim Eng, FactSet, Bloomberg
May 31, 2021 6
Valuetronics
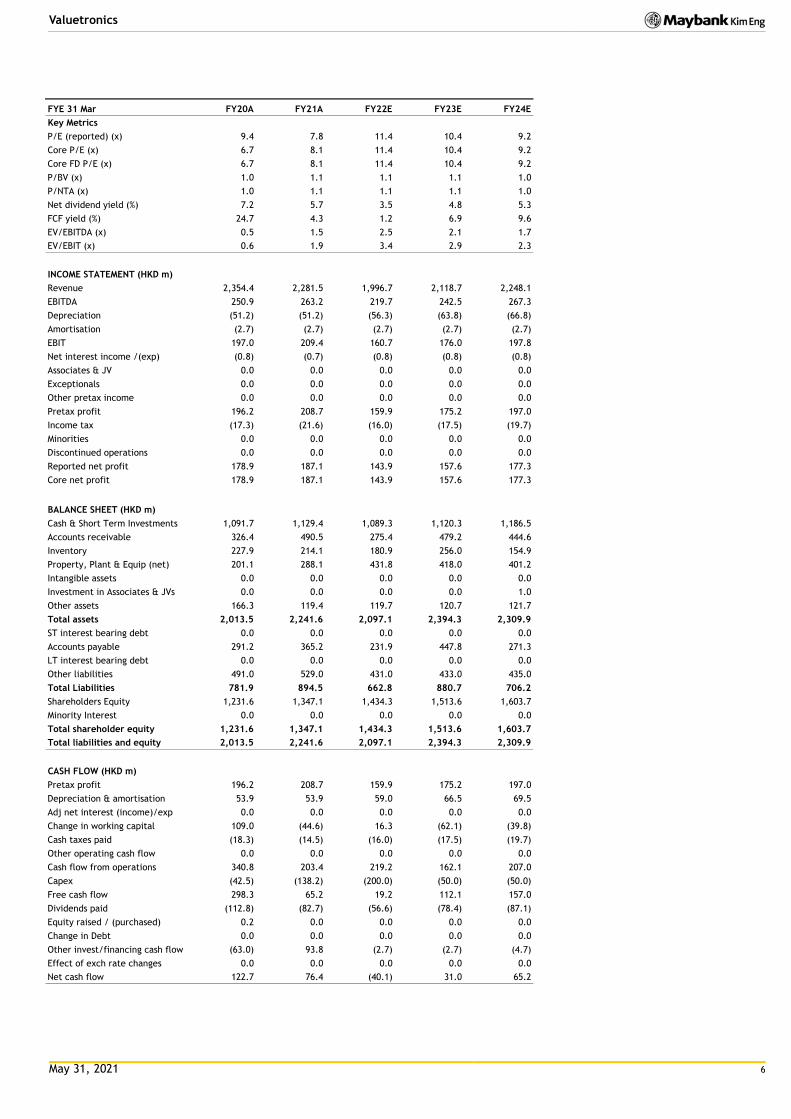
FYE 31 Mar FY20A FY21A FY22E FY23E FY24E
Key Metrics
P/E (reported) (x) 9.4 7.8 11.4 10.4 9.2
Core P/E (x) 6.7 8.1 11.4 10.4 9.2
Core FD P/E (x) 6.7 8.1 11.4 10.4 9.2
P/BV (x) 1.0 1.1 1.1 1.1 1.0
P/NTA (x) 1.0 1.1 1.1 1.1 1.0
Net dividend yield (%) 7.2 5.7 3.5 4.8 5.3
FCF yield (%) 24.7 4.3 1.2 6.9 9.6
EV/EBITDA (x) 0.5 1.5 2.5 2.1 1.7
EV/EBIT (x) 0.6 1.9 3.4 2.9 2.3
INCOME STATEMENT (HKD m)
Revenue 2,354.4 2,281.5 1,996.7 2,118.7 2,248.1
EBITDA 250.9 263.2 219.7 242.5 267.3
Depreciation (51.2) (51.2) (56.3) (63.8) (66.8)
Amortisation (2.7) (2.7) (2.7) (2.7) (2.7)
EBIT 197.0 209.4 160.7 176.0 197.8
Net interest income /(exp) (0.8) (0.7) (0.8) (0.8) (0.8)
Associates & JV 0.0 0.0 0.0 0.0 0.0
Exceptionals 0.0 0.0 0.0 0.0 0.0
Other pretax income 0.0 0.0 0.0 0.0 0.0
Pretax profit 196.2 208.7 159.9 175.2 197.0
Income tax (17.3) (21.6) (16.0) (17.5) (19.7)
Minorities 0.0 0.0 0.0 0.0 0.0
Discontinued operations 0.0 0.0 0.0 0.0 0.0
Reported net profit 178.9 187.1 143.9 157.6 177.3
Core net profit 178.9 187.1 143.9 157.6 177.3
BALANCE SHEET (HKD m)
Cash & Short Term Investments 1,091.7 1,129.4 1,089.3 1,120.3 1,186.5
Accounts receivable 326.4 490.5 275.4 479.2 444.6
Inventory 227.9 214.1 180.9 256.0 154.9
Property, Plant & Equip (net) 201.1 288.1 431.8 418.0 401.2
Intangible assets 0.0 0.0 0.0 0.0 0.0
Investment in Associates & JVs 0.0 0.0 0.0 0.0 1.0
Other assets 166.3 119.4 119.7 120.7 121.7
Total assets 2,013.5 2,241.6 2,097.1 2,394.3 2,309.9
ST interest bearing debt 0.0 0.0 0.0 0.0 0.0
Accounts payable 291.2 365.2 231.9 447.8 271.3
LT interest bearing debt 0.0 0.0 0.0 0.0 0.0
Other liabilities 491.0 529.0 431.0 433.0 435.0
Total Liabilities 781.9 894.5 662.8 880.7 706.2
Shareholders Equity 1,231.6 1,347.1 1,434.3 1,513.6 1,603.7
Minority Interest 0.0 0.0 0.0 0.0 0.0
Total shareholder equity 1,231.6 1,347.1 1,434.3 1,513.6 1,603.7
Total liabilities and equity 2,013.5 2,241.6 2,097.1 2,394.3 2,309.9
CASH FLOW (HKD m)
Pretax profit 196.2 208.7 159.9 175.2 197.0
Depreciation & amortisation 53.9 53.9 59.0 66.5 69.5
Adj net interest (income)/exp 0.0 0.0 0.0 0.0 0.0
Change in working capital 109.0 (44.6) 16.3 (62.1) (39.8)
Cash taxes paid (18.3) (14.5) (16.0) (17.5) (19.7)
Other operating cash flow 0.0 0.0 0.0 0.0 0.0
Cash flow from operations 340.8 203.4 219.2 162.1 207.0
Capex (42.5) (138.2) (200.0) (50.0) (50.0)
Free cash flow 298.3 65.2 19.2 112.1 157.0
Dividends paid (112.8) (82.7) (56.6) (78.4) (87.1)
Equity raised / (purchased) 0.2 0.0 0.0 0.0 0.0
Change in Debt 0.0 0.0 0.0 0.0 0.0
Other invest/financing cash flow (63.0) 93.8 (2.7) (2.7) (4.7)
Effect of exch rate changes 0.0 0.0 0.0 0.0 0.0
Net cash flow 122.7 76.4 (40.1) 31.0 65.2
May 31, 2021 7
Valuetronics
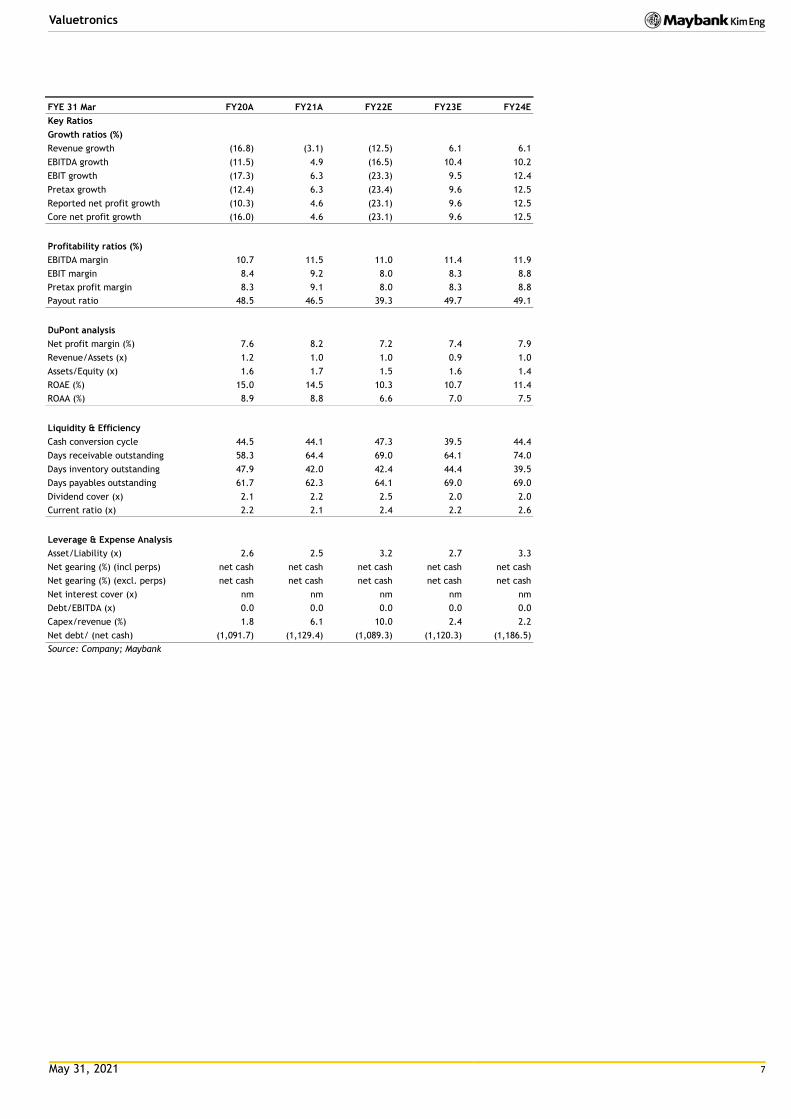
FYE 31 Mar FY20A FY21A FY22E FY23E FY24E
Key Ratios
Growth ratios (%)
Revenue growth (16.8) (3.1) (12.5) 6.1 6.1
EBITDA growth (11.5) 4.9 (16.5) 10.4 10.2
EBIT growth (17.3) 6.3 (23.3) 9.5 12.4
Pretax growth (12.4) 6.3 (23.4) 9.6 12.5
Reported net profit growth (10.3) 4.6 (23.1) 9.6 12.5
Core net profit growth (16.0) 4.6 (23.1) 9.6 12.5
Profitability ratios (%)
EBITDA margin 10.7 11.5 11.0 11.4 11.9
EBIT margin 8.4 9.2 8.0 8.3 8.8
Pretax profit margin 8.3 9.1 8.0 8.3 8.8
Payout ratio 48.5 46.5 39.3 49.7 49.1
DuPont analysis
Net profit margin (%) 7.6 8.2 7.2 7.4 7.9
Revenue/Assets (x) 1.2 1.0 1.0 0.9 1.0
Assets/Equity (x) 1.6 1.7 1.5 1.6 1.4
ROAE (%) 15.0 14.5 10.3 10.7 11.4
ROAA (%) 8.9 8.8 6.6 7.0 7.5
Liquidity & Efficiency
Cash conversion cycle 44.5 44.1 47.3 39.5 44.4
Days receivable outstanding 58.3 64.4 69.0 64.1 74.0
Days inventory outstanding 47.9 42.0 42.4 44.4 39.5
Days payables outstanding 61.7 62.3 64.1 69.0 69.0
Dividend cover (x) 2.1 2.2 2.5 2.0 2.0
Current ratio (x) 2.2 2.1 2.4 2.2 2.6
Leverage & Expense Analysis
Asset/Liability (x) 2.6 2.5 3.2 2.7 3.3
Net gearing (%) (incl perps) net cash net cash net cash net cash net cash
Net gearing (%) (excl. perps) net cash net cash net cash net cash net cash
Net interest cover (x) nm nm nm nm nm
Debt/EBITDA (x) 0.0 0.0 0.0 0.0 0.0
Capex/revenue (%) 1.8 6.1 10.0 2.4 2.2
Net debt/ (net cash) (1,091.7) (1,129.4) (1,089.3) (1,120.3) (1,186.5)
Source: Company; Maybank
May 31, 2021 8
Valuetronics
Research Offices
ECONOMICS
Suhaimi ILIAS Chief Economist Malaysia | Philippines | Global (603) 2297 8682 [email protected]
CHUA Hak Bin Regional Thematic Macroeconomist (65) 6231 5830 [email protected]
LEE Ju Ye Singapore | Thailand | Indonesia (65) 6231 5844 [email protected]
Linda LIU Singapore | Vietnam | Cambodia | Myanmar | Laos (65) 6231 5847 [email protected]
Dr Zamros DZULKAFLI (603) 2082 6818 [email protected]
Ramesh LANKANATHAN (603) 2297 8685 [email protected]
FX
Saktiandi SUPAAT Head of FX Research (65) 6320 1379 [email protected]
Christopher WONG (65) 6320 1347 [email protected]
TAN Yanxi (65) 6320 1378 [email protected]
Fiona LIM (65) 6320 1374 [email protected]
STRATEGY
Anand PATHMAKANTHAN
ASEAN (603) 2297 8783 [email protected]
FIXED INCOME
Winson PHOON, ACA (65) 6340 1079 [email protected]
SE THO Mun Yi (603) 2074 7606 [email protected]
REGIONAL EQUITIES
Anand PATHMAKANTHAN Head of Regional Equity Research (603) 2297 8783 [email protected]
WONG Chew Hann, CA Head of ASEAN Equity Research (603) 2297 8686 [email protected]
ONG Seng Yeow Research, Technology & Innovation (65) 6231 5839 [email protected]
MALAYSIA
Anand PATHMAKANTHAN Head of Research (603) 2297 8783 [email protected] • Strategy
Desmond CH’NG, BFP, FCA (603) 2297 8680 [email protected] • Banking & Finance
LIAW Thong Jung (603) 2297 8688 [email protected] • Oil & Gas Services- Regional • Automotive
ONG Chee Ting, CA (603) 2297 8678 [email protected] • Plantations - Regional
YIN Shao Yang, CPA (603) 2297 8916 [email protected] • Gaming – Regional • Media • Aviation
TAN Chi Wei, CFA (603) 2297 8690 [email protected] • Power • Telcos
WONG Wei Sum, CFA (603) 2297 8679 [email protected] • Property
LEE Yen Ling (603) 2297 8691 [email protected] • Glove • Ports • Shipping • Healthcare • Petrochemicals
Kevin WONG (603) 2082 6824 [email protected] • REITs • Technology
Jade TAM (603) 2297 8687 [email protected] • Consumer Staples & Discretionary
Fahmi FARID (603) 2297 8676 [email protected] • Software
TEE Sze Chiah Head of Retail Research (603) 2082 6858 [email protected]
Nik Ihsan RAJA ABDULLAH, MSTA, CFTe (603) 2297 8694 [email protected] • Chartist
Amirah AZMI (603) 2082 8769 [email protected] • Retail Research
SINGAPORE
Thilan WICKRAMASINGHE Head of Research (65) 6231 5840 [email protected] • Banking & Finance - Regional • Consumer
CHUA Su Tye (65) 6231 5842 [email protected] • REITs - Regional
LAI Gene Lih, CFA (65) 6231 5832 [email protected] • Technology • Healthcare
Kareen CHAN (65) 6231 5926 [email protected] • Transport • Telcos • Consumer
Eric ONG (65) 6231 5924 [email protected]
• SMIDs
Matthew SHIM (65) 6231 5929 [email protected] • Retail Research
PHILIPPINES
Jacqui De JESUS Head of Research (63) 2 8849 8844 [email protected] • Strategy • Conglomerates
Romel LIBO-ON (63) 2 8849 8844 [email protected] • Property • Telcos
Rachelleen RODRIGUEZ, CFA (63) 2 8849 8843 [email protected] • Banking & Finance • Transport
VIETNAM
Quan Trong Thanh Head of Research (84 28) 44 555 888 ext 8184 [email protected] • Banks
Hoang Huy, CFA (84 28) 44 555 888 ext 8181 [email protected] • Strategy • Technology
Le Nguyen Nhat Chuyen (84 28) 44 555 888 ext 8082 [email protected] • Oil & Gas
Nguyen Thi Sony Tra Mi (84 28) 44 555 888 ext 8084 [email protected] • Consumer
Tyler Manh Dung Nguyen (84 28) 44 555 888 ext 8085 [email protected] • Utilities • Property
Tran Thi Thu Thao (84 28) 44 555 888 ext 8180 [email protected] • Industrials
Nguyen Thi Ngan Tuyen Head of Retail Research (84 28) 44 555 888 ext 8081 [email protected] • Retail Research
Nguyen Thanh Lam (84 28) 44 555 888 ext 8086 [email protected] • Technical Analysis
INDIA
Jigar SHAH Head of Research (91) 22 4223 2632 [email protected] • Strategy • Oil & Gas • Automobile • Cement
Neerav DALAL (91) 22 4223 2606 [email protected] • Software Technology • Telcos
Kshitiz PRASAD (91) 22 4223 2607 [email protected] • Banks
Vikram RAMALINGAM (91) 22 4223 2607 [email protected] • Automobile • Media
INDONESIA
Isnaputra ISKANDAR Head of Research (62) 21 8066 8680 [email protected] • Strategy • Metals & Mining • Cement • Autos • Consumer • Utility
Rahmi MARINA (62) 21 8066 8689 [email protected] • Banking & Finance
Willy GOUTAMA (62) 21 8066 8500 [email protected] • Consumer
THAILAND
Maria LAPIZ Head of Institutional Research Dir (66) 2257 0250 | (66) 2658 6300 ext 1399 [email protected] • Strategy • Consumer • Materials • Services
Jesada TECHAHUSDIN, CFA (66) 2658 6300 ext 1395 [email protected] • Banking & Finance
Kaushal LADHA, CFA (66) 2658 6300 ext 1392 [email protected] • Oil & Gas – Regional • Petrochemicals - Regional • Utilities
Vanida GEISLER, CPA (66) 2658 6300 ext 1394 [email protected] • Property • REITs
Yuwanee PROMMAPORN (66) 2658 6300 ext 1393 Yuwanee.P @maybank-ke.co.th • Services • Healthcare
Ekachai TARAPORNTIP Head of Retail Research (66) 2658 5000 ext 1530 [email protected]
Surachai PRAMUALCHAROENKIT (66) 2658 5000 ext 1470 [email protected] • Auto • Conmat • Contractor • Steel
Suttatip PEERASUB (66) 2658 5000 ext 1430 [email protected] • Food & Beverage • Commerce
Jaroonpan WATTANAWONG (66) 2658 5000 ext 1404 [email protected] • Transportation • Small cap
Thanatphat SUKSRICHAVALIT (66) 2658 5000 ext 1401 [email protected] • Media • Electronics
Wijit ARAYAPISIT (66) 2658 5000 ext 1450 [email protected] • Strategist
Theerasate PROMPONG (66) 2658 5000 ext 1400 [email protected] • Equity Portfolio Strategist
Apiwat TAVESIRIVATE
(66) 2658 5000 ext 1310
• Chartist and TFEX
May 31, 2021 9
Valuetronics
APPENDIX I: TERMS FOR PROVISION OF REPORT, DISCLAIMERS AND DISCLOSURES
DISCLAIMERS This research report is prepared for general circulation and for information purposes only and under no circumstances should it be considered or intended as an offer to sell or a solicitation of an offer to buy the securities referred to herein. Investors should note that values of such securities, if any, may fluctuate and that each security’s price or value may rise or fall. Opinions or recommendations contained herein are in form of technical ratings and fundamental ratings. Technical ratings may differ from fundamental ratings as technical valuations apply different methodologies and are purely based on price and volume-related information extracted from the relevant jurisdiction’s stock exchange in the equity analysis. Accordingly, investors’ returns may be less than the original sum invested. Past performance is not necessarily a guide to future performance. This report is not intended to provide personal investment advice and does not take into account the specific investment objectives, the financial situation and the particular needs of persons who may receive or read this report. Investors should therefore seek financial, legal and other advice regarding the appropriateness of investing in any securities or the investment strategies discussed or recommended in this report.
The information contained herein has been obtained from sources believed to be reliable but such sources have not been independently verified by Maybank Investment Bank Berhad, its subsidiary and affiliates (collectively, “MKE”) and consequently no representation is made as to the accuracy or completeness of this report by MKE and it should not be relied upon as such. Accordingly, MKE and its officers, directors, associates, connected parties and/or employees (collectively, “Representatives”) shall not be liable for any direct, indirect or consequential losses or damages that may arise from the use or reliance of this report. Any information, opinions or recommendations contained herein are subject to change at any time, without prior notice.
This report may contain forward looking statements which are often but not always identified by the use of words such as “anticipate”, “believe”, “estimate”, “intend”, “plan”, “expect”, “forecast”, “predict” and “project” and statements that an event or result “may”, “will”, “can”, “should”, “could” or “might” occur or be achieved and other similar expressions. Such forward looking statements are based on assumptions made and information currently available to us and are subject to certain risks and uncertainties that could cause the actual results to differ materially from those expressed in any forward looking statements. Readers are cautioned not to place undue relevance on these forward-looking statements. MKE expressly disclaims any obligation to update or revise any such forward looking statements to reflect new information, events or circumstances af ter the date of this publication or to reflect the occurrence of unanticipated events.
MKE and its officers, directors and employees, including persons involved in the preparation or issuance of this report, may, to the extent permitted by law, from time to time participate or invest in financing transactions with the issuer(s) of the securities mentioned in this report, perform services for or solicit business from such issuers, and/or have a position or holding, or other material interest, or effect transactions, in such securities or options thereon, or other investments related thereto. In addition, it may make markets in the securities mentioned in the material presented in this report. One or more directors, officers and/or employees of MKE may be a director of the issue rs of the securities mentioned in this report to the extent permitted by law.
This report is prepared for the use of MKE’s clients and may not be reproduced, altered in any way, transmitted to, copied or distributed to any other party in whole or in part in any form or manner without the prior express written consent of MKE and MKE and its Representatives accepts no liability whatsoever for the actions of third parties in this respect.
This report is not directed to or intended for distribution to or use by any person or entity who is a citizen or resident of or located in any locality, state, country or other jurisdiction where such distribution, publication, availability or use would be contrary to law or regulation. This report is for distribution only under such circumstances as may be permitted by applicable law. The securities described herein may not be eligible for sale in all jurisdictions or to certain categories of investors. Without prejudice to the foregoing, the reader is to note that additional disclaimers, warnings or qualifications may apply based on geographical location of the person or entity receiving this report.
Malaysia Opinions or recommendations contained herein are in the form of technical ratings and fundamental ratings. Technical ratings may differ from fundamental ratings as technical valuations apply different methodologies and are purely based on price and volume-related information extracted from Bursa Malaysia Securities Berhad in the equity analysis.
Singapore This report has been produced as of the date hereof and the information herein may be subject to change. Maybank Kim Eng Research Pte. Ltd. (“Maybank KERPL”) in Singapore has no obligation to update such information for any recipient. For distribution in Singapore, recipients of this report are to contact Maybank KERPL in Singapore in respect of any matters arising from, or in connection with, this report. If the recipient of this report is not an accredited investor, expert investor or institutional investor (as defined under Section 4A of the Singapore Securities and Futures Act), Maybank KERPL shall be legally liable for the contents of this report, with such liability being limited to the extent (if any) as permitted by law.
Thailand Except as specifically permitted, no part of this presentation may be reproduced or distributed in any manner without the prior written permission of Maybank Kim Eng Securities (Thailand) Public Company Limited. Maybank Kim Eng Securities (Thailand) Public Company Limited (“MBKET”) accepts no liability whatsoever for the actions of third parties in this respect.
Due to different characteristics, objectives and strategies of institutional and retail investors, the research products of MBKET Institutional and Reta il Research departments may differ in either recommendation or target price, or both. MBKET reserves the rights to disseminate MBKET Retail Research reports to institutional investors who have requested to receive it. If you are an authorised recipient, you hereby tacitly acknowledge that the research reports from MBKET Retail Research are first produced in Thai and there is a time lag in the release of the translated English version.
The disclosure of the survey result of the Thai Institute of Directors Association (“IOD”) regarding corporate governance is made pursuant to the policy of the Office of the Securities and Exchange Commission. The survey of the IOD is based on the information of a company listed on the Stock Exchange of Thailand and the market for Alternative Investment disclosed to the public and able to be accessed by a general public investor. The result, therefore, is from the perspective of a third party. It is not an evaluation of operation and is not based on inside information. The survey result is as of the date appearing in the Corporate Governance Report of Thai Listed Companies. As a result, the survey may be changed after that date. MBKET does not confirm nor certify the accuracy of such survey result.
The disclosure of the Anti-Corruption Progress Indicators of a listed company on the Stock Exchange of Thailand, which is assessed by Thaipat Institute, is made in order to comply with the policy and sustainable development plan for the listed companies of the Office of the Securities and Exchange Commission. Tha ipat Institute made this assessment based on the information received from the listed company, as stipulated in the form for the assessment of Anti-corruption which refers to the Annual Registration Statement (Form 56-1), Annual Report (Form 56-2), or other relevant documents or reports of such listed company. The assessment result is therefore made from the perspective of Thaipat Institute that is a third party. It is not an assessment of operation and is not based on any inside information. Since this assessment is only the assessment result as of the date appearing in the assessment result, it may be changed after that date or when there is any change to the relevant information. Nevertheless, MBKET does not confirm, verify, or certify the accuracy and completeness of the assessment result.
US This third-party research report is distributed in the United States (“US”) to Major US Institutional Investors (as defined in Rule 15a-6 under the Securities Exchange Act of 1934, as amended) only by Maybank Kim Eng Securities USA Inc (“Maybank KESUSA”), a broker-dealer registered in the US (registered under Section 15 of the Securities Exchange Act of 1934, as amended). All responsibility for the distribution of this report by Maybank KESUSA in the US shall be borne by Maybank KESUSA. This report is not directed at you if MKE is prohibited or restricted by any legislation or regulation in any jurisdiction from making it available to you. You should satisfy yourself before reading it that Maybank KESUSA is permitted to provide research material concerning investments to you under relevant legislation and regulations. All U.S. persons receiving and/or accessing this report and wishing to effect transactions in any security mentioned within must do so with: Maybank Kim Eng Securities USA Inc. 400 Park Avenue, 11th Floor, New York, New York 10022, 1-(212) 688-8886 and not with, the issuer of this report.
May 31, 2021 10
Valuetronics
Disclosure of Interest
Malaysia: MKE and its Representatives may from time to time have positions or be materially interested in the securities referred to herein and may further act as market maker or may have assumed an underwriting commitment or deal with such securities and may also perform or seek to perform investment banking services, advisory and other services for or relating to those companies. Singapore: As of 31 May 2021, Maybank KERPL and the covering analyst do not have any interest in any companies recommended in this research report. Thailand: MBKET may have a business relationship with or may possibly be an issuer of derivative warrants on the securities /companies mentioned in the research report. Therefore, Investors should exercise their own judgment before making any investment decisions. MBKET, its associates, directors, connected parties and/or employees may from time to time have interests and/or underwriting commitments in the securities mentioned in this report. Hong Kong: As of 31 May 2021, KESHK and the authoring analyst do not have any interest in any companies recommended in this research report. India: As of 31 May 2021, and at the end of the month immediately preceding the date of publication of the research report, KESI, authoring analyst or their associate / relative does not hold any financial interest or any actual or beneficial ownership in any shares or having any conflict of interest in the subject companies except as otherwise disclosed in the research report.
In the past twelve months KESI and authoring analyst or their associate did not receive any compensation or other benefits from the subject companies or third party in connection with the research report on any account what so ever except as otherwise disclosed in the research report.
MKE may have, within the last three years, served as manager or co-manager of a public offering of securities for, or currently may make a primary market in issues of, any or all of the entities mentioned in this report or may be providing, or have provided within the previous 12 months, significant advice or investment services in relation to the investment concerned or a related investment and may receive compensation for the services provided from the companies covered in this report.
OTHERS
Analyst Certification of Independence
The views expressed in this research report accurately reflect the analyst’s personal views about any and all of the subject securities or issuers; and no part of the research analyst’s compensation was, is or will be, directly or indirectly, related to the specific recommendations or views expressed in the report.
Reminder
Structured securities are complex instruments, typically involve a high degree of risk and are intended for sale only to soph isticated investors who are capable of understanding and assuming the risks involved. The market value of any structured security may be affected by changes in economic, financial and politic al factors (including, but not limited to, spot and forward interest and exchange rates), time to maturity, market conditions and volatility and the credit quality of any issuer or reference issuer. Any investor interested in purchasing a structured product should conduct its own analysis of the product and consult with its own professional advisers as to the risks involved in making such a purchase.
No part of this material may be copied, photocopied or duplicated in any form by any means or redistributed without the prior consent of MKE.
Definition of Ratings
Maybank Kim Eng Research uses the following rating system
BUY Return is expected to be above 10% in the next 12 months (including dividends)
HOLD Return is expected to be between 0% to 10% in the next 12 months (including dividends)
SELL Return is expected to be below 0% in the next 12 months (including dividends)
Applicability of Ratings
The respective analyst maintains a coverage universe of stocks, the list of which may be adjusted according to needs. Investment ratings are only applicable to the stocks which form part of the coverage universe. Reports on companies which are not part of the coverage do not carry investment ratings as we do not actively follow developments in these companies.
UK This document is being distributed by Maybank Kim Eng Securities (London) Ltd (“Maybank KESL”) which is authorized and regulated, by the Financial Conduct Authority and is for Informational Purposes only. This document is not intended for distribution to anyone defined as a Retail Client under the Financial Services and Markets Act 2000 within the UK. Any inclusion of a third party link is for the recipients convenience only, and that the firm does not take any responsibility for its comments or accuracy, and that access to such links is at the individuals own risk. Nothing in this report should be considered as constituting legal, accounting or tax advice, and that for accurate guidance recipients should consult with their own independent tax advisers.
DISCLOSURES
Legal Entities Disclosures Malaysia: This report is issued and distributed in Malaysia by Maybank Investment Bank Berhad (15938- H) which is a Participating Organization of Bursa Malaysia Berhad and a holder of Capital Markets and Services License issued by the Securities Commission in Malaysia. Singapore: This report is distributed in Singapore by Maybank KERPL (Co. Reg No 198700034E) which is regulated by the Monetary Authority of Singapore. Indonesia: PT Maybank Kim Eng Securities (“PTMKES”) (Reg. No. KEP-251/PM/1992) is a member of the Indonesia Stock Exchange and is regulated by the Financial Services Authority (Indonesia). Thailand: MBKET (Reg. No.0107545000314) is a member of the Stock Exchange of Thailand and is regulated by the Ministry of Finance and the Securities and Exchange Commission. Philippines: Maybank ATRKES (Reg. No.01-2004-00019) is a member of the Philippines Stock Exchange and is regulated by the Securities and Exchange Commission. Vietnam: Maybank Kim Eng Securities Limited (License Number: 117/GP-UBCK) is licensed under the State Securities Commission of Vietnam. Hong Kong: KESHK (Central Entity No AAD284) is regulated by the Securities and Futures Commission. India: Kim Eng Securities India Private Limited (“KESI”) is a participant of the National Stock Exchange of India Limited and the Bombay Stock Exchange and is regulated by Securities and Exchange Board of India (“SEBI”) (Reg. No. INZ000010538). KESI is also registered with SEBI as Category 1 Merchant Banker (Reg. No. INM 000011708) and as Research Analyst (Reg No: INH000000057) US: Maybank KESUSA is a member of/ and is authorized and regulated by the FINRA – Broker ID 27861. UK: Maybank KESL (Reg No 2377538) is authorized and regulated by the Financial Conduct Authority.
May 31, 2021 11
Valuetronics
Malaysia Maybank Investment Bank Berhad
(A Participating Organisation of
Bursa Malaysia Securities Berhad)
33rd Floor, Menara Maybank,
100 Jalan Tun Perak,
50050 Kuala Lumpur
Tel: (603) 2059 1888;
Fax: (603) 2078 4194
Singapore Maybank Kim Eng Securities Pte Ltd
Maybank Kim Eng Research Pte Ltd
50 North Canal Road
Singapore 059304
Tel: (65) 6336 9090
London Maybank Kim Eng Securities
(London) Ltd
PNB House
77 Queen Victoria Street
London EC4V 4AY, UK
Tel: (44) 20 7332 0221
Fax: (44) 20 7332 0302
New York Maybank Kim Eng Securities USA
Inc
400 Park Avenue, 11th Floor
New York, New York 10022,
U.S.A.
Tel: (212) 688 8886
Fax: (212) 688 3500
Stockbroking Business:
Level 8, Tower C, Dataran Maybank,
No.1, Jalan Maarof
59000 Kuala Lumpur
Tel: (603) 2297 8888
Fax: (603) 2282 5136
Hong Kong Kim Eng Securities (HK) Ltd
28/F, Lee Garden Three,
1 Sunning Road, Causeway Bay,
Hong Kong
Tel: (852) 2268 0800
Fax: (852) 2877 0104
Indonesia PT Maybank Kim Eng Securities
Sentral Senayan III, 22nd Floor
Jl. Asia Afrika No. 8
Gelora Bung Karno, Senayan
Jakarta 10270, Indonesia
Tel: (62) 21 2557 1188
Fax: (62) 21 2557 1189
India Kim Eng Securities India Pvt Ltd
1101, 11th floor, A Wing, Kanakia
Wall Street, Chakala, Andheri -
Kurla Road, Andheri East,
Mumbai City - 400 093, India
Tel: (91) 22 6623 2600
Fax: (91) 22 6623 2604
Philippines Maybank ATR Kim Eng Securities Inc.
17/F, Tower One & Exchange Plaza
Ayala Triangle, Ayala Avenue
Makati City, Philippines 1200
Tel: (63) 2 8849 8888
Fax: (63) 2 8848 5738
Thailand Maybank Kim Eng Securities
(Thailand) Public Company Limited
999/9 The Offices at Central World,
20th - 21st Floor,
Rama 1 Road Pathumwan,
Bangkok 10330, Thailand
Tel: (66) 2 658 6817 (sales)
Tel: (66) 2 658 6801 (research)
Vietnam Maybank Kim Eng Securities Limited
4A-15+16 Floor Vincom Center Dong
Khoi, 72 Le Thanh Ton St. District 1
Ho Chi Minh City, Vietnam
Tel : (84) 844 555 888
Fax : (84) 8 38 271 030
Saudi Arabia In association with
Anfaal Capital
Ground Floor, KANOO Building
No.1 - Al-Faisaliyah,Madina Road,
P.O.Box 126575 Jeddah 21352
Kingdom of Saudi Arabia
Tel: (966) 920023423
South Asia Sales Trading Kevin Foy
Regional Head Sales Trading
Tel: (65) 6636-3620
US Toll Free: 1-866-406-7447
North Asia Sales Trading Andrew Lee
Tel: (852) 2268 0283
US Toll Free: 1 877 837 7635
Indonesia Iwan Atmadjaja [email protected] (62) 21 8066 8555
London Greg Smith [email protected] Tel: (44) 207-332-0221
New York James Lynch [email protected] Tel: (212) 688 8886
India Sanjay Makhija [email protected] Tel: (91)-22-6623-2629
Philippines Keith Roy [email protected] Tel: (63) 2 848-5288
www.maybank-ke.com | www.maybank-keresearch.com
May 31, 2021 12
Valuetronics
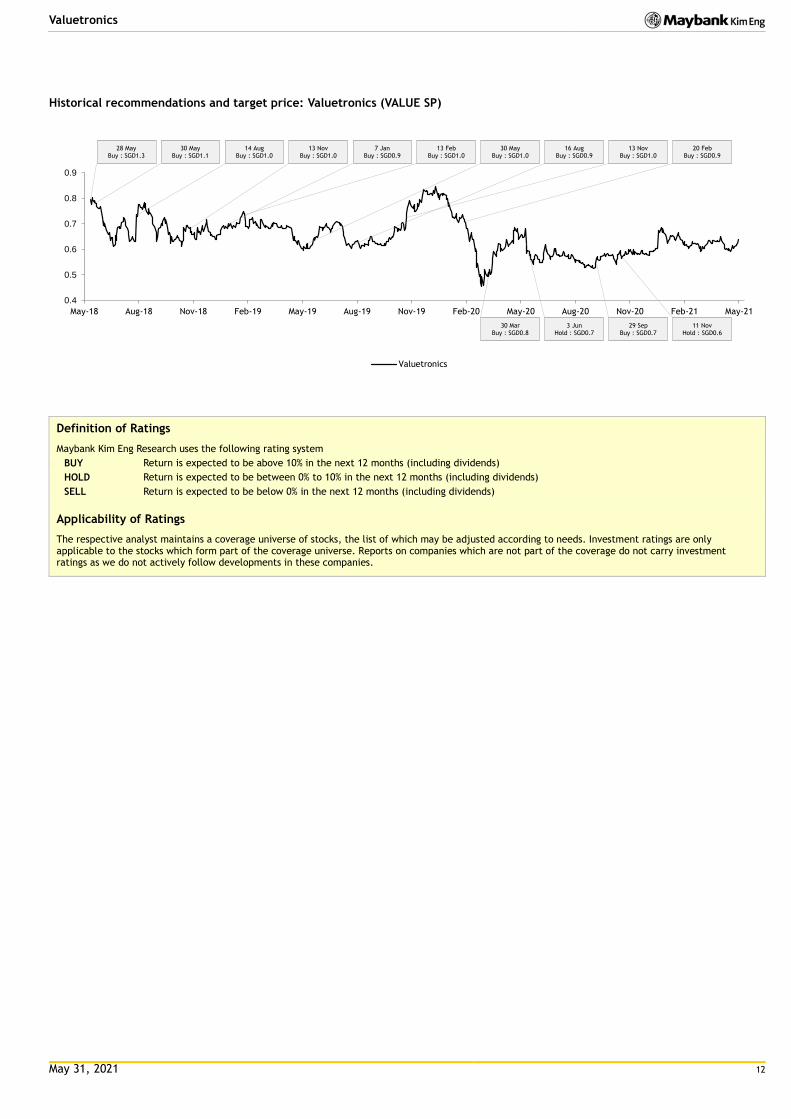
Historical recommendations and target price: Valuetronics (VALUE SP)
Definition of Ratings
Maybank Kim Eng Research uses the following rating system
BUY Return is expected to be above 10% in the next 12 months (including dividends)
HOLD Return is expected to be between 0% to 10% in the next 12 months (including dividends)
SELL Return is expected to be below 0% in the next 12 months (including dividends)
Applicability of Ratings
The respective analyst maintains a coverage universe of stocks, the list of which may be adjusted according to needs. Investment ratings are only applicable to the stocks which form part of the coverage universe. Reports on companies which are not part of the coverage do not carry investment ratings as we do not actively follow developments in these companies.
0.4
0.5
0.6
0.7
0.8
0.9
May-18 Aug-18 Nov-18 Feb-19 May-19 Aug-19 Nov-19 Feb-20 May-20 Aug-20 Nov-20 Feb-21 May-21
Valuetronics
28 May Buy : SGD1.3
30 May Buy : SGD1.1
14 Aug Buy : SGD1.0
13 Nov Buy : SGD1.0
7 Jan Buy : SGD0.9
13 Feb Buy : SGD1.0
30 May Buy : SGD1.0
16 Aug Buy : SGD0.9
13 Nov Buy : SGD1.0
20 Feb Buy : SGD0.9
30 Mar Buy : SGD0.8
3 Jun Hold : SGD0.7
29 Sep Buy : SGD0.7
11 Nov Hold : SGD0.6

May 31, 2021 13
Valuetronics
Malaysia Maybank Investment Bank Berhad
(A Participating Organisation of
Bursa Malaysia Securities Berhad)
33rd Floor, Menara Maybank,
100 Jalan Tun Perak,
50050 Kuala Lumpur
Tel: (603) 2059 1888;
Fax: (603) 2078 4194
Singapore Maybank Kim Eng Securities Pte Ltd
Maybank Kim Eng Research Pte Ltd
50 North Canal Road
Singapore 059304
Tel: (65) 6336 9090
London Maybank Kim Eng Securities
(London) Ltd
PNB House
77 Queen Victoria Street
London EC4V 4AY, UK
Tel: (44) 20 7332 0221
Fax: (44) 20 7332 0302
New York Maybank Kim Eng Securities USA
Inc
400 Park Avenue, 11th Floor
New York, New York 10022,
U.S.A.
Tel: (212) 688 8886
Fax: (212) 688 3500
Stockbroking Business:
Level 8, Tower C, Dataran Maybank,
No.1, Jalan Maarof
59000 Kuala Lumpur
Tel: (603) 2297 8888
Fax: (603) 2282 5136
Hong Kong Kim Eng Securities (HK) Ltd
28/F, Lee Garden Three,
1 Sunning Road, Causeway Bay,
Hong Kong
Tel: (852) 2268 0800
Fax: (852) 2877 0104
Indonesia PT Maybank Kim Eng Securities
Sentral Senayan III, 22nd Floor
Jl. Asia Afrika No. 8
Gelora Bung Karno, Senayan
Jakarta 10270, Indonesia
Tel: (62) 21 2557 1188
Fax: (62) 21 2557 1189
India Kim Eng Securities India Pvt Ltd
1101, 11th floor, A Wing, Kanakia
Wall Street, Chakala, Andheri -
Kurla Road, Andheri East,
Mumbai City - 400 093, India
Tel: (91) 22 6623 2600
Fax: (91) 22 6623 2604
Philippines Maybank ATR Kim Eng Securities Inc.
17/F, Tower One & Exchange Plaza
Ayala Triangle, Ayala Avenue
Makati City, Philippines 1200
Tel: (63) 2 8849 8888
Fax: (63) 2 8848 5738
Thailand Maybank Kim Eng Securities
(Thailand) Public Company Limited
999/9 The Offices at Central World,
20th - 21st Floor,
Rama 1 Road Pathumwan,
Bangkok 10330, Thailand
Tel: (66) 2 658 6817 (sales)
Tel: (66) 2 658 6801 (research)
Vietnam Maybank Kim Eng Securities Limited
4A-15+16 Floor Vincom Center Dong
Khoi, 72 Le Thanh Ton St. District 1
Ho Chi Minh City, Vietnam
Tel : (84) 844 555 888
Fax : (84) 8 38 271 030
Saudi Arabia In association with
Anfaal Capital
Ground Floor, KANOO Building
No.1 - Al-Faisaliyah,Madina Road,
P.O.Box 126575 Jeddah 21352
Kingdom of Saudi Arabia
Tel: (966) 920023423
South Asia Sales Trading Kevin Foy
Regional Head Sales Trading
Tel: (65) 6636-3620
US Toll Free: 1-866-406-7447
North Asia Sales Trading Andrew Lee
Tel: (852) 2268 0283
US Toll Free: 1 877 837 7635
Indonesia Iwan Atmadjaja [email protected] (62) 21 8066 8555
London Greg Smith [email protected] Tel: (44) 207-332-0221
New York James Lynch [email protected] Tel: (212) 688 8886
India Sanjay Makhija [email protected] Tel: (91)-22-6623-2629
Philippines Keith Roy [email protected] Tel: (63) 2 848-5288
www.maybank-ke.com | www.maybank-keresearch.com