westam erica
TRANSCRIPT

Westamerica2014 Annual Report
2015 Proxy Statement
Notice of Annual Meeting

Corporate Information
Corporate ProfileWestamerica Bancorporation (Nasdaq:WABC) operates as a holding company for Westamerica Bank, a community bank serving 21 Northern and Central California counties.
Westamerica Bancorporation Headquarters1108 Fifth Avenue, San Rafael, CA 94901Telephone (415) 257-8000www.westamerica.com
Subsidiary BankWestamerica Bank1108 Fifth Avenue, San Rafael, CA 94901Telephone (415) 257-8000
Notice of Annual MeetingThursday, April 23, 2015 at 11:00 a.m. PTHilton Garden Inn2200 Gateway Court, Fairfield, CA 94533
Transfer AgentComputershare Investor Services LLCTelephone (877) 588-4258 (Toll-free)www.computershare.com/investor
Stock ListingThe NASDAQ Global Select Market, Symbol: WABC
Dividend Reinvestment and Stock Purchase PlanWestamerica Bancorporation offers a dividend reinvestment and stock purchase program whereby registered shareholders may reinvest their dividends in and/or purchase additional shares of the Company’s stock. Information concerning this optionalprogram is available from: Computershare Investor Services LLC Telephone (877) 588-4258 (Toll-free)
Annual Report CopiesWestamerica Bancorporation will provide its security holders, without charge, a copy of its 2014 Annual Report on Form 10-K, including the financial statements and schedules thereto,as filed with the Securities and Exchange Commission. Requests for copies of this annual report should be directed to: Westamerica Bancorporation, Investor Relations, A-2B Post Office Box 1250, Suisun City, CA 94585-1250 Telephone (707) 863-6992 E-mail: [email protected] www.westamerica.com
Westamerica Bancorporation and Westamerica Bank Board of DirectorsDavid L. Payne, Chairman, President and Chief Executive Officer, Westamerica Bancorporation; President and General Manager, Gibson PublicationsEtta Allen, President, Allen Heating and Sheet MetalLouis E. Bartolini, Retired Merrill Lynch ExecutiveE. Joseph Bowler, Retired Senior Vice President and Treasurer, Westamerica BancorporationArthur C. Latno, Jr., Retired Executive Vice President, Pacific Telesis CompanyPatrick D. Lynch, Consultant, High Technology CompaniesCatherine C. MacMillan, Retired AttorneyRonald A. Nelson, InvestmentsEdward B. Sylvester, Consulting Civil Engineer
Westamerica Bancorporation Corporate OfficersDavid L. Payne, Chairman, President and Chief Executive Officer
Dennis R. Hansen, Senior Vice President Operations and SystemsRussell Rizzardi, Senior Vice President Credit AdministrationDavid L. Robinson, Senior Vice President Banking DivisionJames J. Schneck, Vice President and General AuditorRobert A. Thorson, Senior Vice President and Chief Financial Officer
Westamerica Bank Management OfficersDavid L. Payne, Chairman, President and Chief Executive OfficerDennis R. Hansen, Senior Vice President Operations and SystemsRussell Rizzardi, Senior Vice President Credit AdministrationDavid L. Robinson, Senior Vice President Banking DivisionRobert A. Thorson, Senior Vice President and Chief Financial Officer

20
15
W
EST
AM
ER
ICA
BA
NC
OR
PO
RA
TIO
N P
RO
XY
1108 Fifth AvenueSan Rafael, California 94901
March 9, 2015
To Our Shareholders:
You are cordially invited to attend the Annual Meeting of Shareholders of Westamerica Bancorporation. It will be held at 11:00 a.m. Pacific Time on Thursday, April 23, 2015, at the Hilton Garden Inn, 2200 Gateway Court, Fairfield, California as stated in the formal notice accompanying this letter. We hope you will plan to attend.
At the Annual Meeting, the shareholders will be asked to (i) elect nine Directors; (ii) approve a non-binding advisory vote on the compensation of our named executive officers; (iii) ratify the selection of the independent auditor; and (iv) conduct other business that may properly come before the Annual Meeting.
In order to ensure your shares are voted at the Annual Meeting, you can vote through the internet, by telephone or by mail. Instructions regarding internet and telephone voting are included on the Proxy Card. If you elect to vote by mail, please sign, date and return the Proxy Card in the accompanying postage-paid envelope. The Proxy Statement explains more about voting in the section entitled “Voting Information – How You Can Vote.”
We look forward to seeing you at the Annual Meeting on Thursday, April 23, 2015, at the Hilton Garden Inn in Fairfield, California.
Sincerely,
David L. Payne Chairman of the Board, President
and Chief Executive Officer

20
15
W
EST
AM
ER
ICA
BA
NC
OR
PO
RA
TIO
N P
RO
XY
20
15
W
EST
AM
ER
ICA
BA
NC
OR
PO
RA
TIO
N P
RO
XY
WESTAMERICA BANCORPORATION1108 Fifth Avenue
San Rafael, California 94901
NOTICE OF ANNUAL MEETING OF SHAREHOLDERS Date and Time Thursday, April 23, 2015, at 11:00 a.m. Pacific Time
PlaceHilton Garden Inn, 2200 Gateway Court, Fairfield, California.
Items of Business 1. To elect nine Directors to serve until the 2016 Annual Meeting of Shareholders; 2. To approve a non-binding advisory vote on the compensation of our named executive officers;3. To ratify selection of independent auditor; and 4. To conduct other business that may properly come before the Annual Meeting and any adjournments
postponements.
Who Can Vote? Shareholders of Record at the close of business on February 23, 2015 are entitled to notice of, and to vote at the Annual Meeting or any postponement or adjournment thereof. Admission to the Annual Meeting No ticket will be necessary for admission to the Annual Meeting. However, to facilitate the admission process, Shareholders of Record (Holder) planning to attend the Annual Meeting should check the appropriate box on the Proxy Card. Your name will be added to a list of attendees. If you hold shares through an intermediary, such as a bank or broker (beneficial holder), you may need to register at the desk in the lobby. Please bring the following as evidence of ownership: 1) a Legal Proxy, which you can obtain from your bank or broker or other intermediary, or your brokerage statement dated on or after February 23, 2015, evidencing your shareholding on the February 23 record date; and 2) photo identification.Annual Report Westamerica Bancorporation’s Annual Report on Form 10-K (“Annual Report”) to shareholders for the fiscal year ended December 31, 2014 is enclosed or is available for viewing as indicated on the Shareholder Meeting Notice and on the Corporation’s website at https://www.westamerica.com/ under “Shareholders.” The Annual Report contains financial and other information about the activities of Westamerica Bancorporation, but does not constitute a part of the proxy soliciting materials. BY ORDER OF THE BOARD OF DIRECTORS
Kris Irvine Dated: March 9, 2015 VP/Corporate Secretary
IMPORTANT NOTICE REGARDING THE AVAILABILITY OF PROXY MATERIALS FOR THE SHAREHOLDER MEETING BEING HELD ON THURSDAY, APRIL 23, 2015. THE PROXY STATEMENT AND ANNUAL REPORT ON FORM 10-K TO SHAREHOLDERS ARE AVAILABLE AT: WWW.WESTAMERICA.COM
YOUR VOTE IS IMPORTANTPLEASE COMPLETE, SIGN, DATE AND PROMPTLY RETURN YOUR PROXY, OR VOTE BY
TELEPHONE OR ONLINE USING THE PROCEDURES DESCRIBED IN THE PROXY STATEMENT.
20
15
W
EST
AM
ER
ICA
BA
NC
OR
PO
RA
TIO
N P
RO
XY
TABLE OF CONTENTS
General Voting Information........................................................................................................................................... 1 Additional Information..................................................................................................................................... 4 Stock Ownership .............................................................................................................................................. 4 Section 16(a) Beneficial Ownership Reporting Compliance .......................................................................... 6Board of Directors
Proposal 1: Election of Directors ................................................................................................................. 6 Nominees ......................................................................................................................................................... 6 Name of Nominees, Principal Occupations, and Qualifications .................................................................... 7 Board of Directors and Committees ................................................................................................................ 9 Director Compensation .................................................................................................................................. 13 Director Compensation Table for Fiscal Year 2014...................................................................................... 14 Executive Compensation Compensation Discussion and Analysis........................................................................................................ 14 Employee Benefits Compensation Committee Report.................................................................................. 25 Compensation Committee Interlocks and Insider Participation.................................................................... 25 Summary Compensation ................................................................................................................................ 25 Summary Compensation Table for Fiscal Year 2014 .................................................................................. 25 Grants of Plan-Based Awards Table for Fiscal Year 2014 ........................................................................... 26 Outstanding Equity Awards Table at Fiscal Year End 2014 ........................................................................ 27 Option Exercises and Stock Vested Table for Fiscal Year 2014 .................................................................. 28 Pension Benefits for Fiscal Year 2014........................................................................................................... 28 Nonqualified Deferred Compensation Table for Fiscal Year 2014 .............................................................. 28 Potential Payments Upon Termination or Change in Control ...................................................................... 29 Certain Relationships and Related Party Transactions ................................................................................. 30 Proposal 2: Approve a Non-Binding Advisory Vote on the Compensation of Our Named Executive Officers .............................................................................................................30 Proposal 3: Ratify Selection of Independent Auditor ...............................................................................32 Audit Committee Report .................................................................................................................................. 33 Shareholder Proposal Guidelines .................................................................................................................... 34 Shareholder Communication to Board of Directors ..................................................................................... 34 Other Matters..................................................................................................................................................... 34 Exhibit A ...........................................................................................................................................................A-1

20
15
W
EST
AM
ER
ICA
BA
NC
OR
PO
RA
TIO
N P
RO
XY
20
15
W
EST
AM
ER
ICA
BA
NC
OR
PO
RA
TIO
N P
RO
XY
11
WESTAMERICA BANCORPORATION1108 Fifth Avenue
San Rafael, California 94901___________
PROXY STATEMENT March 9, 2015 ___________
GENERALThe Westamerica Board of Directors is soliciting proxies to be used at the 2015 Annual Meeting of Shareholders of Westamerica Bancorporation, which will be held at 11:00 a.m. Pacific Time, Thursday, April 23, 2015, or at any adjournment or postponement of the Annual Meeting. Proxies are solicited to give all Shareholders of Record (“registered holder”) an opportunity to vote on matters to be presented at the Annual Meeting. In the following pages of this Proxy Statement, you will find information on matters to be voted at the Annual Meeting.
Voting Information Internet Availability of Proxy Materials. We are providing proxy materials to our shareholders primarily via the internet, instead of mailing printed copies of those materials to each shareholder. By doing so, we save costs and reduce the environmental impact of our Annual Meeting. On or about March 9, 2015, we mailed a Notice of Internet Availability of Proxy Materials (“Notice”) to certain of our shareholders. The Notice contains instructions about how to access our proxy materials and vote online or vote by telephone. If you would like to receive a paper copy of our proxy materials, please follow the instructions included in the Notice. If you previously chose to receive our proxy materials electronically, you will continue to receive access to these materials via email unless you elect otherwise.
Proof of Ownership May Be Required for Attending Annual Meeting in Person. You are entitled to attend the Annual Meeting only if you are a shareholder as of the close of business on February 23, 2015, the record date, or hold a valid proxy for the meeting. In order to be admitted to the Annual Meeting, the Corporation reserves the right to request proof of ownership of Westamerica stock on the record date. This can be:
• A brokerage statement or letter from a bank or broker indicating ownership on February 23, 2015;• The Notice of Internet Availability of Proxy Materials; • A printout of proxy distribution email (if you received your materials electronically);• A Proxy Card; • A voting instruction form; or • A legal proxy provided by your broker, bank or nominee.
Any holder of a proxy from a shareholder must present the Proxy Card properly executed, and a copy of the proof of ownership. The Corporation reserves the right to ask shareholders and proxy holders to present a form of photo identification such as a driver’s license.
Proxy Card. The Board has designated Arthur C. Latno, Jr., Ronald A. Nelson and Edward B. Sylvester to serve as Proxies for the Annual Meeting. As Proxies, they will vote the shares represented by proxies at the Annual Meeting. If you sign, date and return your Proxy Card but do not specify how to vote your shares, the Proxies will vote FOR the election of all of the Director nominees, FOR approval of the advisory vote on the compensation of our named executive officers, and FOR ratifying the selection of independent auditor. The Proxies will also have discretionary authority to vote in accordance with their judgment on any other

20
15
W
EST
AM
ER
ICA
BA
NC
OR
PO
RA
TIO
N P
RO
XY
2
2
matter that may properly come before the Annual Meeting that we did not have notice of by January 24, 2015.
Quorum and Shares Outstanding. A quorum, which is a majority of the total shares outstanding as of the record date, must be present to hold the Annual Meeting. A quorum is calculated based on the number of shares represented by shareholders attending in person or by proxy. On February 23, 2015, 25,617,758 shares of Westamerica common stock were outstanding. We also count broker non-votes, which we describe below, as shares present or represented at the Annual Meeting for the purpose of determining whether a quorum exists.
Election of Director Nominees. Each share is entitled to one vote, except in the election of Directors where a shareholder may cumulate votes as to candidates nominated prior to voting, but only when a shareholder gives notice of intent to cumulate votes prior to the voting at the Annual Meeting. If any shareholder gives such notice, all shareholders may cumulate their votes for nominees. Under cumulative voting, each share carries as many votes as the number of Directors to be elected, and the shareholder may cast all of such votes for a single nominee or distribute them in any manner among as many nominees as desired. This Proxy Statement solicits the discretionary authority to cumulate votes and allocate them in the Proxy Holders’ discretion if any shareholder requests cumulative voting. In the election of Directors, the nine nominees receiving the highest number of votes will be elected. If your proxy is marked “Withhold” with regard to the election of any nominee, your shares will be counted toward a quorum and for other nominees but they will not be voted for the election of that nominee. If you attend the Annual Meeting and have already voted, you may vote in person in order to rescind your previous vote.
Vote Required; Effect of Abstentions and Broker Non-Votes. The shares of a shareholder whose ballot on any or all proposals is marked as “abstain” will be included in the number of shares present at the Annual Meeting to determine whether a quorum is present. If you are the beneficial holder of shares held by a broker or other custodian, you may instruct your broker how to vote your shares through the voting instruction form included with this Proxy Statement. If you wish to vote the shares you own beneficially at the meeting, you must first request and obtain a legal proxy from your broker or other custodian. If you choose not to provide instructions or a legal proxy, your shares are referred to as “uninstructed shares.” Whether your broker or custodian has the discretion to vote these shares on your behalf depends on the ballot item. The following table summarizes the votes required for passage of each proposal and the effect of abstentions and uninstructed shares held by brokers.
Brokers and custodians cannot vote uninstructed shares on your behalf in director elections or advisory votes on executive compensation. For your vote to be counted, you must submit your voting instruction form to your broker or custodian.
Proposal Number Proposals
Votes Required for Approval Abstentions Uninstructed Shares
Management Vote Recommendation
1 Election of DirectorsSee election of directors above Not Voted Not Voted For
2Advisory vote on executive compensation (Say on Pay)
Majority of shares voted Not Voted Not Voted For
3Ratification of independent auditor
Majority of shares voted Not Voted
Broker Discretionary Vote For
Other Matters. Approval of any other matter considered at the Annual Meeting will require the affirmative vote of a majority of the shares present or represented by proxy and voting at the Annual Meeting.

20
15
W
EST
AM
ER
ICA
BA
NC
OR
PO
RA
TIO
N P
RO
XY
20
15
W
EST
AM
ER
ICA
BA
NC
OR
PO
RA
TIO
N P
RO
XY
33
How You Can Vote. Your vote is very important and we hope that you will attend the Annual Meeting. However, whether or not you plan to attend the Annual Meeting, please vote by proxy.
Registered Holders. If your shares are registered directly in your name with the Company’s transfer agent, Computershare Investor Services, LLC, you are considered a registered holder of those shares. Please vote by proxy in accordance with the instructions on your Proxy Card, or the instruction you received through electronic mail.
A registered holder can vote in one of the following four ways:
Via the Internet. Go to the website noted on your Proxy Card in order to vote via the internet. Internet voting is available 24 hours a day. We encourage you to vote via the internet, as it is the most cost-effective way to vote. When voting via the internet, you do not need to return your Proxy Card.
By Telephone. Call the toll-free telephone number indicated on your Proxy Card and follow the voice prompt instructions to vote by telephone. Telephone voting is available 24 hours a day. When voting by telephone, you do not need to return your Proxy Card.
By Mail. Mark your Proxy Card, sign and date it, and return it in the enclosed postage-paid envelope. If you elected to electronically access the Proxy Statement and Annual Report, you will not be receiving a Proxy Card and must vote via the internet or by telephone.
In person. You may vote your shares at the Annual Meeting if you attend in person, even if you previously submitted a Proxy Card or voted via internet or telephone. Whether or not you plan to attend the Annual Meeting, however, we strongly encourage you to vote your shares by proxy before the meeting.
Beneficial Shareholders. If your shares are held in a brokerage account in the name of your bank, broker, or other holder of record (this is called “street name”), you are not a registered holder, but rather are considered a “beneficial holder” of those shares. Your bank, broker, or other holder of record will send you instructions on how to vote your shares. If you are a beneficial holder, you must obtain a proxy, executed in your favor, from the holder of record to be able to vote in person at the Annual Meeting.
We have been advised by counsel that these telephone and internet voting procedures comply with California law.
Voting Deadlines. If you are a participant in the Westamerica Bancorporation Tax Deferred Savings/Retirement Plan (ESOP) your vote must be received by 11:59 p.m. Central Time, on April 20, 2015. All other shareholders voting by telephone or internet must vote by 1:00 a.m. Central Time, on April 23, 2015 to ensure that their vote is counted.
Revocation of Proxy. Record Holders who vote by proxy, whether by telephone, internet or mail, may revoke that proxy at any time before it is voted at the Annual Meeting. You may do this by: (a) signing another Proxy Card with a later date and delivering it to us prior to the Annual Meeting or sending a notice of revocation to the Corporate Secretary of Westamerica at 1108 Fifth Avenue, San Rafael, CA 94901; (b) voting at a later time by telephone or on the internet prior to 1:00 a.m. Central Time, on April 23, 2015 (prior to 11:59 p.m. Central Time, on April 20, 2015 for ESOP participants); or (c) attending the Annual Meeting in person and casting a ballot. If you hold shares in street name, you may change your vote by submitting new voting instructions to your broker or other nominee.

20
15
W
EST
AM
ER
ICA
BA
NC
OR
PO
RA
TIO
N P
RO
XY
4
4
Additional Information
Householding. As permitted by the Securities Exchange Act of 1934 (the “Exchange Act”) only one envelope containing two or more Notices of Internet Availability of Proxy Materials is being delivered to shareholders residing at the same address, unless such shareholders have notified their bank, broker, Computershare Investor Services, or other holder of record that they wish to receive separate mailings. If you are a beneficial holder and own your shares in street name, contact your broker, bank or other holder of record to discontinue householding and receive your own separate copy of the Notice in future years. If you are a registered holder and own your shares through Computershare Investor Services, contact Computershare toll-free at 877-588-4258 or in writing directed to Computershare Investor Services, 250 Royall Street, Mail Stop 1A, Canton, MA 02021 to discontinue householding and receive multiple Notices in future years. To receive an additional Annual Report or Proxy Statement this year, contact Shareholder Relations at 707-863-6992 or follow the instructions on the Notice. Mailing of dividends, dividend reinvestment statements, and special notices will not be affected by your election to discontinue duplicate mailings of the Notice.
Electronic Access to Proxy Materials and Annual Reports. Whether you received the Notice of Internet Availability of Proxy Materials or paper copies of proxy materials, this Proxy Statement and the 2014 Annual Report are available on the Corporation’s internet site at: www.westamerica.com. If you hold your Westamerica common stock in street name through a broker, a bank or other nominee, you may have the option of securing your Proxy Statement and Annual Report via the internet. If you vote this year’s proxy electronically, you may also elect to receive future Proxy Statements, Annual Reports and other materials electronically by following the instructions given by your bank, broker, or other holder of record when you vote. Our website is available for information purposes only and should not be relied upon for investment purposes, nor is it incorporated by reference into this Proxy Statement.
Stock Ownership
Security Ownership of Certain Beneficial Holders. Based on Schedule 13G filings, shareholders beneficially holding more than 5% of Westamerica common stock outstanding as of December 31, 2014, in addition to those disclosed in the Security Ownership of Directors and Management below, were:
Name and Address of Beneficial Owner Title of ClassNumber of Shares
Beneficially Owned Percent of ClassT. Rowe Price Associates, Inc 100 East Pratt Street, Baltimore, MD 21202-1009 Common 2,628,233 (1) 10.10%BlackRock, Inc. 55 East 52nd Street, New York, NY 10022 Common 2,308,265 (2) 8.90%The Vanguard Group, Inc. 100 Vanguard Boulevard, Malvern, PA 19355 Common 1,902,250 (3) 7.34%American Century Investment Management, Inc.4500 Main Street, Kansas City, MO 64111 Common 1,624,969 (4) 6.30%Neuberger Berman Group LLC605 Third Avenue, New York, NY 10158 Common 1,377,392 (5) 5.32%________________
(1) The Schedule 13G was filed with the SEC on February 10, 2015. These securities are owned by various individual and institutional investors, which T. Rowe Price Associates, Inc. (Price Associates) serves as investment adviser with power to direct investments and/or sole power to vote the securities. For purposes of the reporting requirements of the Securities Exchange Act of 1934, Price Associates is deemed to be a beneficial holder of such securities; however, Price Associates expressly disclaims that it is, in fact, the beneficial holder of such securities.(2) The Schedule 13G filed with the SEC on January 22, 2015 disclosed that the reporting entity, BlackRock, Inc., held sole voting power over 2,241,638 shares and sole dispositive power over 2,308,265 shares.

20
15
W
EST
AM
ER
ICA
BA
NC
OR
PO
RA
TIO
N P
RO
XY
20
15
W
EST
AM
ER
ICA
BA
NC
OR
PO
RA
TIO
N P
RO
XY
55
(3) The Schedule 13G filed with the SEC on February 10, 2015 disclosed that the reporting entity, The Vanguard Group, Inc., held sole voting power over 38,867 shares and sole dispositive power over 1,865,683 shares, and shared dispositive power over 36,567 shares. (4) The Schedule 13G filed with the SEC on February 10, 2015 disclosed that the reporting entity, American Century Investment Management, Inc., held sole voting power over 1,585,773 shares and shared dispositive power over 1,624,969 shares.(5) The Schedule 13G filed with the SEC on February 12, 2015 disclosed that the reporting entity, Neuberger Berman Group LLC., held shared voting power over 1,372,092 shares and shared dispositive power over 1,377,372 shares.
Security Ownership of Directors and Management. The following table shows the number of common shares and the percentage of the common shares beneficially owned (as defined below) by each of the current Directors, by the Chief Executive Officer (“CEO”), by the Chief Financial Officer (“CFO”), and by the three other most highly compensated executive officers, and by all Directors and Officers of the Corporation as a group as of February 23, 2015. As of February 23, 2015, there were 25,617,758 outstanding shares of Westamerica Bancorporation’s common stock. For the purpose of the disclosure of ownership of shares by Directors and Officers below, shares are considered to be beneficially owned if a person, directly or indirectly, has or shares the power to vote or direct the voting of the shares, the power to dispose of or direct the disposition of the shares, or the right to acquire beneficial ownership of shares within 60 days of December 31, 2014.
Name and Address**
Sole Voting and
Investment Power
Shared Voting and Investment
Power
Right to Acquire Within 60 days of
December 31, 2014 Total(1)Percent of
Class(2)
Etta Allen 10,845 (3) - - 10,845 *
Louis E. Bartolini 1,800 - - 1,800 *
E. Joseph Bowler - 25,887 (4) - 25,887 0.1%
Arthur C. Latno, Jr. 3,460 (5) - - 3,460 *
Patrick D. Lynch 1,000 - - 1,000 *
Catherine Cope MacMillan 8,600 (6) - - 8,600 *
Ronald A. Nelson 44,000 - - 44,000 0.2%
David L. Payne 1,453 (7) 885,570 (8) - 887,023 3.5%
Edward B. Sylvester 73,750 - - 73,750 0.3%
John "Robert" A. Thorson 830 (9) 8,078 (10) 105,737 114,645 0.4%
David L. Robinson 188 1,571 152,950 (11) 154,709 0.6%
Jennifer J. Finger(12) 11,002 456 168,182 (11) 179,640 0.7%
Dennis R. Hansen 30 26,861 165,241 (11) 192,132 0.7%
All 15 Directors and ExecutivesOfficers as a Group 158,953 949,020 641,743 1,749,716 6.8%
Amount And Nature Of Beneficial Ownership
____________________
* Indicates beneficial ownership of less than one-tenth of one percent (0.1%) of the Corporation’s common shares. ** The address of all persons listed is 1108 Fifth Avenue, San Rafael, CA 94901.
(1) None of the shares held by the Directors and Officers listed above have been pledged. (2) In calculating the percentage of ownership, all shares which the identified person or persons have the right to acquire by exercise of options are deemed to be outstanding for the purpose of computing the percentage of the class owned by such person, but are not deemed to be outstanding for the purpose of computing the percentage of the class owned by any other person. (3) Includes 10,350 shares held in a trust as to which Mrs. Allen is trustee. (4) Includes 25,887 shares held in trust as to which Mr. Bowler is co-trustee with shared voting and investment power. (5) Includes 1,115 shares owned by Mr. Latno’s wife as to which Mr. Latno disclaims beneficial ownership.

20
15
W
EST
AM
ER
ICA
BA
NC
OR
PO
RA
TIO
N P
RO
XY
6
6
(6) Includes 6,000 shares held in a trust as to which Ms. MacMillan is trustee and 400 shares held in trust under the California Uniform Gift to Minors Act as to which Ms. MacMillan is custodian. (7) Includes 462 shares held in a trust under the California Uniform Gift to Minors Act as to which Mr. Payne is custodian. (8) Includes 528,837 shares owned by Gibson Radio and Publishing Company, of which Mr. Payne is President and Chief Executive Officer, as to which Mr. Payne disclaims beneficial ownership, and 345,808 shares held in a trust as to which Mr. Payne is co-trustee with shared voting and investment power. (9) Includes 415 shares held in trusts under the California Uniform Gift to Minors Act as to which Mr. Thorson is custodian.(10) Includes 7,152 shares held in a trust as to which Mr. Thorson is co-trustee with shared voting and investment power. (11) During 1996, the Corporation adopted the Westamerica Bancorporation Deferral Plan (the “Deferral Plan”) that allows recipients of Restricted Performance Shares (“RPS”) to defer receipt of vested RPS shares into succeeding years. Amounts shown include RPS shares that have been deferred into the Deferral Plan for the following accounts in amounts of: Ms. Finger – 25,030 shares; Messrs. Hansen – 14,780 shares; and Robinson – 19,140 shares. (12) Ms. Finger resigned from the position of Treasurer of the Corporation on February 13, 2015.
Section 16(a) Beneficial Ownership Reporting Compliance Section 16(a) of the Exchange Act requires the Corporation’s Directors and Executive Officers and persons who own more than 10% of a registered class of the Corporation’s equity securities to file with the SEC and NASDAQ initial reports of ownership and reports of changes in ownership of common stock and other equity securities of the Corporation, and to send a copy to the Corporation.
To the Corporation’s knowledge and based solely on a review of the copies of reports furnished to the Corporation and written representations that no other reports were required, during the fiscal year ended December 31, 2014, Westamerica’s Directors and Officers complied timely with all filing requirements.
BOARD OF DIRECTORS Proposal 1 — Election of Directors
Nine Directors have been nominated for election at the Annual Meeting to hold office until the next Annual Meeting or until their successors are elected and qualified. The Proxies will vote for the nine nominees named below unless you give different voting instructions on your Proxy Card. Each nominee is presently a Director of the Corporation and has consented to serve a new term. The Board does not anticipate that any of the nominees will be unavailable to serve as a Director, but if that should occur before the Annual Meeting, the Board reserves the right to substitute another person as nominee. The Proxies will vote for any substitute nominated by the Board of Directors. The Proxies may use their discretion to cumulate votes for election of Directors and cast all of such votes for any one or more of the nominees, to the exclusion of the others, and in such order of preference as they may determine at their discretion.
NomineesThe nominees for election as Directors are named and certain information with respect to them is given below. Our nominees are seasoned leaders who bring to the Board an array of financial services, public and private company, non-profit, and other business experience. As a group they possess experience in leadership, consumer banking, commercial and small business banking, investment banking, capital markets, financial advisory services, finance and accounting, risk management and real estate. Many of the Board Members have seen the company through a variety of economic conditions which was especially beneficial during the current economic environment. The information below has been furnished to the Corporation by the respective nominees. All of the nominees have engaged in their indicated principal occupation for more than five years, unless otherwise indicated and no nominee has served on the Board of Directors of another public company during the past five years.

20
15
W
EST
AM
ER
ICA
BA
NC
OR
PO
RA
TIO
N P
RO
XY
20
15
W
EST
AM
ER
ICA
BA
NC
OR
PO
RA
TIO
N P
RO
XY
77
Name of Nominees, Principal Occupations, and Qualifications
Etta Allen – Director since 1988 Etta Allen (85) is President and CEO of Allen Heating and Sheet Metal and President and CEO of Sunny Slope Vineyard in Sonoma County, California. She is a member of the Employee Benefits and Compensation Committee and the Loan and Investment Committee. Mrs. Allen is also a Director of Westamerica Bank.
In 1972, she became the second woman in the state of California to become a licensed contractor in heating, ventilation, air conditioning and sheet metal, and in 1974 she became President and CEO of Allen Heating and Sheet Metal. Under her leadership the company became recognized throughout California. She was the first woman president of Marin Builders Exchange and during her time on the executive committee she also served as a trustee and later as chairman of their successful insurance trust. She was the first woman contractor on the Executive Committee of the California Association of Builders Exchanges.
Etta Allen is one of the pioneers for women in non-traditional careers. As an entrepreneur, businesswoman and an involved community leader, she brings independence, operations management and executive experience to the Board.
Louis E. Bartolini – Director since 1991 Louis E. Bartolini (82) retired from Merrill Lynch, Pierce, Fenner & Smith, Inc. (now Merrill Lynch and Co.) as a financial consultant. He currently serves on the Audit Committee and is also a Director of Westamerica Bank. Mr. Bartolini has 34 years of experience in the financial industry serving as a financial consultant and branch manager for Merrill Lynch and Co. and has been active for over 36 years in the non-profit community in Marin County. He has served on the boards of many non-profit organizations, including a five-year term as president of the Marin Symphony, a Board member of the Association of California Symphony Orchestras, and a past District Governor of Rotary International.
Mr. Bartolini’s continuing interest in the financial industry, his leadership skills, and financial and investment expertise are of great value to the Board. His extensive ties to local community and business leaders through his long-term volunteer involvement provide the Board with a broad prospective and insights into key segments of our markets and customer base.
E. Joseph Bowler – Director since 2003 E. Joseph Bowler (78) retired as Senior Vice President and Treasurer of the Corporation in 2002. He currently serves as a member of the Audit Committee, and is also a Director of Westamerica Bank. Mr. Bowler holds a Masters of Business Administration from Stanford University.
With many years of direct banking experience, Mr. Bowler brings strong financial and investment expertise important to the oversight of our financial reporting and interest rate risk management. In addition, Mr. Bowler’s experience as a director and trustee of various non-profit community and educational organizations brings strategic planning and corporate governance skills to the Board.
Arthur C. Latno, Jr. – Director since 1985 Arthur C. Latno, Jr. (85) retired from Pacific Telesis Group (now Pacific Bell Telephone Company) as an Executive Vice President. He currently serves on the Corporation’s Executive Committee, the Employee Benefits and Compensation Committee, and the Loan and Investment Committee and is Chairman of the Nominating Committee. Mr. Latno is also a Director of Westamerica Bank. His expertise stems from his wide-ranging responsibilities at Pacific Bell, which included operations, regulatory responsibilities, and public and governmental relations. His proficiency in strategic planning was recognized by the City of San Francisco when he was selected to serve on the City’s Port of San Francisco Strategic Planning Advisory Panel. He has also been involved with the Marin General Hospital Foundation, the Fine Arts Museum of San Francisco and numerous other community organizations in the locations where the Corporation has a

20
15
W
EST
AM
ER
ICA
BA
NC
OR
PO
RA
TIO
N P
RO
XY
8
8
significant presence. Mr. Latno is also a former U.S. Ambassador and Chairman of the U.S. Delegation Treaty Conference (rank accorded by President Reagan) in Melbourne, Australia, and a former Chairman of the Board of Trustees and Past President of Board of Regents of St. Mary’s College in California. He was a recipient of the Anti-Defamation League’s Americanism Award and the Friends of the Human Rights Commission’s Human Rights Award.
Mr. Latno’s most important contributions to the Board are his executive leadership, strategic planning skills, and regulatory and public relations experience.
Patrick D. Lynch – Director since 1986 Patrick D. Lynch (81) retired as Vice President and General Manager of the U.S. Semiconductor Division of Motorola. He currently serves as Chairman of the Employee Benefits and Compensation Committee and is a member of the Executive Committee and the Nominating Committee. Mr. Lynch is also a Director of Westamerica Bank and has held executive positions at Nicolet Instrument Corporation and several venture capital high-tech start-up companies.
Mr. Lynch brings to the Board operations, financial and marketing expertise as well as a valued historical perspective.
Catherine Cope MacMillan – Director since 1985Catherine Cope MacMillan (67) is a former owner of the Huntington Hotel in San Francisco and La Playa Hotel in Carmel-by-the-Sea. She is a member of the Loan and Investment Committee and the Audit Committee. She is also a Director of Westamerica Bank. Ms. MacMillan previously operated a prominent restaurant for nearly 20 years. She is a graduate of the University of California at Davis and Pacific McGeorge School of Law. She has also served in numerous leadership capacities for community organizations.
Ms. MacMillan’s experience in administration and operational aspects of various businesses and organizations provides the Board with sound leadership.
Ronald A. Nelson – Director since 1988 Ronald A. Nelson (72) was Executive Vice President of Charles M. Schulz Creative Associates through 1995. He serves as the Chairman of the Audit Committee and is a member of the Employee Benefits and Compensation Committee. He is also a Director of Westamerica Bank. Mr. Nelson has a background as a Certified Public Accountant and has been designated as the Audit Committee’s “financial expert.” He has been a resident of Sonoma County since 1970, which is one of the bank’s primary markets and where he has been involved in business management, investment management, and the development of commercial real estate. He also served as a board member and chairman of Santa Rosa Memorial Hospital, which is the area’s primary acute care hospital.
Mr. Nelson’s extensive business and financial expertise provides important oversight of our financial reporting and risk management.
David L. Payne – Director since 1984 David L. Payne (59) is Chairman, President & CEO of Westamerica Bancorporation. He was appointed Chairman in 1988 and Chief Executive Officer in 1989 and is Chairman of the Executive Committee. Mr. Payne is also Chairman, President & CEO of Westamerica Bank. He brings to the Board strong leadership and a vision for the future. He has a thorough knowledge of the banking industry, manages regulatory and business development issues, and has extensive financial and accounting expertise. Mr. Payne possesses excellent management, strategic development and business skills.
Since Mr. Payne’s appointment to the Board, Westamerica’s dividends per share have risen eleven-fold

20
15
W
EST
AM
ER
ICA
BA
NC
OR
PO
RA
TIO
N P
RO
XY
20
15
W
EST
AM
ER
ICA
BA
NC
OR
PO
RA
TIO
N P
RO
XY
99
and capital levels have increased eight-fold. Total assets have quadrupled during his tenure and net income has risen by a multiple of 12. Return on equity is currently near 12%.
Mr. Payne has successfully negotiated and led the Corporation through many mergers including: John Muir National Bank, Napa Valley Bancorporation, PV Financial, CapitolBank – Sacramento, North Bay Bancorp, ValliCorp Holdings, First Counties Bank, Kerman State Bank, Redwood Empire Bancorp, County Bank, and Sonoma Valley Bank. Mr. Payne also manages his family printing, publishing and cable television business.
Edward B. Sylvester – Director since 1979 Edward Sylvester (78) is a licensed civil engineer and the founder of SCO Planning and Engineering. He retired from the day-to-day engineering profession in 2007, but continues as a private consultant. Mr. Sylvester is currently a member of the Executive Committee, the Nominating Committee and is Chairman of the Loan and Investment Committee, and is a Director of Westamerica Bank. He was a founding Director of Gold Country Bank headquartered in Grass Valley until the bank merged with Westamerica’s predecessor, Independent Bankshares, at which time he was nominated to serve on the corporate Board by his peers. Mr. Sylvester is the Chairman of the Board of Nevada County Broadcasters and serves as Vice Chairman of the Nevada County Business Association. He is Vice Chairman of the Board of Sierra Nevada Memorial Hospital where he is a member of their Finance Committee, chairs the hospital’s Citizen Outreach Committee and is Chairman of the Strategy Committee. Mr. Sylvester has previously served as a member and Chairman of the California Transportation Commission that prioritizes state transportation projects and allocates funding. He is a past President of the Rotary Club of Grass Valley and past Chairman of the Grass Valley Chamber of Commerce. Mr. Sylvester has run 23 marathons to date and was the 14th person in the world to complete a full marathon on all seven continents including Antarctica.
The depth of Mr. Sylvester’s experience gives him first-hand understanding of all the nuances of development and development funding, a current knowledge of the retail economy, and a state-wide perspective and experience in funding allocation. His long tenure on the Board brings a historical and long-term perspective while he remains current on financial issues with his continuing leadership role in the community and active management positions.
THE BOARD OF DIRECTORS RECOMMEND ELECTION OF ALL NOMINEES
Board of Directors and Committees
Director Independence and Leadership Structure The Board of Directors has considered whether any relationships or transactions related to a Director were inconsistent with a Director’s independence. Based on this review, the Board has determined that E. Allen, L.E. Bartolini, E.J. Bowler, A.C. Latno, Jr., P.D. Lynch, C.C. MacMillan, R.A. Nelson, and E.B. Sylvester are “independent” Directors as defined in NASDAQ rules.
Our Board believes that the most effective leadership structure for the Corporation at this time is to combine the responsibilities of the Chairman and CEO, a structure that has been successful since 1989. The combined positions avoid a duplication of efforts, enable decisive leadership, ensure a clear accountability for the performance of the Corporation, a more rapid implementation of decisions, and a consistent vision. Given the size of our employee base and our level of assets relative to larger, more complex banking structures, our Corporation is particularly well suited to combine the Chairman and CEO functions. Furthermore, our management team has an average tenure of 22 years and does not require the substantial oversight needed by a less experienced team, which has allowed our Chairman and CEO to lead the Corporation through eleven acquisitions since 1992.

20
15
W
EST
AM
ER
ICA
BA
NC
OR
PO
RA
TIO
N P
RO
XY
10
10
To ensure strong Board oversight eight of our nine Directors are, as noted above, independent as defined by NASDAQ. Only non-management directors sit on Board committees, with the exception of the Executive Committee, and every non-management director sits on one or more of these Committees. All non-management directors meet at least four times a year outside the presence of the Chairman and CEO and although a lead director has not been appointed, pertinent information from these meetings is regularly communicated to the Chairman and CEO. The Board completes an annual board evaluation that is discussed by the Nominating Committee and presented to the full Board.
The Board of the Corporation also serves as the Board of Directors of Westamerica Bank, and as such is well informed of Bank operations through regular reports and discussions on the operations of the Bank. The Directors’ longevity with the Corporation has exposed them to a wide range of business cycles, which plays a critical role in managing the risk profile and profitability of the Corporation through the current economic environment.
Role of the Board of Directors in Risk Oversight The Board is also responsible for overseeing all aspects of management of the Corporation, including risk oversight, which is effected through all Board committees, but primarily through the Board’s Audit Committee. The Internal Audit Department reports directly to the Board’s Audit Committee. It presents its independently prepared company-wide annual risk assessment, its evaluation of Management’s prepared risk assessment and its audit plan incorporating the risk assessment, including the policies and procedures utilized to monitor and control such exposures.
The internal loan review function reports directly to the Board’s Loan and Investment Committee. It reports ongoing evaluations of loan portfolios and the risk rating of individual loans using guidelines established by bank regulatory authorities.
MeetingsThe Corporation expects all Board Members to attend all meetings, including the Annual Meeting of Shareholders, except for reasons of health or special circumstances. The Board held a total of ten meetings during 2014. Every Director attended at least 75% of the aggregate of: (i) the Board Meetings held during that period in which they served; and (ii) the total number of meetings of any Committee of the Board on which the Director served. Each individual who served on the Board of the Corporation on the date of the 2014 Annual Meeting of Shareholders attended the meeting.

20
15
W
EST
AM
ER
ICA
BA
NC
OR
PO
RA
TIO
N P
RO
XY
20
15
W
EST
AM
ER
ICA
BA
NC
OR
PO
RA
TIO
N P
RO
XY
1111
Committees of the Board
Director NameExecutive
CommitteeAudit
Committee
Employee Benefits and
Compensation Committee
Loan and Investment Committee
NominatingCommittee
Etta Allen X XLouis E. Bartolini XE. Joseph Bowler XArthur C. Latno, Jr. X X X ChairPatrick D. Lynch X Chair XCatherine Cope MacMillan X XRonald A. Nelson Chair XDavid L. Payne ChairEdward B. Sylvester X Chair XNumber of Meetings in 2014 9 5 5 9 1
Executive Committee Functions: The Board delegates to the Executive Committee all powers and authority of the Board in the management of the business affairs of the Corporation between Board Meetings, which the Board is allowed to delegate under California law.
Audit Committee The Board of Directors has determined that all members are independent, as that term is defined by applicable rules of NASDAQ for Audit Committee purposes. The Board has also designated Mr. Nelson as the “Audit Committee financial expert” as defined by the rules of the SEC and has determined that he is “financially sophisticated” under NASDAQ rules. In concluding that Mr. Nelson is the Audit Committee financial expert, the Board determined that he has:
• an understanding of generally accepted accounting principles and financial statements;• the ability to assess the general application of such principles in connection with the accounting
for estimates, accruals and reserves;• experience preparing, auditing, analyzing or evaluating financial statements that present a breadth
and level of complexity of accounting issues that are generally comparable to the breadth and complexity of issues that can reasonably be expected to be raised by the Corporation’s financial statements, or experience actively supervising one or more persons engaged in such activities;
• an understanding of internal control over financial reporting; and• an understanding of Audit Committee functions.
Designation of a person as an Audit Committee financial expert does not result in the person being deemed an expert for any purpose, including under Section 11 of the Securities Act of 1933. The designation does not impose on the person any duties, obligations or liability greater than those imposed on any other Audit Committee member or any other Director and does not affect the duties, obligations or liability of any other member of the Audit Committee or Board of Directors.
Functions: The Audit Committee provides independent, objective oversight of the integrity of the Corporation’s financial statements, the Corporation’s compliance with legal and regulatory requirements, the independence and performance of the Corporation’s independent auditor as it performs audit, review or attest services, and the Corporation’s internal audit and control function. It selects and

20
15
W
EST
AM
ER
ICA
BA
NC
OR
PO
RA
TIO
N P
RO
XY
12
12
retains the independent registered public accounting firm, and reviews the plan and the results of the auditing engagement. It acts pursuant to a written charter that was last revised by the Board of Directors in April 2014 and is attached as Exhibit A to the Proxy Statement for this 2015 Annual Meeting of Shareholders. The Audit Committee Report that follows below more fully describes the responsibilities and the activities of the Audit Committee.
Employee Benefits and Compensation Committee The Employee Benefits and Compensation Committee of the Board of Directors (the “Compensation Committee”) is comprised solely of Directors who are not current or former employees of Westamerica or any of its affiliates. They are independent as defined by NASDAQ rules.
Functions: The Compensation Committee administers Westamerica Bancorporation’s 2012 Amended and Restated Stock Option Plan of 1995, Tax Deferred Savings and Retirement Plan, Deferred Profit Sharing Plan, Deferred Compensation Plan, and the Westamerica Bancorporation Deferral Plan. It administers the Corporation’s compensation programs and reviews and reports to the Board the compensation level for executive officers, including the CEO, of the Corporation and its subsidiaries and determines that compensation plans are balanced between financial results and prudent risk taking. The Compensation Committee determines annual corporate performance objectives for equity compensation and cash bonuses and their related corporate, divisional and individual goals. Based on the CEO’s assessment of the extent to which each executive officer met those objectives and goals, the Committee determines each executive officer’s annual equity compensation and cash bonus. The Compensation Committee also establishes the individual goals and targets for the CEO. All compensation approved by the Compensation Committee is reported to the full Board of Directors. The role of the Compensation Committee is described in greater detail under the section entitled “Compensation Discussion and Analysis.”
The Compensation Committee is governed by a written charter as required by NASDAQ rules. The charter was adopted April 24, 2013 and attached as Exhibit B to the Proxy Statement for the 2014 Annual Meeting of Shareholders. The Compensation Committee has the authority to seek assistance from officers and employees of the Corporation as well as external legal, accounting and other advisors. It has not retained outside consultants for compensation advice, but can request assistance on an as-needed basis. It does not delegate authority to anyone outside of the Compensation Committee. The Payroll and Employee Benefits Department supports the Compensation Committee by fulfilling certain administrative duties regarding the compensation programs.
Nominating Committee The Board of Directors has determined that all members of the Nominating Committee are independent, as defined in NASDAQ rules.
Functions: The Nominating Committee is governed by a written charter, which was affirmed in January 2013 and was attached as Exhibit A to the Proxy Statement for the 2013 Annual Meeting of Shareholders. The Nominating Committee screens and recommends qualified candidates for Board membership. This Committee recommends a slate of nominees for each Annual Meeting. As part of that process, it evaluates and considers all candidates submitted by shareholders in accordance with the Corporation’s Bylaws, and considers each existing Board member’s contributions. The Committee applies the same evaluation standards whether the candidate was recommended by a shareholder or the Board.
While the Board does not have a formal diversity policy, it believes that the Board broadly defines diversity to encompass a diverse range of skills and expertise sufficient to provide prudent guidance to

20
15
W
EST
AM
ER
ICA
BA
NC
OR
PO
RA
TIO
N P
RO
XY
20
15
W
EST
AM
ER
ICA
BA
NC
OR
PO
RA
TIO
N P
RO
XY
1313
the Corporation. In addition to the qualifications and characteristics described below, it considers whether the potential Director assists in achieving a mix of Board Members that represents a diversity of background, perspective, and experience. Our Board includes Directors with experience in public corporations and non-profit organizations, as well as entrepreneurial individuals who have successfully run their own private enterprise. Our Board also has a broad set of skills necessary for providing oversight to a financial institution, which includes proven leadership, and expertise in capital management, finance, accounting, regulatory affairs, and investment management.
Nominating Directors. The Nominating Committee will consider shareholder nominations submitted in accordance with Section 2.14 of the Bylaws of the Corporation. That section requires, among other things, that nominations be submitted in writing and must be received by the Corporate Secretary at least 45 days before the anniversary of the date on which the Corporation first mailed its proxy materials for the prior year’s Annual Meeting of Shareholders. If the date for the current year’s Annual Meeting changes more than 30 days from the date on which the prior year’s meeting was held, the Corporation must receive notice with a reasonable amount of time before the Corporation mails its proxy materials for the current year.
Nominations must include the following information: • The principal occupation of the nominee; • The total number of shares of capital stock of the Corporation that the shareholder expects will be
voted for the nominee; • The name and address of the nominating shareholder; and • The number of shares of capital stock of the Corporation owned by the nominating shareholder.
The Committee has specified the following minimum qualifications it believes must be met by a nominee for a position on the Board:
• Appropriate personal and professional attributes to meet the Corporation’s needs; • Highest ethical standards and absolute personal integrity; • Physical and mental ability to contribute effectively as a Director; • Willingness and ability to participate actively in Board activities and deliberations; • Ability to approach problems objectively, rationally and realistically; • Ability to respond well and to function under pressure; • Willingness to respect the confidences of the Board and the Corporation; • Willingness to devote the time necessary to function effectively as a Board member; • Possess independence necessary to make unbiased evaluation of Management performance; • Be free of any conflict of interest that would violate applicable law or regulation or interfere with
ability to perform duties; • Broad experience, wisdom, vision and integrity; • Understanding of the Corporation’s business environment; and • Significant business experience relevant to the operations of the Corporation.
Loan and Investment Committee Functions: This Committee reviews major loans and investment policies.
Director Compensation The following table and footnotes provide information regarding the compensation paid to the Corporation’s non-employee members of the Board of Directors in the fiscal year 2014. Directors who are employees of the Corporation receive no compensation for their services as Directors.

20
15
W
EST
AM
ER
ICA
BA
NC
OR
PO
RA
TIO
N P
RO
XY
14
14
Name(1) Fees Earned
Paid in Cash ($)
Change in Pension Value and Nonqualified Deferred
Compensation Earnings(2) Total ($)Etta Allen $38,400 $41,152 $79,552Louis E. Bartolini 33,000 420 33,420E. Joseph Bowler 31,800 - 31,800Arthur C. Latno, Jr. 42,250 - 42,250Patrick D. Lynch 40,250 - 40,250Catherine Cope MacMillan 38,700 - 38,700Ronald A. Nelson 37,250 - 37,250Edward B. Sylvester 42,450 7,378 49,828
Director Compensation Table For Fiscal Year 2014
_________________________(1) Non-employee Directors did not receive options or stock awards. During 2014, non-employee Directors of the Corporation each received an annual retainer of $18,000. Each non-employee Director received $1,200 for each meeting of the Board attended and $600 for each Committee meeting attended. The Chairman of each Committee received an additional $250 for each Committee meeting attended. All non-employee Directors are reimbursed for expenses incurred in attending Board and Committee meetings. The Chairman of the Board, David L. Payne, is compensated as an employee and did not receive any compensation as a Director.(2) The Deferred Compensation Plan allows non-employee Directors to defer some or all of their Director compensation with interest earnings credited on deferred compensation accounts. The amount shown is the interest on nonqualified deferred compensation that exceeds 120% of the long-term Applicable Federal Rate, with compounding, on all cash compensation deferred in 2014 and in previous years.
Westamerica Bancorporation does not have a charitable donations program for Directors nor does it make donations on behalf of any Director(s). The Corporation may make a nominal donation through its Community Relations program to non-profit organizations where a Director(s) may have an affiliation.
EXECUTIVE COMPENSATION Compensation Discussion and Analysis
The executive compensation practices described below have been followed consistently for twenty-three years. At each Annual Meeting of Shareholders since 2010, a majority of our shareholders approved an advisory proposal on the Corporation’s executive compensation.
The Compensation Committee governs the executive compensation program that combines three compensation elements: base salary, annual non-equity cash incentives, and long-term stock grants. Several compensation philosophies and practices underlie this program:
• Base salaries for participants in this program should be limited to foster an environment where incentive compensation motivates and rewards corporate, divisional, and individual performance.
• Incentive compensation (annual non-equity cash incentives and long-term stock grants) is based on measurement of performance against pre-established objective measurable goals. Specific criteria for each objective are established for “threshold,” “target,” and “outstanding” performance. On any one measure, performance below “threshold” results in no credit for that objective. “Threshold” performance results in 75% achievement, “target” performance results in 100% achievement, and “outstanding” performance results in 150% achievement. The performance achievement level determines the size of incentive compensation awards.
• Long-term incentive stock grants will be awarded to senior management if the corporate

20
15
W
EST
AM
ER
ICA
BA
NC
OR
PO
RA
TIO
N P
RO
XY
20
15
W
EST
AM
ER
ICA
BA
NC
OR
PO
RA
TIO
N P
RO
XY
1515
performance level is rated “threshold” or better. The purpose of long-term incentive grants is to: – motivate senior management to focus on long-term performance; – avoid excessive risk-taking and instill conservative management practices; – build equity ownership among Westamerica’s senior management; – link shareholder interests to management incentives; and – create ownership mentality among senior management.
In February 2013, the Board of Directors adopted a clawback policy that requires executive officers to forfeit previously awarded incentive compensation if the incentives were based on materially inaccurate financial statements or other performance measures that are later proven to be materially inaccurate or the achievement of which were due to fraud or other misconduct.
Establishing Incentive Levels, Determining Objectives and Measuring Performance In administering the executive compensation program, the Compensation Committee determines “target” incentives for each position annually. The Compensation Committee exercises discretion in establishing “target” incentives in an effort to provide competitive pay practices while motivating and rewarding performance that benefits the Corporation’s long-term financial performance and shareholder interests, and avoiding excessive risk-taking.
At the beginning of each calendar year, the Compensation Committee establishes annual corporate performance objectives. In establishing corporate performance objectives, the Compensation Committee takes into consideration the current operating environment for the commercial banking industry as well as internal management policies and practices which would, in the Compensation Committee’s opinion, benefit the long-term interests of the Corporation and its shareholders. Corporate performance measures include risk management elements considered to be responsive to the impact that current operating conditions could have on the long-term performance of the Company. The Compensation Committee monitors the economy and the banking industry’s operating environment throughout the ensuing year, and may exercise discretion in adjusting corporate performance objectives during the year.
The operating environment for the commercial banking industry is impacted by a myriad of factors including, but not limited to, local, national and global economic conditions, interest rate levels and trends, monetary policies of the Federal Reserve Board and its counterparts in other countries, fiscal policies of the United States government and other global political conditions, regulations and legislation, liquidity in capital markets, the demand for capital by commercial enterprises and consumers, new financial products, competitive response to changing conditions within the industry, trade balances, the changing values of real estate, currencies, commodities and other assets, and other factors.
Management policies and practices the Board considers in establishing corporate performance objectives include, but are not limited to, management of the Corporation’s balance sheet and product pricing in a manner which will provide consistent sustainable growth in long-term financial results for shareholders, the type and variety of financial products offered by the Corporation, adherence to internal controls, management of the credit risk of the Corporation’s loan and investment portfolios, the results of internal, regulatory and external audits, service quality delivered to the Corporation’s customers, service quality of “back office” support departments provided to those offices and departments directly delivering products and services to the Corporation’s customers, maintenance of operating policies and procedures which remain appropriate for risk management in a dynamic environment, timely and efficient integration of acquired companies, operational efficiencies, and capital management practices.

20
15
W
EST
AM
ER
ICA
BA
NC
OR
PO
RA
TIO
N P
RO
XY
16
16
Restricted performance shares (“RPS”) represent awards of Westamerica’s common stock subject to achievement of performance objectives established by the Compensation Committee. The 2012 Amended and Restated Stock Option Plan of 1995 (the “2012 Amended Plan”), which was originally approved by shareholders in 1995, and amended with shareholder approval in 2003 and again in 2012, defines the performance factors the Board must use in administering RPS grants as one or more of the following: earnings, diluted earnings per share, revenue and revenue per diluted share, expenses, share price, return on equity, return on equity relative to the average return on equity for similarly sized institutions, return on assets, return on assets relative to the average return on assets for similarly sized institutions, efficiency ratio (operating expenses divided by operating revenues), net loan losses as a percentage of average loans outstanding, nonperforming assets, and nonperforming assets as a percentage of total assets.
In addition to establishing corporate performance objectives, the Compensation Committee also establishes individual goals for the CEO. In regard to the other executives named in the accompanying tables, the CEO recommends divisional and individual performance objectives to the Compensation Committee, which considers, discusses, adjusts as necessary, and adopts such performance objectives.
Upon the closure of each calendar year, the Compensation Committee reviews corporate, divisional, and individual performance against the performance objectives for the year just completed. After thorough review and deliberation, the Compensation Committee determines the recommended amount of individual non-equity cash incentives and stock-based incentive awards. The Compensation Committee reports such incentives to the Board of Directors. Meetings of the Compensation Committee and Board of Directors routinely occur in January, immediately following the closure of the calendar year for which performance is measured for incentive compensation purposes.
Stock GrantsLong-term stock grants may only be awarded under shareholder approved stock-based incentive compensation plans. The Corporation’s Proxy Statement dated March 12, 2012, as filed with the SEC on March 13, 2012, summarizes the 2012 Amended Plan’s changes from the predecessor plan. Such changes included:
• reducing the issuable shares to 1,500,000 (plus shares that become available if awards under prior plans expire unexercised or are cancelled, forfeited or terminated before being exercised);
• any additional authorization of shares available for issuance must be approved by shareholders; and
• establishing a plan expiration date of April 26, 2022 after which shareholder approval is again required to extend the term or approve a new stock option plan.
The 2012 Amended Plan allows four types of stock-based compensation awards:
Incentive Stock Options (“ISO”) allow the optionee to buy a certain number of shares of Westamerica common stock at a fixed price, which is established on the date of the option grant. ISOs are intended to meet the requirements of Section 422 of the Internal Revenue Code which provide advantages if certain conditions are met. If the optionee holds the acquired stock for the designated holding period, the optionee defers the timing of recognizing taxable income related to exercising the ISO. If the optionee complies with the ISO requirements, the Corporation does not receive a corporate tax deduction related to the shares issued.
Nonqualified Stock Options (“NQSO”) also give the optionee the option to buy a certain number of shares of Westamerica common stock at a fixed price, which is established on the date of grant. Unlike ISOs, NQSOs do not allow deferral of taxable income for the optionee. At the time NQSOs are

20
15
W
EST
AM
ER
ICA
BA
NC
OR
PO
RA
TIO
N P
RO
XY
20
15
W
EST
AM
ER
ICA
BA
NC
OR
PO
RA
TIO
N P
RO
XY
1717
exercised, the optionee incurs taxable income equal to the spread between the exercise price and the market price of the stock, and the Corporation receives a corporate tax deduction in the same amount.
Stock Appreciation Rights (“SAR”) provide the holder a cash payment equal to the difference between the fair market value of the Corporation’s common stock on the date the SAR is surrendered and the fair market value of the Corporation’s common stock on the date the SAR was granted. The optionee incurs taxable income at the time the SAR is settled and the Corporation receives a corporate tax deduction in the same amount.
Restricted Performance Share Grants, as noted above, are awards of the Corporation’s common stock that are subject to the achievement of performance objectives. Award recipients receive shares at the end of the performance measurement period only if performance objectives are achieved. The award recipient incurs taxable income at the time any RPS vests and the Corporation receives a corporate tax deduction in the same amount.
Determination of Awards to Grant In determining which type of stock-based compensation awards to grant, the Compensation Committee considers the attributes of each form of incentive. Examples include the ability to motivate management to make decisions based on the long-term interests of shareholders, the desire to compensate with shares rather than cash, and the tax consequences of each type of award. The Compensation Committee retains the latitude to utilize all forms of incentives provided under the 2012 Amended Plan. In the current and preceding years, the Compensation Committee has utilized NQSO and RPS based on the motivational aspects of stock price appreciation, the settlement in shares rather than cash, and the preservation of tax deductions for the Corporation. As of February 24, 2015, the Corporation had no ISO or SAR awards outstanding.
Determination of Option Exercise Price The 2012 Amended Plan also requires the exercise price of each NQSO or ISO to be no less than one hundred percent (100%) of the fair market value of the Corporation’s common stock on the date of grant. The 2012 Amended Plan does not allow re-pricing stock options for poor stock price performance.
Stock-based compensation awards are submitted by the Compensation Committee to the full Board of Directors for review. As described above, these meetings have routinely occurred in January immediately following the closure of the calendar year for which performance is measured for incentive compensation purposes. The Compensation Committee meeting has routinely been held during the same week as the related Board of Directors meeting. These January meetings follow by no more than ten business days the Corporation’s public disclosure of its financial results for the preceding year. As a result, stock option grants are awarded, and the exercise price of such grants are determined at a time when the Corporation has broadly disseminated its financial condition and current operating results to the public. The Corporation’s outstanding stock option grants are dated, and related stock option exercise prices are determined, on the January date the Compensation Committee meets to approve such grants.(
1)
Long-Term Incentive Attributes The Board of Directors has designated the Compensation Committee as the administrator of the 2012 Amended Plan. The Compensation Committee reports to the Board the terms and conditions of stock option awards. In carrying out this responsibility, the Compensation Committee designs such awards as long-term incentives. The terms and conditions of currently outstanding awards include:
(1) Due to merger and acquisition activity, the Corporation converts stock option grants outstanding for acquired companies based on the terms and conditions of related merger agreements. The dating of such converted stock options generally remains as originally dated by the acquired company. As a result, the Corporation at times has options outstanding related to acquisitions with grant dates different from its routine stock option granting practices.

20
15
W
EST
AM
ER
ICA
BA
NC
OR
PO
RA
TIO
N P
RO
XY
18
18
• NQSO grants vest one-third (1/3) on each anniversary of the grant date. As such, NQSO grants become fully vested over a three-year period. NQSO grants expire on the tenth anniversary of the grant date. The Corporation does not pay dividends on shares underlying NQSO grants until the optionee exercises the option and the shares are outstanding on a dividend record date.
• RPS awards vest three years following the grant date, only if corporate performance objectives are achieved over the three-year period. The Corporation does not pay dividends on RPS shares until vesting occurs and shares awarded become outstanding on a dividend record date.
Compensation for the Chairman, President & CEO Mr. Payne performs two functions for the Corporation. These two functions tend to be compensated separately at similarly sized banking institutions. Mr. Payne serves as Chairman of the Board and Chief Executive Officer with responsibilities including oversight of the organization and external strategic initiatives. Mr. Payne also serves as President and Chief Operating Officer with responsibilities including daily management of internal operations. Mr. Payne’s total compensation reflects these broad responsibilities. Consistent with the overall compensation philosophy for senior executives, Mr. Payne’s compensation has a greater amount of pay at risk through incentives than through base salary. Since Mr. Payne is compensated as an executive, he is not eligible to receive compensation as a Director.
As noted on page 28 of the Proxy under the Pension Benefits Table, during 1997 the Corporation entered into a nonqualified pension agreement (“Pension Agreement”) with Mr. Payne in consideration of Mr. Payne’s agreement that RPS granted in 1995, 1996 and 1997 would be cancelled.(2) In entering the Pension Agreement, the Board of Directors considered the following:
• Mr. Payne had a significant beneficial interest in Corporation common stock, which was more than adequate to continue to provide motivation for Mr. Payne to continue managing the Corporation in the best interests of shareholders.
• In 1997, the Corporation had consummated its largest acquisition, with significant total asset growth of approximately 51 percent. One of the Board’s objectives was to provide a compensation mechanism providing retention features for Mr. Payne. Retention of Mr. Payne as President and Chief Executive Officer was desired following the Corporation’s significant growth. The RPS shares surrendered for the Pension Agreement were scheduled to vest on dates in 1998, 1999 and 2000, while the Pension Agreement was not fully vested until December 31, 2002. Additionally, the 20-year certain pension provided under the Pension Agreement was to commence upon Mr. Payne’s attainment of age 55. Mr. Payne was age 42 at the time of entering the Pension Agreement.
Compensation Awarded to Named Executive Officers Base salaries for participants in the executive compensation program are generally limited to foster an environment where incentive compensation motivates and rewards corporate, divisional, and individual performance. As such, base pay increases are generally infrequent and limited to “control points” assigned to each position. The non-equity cash incentive formula has the following components:
“Target” Composite Corporate Cash Cash X Divisional and Individual = Incentive Incentive Performance Level Award
In structuring performance goals for the named executive officers, the Compensation Committee emphasizes goals, which if achieved, will benefit the overall Corporation. As such, senior management level positions have high relative weighting on corporate objectives, and divisional leadership positions also have significant weighting on divisional objectives. The “target” cash incentive and the weighting of goals for the named executive officers for 2014 performance were as follows:
(2) The value of the surrendered RPS shares and the Pension Agreement were considered equivalent based on actuarial assumptions.

20
15
W
EST
AM
ER
ICA
BA
NC
OR
PO
RA
TIO
N P
RO
XY
20
15
W
EST
AM
ER
ICA
BA
NC
OR
PO
RA
TIO
N P
RO
XY
1919
“Target” Goal Weighting Cash Incentive Corporate Divisional Individual
Mr. Payne $371,000 80% – 20% Mr. Thorson 100,000 55% 25% 20% Ms. Finger(3) 82,000 55% 20% 25% Mr. Hansen 73,900 55% 25% 20% Mr. Robinson 82,500 50% 40% 10%
The Compensation Committee establishes corporate goals with the intent to balance current profitability with long-term stability of the Corporation and its future earnings potential. The 2014 corporate performance goals related to current year “profitability” included return on equity, return on assets and diluted earnings per share. The performance goals designed to maintain the long-term stability of the Corporation include “quality” and “control” components. The “quality” measures include loan portfolio quality measures (originated classified loans and other real estate owned, originated non-performing loans and originated other real estate owned, and net loan losses to average originated loans) and service quality measures (external service quality to customers and internal service quality of support departments and branches). The “control” measures include non-interest expense to revenues (efficiency ratio), the level of non-interest expenses, and internal audit results. By maintaining both current year “profitability” goals and longer-term “quality” and “control” goals, Management has a disincentive to maximize current earnings at the expense of longer-term results.
For 2014, the Compensation Committee expected nominal economic growth within the markets the Company operates given the slow pace of recovery from the severe recession of 2008 and 2009. As a result, the Committee reserved the ability to exercise a certain degree of judgment in adjusting target goals based on the resulting operating environment.
The Compensation Committee determined the 2014 operating environment was generally characterized as follows:
• The economy generally grew in-line with economic forecasts. Inflation remained below targets established by the Federal Open Market Committee. Employment trends continued to improve;
• The Federal Reserve’s monetary policies continued to influence United States-based interest rates to remain at relatively low levels, and the spread between three-month and ten-year Treasury debt compressed throughout 2014;
• Interest rates on loans and investment securities remain relatively low compared to interest rates which would exist with moderated economic conditions. Market interest rates remained below the yields on the Company’s overall loan and investment portfolios throughout 2014. Competitive pricing of loans was aggressive;
• Regulations imposed on financial institutions continued to pressure compliance costs, revenue opportunities, and operational risks.
• Deflation concerns in foreign developed economies resulted in monetary policy easing in many countries;
• The price of oil declined sharply; • The volatility of currency prices accelerated.
The Compensation Committee considered Management’s response to the current operating environment including: (3) Ms. Finger resigned from the position of Treasurer of the Corporation on February 13, 2015.

20
15
W
EST
AM
ER
ICA
BA
NC
OR
PO
RA
TIO
N P
RO
XY
20
20
• Management consistently maintained conservative loan underwriting practices to appropriately manage the Company’s exposure to credit risk;
• Management focused its marketing efforts on loan products that would provide improved revenue opportunities in a rising interest rate environment;
• Management avoided long-duration, low-yielding loans that would constrain revenue in a rising interest rate environment;
• Management increased the volume of interest-sensitive investment securities to prepare for rising interest rates on a forward basis;
• Management controlled operating costs to offset the effect of environmental pressures on revenues;
• Management continued to lower the cost of funding the loan and investment securities portfolios; • Management pursued growth in non-interest based sources of revenue; and • Adequate capital levels were maintained to position the Company for future growth.
The Compensation Committee chose to make adjustments to actual results to take into account the impact of the operating environment. Adjusted actual results against “target” performance goals were:
Performance Adjusted Actual “Target” ResultsProfitability Goals:Return on average shareholders’ equity 11.1% 11.3% Return on average assets 1.23% 1.22% Diluted earnings per share $2.27 $2.30
Quality Goals:Classified originated loans and other real estate owned $60 million $55 million Non-performing originated loans and other real estate owned $9.0 million $10.6 million Net loan losses to average originated loans 0.25% 0.20% Service quality Improving Improving
Control Goals:Non-interest expense to revenues (efficiency ratio) 52.9% 52.2% Non-interest expenses $110.0 million $106.8 million Below satisfactory internal audits none none
In reviewing the operating environment, Management’s response to the operating environment, and adjusted results compared to “target” performance goals, the Compensation Committee determined corporate performance to be 111.5% of target goals.
As described above, divisional and individual goals are used in conjunction with corporate performance goals to determine cash bonus awards.
In addition to daily management responsibilities, Mr. Payne’s individual goals included: • Aligning the balance sheet for anticipated increase in interest rates; • Improving credit quality; • Managing operational risk to acceptable levels, including satisfactory examination results; • Pursuing mergers and acquisitions; • Managing the Company toward attainment of budgeted financial results; • Maintaining cost controls;
20
15
W
EST
AM
ER
ICA
BA
NC
OR
PO
RA
TIO
N P
RO
XY
20
15
W
EST
AM
ER
ICA
BA
NC
OR
PO
RA
TIO
N P
RO
XY
2121
• General supervision of division managers; • Preparing properly for Board assigned strategic and operational initiatives; and • Maintaining quality shareholder relations.
Based on individual performance against these goals, the Committee exercised its discretion and assigned Mr. Payne a composite corporate and individual performance level of 61%.
In addition to routine on-going divisional responsibilities, Mr. Thorson managed the Finance Division toward functional goals, which included:
• Evaluating and advancing the internal control structure;• Management of the regulatory compliance function; • Position the Company to implement the new regulatory capital framework; • Management of the payroll and employee benefit function; • Improve internal service quality; and • Management of tax examinations.
Based on the Finance Division’s results, the Committee determined divisional performance to be 119%.
In addition to daily management responsibilities, Mr. Thorson’s individual goals included: • Financial planning and forecasting; • Personnel development and succession planning; • Manage cross-divisional projects; • Management of tax strategies; and • Support of merger and acquisition activities.
Based on individual performance against these goals, the Committee determined Mr. Thorson’s individual performance to be 138%. In considering all elements of performance, the Committee exercised its discretion and assigned Mr. Thorson a composite corporate, divisional and individual performance level of 132%.
In addition to routine on-going divisional responsibilities, Ms. Finger managed the Treasury Division toward functional goals, which included:
• Positioning the investment securities portfolio for rising interest rates; • Overall management of the Trust Department including profitability, expense control, business
development, operations and risk management; • Achievement of satisfactory audit results; and • Overall management of merchant processing services including personnel management, revenue
growth, risk management and internal controls.
Based on the Treasury Division’s results, the Committee determined divisional performance to be 128%.
In addition to daily management responsibilities, Ms. Finger’s individual goals included: • Merger and acquisition analysis and support; and • Management of any corporate litigation.
Based on individual performance against these goals, the Committee determined Ms. Finger’s individual performance to be 138%. As a result, Ms. Finger’s composite corporate, divisional and individual performance level was 121%.

20
15
W
EST
AM
ER
ICA
BA
NC
OR
PO
RA
TIO
N P
RO
XY
22
22
In addition to routine on-going divisional responsibilities, Mr. Hansen managed the Operations and Systems Division toward functional goals, which included:
• Managing information technology projects; • Maintaining and improving customer service quality; • Meeting or exceeding non-interest expense goals; and • Managing risk as measured in the results of internal and regulatory examinations.
Based on the Operations and Systems Division’s results, the Committee determined divisional performance to be 118%.
In addition to daily management responsibilities, Mr. Hansen’s individual goals included: • Development and implementation of staff development plans; and • Management of outside vendors.
Based on individual performance against these goals, the Committee determined Mr. Hansen’s individual performance to be 131%. As a result, Mr. Hansen’s composite corporate, divisional and individual performance level was 117%.
In addition to routine on-going divisional responsibilities, Mr. Robinson managed the Banking Division toward functional goals, which included:
• Manage sales and service efforts across the entire branch network; • Improve non-deposit based fee revenue; • Achievement of loan and deposit goals;• Manage non-interest expenses to levels at or below budgeted amounts; and • Satisfactory audit results.
Based on the Banking Division’s results, the Committee determined divisional performance to be 100%.
In addition to daily management responsibilities, Mr. Robinson’s individual goals included: • Regional sales responsibilities; and • Align incentive programs to branch initiatives.
Based on individual performance against these goals, the Committee determined Mr. Robinson’s individual performance to be 138%. As a result, Mr. Robinson’s composite corporate, divisional and individual performance level was 110%.
Based on the above described performance against objectives, the Committee determined cash incentive awards as follows:
“Target” Composite Corporate Cash Cash X Divisional and Individual = Incentive Incentive Performance Level Award
Mr. Payne $371,000 61% $225,000 Mr. Thorson 100,000 132% 132,100 Ms. Finger(3) 82,000 121% 99,400 Mr. Hansen 73,900 117% 86,400 Mr. Robinson 82,500 110% 90,300
(3) Ms. Finger resigned from the position of Treasurer of the Corporation on February 13, 2015.

20
15
W
EST
AM
ER
ICA
BA
NC
OR
PO
RA
TIO
N P
RO
XY
20
15
W
EST
AM
ER
ICA
BA
NC
OR
PO
RA
TIO
N P
RO
XY
2323
The size of stock grants is determined by corporate performance using stated formulas. The formulas used to determine “target” NQSO and RPS grant sizes adjust for changes in the underlying value of one share of Company common stock. For achievement of corporate performance in 2014, the following stock grants were awarded in January 2015:
“Target” Nonqualified Nonqualified Corporate Stock Stock Option X Performance = Option Grant Level Award
Mr. Payne – 111.5% – Mr. Thorson 23,700 111.5% 26,400 Ms. Finger(3) 23,700 111.5% 26,400 Mr. Hansen 21,300 111.5% 23,800 Mr. Robinson 23,900 111.5% 26,600
“Target” Corporate RPS X Performance = RPS Grant Level Award
Mr. Payne – 111.5% – Mr. Thorson 2,620 111.5% 2,920 Ms. Finger(3) 2,620 111.5% 2,920 Mr. Hansen 2,360 111.5% 2,630 Mr. Robinson 2,640 111.5% 2,940
RPS awards vest three years following the grant date, only if certain corporate performance objectives are achieved over the three-year period. In January 2015, the Compensation Committee evaluated whether the three year corporate performance objectives were met for RPS awards granted in January 2012. The performance objectives for the RPS granted in January 2012 included:
• 3 year cumulative diluted earnings per share (EPS); • 3 year average of annual return on average total assets (ROA); • 3 year average of annual return on average shareholders’ equity relative to industry average
ROE (ROE differential); • Ending originated non-performing assets to total originated assets (NPA); and • Efficiency ratio over three years.
The RPS would vest if any one of the following performance results were achieved: • 4 of 5 objectives reaching “threshold” performance level; • 3 of 5 objectives reaching “target” performance level; or • 2 of 5 objectives reaching “outstanding” performance level.
The goals and achieved results were: Threshold Target Outstanding Result
EPS $9.00 $9.15 $9.30 Below Threshold ROA 1.60% 1.70% 1.75% Below Threshold ROE differential 3.00% 3.50% 4.00% Outstanding NPA 0.65% 0.60% 0.55% Outstanding Efficiency Ratio 47.00% 46.00% 45.00% Below Threshold
(3) Ms. Finger resigned from the position of Treasurer of the Corporation on February 13, 2015.

20
15
W
EST
AM
ER
ICA
BA
NC
OR
PO
RA
TIO
N P
RO
XY
24
24
With two of the five goals achieved at the “outstanding” performance level, the Compensation Committee determined the RPS shares awarded in 2012 vested upon achievement of three year goals.
Nonqualified Deferred Compensation Programs The Corporation maintains nonqualified deferred compensation programs to provide senior and mid-level executives the ability to defer compensation in excess of the annual limits imposed on the Corporation’s “401(k)” plan. The Corporation believes these tax deferral programs enhance loyalty and motivate retention of executives. These programs allow executives to defer cash pay and RPS shares upon vesting. The programs also allow Directors to defer Director fees.
• Cash pay deferred in the program accumulates in accounts in the names of the participating Directors and executives. The Corporation credits the balance of these accounts with interest using an interest rate that approximates the crediting rate on corporate-owned life insurance policies, under which Directors and executives are the named insured. Deferrals and interest credits represent general obligations of the Corporation.
• The common stock the Corporation issues to executives upon the vesting of RPS grants may be deferred into the program and deposited into a “Rabbi Trust.” Since these shares are outstanding shares of the Corporation’s common stock, the Corporation pays dividends on these shares at the same rate paid to all shareholders. The shares held in the “Rabbi Trust” are subject to claims by the Corporation’s creditors.
Employment Contracts None of the executives named in the accompanying tables have employment contracts with the Corporation.
Compensation in the Event of a Change in Control The banking industry has significant merger and acquisition activity. To promote retention of senior executives, unvested NQSO and RPS grants contain a “change in control” provision, which trigger full vesting upon a change in control. The Compensation Committee determined these provisions were appropriate in order to retain executives to continue managing the Corporation after any “change in control” was announced through its ultimate consummation. Since none of the named executive officers have entered employment contracts with the Corporation, they serve in an “at-will” capacity and could terminate their employment at any time. The Compensation Committee felt it would be in the best interests of shareholders to have a retention mechanism in place to provide continuity of management during a “change in control” process. Further, the Committee expects the named executive officers would be terminated by an acquiring institution rather than retained in a similar functional capacity.
The Corporation also maintains a Severance Payment Plan covering all employees to promote employee retention. The Severance Payment Plan provides salary continuation benefits for employees in the event of a “change in control.” The amount of salary continuation benefits is based on years of service and corporate title, but in no event exceed the equivalent of one times annual salary. All named executive officers are eligible for one year’s salary under the plan.
OtherInternal Revenue Code (“IRC”) Section 162(m) places a limit on the amount of compensation that may be deducted by the Corporation in any year with respect to certain of the Corporation’s highest-paid executives. Certain “performance-based compensation” is not counted toward this limit. The Corporation intends generally to qualify compensation paid to executive officers for deductibility under the IRC, including Section 162(m), but reserves the right to pay compensation that is not deductible.

20
15
W
EST
AM
ER
ICA
BA
NC
OR
PO
RA
TIO
N P
RO
XY
20
15
W
EST
AM
ER
ICA
BA
NC
OR
PO
RA
TIO
N P
RO
XY
2525
Employee Benefits Compensation Committee Report We, the Compensation Committee of the Board of Directors of the Corporation, have reviewed and discussed the Compensation Discussion and Analysis with Management. Based on that review and discussion, we have recommended to the Board of Directors inclusion of the Compensation Discussion and Analysis in this Proxy Statement and the Corporation’s Annual Report on Form 10-K for the year ended December 31, 2014.
Submitted by the Employee Benefits and Compensation Committee Patrick D. Lynch, Chairman Etta Allen Arthur C. Latno, Jr. Ronald A. Nelson
Compensation Committee Interlocks and Insider Participation No member of the Compensation Committee is a current or former officer or employee of the Corporation or any of its subsidiaries, or entered into (or agreed to enter into) any transaction or series of transactions with the Corporation or any of its subsidiaries with a value in excess of $120,000. None of the executive officers of the Corporation has served on the Board of Directors or on the Compensation Committee of any other entity, where one of that entity’s executive officers served either on the Board of Directors or on the Compensation Committee of the Corporation.
Summary Compensation The following table sets forth summary compensation information for the chief executive officer, chief financial officer and each of the other three most highly compensated executive officers for the fiscal years ending December 31, 2014, 2013, and 2012. These persons are referred to as named executive officers elsewhere in this Proxy Statement.
Name / Position Year Salary Stock
Awards(1) Option
Awards(2)
Non-Stock Incentive Plan
Compensation(3)
Change in Pension Value
and Nonqualified
Deferred Compensation
Earnings(4)All Other
Compensation(5) TOTAL
David L. Payne 2014 $371,000 - - $225,000 - $15,471 $611,471
Chairman, 2013 371,000 - - 250,000 - 15,437 636,437
President & CEO 2012 371,000 - - 250,000 - 18,750 639,750
John "Robert" A. Thorson 2014 149,000 122,705 128,838 132,100 25,287 25,117 583,047
SVP & Chief 2013 149,000 122,825 112,945 121,700 38,953 17,471 562,894
Financial Officer 2012 149,000 123,092 121,737 116,500 31,832 18,811 560,972
David L. Robinson 2014 150,000 123,772 130,611 90,300 21,734 18,587 535,004
SVP/Banking Division 2013 150,000 123,699 114,328 89,700 32,100 18,579 528,406
Manager 2012 150,000 123,552 122,298 92,800 26,405 15,334 530,389
Jennifer J. Finger(6) 2014 129,996 122,705 128,838 99,400 20,724 17,993 519,656
SVP & Treasurer 2013 129,996 122,825 112,945 98,500 30,877 17,827 512,970
2012 129,996 123,092 121,737 98,300 25,724 18,635 517,484
Dennis R. Hansen 2014 130,008 110,968 116,427 86,400 17,018 30,028 490,849
SVP/Operations & Systems 2013 130,008 110,586 101,881 84,000 25,226 35,054 486,755
Division Manager 2012 130,008 110,691 108,834 84,400 21,819 31,420 487,172
Summary Compensation Table For Fiscal Year 2014

20
15
W
EST
AM
ER
ICA
BA
NC
OR
PO
RA
TIO
N P
RO
XY
26
26
___________________(1) Stock Awards represent RPS shares as described in the Compensation Discussion & Analysis. The amounts shown represent the aggregate grant date fair market value. 2) Option awards represent Nonqualified Stock Options as described in the Compensation Discussion & Analysis. The amounts shown represent the aggregate grant date fair market value.(3) The amounts shown are non-equity incentive compensation only. No interest or other form of earnings was paid on the compensation.(4) The amounts include interest paid on deferred cash compensation to the extent the interest exceeds 120% of the long-term Applicable Federal Rates with compounding. The Corporation has no defined benefit pension plan. Mr. Payne has a pension agreement, which is discussed under “Pension Benefits for Fiscal Year 2014.” (5) Each of the above-named executive officers received less than $10,000 of aggregate perquisites and personal benefits, except for Mr. Hansen who received a car allowance of $12,000. All other compensation includes Corporation contributions to defined contribution plans (401(k) and Profit Sharing), and amounts added to taxable wages using IRS tables for the cost of providing group term life insurance coverage that is more than the cost of $50,000 of coverage. It also includes the dollar value of the benefit to Mr. Payne for the portion of the premium payable by the Corporation with respect to a split dollar life insurance policy (projected on an actuarial basis), and a bonus paid to Mr. Payne in the amount of his portion of the split dollar life insurance premium. (6) Ms. Finger resigned from the position of Treasurer of the Corporation on February 13, 2015.
Based on the compensation disclosed in the Summary Compensation Table, approximately 34% of total compensation comes from base salaries. See Compensation Discussion and Analysis for more details.
All Other Stock Awards: Number of
Shares of Stock
All Other Stock Awards: Number
of Securities Underlying
Exercise or Base Price of
Option Awards Grant DateName Grant Date Threshold Target Maximum or Units(1) Options(2) ($/Share)(2) Fair Value(3)
David L. Payne 1/23/14 $- $371,000 $556,500 - - - -
1/23/14 - - - - - - -
1/23/14 - - - - - - -
John "Robert" A. Thorson 1/23/14 - 100,000 150,000 - - - -
1/23/14 - - - 2,300 - - 122,705
1/23/14 - - - - 21,800 53.35 128,838
David L. Robinson 1/23/14 - 82,500 123,750 - - - -
1/23/14 - - - 2,320 - - 123,772
1/23/14 - - - - 22,100 53.35 130,611
Jennifer J. Finger(4) 1/23/14 - 82,000 123,000 - - - -
1/23/14 - - - 2,300 - - 122,705
1/23/14 - - - - 21,800 53.35 128,838
Dennis R. Hansen 1/23/14 - 73,900 110,850 - - - -
1/23/14 - - - 2,080 - - 110,968
1/23/14 - - - - 19,700 53.35 116,427
Grants of Plan-Based Awards Table For Fiscal Year 2014
Estimated Future Payouts Under Non-Equity Incentive Plan Awards
_____________________(1) Includes RPS grants. There is no dollar amount of consideration paid by any executive officer on the grant or vesting date of an award.The material terms of the RPS grants are as follows:• The performance and vesting period is three years;• Multiple performance goals are established by the Compensation Committee for each grant;• The Compensation Committee may revise the goals upon significant events;• Three-year performance criteria are limited to those provided in the 2012 Amended Plan, as described on page 16;• Accelerated vesting occurs upon dissolution or liquidation of the Corporation or sale of all assets to another entity or a tender offer for 5% or more of outstanding stock; and • No dividends are paid or accrued prior to settlement or deferral delivery of shares which takes place approximately two months after vesting. (2) Includes NQSO grants with an exercise price of not less than 100% of fair market value as of the date of grant.The material terms of the NQSO’s listed in the table are as follows:• Options vest ratably over three years beginning one year from date of grant;• Options expire 10 years following grant date; • Exercise price is 100% of fair market value as defined in the 2012 Amended Plan;• Dividends are not paid on unexercised options;• Vesting ceases upon termination of employment, whatever the reason, except if vesting is accelerated as described below; • Vested options may be exercised within 90 days of termination of employment and within one year upon death or disability; and• Accelerated vesting occurs upon a “change in control” as defined in the 2012 Amended Plan as described on page 29 of this Proxy statement. (3) The amounts shown for NQSOs and RPS awards represent the aggregate grant date fair market value.(4) Ms. Finger resigned from the position of Treasurer of the Corporation on February 13, 2015.

20
15
W
EST
AM
ER
ICA
BA
NC
OR
PO
RA
TIO
N P
RO
XY
20
15
W
EST
AM
ER
ICA
BA
NC
OR
PO
RA
TIO
N P
RO
XY
2727
Name
Number of Securities Underlying Unexercised Options
(#) Exercisable(1)
Number of Securities Underlying Unexercised Options
(#) Unexercisable(1)
Option Exercise
Price ($)(1)
Option Expiration
Date(1)
Equity Incentive Plan Awards:
Number of Unearned Shares,
Units or Other Rights That Have Not Vested (#)(2)
Equity Incentive Plan Awards: Market or
Payout Value of Unearned Shares,
Units or Other Rights That Have Not
Vested ($) valued at 12/31/14(2)
David L. Payne 250,000 - $52.539 1/26/2015John "Robert" A. Thorson 9,400 - 52.539 1/26/2015
18,437 - 52.560 1/26/201620,800 - 56.625 1/28/202021,200 - 50.760 1/27/202114,467 7,233 45.930 1/26/2022
8,167 16,333 43.710 1/24/2023- 21,800 53.350 1/23/2024 7,790 $381,866
David L. Robinson 9,000 - 52.539 1/26/201511,449 - 52.560 1/26/201611,175 - 48.390 1/25/201723,286 - 47.130 1/24/201820,900 - 56.625 1/28/202021,300 - 50.760 1/27/202114,533 7,267 45.930 1/26/2022
8,267 16,533 43.710 1/24/2023- 22,100 53.350 1/23/2024 7,840 384,317
Jennifer J. Finger 17,800 - 52.539 1/26/201522,600 - 52.560 1/26/201622,204 - 48.390 1/25/201711,048 - 47.130 1/24/201820,800 - 56.625 1/28/202021,200 - 50.760 1/27/202114,467 7,233 45.930 1/26/2022
8,167 16,333 43.710 1/24/2023- 21,800 53.350 1/23/2024 7,790 381,866
Dennis R. Hansen 9,000 - 52.539 1/26/201511,449 - 52.560 1/26/201619,882 - 48.390 1/25/201720,930 - 47.130 1/24/201819,600 - 43.015 1/21/201918,700 - 56.625 1/28/202019,200 - 50.760 1/27/202112,933 6,467 45.930 1/26/2022
7,367 14,733 43.710 1/24/2023- 19,700 53.350 1/23/2024 7,020 344,120
Outstanding Equity Awards Table at Fiscal Year End 2014
Option Awards Stock Awards
_____________________ (1) Option Awards vest ratably over three years beginning one year from date of grant. Options expiring in 2022 fully vested in January 2015. Options expiring in 2023 fully vest in January 2016. Options expiring in 2024 fully vest in January 2017. (2) RPS shares fully vest three years from date of grant if performance goals are met. RPS grants vest as follows: Ms. Finger - 2,680 shares vest in January 2015, and 2,810 shares vest in January 2016, and 2,300 vests in January 2017; Messrs. Thorson - 2,680 vest in January 2015, 2,810 shares vest in January 2016 and 2,300 shares vest in January 2017; Robinson - 2,690 shares vest in January 2015, 2,830 shares vest in January 2016, and 2,320 shares vest in January 2017; and Hansen - 2,410 shares vest in January 2015, 2,530 shares vest in January 2016, and 2,080 shares vest in January 2017. (3) Ms. Finger resigned from the position of Treasurer of the Corporation on February 13, 2015.

20
15
W
EST
AM
ER
ICA
BA
NC
OR
PO
RA
TIO
N P
RO
XY
28
28
NameNumber of Shares
Acquired on Exercise Value Realized on Exercise($)
Number of Shares Acquired on Vesting
Value Realized on Vesting($)(1)
David L. Payne 128,856 $479,074 2,500 $134,787
John "Robert" A. Thorson 5,000 7,305 2,420 130,474
David L. Robinson - - 2,440 131,553
Jennifer J. Finger(2) - - 2,420 130,474
Dennis R. Hansen - - 2,180 117,535
Option Exercises And Stock Vested Table For Fiscal Year 2014
Option Awards Stock Awards
_______________(1) Amounts represent value upon vesting of RPS shares. Dividends are paid in cash during deferral period and distributions are paid in stock. (2) Ms. Finger resigned from the position of Treasurer of the Corporation on February 13, 2015.
Name Plan NamePresent Value of
Accumulated BenefitPayments during last Fiscal Year
David L. Payne Non-Qualified Pension Agreement $5,835,629 $511,950
Pension Benefits For Fiscal Year 2014
During 1997, the Corporation entered into a nonqualified pension agreement with Mr. Payne in consideration of Mr. Payne’s agreement that RPS awards granted in 1995, 1996 and 1997 would be cancelled. In January 2000, the Compensation Committee, based on the Corporation’s achievement of certain performance goals which had first been established for Mr. Payne’s 1995, 1996 and 1997 RPS awards, determined Mr. Payne’s annual pension would be $511,950. The pension commenced in 2010 and will be paid to Mr. Payne for 20 years.
The discount rate used to determine the present value is 3.80%, as used by the Corporation in determining benefit obligations for its post-employment retirement benefits as of December 31, 2014. The obligation is an unfunded general obligation of the Corporation.
Name
Executive Contributions in Last
Fiscal Year(1)
Aggregate Earnings in Last
Fiscal Year(2)
Aggregate Withdrawals/
Distributions(3)
Aggregate Balance at Last
Fiscal Year End(4)
David L. Payne $- $- $- $-
John "Robert" A. Thorson - 84,291 - 1,549,492
David L. Robinson 57,675 (40,863) (29,093) 2,280,211
Jennifer J. Finger(5) 44,990 (79,086) (38,046) 2,500,719
Dennis R. Hansen 45,675 (30,771) (22,466) 1,771,206
Nonqualified Deferred Compensation Table For Fiscal Year 2014
_______________
(1) No RPS shares were deferred upon vesting in 2014. Non-equity incentive plan compensation deferred in 2014 was earned in 2013 and disclosed as compensation in the Summary Compensation Table for 2013 and is therefore excluded from the Summary Compensation Table for Fiscal Year 2014. (2) Includes change in value of deferred RPS shares, dividends earned on deferred RPS shares, and interest earned on deferred cash compensation. The amounts included in the Summary Compensation Table for Fiscal Year 2014 on page 25 are as follows: Ms. Finger - $20,724; Messrs. Thorson - $25,287; Robinson - $21,734; and Hansen - $17,018. (3) Includes dividends paid on deferred RPS shares. (4) Aggregate balance of deferred compensation reported as compensation prior to 2014 is as follows: Ms. Finger - $ 2,617,861; Messrs. Thorson - $1,465,201; Hansen - $1,824,443; and Robinson - $2,338,167. (5) Ms. Finger resigned from the position of Treasurer of the Corporation on February 13, 2015.

20
15
W
EST
AM
ER
ICA
BA
NC
OR
PO
RA
TIO
N P
RO
XY
20
15
W
EST
AM
ER
ICA
BA
NC
OR
PO
RA
TIO
N P
RO
XY
2929
Under the Westamerica Bancorporation and Subsidiaries Deferred Compensation Plan (the “Deferred Compensation Plan”), Directors and Officers may defer up to 100% of their Director’s compensation, salary and/or non-equity incentive compensation (cash bonus) into a non-qualified, unfunded deferred compensation program. The interest rate paid during 2014 was 5.60%. The interest rate may be changed annually. Interest is compounded semi-monthly. Participants choose in advance from the following distribution commencement dates: termination of employment, January 1 following termination of employment, or a specific date at least five years from date of deferral. Payment is made in a lump sum unless the participant chooses a four year, five year or ten year annual installment.
Under the Westamerica Bancorporation Deferral Plan, 100% of vested RPS grants may be deferred. Dividends paid on such issued and outstanding shares are paid in cash to the deferral participants, and are paid at the same rate as is paid to all other shareholders. The distribution of deferred RPS shares occurs at least two years after deferral, one month following termination, or the January 1 immediately following termination as elected by the participant at the time of deferral. If the participant is one of the named executive officers, benefit distributions that are made upon termination of employment may not start earlier than six months after the date of termination.
Potential Payments Upon Termination or Change in Control Payments to be made to the named executive officers in the event of termination of employment or change in control are described below.
TerminationVested NQSOs may be exercised within 90 days of termination and within one year of death or disability. RPS shares vest if the Compensation Committee determines performance goals are met. Terminated employees will receive vested RPS shares if the settlement date of the RPS grant occurs within 90 days of termination. Employees separating from service due to death, disability or retirement are eligible to receive a pro rata portion of granted RPS shares if the Compensation Committee determines that the performance goals are likely to be met for the grant period. The pro rata basis is determined by the number of full years of the vesting period completed before date of death, disability or retirement.
Deferred compensation account balances are distributed on January 1 following termination, or a specific date at least five years from the date of deferral in the form of annual payments over four years. Payment may also be made in a lump sum or in annual payments for five or 10 years as elected by the participant at the time of deferral. If the participant is one of the named executive officers, benefit distributions that are made upon termination of employment may not start earlier than six months after the date of termination.
Change in Control A change in control is defined under the 2012 Amended Plan as shareholder approval of a dissolution or liquidation of the Corporation or a sale of substantially all of the Corporation’s assets to another corporation, or a tender offer for 5% or more of the Corporation’s outstanding common stock or a merger in which the Corporation’s shareholders before the merger hold less than 50% of the voting power of the surviving corporation after the merger.
In the event of a change in control, unvested NQSOs and RPS shares immediately vest. The value of in-the-money options and RPS shares subject to accelerated vesting for each of the named executive officers is as follows: Messrs. Payne: $0; Thorson: $490,944; Robinson: $494,562; Ms. Finger: $490,944; and Messr. Hansen: $442,336. The value is computed by multiplying the difference between the market value on December 31, 2014, the last business day of 2014, and the exercise price of each option by the number of shares subject to
20
15
W
EST
AM
ER
ICA
BA
NC
OR
PO
RA
TIO
N P
RO
XY
30
30
accelerated vesting.
Under the Corporation’s Severance Payment Plan, executive officers receive six weeks pay for every year or partial year of service up to one year’s base salary (see Summary Compensation Table for Fiscal Year 2014 for annual base salary for all named executive officers). All named executive officers have met the service requirement for one year’s base salary. Severance pay is paid in a lump sum or on a semi-monthly basis at the discretion of the Corporation. The Severance Payment Plan is subject to Section 409A of the Internal Revenue Code.
Certain Relationships and Related Party Transactions
In accordance with the Audit Committee Charter, the Audit Committee is responsible for reviewing and approving or disapproving all related party transactions required to be disclosed by Item 404 of Regulation S-K for potential conflicts of interest. Additionally, the Corporation’s Code of Conduct and Ethics provides rules that restrict transactions with affiliated persons.
Certain of the Directors, executive officers and their associates have had banking transactions with subsidiaries of the Corporation in the ordinary course of business. With the exception of the Corporation’s Employee Loan Program, all outstanding loans and commitments included in such transactions were made on substantially the same terms, including interest rates and collateral, as those prevailing at the time for comparable transactions with other persons not related to the Corporation, did not involve more than a normal risk of collectability, and did not present other favorable features. As part of the Employee Loan Program, all employees, including executive officers, are eligible to receive mortgage loans with interest rates one percent (1%) below Westamerica Bank’s prevailing interest rate at the time of loan origination. Westamerica Bank makes all loans to executive officers under the Employee Loan Program in compliance with the applicable restrictions of Section 22(h) of the Federal Reserve Act. Messrs. Hansen, Payne and Thorson have mortgage loans through this Program. The largest aggregate amount of principal during 2014 was $244,716, $442,152, and $325,741, respectively. The principal amount outstanding at December 31, 2014 was $234,596, $423,287, and $299,280, respectively. The amount of principal paid during 2014 was $10,120, $18,865, and $26,462, respectively. The amount of interest paid during 2014 was $4,527, $8,129, and $5,889, respectively. The rate of interest payable on the loan is 1.875%, 1.875%, and 1.875%, respectively.
PROPOSAL 2 – APPROVE A NON-BINDING ADVISORY VOTEON THE COMPENSATION OF OUR NAMED EXECUTIVE OFFICERS
BackgroundThe 2010 Dodd-Frank Wall Street Reform and Consumer Protection Act (the “Dodd-Frank Act”) requires that shareholders cast a non-binding advisory vote on the executive compensation paid to the executive officers listed in the Summary Compensation Table (a so-called “say on pay” vote) as well as an advisory vote with respect to whether future say on pay votes will be held every one, two or three years. The result of the shareholder vote on the proposal to determine the frequency of future say on pay proposals was that shareholders should review executive compensation annually. Therefore, Proposal 2 requests that shareholders again approve the compensation paid to our named executive officers. Last year 98% of the shares voting on this proposal voted to support our corporation’s executive compensation strategy. The proposal to determine how often the say on pay proposal should be voted on by shareholders will again be brought to a shareholder vote in 2017, six years after the first frequency vote.
We believe that our compensation policies and procedures are centered on a pay-for-performance culture and are strongly aligned with the long-term interests of our shareholders. Our incentive compensation plan

20
15
W
EST
AM
ER
ICA
BA
NC
OR
PO
RA
TIO
N P
RO
XY
20
15
W
EST
AM
ER
ICA
BA
NC
OR
PO
RA
TIO
N P
RO
XY
3131
provides for the grant of incentive stock options, non-qualified stock options, stock appreciation rights, and restricted performance shares. The Summary Compensation Table shows very stable base salaries indicative of our greater emphasis on performance-based stock and non-stock awards. Our stock and option awards are based on a minimum achievement of meeting the “threshold” level for each pre-established objective. Both awards have a three-year vesting period. Our annual incentive plan incorporates at least four financial and/or strategic performance metrics in order to properly balance risk with the incentives to drive our key annual financial and/or strategic initiatives; in addition, the annual incentive program incorporates a 150% maximum payout to further manage risk and the possibility of excessive payments.
In 2003, shareholders approved the Corporation’s 2003 Amended Plan to include the following changes: • Disallowing re-pricing stock options for poor stock performance; • Limiting the number of shares that may be awarded; and • Requiring the Compensation Committee to meet the definition of independence to enable any
award intended to qualify as “performance-based compensation” to meet Section 162(m) of the Internal Revenue Code.
In 2009, shareholders re-approved the performance criteria for performance-based awards under the 2003 Amended Plan.
In 2012, shareholders approved the Corporation’s 2012 Amended and Restated Stock Option Plan of 1995. The 2012 Plan includes the following changes: changes:
• Reduced the number of shares available for future issuance from 4,307,593 to 1,500,000 (plus shares that become available if awards under prior plans expire unexercised or are cancelled, forfeited or terminated before being exercised; and
• Extended the term of the 2012 Plan to April 24, 2022 from April 24, 2013.
Vote RequiredThe “say on pay” proposal gives you as a shareholder the opportunity to endorse or not endorse our executive pay program through the following resolution:
“Resolved, that the shareholders approve, on an advisory basis, the compensation of the named executive officers, as disclosed pursuant to the compensation disclosure rules of the Securities and Exchange Commission, which disclosure includes the compensation discussion and analysis, the compensation tables and any related footnotes and narratives in the Corporation’s proxy statement for the Annual Meeting of Shareholders.”
Because your vote is advisory, it will not be binding on the Board or create or imply any additional fiduciary duty by the Board. However, the Compensation Committee may take into account the outcome of the vote when considering future executive compensation arrangements.
THE BOARD OF DIRECTORS UNANIMOUSLY RECOMMENDS A VOTE “FOR” THE APPROVAL OF THE COMPENSATION OF OUR NAMED EXECUTIVE OFFICERS, AS DISCLOSED IN THIS PROXY STATEMENT PURSUANT TO THE COMPENSATION DISCLOSURE RULES OF THE SECURITIES AND EXCHANGE COMMISSION.

20
15
W
EST
AM
ER
ICA
BA
NC
OR
PO
RA
TIO
N P
RO
XY
32
32
PROPOSAL 3 – RATIFY SELECTION OF INDEPENDENT AUDITOR
The Audit Committee has approved the selection of the firm of Crowe Horwath LLP to serve as independent auditors for 2015 to examine the consolidated financial statements of the Corporation. Action by the shareholders is not required by law in the appointment of independent auditors, but their appointment is submitted by the Audit Committee and the Board of Directors in order to give the shareholders an opportunity to present their views. If the proposal is approved, the Audit Committee, in its discretion, may direct the appointment of different independent auditors at any time during the year if it determines that such a change would be in the best interests of the Corporation and its shareholders. If the proposal to ratify the selection of Crowe Horwath LLP as the Corporation’s independent auditors is rejected by the shareholders then the Audit Committee will reconsider its choice of independent auditors. A representative of Crowe Horwath LLP is expected to be present at the Annual Meeting and will have an opportunity to make a statement if they so desire and will be available to respond to appropriate questions.
Audit Fees The aggregate fees billed to the Corporation by KPMG LLP, the independent audit firm for fiscal 2014 and 2013, with respect to services performed are as follows:
1 2014 2013
Audit fees(4) $900,000 $712,500 Audit-related fees – – Tax fees – – All other fees – –
________ ________ $900,000 $712,500
Preapproval Policies and ProceduresThe Audit Committee is responsible for the appointment, compensation, retention and oversight of the work of any public accounting firm engaged by the Corporation for the purpose of preparing or issuing an audit report or performing other audit, review or attest services for the Corporation. Any accounting firm appointed by the Corporation reports directly to the Audit Committee.
The Audit Committee must preapprove all auditing services and permitted non-audit services by its independent auditors and the fees to be paid by the Corporation for these services, except for those fees qualifying for the “de minimis exception” which provides that the preapproval requirement for certain non-audit services may be waived if certain express standards and requirements are satisfied prior to completion of the audit under certain conditions. This exception requires that the aggregate amount of all such services provided constitutes no more than five percent of the total amount of revenue paid to the audit firm by the Corporation during the fiscal year in which the services are provided. This exception also requires that at the time of the engagement, the Corporation did not recognize such services to be non-audit services, and such services are promptly brought to the attention of the Audit Committee and approved prior to the completion of the audit by the Audit Committee. During fiscal year 2014, there were no non-audit services that were provided using this exception.
The Audit Committee may delegate to one or more members of the Audit Committee the authority to grant preapprovals of non-audit services and fees. In such event, the decisions of the member or members
(4) Audit fees consisted of fees billed by KPMG for professional services rendered for the audit of the Corporation’s consolidated financial statements, reviews of the consolidated financial statements included in the Corporation’s quarterly reports on Form 10-Q, and the audit of the Corporation’s internal controls over financial reporting. The audit fees also relate to services such as consents and audits of mortgage banking subsidiaries.

20
15
W
EST
AM
ER
ICA
BA
NC
OR
PO
RA
TIO
N P
RO
XY
20
15
W
EST
AM
ER
ICA
BA
NC
OR
PO
RA
TIO
N P
RO
XY
3333
of the Committee regarding preapprovals are presented to the full Audit Committee at its next meeting. The Audit Committee preapproved 100% of all services performed on behalf of the Corporation by KPMG LLP during fiscal year 2014.
THE BOARD OF DIRECTORS RECOMMENDS THAT YOU VOTE “FOR” THE RATIFICATION OF THE SELECTION OF CROWE HORWATH LLP AS OUR INDEPENDENT REGISTERED PUBLIC ACCOUNTING FIRM.
AUDIT COMMITTEE REPORT
The material in this report is not soliciting material and is not deemed filed with the SEC. It is not incorporated by reference in any of the Corporation’s filings under the Securities Act of 1933 or the Exchange Act, whether made in the past or in the future even if any of those filings contain any general incorporation language.
The Audit Committee is composed of four Directors who are neither officers nor employees of the Corporation, and who meet the NASDAQ independence requirements for Audit Committee members. The Audit Committee selects, appoints and retains the Corporation’s independent auditors and is responsible for their compensation and oversight.
In performing its functions, the Audit Committee acts only in an oversight capacity and necessarily relies on the work and assurances of the Corporation’s management, which has the primary responsibility for financial statements and reports, and of the independent auditors. The auditors express an opinion on the conformity of the Corporation’s annual financial statements to generally accepted accounting principles. In fulfilling its oversight responsibilities, the Audit Committee reviewed the audited consolidated financial statements for the fiscal year 2014 and discussed them with Management and with KPMG, the Corporation’s independent auditors.
Management represented to the Audit Committee that the Corporation’s consolidated financial statements were prepared in accordance with generally accepted accounting principles. Management also represented that it performed an assessment of the effectiveness of internal control over financial reporting as of December 31, 2014, and that internal control over financial reporting was effective. The Audit Committee discussed with the auditors matters required to be discussed by Statement on Auditing Standards No. 114 (The Auditor’s Communication with Those Charged with Governance) as amended, including the auditors’ judgment about the quality as well as the acceptability of the Corporation’s accounting principles, as applied in its financial reporting.
The auditors also provided to the Audit Committee the written disclosures and the letter from the independent auditors required by Independence Standards Board Standard No. 1 (Independence Discussions with Audit Committees). The Audit Committee discussed with auditors the firm’s independence.
Based on the Audit Committee’s discussion with Management and the independent auditors, the Audit Committee’s review of the representations of Management and the report of the independent auditors to the Audit Committee, the Audit Committee recommended that the Board of Directors include the audited consolidated financial statements in the Corporation’s Annual Report on Form 10-K for the year ended December 31, 2014 for filing with the SEC.

20
15
W
EST
AM
ER
ICA
BA
NC
OR
PO
RA
TIO
N P
RO
XY
34
34
Submitted by the Audit Committee Ronald A. Nelson, Chairman Louis E. Bartolini E. Joseph Bowler Catherine C. MacMillan
SHAREHOLDER PROPOSAL GUIDELINES
To be considered for inclusion in the Corporation’s Proxy Statement and form of proxy for next year’s Annual Meeting, shareholder proposals must be delivered to the Corporate Secretary, Westamerica Bancorporation A-2M, P.O. Box 1200, Suisun City, CA 94585, no later than 5:00 p.m. on November 9, 2015. However, if the date of next year’s Annual Meeting is changed by more than 30 days from the date of this year’s meeting, the notice must be received by the Corporate Secretary a reasonable time before we begin to produce and distribute our Proxy Statement. All such proposals must meet the requirements of Rule 14a-8 under the Exchange Act.
In order for business, other than a shareholder proposal submitted for the Corporation’s Proxy Statement, to be properly brought before next year’s Annual Meeting by a shareholder, the shareholder must give timely written notice to the Corporate Secretary. To be timely, written notice must be received by the Corporate Secretary at least 45 days before the anniversary of the day our Proxy Statement was mailed to shareholders in connection with the previous year’s Annual Meeting or January 22, 2016, for the 2016 Annual Meeting. If the date of the Annual Meeting is changed by more than 30 days, the deadline is a reasonable time before we begin to produce and distribute our Proxy Statement. A shareholder’s notice must set forth a brief description of the proposed business, the name and residence address of the shareholder, the number of shares of the Corporation’s common stock that the shareholder owns and any material interest the shareholder has in the proposed business.
Westamerica reserves the right to reject, to rule out of order, or to take other appropriate action with respect to any proposal that does not comply with these and other applicable legal requirements.
SHAREHOLDER COMMUNICATION TO BOARD OF DIRECTORS
Shareholders and other interested parties who wish to communicate with the Board may do so by writing to: Kris Irvine, VP/Corporate Secretary, Westamerica Bancorporation A-2M, P.O. Box 1200, Suisun City, CA 94585. The Directors have established procedures for the handling of communications from shareholders and other interested parties and have directed the Corporate Secretary to act as their agent in processing any communications received. All communications that relate to matters that are within the responsibility of one of the Board Committees are to be forwarded to the Chair of the appropriate Committee. Communications that relate to ordinary business matters that are not within the scope of the Board’s responsibilities, such as customer complaints, are to be sent to Management. Solicitations, junk mail and obviously frivolous or inappropriate communications are not to be forwarded, but will be made available to any Director who wishes to review them.
OTHER MATTERS The Board of Directors does not know of any matters to be presented at the Annual Meeting other than those specifically referred to in this Proxy Statement. If any other matters should properly come before the meeting or any postponement or adjournment of the meeting, the persons named in the enclosed proxy intend to vote thereon in accordance with their best business judgment. If a nominee for Director becomes unavailable to serve as a Director, the Proxies will vote for any substitute nominated by the Board of Directors.

20
15
W
EST
AM
ER
ICA
BA
NC
OR
PO
RA
TIO
N P
RO
XY
20
15
W
EST
AM
ER
ICA
BA
NC
OR
PO
RA
TIO
N P
RO
XY
3535
The Corporation will pay the cost of proxy solicitation. The Corporation has retained the services of Georgeson to assist in the proxy distribution at a cost not to exceed $2,000 plus reasonable out-of-pocket expenses. The Corporation will reimburse banks, brokers and others holding stock in their names or names of nominees or otherwise, for reasonable out-of-pocket expenses incurred in sending proxies and proxy materials to the holders of such stock.
BY ORDER OF THE BOARD OF DIRECTORS
Kris Irvine VP/Corporate Secretary
Dated: March 9, 2015

20
15
W
EST
AM
ER
ICA
BA
NC
OR
PO
RA
TIO
N P
RO
XY
A-1
A-1
EXHIBIT A Westamerica Bancorporation
Audit Committee Charter – Approved April, 2014
The Audit Committee is appointed by the Board to assist the Board in monitoring (1) the integrity of Westamerica Bancorporation’s ( “Company”) financial statements, (2) the compliance by the Company with legal and regulatory requirements, (3) the independence, qualifications and performance of the Company’s registered public accounting firms (“independent auditor” or “independent auditors”) preparing or issuing an audit report or performing other audit, review or attest services for the Company and (4) the Company’s internal audit and control function. The Audit Committee shall prepare the report that the Securities and Exchange Commission (“SEC”) rules require be included in the Company’s annual proxy statement.
While the Audit Committee has the responsibilities and powers set forth in this Charter, it is not the duty of the Audit Committee to plan or conduct audits, or to determine that the Company’s financial statements are complete and accurate and are in accordance with generally accepted accounting principles. This is the responsibility of management and the independent auditor.
The function of the Audit Committee is oversight. Management is responsible for the preparation and integrity of the Company’s financial statements. Management is responsible for maintaining appropriate accounting and financial reporting policies and an appropriate internal control environment. Subject to appointment, review and oversight by the Audit Committee, the independent auditor is responsible for planning and conducting a proper audit of the Company’s internal control environment and of its annual financial statements, reviewing the Company’s quarterly financial statements prior to the filing of each quarterly report on Form 10-Q, and other procedures.
The members of the Audit Committee shall meet the independence requirements of The Nasdaq Stock Market (“Nasdaq”) and the rules and regulations of the SEC. No member shall be an affiliated person (as defined in relevant SEC or Nasdaq rules) of the Company or any of its subsidiaries or have participated at any time in the preparation of financial statements of the Company or any current subsidiary during the prior three years, and each member shall be free of any relationship that would interfere with the exercise of his or her independent judgment in carrying out the responsibilities of a member of the Audit Committee. The Audit Committee shall include members with banking or related financial management expertise who are able to read and understand fundamental financial statements, including the Company’s balance sheet, income statement and cash flow statement, and at least one member must have the additional financial sophistication as required by and as defined in Nasdaq rules.
The Committee shall be subject to the provisions of the Company’s bylaws relating to committees of the Board, including those provisions relating to removing committee members and filling vacancies. The members of the Audit Committee and its Chairman shall be appointed and may be removed by the Board on its own initiative or at the recommendation of the Nominating Committee. The Audit Committee shall have no fewer than three members. If not designated by the Board, the Audit Committee may designate a member as its Chair.
The Audit Committee, in its capacity as a committee of the Board, shall be directly responsible for the appointment, compensation, retention, termination and oversight of the work of any independent auditors, and each independent auditor must report directly to the Audit Committee. The Audit Committee, or its designee, will sign the independent auditor engagement letter. The Audit Committee shall be directly responsible for the resolution of disagreements between management and the independent auditor regarding financial reporting.

20
15
W
EST
AM
ER
ICA
BA
NC
OR
PO
RA
TIO
N P
RO
XY
20
15
W
EST
AM
ER
ICA
BA
NC
OR
PO
RA
TIO
N P
RO
XY
A-2A-2
The Audit Committee shall have the authority to retain independent legal, accounting or other advisors as it deems necessary to carry out its duties. The Company shall provide for appropriate funding, as determined by the Audit Committee, for payment of compensation to any independent auditor engaged for the purpose of preparing or issuing an audit report or performing other audit, review or attest services, compensation to any advisors employed by the Audit Committee, and ordinary administrative expenses that the Audit Committee deems to be necessary or appropriate in carrying out its duties.
The Audit Committee may request any officer or employee of the Company or the Company’s outside counsel or independent auditor to attend a meeting of the Audit Committee.
The Audit Committee shall pre-approve all auditing services and permitted non-audit services and fees to be paid for such services to be performed for the Company by its independent auditor, subject to the limited de minimis exceptions for non-audit services described in Section 10A of the Securities Exchange Act of 1934, provided that compliance with the limitations and procedural requirements of Section 10A is fulfilled. The Audit Committee may delegate to one or more designated members of the committee the authority to grant pre-approvals of non-audit services and fees. Any such pre-approval shall be presented to the full Audit Committee at its next scheduled meeting.
The Audit Committee shall make regular reports to the Board.
The Audit Committee shall have the authority to conduct investigations that are related to its responsibilities under this Charter or otherwise assigned to it by the Board.
In addition, the Audit Committee, to the extent that it deems necessary or appropriate shall:
Financial Statement and Disclosure Matters
1. Prepare the report required by the rules of the SEC to be included in the Company’s annual proxy statement.
2. Review the annual audited financial statements with management and the independent auditor, including disclosures made in “Management’s Discussion and Analysis of Financial Condition and Results of Operations,” and recommend to the Board whether the audited financial statements should be included in the Company’s Form 10-K.
3. Review with management and the independent auditor any significant financial reporting issues and judgments made in connection with the preparation of the Company’s financial statements, including any significant changes in the Company’s selection or application of accounting policies, practices and estimates, significant unusual transactions, any major issues as to the adequacy of the Company’s internal controls and any special steps adopted in light of material control deficiencies; and review any reports prepared by or for management or the auditor with respect to these matters.
4. Review with the independent auditor their views regarding significant accounting or auditing matters when the independent auditor is aware that management consulted with other accountants about such matters and the independent auditor has identified a concern regarding these matters.
5. Obtain from the independent auditor information about significant aspects of the annual audit, including:(a) an overview of the overall audit strategy, particularly the timing of the audit, significant risks
the auditor identified and significant changes to the planned audit strategy or identified risk; (b) information about the nature and extent of specialized skill or knowledge needed in the audit;
the extent of the planned use of internal auditors; company personnel or other third parties; and other independent public accounting firms or other persons not employed by the auditor who are involved in the audit;

20
15
W
EST
AM
ER
ICA
BA
NC
OR
PO
RA
TIO
N P
RO
XY
A-3
A-3
(c) the basis for the auditor’s determination that he or she can serve as principal auditor, if sig-nificant parts of the audit will be performed by other auditors;
(d) situations in which the auditor identified a concern regarding management’s anticipated ap-plication of accounting pronouncements that have been issued but are not yet effective and might have a significant effect on future financial reporting;
(e) difficult or contentious matters for which the auditor consulted outside the engagement team; (f) the auditor’s evaluation of going concern; (g) departure from the auditor’s standard report; (h) other matters arising from the audit that are significant to the oversight of the Company’s fi-
nancial reporting process, including complaints or concerns regarding accounting or auditing matters that have come to the auditor’s attention during the audit;
(i) any difficulties encountered in the course of the audit work, including any restrictions on the scope of activities or access to required information;
(j) any significant disagreements with management. 6. Annually review with the independent auditor the quality of the Company’s financial reporting,
internal accounting and financial control, the auditor’s report or opinion thereon and any recom-mendations the auditor may have for improving or changing the Company’s internal controls, as well as management’s letter in response thereto and any other matters required to be discussed under relevant Statements of Auditing Standards and PCAOB Auditing Standard No. 16 (as they may be modified or supplemented).
7. Review management’s proposed annual report on internal control over financial reporting which is required to be included in the Company’s 10-K pursuant to rules of the SEC.
8. Review with management and the independent auditor the Company’s quarterly financial state-ments prior to the filing of its Form 10-Q, including the results of the independent auditor’s re-view of the quarterly financial statements.
9. Review and discuss quarterly reports from the independent auditors on: (a) all critical accounting policies and practices to be used; (b) all alternative treatments of financial information within generally accepted accounting prin-
ciples that have been discussed with management, ramifications of the use of such alternative treatments, and the treatment preferred by the independent auditor;
(c) the matters required to be discussed by Statements on Auditing Standards, as may be amend-ed or supplemented, relating to the audit of the Company’s periodic reports; and
(d) other material written communications between the independent auditor and management. 10. Meet periodically with management to review the Company’s major financial risk exposures and
the policies and procedures that management utilizes to monitor and control such exposures. 11. Discuss, prior to release by the Company, the earnings press releases (paying particular attention
to any use of “pro forma,” or “adjusted” or other non-GAAP information) as well as financial in-formation and earnings guidance provided to analysts and rating agencies, if any, as well as any financial information which the Company proposes to provide to financial analysts and rating agencies (being mindful of the need to avoid violations of SEC Regulation FD, which prohibits the selective disclosure of material information).
12. Discuss the quarterly and annual financial statements with the appropriate officers and/or em-ployees of the Company and with the independent auditor, including the Company’s disclosures under “Management’s Discussion and Analysis of Financial Condition and Results of Opera-tions.”
13. Review the schedule of unrecorded adjustments to the Company’s financial statements and the reasons underlying the Company’s assessment of the immateriality of such adjustments.
14. Review prior to publication or filing and approve such other Company financial information, in-cluding appropriate regulatory filings and releases that include financial information, as the Audit Committee deems desirable.
15. Review the adequacy of the Company’s system of internal accounting and financial control, in-cluding its “disclosure controls and procedures” and “internal control over financial reporting,” as defined in SEC Rules 13a-15(e) and 13a-15(f) under the Securities Exchange Act of 1934, and the Chief Executive Officer’s (“CEO”) and Chief Financial Officer’s (“CFO”) proposed disclo-
20
15
W
EST
AM
ER
ICA
BA
NC
OR
PO
RA
TIO
N P
RO
XY
20
15
W
EST
AM
ER
ICA
BA
NC
OR
PO
RA
TIO
N P
RO
XY
A-4A-4
sures and certifications with respect to these matters which are required to be included in the Company’s annual and quarterly reports to the SEC on Form 10-K and Form 10-Q.
16. Review disclosures made to the Audit Committee by the Company’s CEO and CFO during their certification process for the Form 10-K and Form 10-Q about any significant deficiencies in the design or operation of internal controls or material weaknesses therein and any fraud involving management or other employees who have a significant role in the Company’s internal controls.
17. Review the effect of regulatory and accounting initiatives on the financial statements of the Com-pany.
Oversight of the Company’s Relationship with its Independent Auditors
18. Review and evaluate the experience and qualifications of the lead members of each independent auditor’s team.
19. Evaluate the performance and independence of each independent auditor, including considering whether the auditor’s quality controls are adequate and the provision of permitted non-audit ser-vices is compatible with maintaining the auditor’s independence. The opinions of management and the internal auditor shall be taken into consideration as part of this review.
20. Receive and review a report from each independent auditor at least annually regarding the inde-pendent auditor’s independence and discuss such reports with the auditor. Ensure that each inde-pendent auditor submits a formal written statement, as required by PCAOB Rule 3526, as it may be amended or supplemented, describing all relationships between the independent auditor and any of its affiliates and the Company that might bear on the independent auditor’s independence. The independent auditor must also discuss with the Audit Committee the potential effects of any such relationships on the firm’s independence. Receive and review a formal written statement of the fees billed by the independent auditor for each of the categories of services requiring separate disclosure in the annual proxy statement.
21. Obtain and review a report from each independent auditor at least annually regarding the inde-pendent auditor’s internal quality control procedures. The report should include any material is-sues raised by the most recent internal quality control review or peer review of the firm, or by any inquiry or investigation by governmental or professional authorities within the preceding five years respecting one or more independent audits carried out by the firm, and any steps taken to deal with any such issues. Obtain auditor and review inspection reports issued by the PCAOB under Section 104 of the Sarbanes-Oxley Act.
22. Meet with each independent auditor prior to the audit to review the planning and staffing of the audit.
23. Advise the Board of its determinations regarding the qualification, independence and performance of each independent auditor.
24. Annually require the independent auditor to confirm in writing its understanding of the fact that it is ultimately accountable to the Audit Committee.
25. Require the independent auditor to rotate every five years the lead audit partner in charge of the Company’s audit and the concurring audit partner responsible for reviewing the audit.
26. Periodically consider the advisability of rotating the independent audit firm to be selected as the Company’s independent auditors. The Audit Committee should present its conclusions to the full Board.
Oversight of the Company’s Internal Audit Function
27. Review and, at its option, recommend the appointment and replacement of the senior internal auditing executive.
28. Review any reports to management prepared by the internal auditing department and management’s responses.
29. Review with each independent auditor, management and the senior internal auditing executive the internal audit department responsibilities, budget, structure and staffing and any recommended changes in the planned scope of the internal audit at least annually.

20
15
W
EST
AM
ER
ICA
BA
NC
OR
PO
RA
TIO
N P
RO
XY
A-5
A-5
Compliance Oversight Responsibilities
30. Obtain reports from management and the Company’s senior internal auditing executive that the Company’s subsidiary affiliated entities are in conformity with applicable regulatory and legal requirements and the Company’s code of ethics.
31. Advise the Board with respect to the Company’s compliance with the Company’s Code of Ethics for Chief Executive Officer and Senior Financial Officers.
32. Establish procedures for the receipt, retention and treatment of complaints received by the Company regarding accounting, internal accounting controls or auditing matters, and the confidential, anonymous submission by employees of concerns regarding questionable accounting or auditing matters.
33. Discuss with management and each independent auditor any correspondence with regulators or governmental agencies and any published reports that raise material issues regarding the Company’s financial statements or accounting policies.
34. Review with appropriate members of management or appropriate legal counsel the Company’s compliance policies, legal matters that may have a material impact on the financial statements and any material reports or inquiries received from regulators or governmental agencies.
35. Review for approval or disapproval all related-party transactions required to be disclosed by Item 404 of Regulation S-K for potential conflicts of interests.
36. In the event the Audit Committee is made aware of any allegation of fraud relating to the Company and/or any of its officers, directors or employees that the Audit Committee deems could be material to the Company’s business or operations, the Audit Committee shall (i) convene a meeting of the Audit Committee to review such allegation and (ii) if the Audit Committee deems it necessary or advisable, it shall engage independent counsel to assist in an investigation, including, if the Audit Committee and such counsel deem it necessary or advisable, an investigation to determine whether such allegation implicates any violation of Section 10A of the Exchange Act of 1934. If pursuant to such investigation the Audit Committee discovers that a material fraud has occurred, the Audit Committee shall (i) assess the Company’s internal controls and implement such remedial measures as it determines necessary or advisable, (ii) cause the Company to take appropriate action against the perpetrator(s) of such fraud and (iii) cause the Company to make appropriate disclosures relating to the matter in the Company’s periodic reports filed with the SEC or otherwise.
37. The Audit Committee shall also be designated as the committee of the Board of Directors that shall receive, review and take action with respect to any reports by attorneys, pursuant to Section 307 of the Sarbanes-Oxley Act of 2002, of evidence of material violations of securities laws or breaches of fiduciary duty or similar violations by the Company or one of its agents.
38. Meet at least four times each year. In addition, meet at least four times each year in separate executive sessions with each of the Company’s CEO, senior internal audit executive and the independent auditor; and each such person shall have free and direct access to the Audit Committee and any of its members.
39. Review and approve all related-party transactions (e.g. transactions with any director or executive officer of the Company or significant shareholder, or their immediate family members or affiliates), other than transactions which the Board has delegated to the Company’s Employee Benefits/Compensation Committee or Loan & Investment Committee.
40. Annually review and reassess the adequacy of this Charter and any bylaw of the Company which relates to the Audit Committee, and recommend any proposed changes to the Board for approval. The Chair of the Audit Committee shall draft a proposed schedule of the Audit Committee’s activities for the coming year and the times at which such activities shall occur, which shall be submitted to the Audit Committee for its review and approval, with such changes as the Audit Committee shall determine to be appropriate.

20
15
W
EST
AM
ER
ICA
BA
NC
OR
PO
RA
TIO
N P
RO
XY
20
15
W
EST
AM
ER
ICA
BA
NC
OR
PO
RA
TIO
N P
RO
XY
(This page intentionally left blank.)

20
14
W
EST
AM
ER
ICA
BA
NC
OR
PO
RA
TIO
N FO
RM
10
-K
20
15
W
EST
AM
ER
ICA
BA
NC
OR
PO
RA
TIO
N P
RO
XY
UNITED STATES SECURITIES AND EXCHANGE COMMISSIONWASHINGTON, D.C. 20549
FORM 10-K(Mark one)
ANNUAL REPORT PURSUANT TO SECTION 13 OR 15(d) OF THE SECURITIES EXCHANGE ACT OF 1934 For the fiscal year ended December 31, 2014
orTRANSITION REPORT PURSUANT TO SECTION 13 OR 15(d) OF THE SECURITIES EXCHANGE ACT OF 1934
For the transition period from ______________ to______________.
Commission File Number: 001-09383
WESTAMERICA BANCORPORATION(Exact name of the registrant as specified in its charter)
CALIFORNIA 94-2156203(State or Other Jurisdiction (I.R.S. Employer
of Incorporation or Organization) Identification Number)
1108 FIFTH AVENUE, SAN RAFAEL, CALIFORNIA 94901 (Address of principal executive offices) (zip code)
Registrant’s telephone number, including area code: (707) 863-6000
Securities registered pursuant to Section 12(b) of the Act:
Title of class: Name of each exchange on which registered: Common Stock, no par value The NASDAQ Stock Market LLC
Securities registered pursuant to Section 12(g) of the Act: None
Indicate by check mark if the registrant is a well-known seasoned issuer, as defined in Rule 405 of the Securities Act. YES NO
Indicate by check mark if the registrant is not required to file reports pursuant to Section 13 or Section 15(d) of the Act. YES NO
Indicate by check mark whether the registrant: (1) has filed all reports required to be filed by Section 13 or 15(d) of the Securities Exchange Act of 1934 during the preceding 12 months (or for such shorter period that the registrant was required to file such reports), and (2) has been subject to such filing requirements for the past 90 days. YES NO
Indicate by check mark if whether the registrant has submitted electronically and posted on its corporate Web site, if any, every Interactive Data File required to be submitted and posted pursuant to Rule 405 of Regulation S-T (section 232.405 of this chapter during the preceding 12 months (or for such shorter period that the registrant was required to submit and post such files.) YES NO
Indicate by check mark if disclosure of delinquent filers pursuant to item 405 of Regulation S-K (section 229.405 of this chapter) is not contained herein, and will not be contained, to the best of the registrant’s knowledge, in definitive proxy or information statements incorporated by reference in Part III of this Form 10-K or any amendment to this Form 10-K.
Indicate by check mark whether the registrant is a large accelerated filer, an accelerated filer, a non-accelerated filer, or a smaller reporting company. See the definitions of “large accelerated filer,” “accelerated filer,” and “smaller reporting company” in Rule 12b-2 of the Exchange Act.
Large accelerated filer Accelerated filer Non-accelerated filer Smaller reporting company (Do not check if a smaller reporting company)
Indicate by check mark whether the registrant is a shell company (as defined in Rule 12b-2 of the Exchange Act). YES NO
The aggregate market value of the Common Stock held by non-affiliates of the registrant as of June 30, 2014 as reported on the NASDAQ Global Select Market, was $1,302,200,421.01. Shares of Common Stock held by each executive officer and director and by each person who owns 10% or more of the outstanding Common Stock have been excluded in that such persons may be deemed to be affiliates. This determination of affiliate status is not necessarily a conclusive determination for other purposes.
Number of shares outstanding of each of the registrant’s classes of common stock, as of the close of business on February 19, 201525,620,264 Shares
DOCUMENTS INCORPORATED BY REFERENCE
Portions of the definitive Proxy Statement relating to registrant’s Annual Meeting of Shareholders, to be held on April 23, 2015, are incorporated by reference in Items 10, 11, 12, 13 and 14 of Part III to the extent described therein.

20
14
W
EST
AM
ER
ICA
BA
NC
OR
PO
RA
TIO
N F
OR
M 1
0-K
20
15
W
EST
AM
ER
ICA
BA
NC
OR
PO
RA
TIO
N P
RO
XY
1 - 1 -
TABLE OF CONTENTS
Page PART I
Item 1 Business................................................................................................................................................................ 2
Item 1A Risk Factors .......................................................................................................................................................... 9
Item 1B Unresolved Staff Comments................................................................................................................................. 13
Item 2 Properties .............................................................................................................................................................. 13
Item 3 Legal Proceedings................................................................................................................................................. 13
Item 4 Mine Safety Disclosures ....................................................................................................................................... 14
PART II
Item 5 Market for Registrant’s Common Equity, Related Stockholder Matters and
Issuer Purchases of Equity Securities ................................................................................................................... 14
Item 6 Selected Financial Data ........................................................................................................................................ 18
Item 7 Management’s Discussion and Analysis of Financial Condition and Results of Operations ............................... 19
Item 7A Quantitative and Qualitative Disclosures About Market Risk.............................................................................. 47
Item 8 Financial Statements and Supplementary Data..................................................................................................... 47
Item 9 Changes in and Disagreements with Accountants on Accounting and Financial Disclosure ............................... 90
Item 9A Controls and Procedures ....................................................................................................................................... 90
Item 9B Other Information ................................................................................................................................................. 90
PART III
Item 10 Directors, Executive Officers and Corporate Governance.................................................................................... 91
Item 11 Executive Compensation ...................................................................................................................................... 91
Item 12 Security Ownership of Certain Beneficial Owners and Management and Related Stockholder Matters ............. 92
Item 13 Certain Relationships, Related Transactions and Director Independence ............................................................ 92
Item 14 Principal Accountant Fees and Services ............................................................................................................... 92
PART IV
Item 15 Exhibits, Financial Statement Schedules .............................................................................................................. 92
Signatures ............................................................................................................................................................................. 93
Exhibit Index ........................................................................................................................................................................ 94

20
14
W
EST
AM
ER
ICA
BA
NC
OR
PO
RA
TIO
N FO
RM
10
-K
20
15
W
EST
AM
ER
ICA
BA
NC
OR
PO
RA
TIO
N P
RO
XY
2
- 2 -
FORWARD-LOOKING STATEMENTS
This report on Form 10-K contains forward-looking statements about Westamerica Bancorporation for which it claims the protection of the safe harbor provisions contained in the Private Securities Litigation Reform Act of 1995. Examples of forward-looking statements include, but are not limited to: (i) projections of revenues, expenses, income or loss, earnings or loss per share, the payment or nonpayment of dividends, capital structure and other financial items; (ii) statements of plans, objectives and expectations of the Company or its management or board of directors, including those relating to products or services; (iii) statements of future economic performance; and (iv) statements of assumptions underlying such statements. Words such as "believes", "anticipates", "expects", "intends", "targeted", "projected", "continue", "remain", "will", "should", "may" and othersimilar expressions are intended to identify forward-looking statements but are not the exclusive means of identifying such statements.
These forward-looking statements are based on Management’s current knowledge and belief and include information concerning the Company’s possible or assumed future financial condition and results of operations. A number of factors, some of which are beyond the Company’s ability to predict or control, could cause future results to differ materially from those contemplated. Thesefactors include but are not limited to (1) the length and severity of difficulties in the global, national and California economies and the effects of government efforts to address those difficulties; (2) liquidity levels in capital markets; (3) fluctuations in asset prices including, but not limited to stocks, bonds, real estate, and commodities; (4) the effect of acquisitions and integration of acquired businesses; (5) economic uncertainty created by terrorist threats and attacks on the United States, the actions taken in response,and the uncertain effect of these events on the national and regional economies; (6) changes in the interest rate environment; (7) changes in the regulatory environment; (8) competitive pressure in the banking industry; (9) operational risks including a failure or breach in data processing systems or those of third party vendors and other service providers, including as a result of cyberattacks or fraud; (10) volatility of interest rate sensitive loans, deposits and investments; (11) asset/liability management risks and liquidity risks; (12) the effect of natural disasters, including earthquakes, fire, flood, drought, and other disasters, on the uninsured value of loan collateral, the financial condition of debtors and issuers of investment securities, the economic conditions affectingthe Company’s market place, and commodities and asset values, and (13) changes in the securities markets. The Company undertakes no obligation to update any forward-looking statements in this report. See also “Risk Factors” in Item 1A and other risk factors discussed elsewhere in this Report.
PART I
ITEM 1. BUSINESS
Westamerica Bancorporation (the “Company”) is a bank holding company registered under the Bank Holding Company Act of 1956, as amended (“BHCA”). Its legal headquarters are located at 1108 Fifth Avenue, San Rafael, California 94901. Principal administrative offices are located at 4550 Mangels Boulevard, Fairfield, California 94534 and its telephone number is (707) 863-6000. The Company provides a full range of banking services to individual and corporate customers in Northern and Central California through its subsidiary bank, Westamerica Bank (“WAB” or the “Bank”). The principal communities served are located in Northern and Central California, from Mendocino, Lake and Nevada Counties in the north to Kern County in the south. The Company’s strategic focus is on the banking needs of small businesses. In addition, the Bank owns 100% of the capital stock of Community Banker Services Corporation (“CBSC”), a company engaged in providing the Company and its subsidiaries with data processing services and other support functions.
The Company was incorporated under the laws of the State of California in 1972 as “Independent Bankshares Corporation” pursuant to a plan of reorganization among three previously unaffiliated Northern California banks. The Company operated as a multi-bank holding company until mid-1983, at which time the then six subsidiary banks were merged into a single bank named Westamerica Bank and the name of the holding company was changed to Westamerica Bancorporation.
The Company acquired five banks within its immediate market area during the early to mid 1990’s. In April 1997, the Company acquired ValliCorp Holdings, Inc., parent company of ValliWide Bank, the largest independent bank holding company headquartered in Central California. Under the terms of all of the merger agreements, the Company issued shares of its common stock in exchange for all of the outstanding shares of the acquired institutions. The subsidiary banks acquired were merged withand into WAB. These six aforementioned business combinations were accounted for as poolings-of-interests.
During the period 2000 through 2005, the Company acquired three additional banks. These acquisitions were accounted for using the purchase accounting method.

20
14
W
EST
AM
ER
ICA
BA
NC
OR
PO
RA
TIO
N F
OR
M 1
0-K
20
15
W
EST
AM
ER
ICA
BA
NC
OR
PO
RA
TIO
N P
RO
XY
3 - 3 -
On February 6, 2009, Westamerica Bank acquired the banking operations of County Bank (“County”) from the Federal Deposit Insurance Corporation (“FDIC”). The Bank and the FDIC entered loss-sharing agreements regarding future losses incurred on acquired loans and foreclosed loan collateral. Under the terms of the loss-sharing agreements, the FDIC absorbs 80 percent of losses and is entitled to 80 percent of loss recoveries on the first $269 million of losses, and absorbs 95 percent of losses and is entitled to 95 percent of loss recoveries on losses exceeding $269 million. The term for loss-sharing on residential real estateloans is ten years, while the term for loss-sharing on non-residential real estate loans is five years in respect to losses and eight years in respect to loss recoveries. The FDIC indemnification expired February 6, 2014 for County Bank non-single-family residential collateralized purchased loans. On August 20, 2010, Westamerica Bank acquired assets and assumed liabilities of theformer Sonoma Valley Bank (“Sonoma”) from the FDIC. The County and Sonoma acquired assets and assumed liabilities were measured at estimated fair values, as required by FASB ASC 805, Business Combinations.
Management made significant estimates and exercised significant judgment in accounting for these 2009 and 2010 acquisitions. Management judgmentally measured loan fair values based on loan file reviews (including borrower financial statements and tax returns), appraised collateral values, expected cash flows, and historical loss factors. Repossessed loan collateral was primarilyvalued based upon appraised collateral values. The Bank also recorded identifiable intangible assets representing the value of the core deposit customer bases based on Management’s evaluation of the cost of such deposits relative to alternative funding sources. In determining the value of the identifiable intangible assets, Management used significant estimates including averagelives of deposit accounts, future interest rate levels, the cost of servicing various depository products, and other significantestimates. Management used quoted market prices to determine the fair value of investment securities, FHLB advances and other borrowings which were purchased and assumed.
At December 31, 2014, the Company had consolidated assets of approximately $5.0 billion, deposits of approximately $4.3 billion and shareholders’ equity of approximately $527 million. The Company and its subsidiaries employed 858 full-time equivalent staff as of December 31, 2014.
The Company’s annual report on Form 10-K, quarterly reports on Form 10-Q, current reports on Form 8-K and any amendments to those reports as well as beneficial ownership reports on Forms 3, 4 and 5 are available through the SEC’s website (http://www.sec.gov). Such documents as well as the Company’s director, officer and employee Code of Conduct and Ethics are also available free of charge from the Company by request to:
Westamerica Bancorporation Corporate Secretary A-2M Post Office Box 1200 Suisun City, California 94585-1200
Supervision and Regulation
The following is not intended to be an exhaustive description of the statutes and regulations applicable to the Company’s or theBank’s business. The description of statutory and regulatory provisions is qualified in its entirety by reference to the particular statutory or regulatory provisions. Moreover, major new legislation and other regulatory changes affecting the Company, the Bank, and the financial services industry in general have occurred in the last several years and can be expected to occur in thefuture. The nature, timing and impact of new and amended laws and regulations cannot be accurately predicted.
Regulation and Supervision of Bank Holding Companies
The Company is a bank holding company subject to the BHCA. The Company reports to, is registered with, and may be examined by, the Board of Governors of the Federal Reserve System (“FRB”). The FRB also has the authority to examine the Company’s subsidiaries. The Company is a bank holding company within the meaning of Section 3700 of the California Financial Code. As such, the Company and the Bank are subject to examination by, and may be required to file reports with, the Commissioner of the California Department of Business Oversight (the “Commissioner”).
The FRB has significant supervisory and regulatory authority over the Company and its affiliates. The FRB requires the Company to maintain certain levels of capital. See “Capital Standards.” The FRB also has the authority to take enforcement action againstany bank holding company that commits any unsafe or unsound practice, or violates certain laws, regulations or conditions imposed in writing by the FRB. Under the BHCA, the Company is required to obtain the prior approval of the FRB before it acquires, merges or consolidates with any bank or bank holding company. Any company seeking to acquire, merge or consolidate with the Company also would be required to obtain the prior approval of the FRB.

20
14
W
EST
AM
ER
ICA
BA
NC
OR
PO
RA
TIO
N FO
RM
10
-K
20
15
W
EST
AM
ER
ICA
BA
NC
OR
PO
RA
TIO
N P
RO
XY
4
- 4 -
The Company is generally prohibited under the BHCA from acquiring ownership or control of more than 5% of any class of voting shares of any company that is not a bank or bank holding company and from engaging directly or indirectly in activities other than banking, managing banks, or providing services to affiliates of the holding company. However, a bank holding company, with the approval of the FRB, may engage, or acquire the voting shares of companies engaged, in activities that the FRB has determined to be closely related to banking or managing or controlling banks. A bank holding company must demonstrate that the benefits to the public of the proposed activity will outweigh the possible adverse effects associated with such activity.
The FRB generally prohibits a bank holding company from declaring or paying a cash dividend that would impose undue pressure on the capital of subsidiary banks or would be funded only through borrowing or other arrangements which might adversely affecta bank holding company’s financial position. Under the FRB policy, a bank holding company should not continue its existing rateof cash dividends on its common stock unless its net income is sufficient to fully fund each dividend and its prospective rate of earnings retention appears consistent with its capital needs, asset quality and overall financial condition. See the section entitled “Restrictions on Dividends and Other Distributions” for additional restrictions on the ability of the Company and the Bank to paydividends.
Transactions between the Company and the Bank are restricted under Regulation W. The regulation codifies prior interpretations of the FRB and its staff under Sections 23A and 23B of the Federal Reserve Act. In general, subject to certain specified exemptions, a bank or its subsidiaries are limited in their ability to engage in “covered transactions” with affiliates: (a) to an amount equal to 10% of the bank’s capital and surplus, in the case of covered transactions with any one affiliate; and (b) to anamount equal to 20% of the bank’s capital and surplus, in the case of covered transactions with all affiliates. The Company is considered to be an affiliate of the Bank. A “covered transaction” includes, among other things, a loan or extension of credit to an affiliate; a purchase of securities issued by an affiliate; a purchase of assets from an affiliate, with some exceptions; and the issuance of a guarantee, acceptance or letter of credit on behalf of an affiliate.
Federal regulations governing bank holding companies and change in bank control (Regulation Y) provide for a streamlined and expedited review process for bank acquisition proposals submitted by well-run bank holding companies. These provisions of Regulation Y are subject to numerous qualifications, limitations and restrictions. In order for a bank holding company to qualify as “well-run,” both it and the insured depository institutions which it controls must meet the “well capitalized” and “well managed” criteria set forth in Regulation Y.
The Gramm-Leach-Bliley Act (the “GLBA”), or the Financial Services Act of 1999, repealed provisions of the Glass-Steagall Act, which had prohibited commercial banks and securities firms from affiliating with each other and engaging in each other’s businesses. Thus, many of the barriers prohibiting affiliations between commercial banks and securities firms have been eliminated.
The BHCA was also amended by the GLBA to allow new “financial holding companies” (“FHCs”) to offer banking, insurance, securities and other financial products to consumers. Specifically, the GLBA amended section 4 of the BHCA in order to provide for a framework for the engagement in new financial activities. A bank holding company (“BHC”) may elect to become an FHC if all its subsidiary depository institutions are well capitalized and well managed. If these requirements are met, a BHC may file a certification to that effect with the FRB and declare that it elects to become an FHC. After the certification and declaration isfiled, the FHC may engage either de novo or through an acquisition in any activity that has been determined by the FRB to be financial in nature or incidental to such financial activity. BHCs may engage in financial activities without prior notice to the FRB if those activities qualify under the list of permissible activities in section 4(k) of the BHCA. However, notice must be given to the FRB within 30 days after an FHC has commenced one or more of the financial activities. The Company has not elected to become an FHC.
Regulation and Supervision of Banks
The Bank is a California state-chartered Federal Reserve member bank and its deposits are insured by the FDIC. The Bank is subject to regulation, supervision and regular examination by the California Department of Business Oversight (“DBO”), and the FRB. The regulations of these agencies affect most aspects of the Bank’s business and prescribe permissible types of loans and investments, the amount of required reserves, requirements for branch offices, the permissible scope of its activities and various other requirements.
In addition to federal banking law, the Bank is also subject to applicable provisions of California law. Under California law, the Bank is subject to various restrictions on, and requirements regarding, its operations and administration including the maintenance of branch offices and automated teller machines, capital requirements, deposits and borrowings, shareholder rights and duties, andinvestment and lending activities.

20
14
W
EST
AM
ER
ICA
BA
NC
OR
PO
RA
TIO
N F
OR
M 1
0-K
20
15
W
EST
AM
ER
ICA
BA
NC
OR
PO
RA
TIO
N P
RO
XY
5 - 5 -
In addition, the Federal Deposit Insurance Corporation Improvement Act (“FDICIA”) imposes limitations on the activities and equity investments of state chartered, federally insured banks. FDICIA also prohibits a state bank from making an investment orengaging in any activity as a principal that is not permissible for a national bank, unless the Bank is adequately capitalized and the FDIC approves the investment or activity after determining that such investment or activity does not pose a significant risk to the deposit insurance fund.
On July 21, 2010, financial regulatory reform legislation entitled the "Dodd-Frank Wall Street Reform and Consumer Protection Act" (the "Dodd-Frank Act") was signed into law. The Dodd-Frank Act implements far-reaching changes across the financial regulatory landscape, including provisions that, among other things:
• Centralized responsibility for consumer financial protection by creating a new agency, the Consumer Financial Protection Bureau, responsible for implementing, examining and (as to banks with $10 billion or more in assets) enforcing compliance with federal consumer financial laws.
• Restricted the preemption of state law by federal law and disallowed subsidiaries and affiliates of national banks from availing themselves of such preemption.
• Applied the same leverage and risk-based capital requirements that would apply to insured depository institutions to most bank holding companies.
• Required bank regulatory agencies to seek to make their capital requirements for banks countercyclical so that capital requirements increase in times of economic expansion and decrease in times of economic contraction.
• Changed the assessment base for federal deposit insurance from the amount of insured deposits to consolidated assets less tangible capital, eliminated the ceiling on the size of the Deposit Insurance Fund ("DIF") and increased the floor of the size of the DIF.
• Imposed comprehensive regulation of the over-the-counter derivatives market, which would include certain provisions that would effectively prohibit insured depository institutions from conducting certain derivatives businesses in the institution itself.
• Required large, publicly traded bank holding companies to create a risk committee responsible for the oversight of enterprise risk management.
• Implemented corporate governance revisions, including with regard to executive compensation and proxy access by shareholders, that would apply to all public companies, not just financial institutions.
• Made permanent the $250 thousand limit for federal deposit insurance. • Repealed the federal prohibitions on the payment of interest on demand deposits, thereby permitting depository
institutions to pay interest on business transaction and other accounts. • Amended the Electronic Fund Transfer Act ("EFTA") to, among other things, give the FRB the authority to establish
rules regarding interchange fees charged for electronic debit transactions by payment card issuers having assets over $10 billion and to enforce a new statutory requirement that such fees be reasonable and proportional to the actual cost of a transaction to the issuer. While the Company’s assets are currently less than $10 billion, interchange fees charged by larger institutions may dictate the level of fees smaller institutions will be able to charge to remain competitive.
Many aspects of the Dodd-Frank Act are subject to rulemaking and implementation of new regulations and will take effect over several years, making it difficult to anticipate the overall financial impact on the Company, its customers or the financial industry more generally. Provisions in the legislation that affect the payment of interest on demand deposits and interchange fees may increase the costs associated with deposits as well as place limitations on certain revenues those deposits may generate.
Capital Standards
The federal banking agencies have risk-based capital adequacy guidelines intended to provide a measure of capital adequacy thatreflects the degree of risk associated with a banking organization’s operations for both transactions resulting in assets beingrecognized on the balance sheet as assets, and the extension of credit facilities such as letters of credit and recourse arrangements, which are recorded as off balance sheet items. Under these guidelines, nominal dollar amounts of assets and credit equivalent amounts of off balance sheet items are multiplied by one of several risk adjustment percentages, which range from 0% for assetswith low credit risk, such as certain U.S. government securities, to 100% for assets with relatively higher credit risk, such ascertain loans. A banking organization’s risk-based capital ratios are obtained by dividing its qualifying capital by its total risk-adjusted assets and off balance sheet items.
The federal banking agencies take into consideration concentrations of credit risk and risks from nontraditional activities, as well as an institution’s ability to manage those risks, when determining the adequacy of an institution’s capital. This evaluation ismade as a part of the institution’s regular safety and soundness examination. The federal banking agencies also consider interest

20
14
W
EST
AM
ER
ICA
BA
NC
OR
PO
RA
TIO
N FO
RM
10
-K
20
15
W
EST
AM
ER
ICA
BA
NC
OR
PO
RA
TIO
N P
RO
XY
6
- 6 -
rate risk (related to the interest rate sensitivity of an institution’s assets and liabilities, and its off balance sheet financial instruments) in the evaluation of a bank’s capital adequacy.
As of December 31, 2014, the Company’s and the Bank’s respective ratios exceeded applicable regulatory requirements. See Note 9 to the consolidated financial statements for capital ratios of the Company and the Bank, compared to the standards for wellcapitalized depository institutions and for minimum capital requirements.
On July 2, 2013, the Federal Reserve Board approved a final rule that implements changes to the regulatory capital framework forall banking organizations. See the section entitled “Capital to Risk-Adjusted Assets” in Item 7. Management’s Discussion and Analysis of Financial Condition and Results of Operations for the Company’s interpretation of the final rule in regard to its capital ratios.
Prompt Corrective Action and Other Enforcement Mechanisms
FDICIA requires each federal banking agency to take prompt corrective action to resolve the problems of insured depository institutions, including but not limited to those that fall below one or more prescribed minimum capital ratios.
An institution that, based upon its capital levels, is classified as “well capitalized,” “adequately capitalized” or “undercapitalized”may be treated as though it were in the next lower capital category if the appropriate federal banking agency, after notice andopportunity for hearing, determines that an unsafe or unsound condition or an unsafe or unsound practice warrants such treatment.At each successive lower capital category, an insured depository institution is subject to more restrictions. In addition to measurestaken under the prompt corrective action provisions, commercial banking organizations may be subject to potential enforcement actions by the federal banking agencies for unsafe or unsound practices in conducting their businesses or for violations of anylaw, rule, regulation or any condition imposed in writing by the agency or any written agreement with the agency.
Safety and Soundness Standards
The Company’s ability to pay dividends to its shareholders is subject to the restrictions set forth in the California General Corporation Law (“CGCL”). The CGCL provides that a corporation may make a distribution to its shareholders if (i) the corporation’s retained earnings equal or exceed the amount of the proposed distribution plus unpaid accrued dividends, (if any) on securities with a dividend preference, or (ii) immediately after the dividend, the corporation’s total assets equal or exceed total liabilities plus unpaid accrued dividends (if any) on securities with a dividend preference.
FDICIA also implemented certain specific restrictions on transactions and required federal banking regulators to adopt overall safety and soundness standards for depository institutions related to internal control, loan underwriting and documentation, andasset growth. Among other things, FDICIA limits the interest rates paid on deposits by undercapitalized institutions, restricts the use of brokered deposits, limits the aggregate extensions of credit by a depository institution to an executive officer, director, principal shareholder or related interest, and reduces deposit insurance coverage for deposits offered by undercapitalized institutions for deposits by certain employee benefits accounts. The federal banking agencies may require an institution to submit an acceptable compliance plan as well as have the flexibility to pursue other more appropriate or effective courses of action given the specific circumstances and severity of an institution’s noncompliance with one or more standards.
Federal banking agencies require banks to maintain adequate valuation allowances for potential credit losses. The Company has an internal staff that continually reviews loan quality and reports to the Board of Directors. This analysis includes a detailedreview of the classification and categorization of problem loans, assessment of the overall quality and collectability of the loan portfolio, consideration of loan loss experience, trends in problem loans, concentration of credit risk, and current economic conditions, particularly in the Bank’s market areas. Based on this analysis, Management, with the review and approval of the Board, determines the adequate level of allowance required. The allowance is allocated to different segments of the loan portfolio, but the entire allowance is available for the loan portfolio in its entirety.
Restrictions on Dividends and Other Distributions
The power of the board of directors of an insured depository institution to declare a cash dividend or other distribution with respect to capital is subject to statutory and regulatory restrictions which limit the amount available for such distribution depending upon the earnings, financial condition and cash needs of the institution, as well as general business conditions. FDICIAprohibits insured depository institutions from paying management fees to any controlling persons or, with certain limited exceptions, making capital distributions, including dividends, if, after such transaction, the institution would be undercapitalized.
20
14
W
EST
AM
ER
ICA
BA
NC
OR
PO
RA
TIO
N F
OR
M 1
0-K
20
15
W
EST
AM
ER
ICA
BA
NC
OR
PO
RA
TIO
N P
RO
XY
7 - 7 -
In addition to the restrictions imposed under federal law, banks chartered under California law generally may only pay cash dividends to the extent such payments do not exceed the lesser of retained earnings of the bank or the bank’s net income for itslast three fiscal years (less any distributions to shareholders during this period). In the event a bank desires to pay cash dividends in excess of such amount, the bank may pay a cash dividend with the prior approval of the Commissioner in an amount not exceeding the greatest of the bank’s retained earnings, the bank’s net income for its last fiscal year or the bank’s net income for its current fiscal year.
The federal banking agencies also have the authority to prohibit a depository institution from engaging in business practices which are considered to be unsafe or unsound, possibly including payment of dividends or other payments under certain circumstances even if such payments are not expressly prohibited by statute.
Premiums for Deposit Insurance
Substantially all of the deposits of the Bank are insured up to applicable limits by the Deposit Insurance Fund ("DIF") of the FDIC and are subject to deposit insurance assessments to maintain the DIF. The FDIC utilizes a risk-based assessment system that imposes insurance premiums based upon a risk matrix that takes into account a bank's capital level, asset quality and supervisory rating ("CAMELS rating").
In October 2010, the FDIC adopted a new DIF restoration plan to ensure that the DIF reserve ratio reaches 1.35% by September 30, 2020, as required by the Dodd-Frank Act. At least semi-annually, the FDIC will update its loss and income projections for thefund and, if needed, will increase or decrease assessment rates, following notice-and-comment rulemaking if required.
In February 2011, the FDIC issued a final rule changing the deposit insurance assessment base from total domestic deposits to average total assets minus average tangible equity, as required by the Dodd-Frank Act, effective April 1, 2011. The FDIC also issued a final rule revising the deposit insurance assessment system for “large” institutions having more than $10 billion in assetsand another for "highly complex" institutions that have over $50 billion in assets and are fully owned by a parent with over $500 billion in assets. The Bank is neither a “large” nor “highly complex” institution. Under the new assessment rules, the initial baseassessment rates range from 5 to 35 basis points, and after potential adjustments for unsecured debt and brokered deposits, assessment rates range from 2.5 to 45 basis points.
The Company cannot provide any assurance as to the effect of any future changes in its deposit insurance premium rates.
Community Reinvestment Act and Fair Lending Developments
The Bank is subject to certain fair lending requirements and reporting obligations involving home mortgage lending operations and Community Reinvestment Act (“CRA”) activities. The CRA generally requires the federal banking agencies to evaluate the record of financial institutions in meeting the credit needs of their local communities, including low and moderate income neighborhoods. In addition to substantive penalties and corrective measures that may be required for a violation of certain fairlending laws, the federal banking agencies may take compliance with such laws and CRA into account when regulating and supervising other activities including merger applications.
Financial Privacy Legislation and Customer Information Security
The GLBA, in addition to the previously described changes in permissible nonbanking activities permitted to banks, BHCs and FHCs, also required the federal banking agencies, among other federal regulatory agencies, to adopt regulations governing the privacy of consumer financial information. The Bank is subject to the FRB’s regulations in this area. The federal bank regulatory agencies have established standards for safeguarding nonpublic personal information about customers that implement provisions of the GLBA (the “Guidelines”). Among other things, the Guidelines require each financial institution, under the supervision andongoing oversight of its Board of Directors or an appropriate committee thereof, to develop, implement and maintain a comprehensive written information security program designed to ensure the security and confidentiality of customer information,to protect against any anticipated threats or hazards to the security or integrity of such information, and to protect against unauthorized access to or use of such information that could result in substantial harm or inconvenience to any customer.
U.S.A. PATRIOT Act
Title III of the Uniting and Strengthening America by Providing Appropriate Tools Required to Intercept and Obstruct Terrorism Act of 2001 (“USA Patriot Act”) is the International Money Laundering Abatement and Anti-Terrorist Financing Act of 2001. It includes numerous provisions for fighting international money laundering and blocking terrorist access to the U.S. financial system. The goal of Title III is to prevent the U.S. financial system and the U.S. clearing mechanisms from being used by parties

20
14
W
EST
AM
ER
ICA
BA
NC
OR
PO
RA
TIO
N FO
RM
10
-K
20
15
W
EST
AM
ER
ICA
BA
NC
OR
PO
RA
TIO
N P
RO
XY
8
- 8 -
suspected of terrorism, terrorist financing and money laundering. The provisions of Title III of the USA Patriot Act which affectthe Bank are generally set forth as amendments to the Bank Secrecy Act. These provisions relate principally to U.S. banking organizations’ relationships with foreign banks and with persons who are resident outside the United States. The USA Patriot Actdoes not impose any filing or reporting obligations for banking organizations, but does require certain additional due diligenceand recordkeeping practices.
Sarbanes-Oxley Act of 2002
The stated goals of the Sarbanes-Oxley Act of 2002 (“Sarbanes-Oxley”) are to increase corporate responsibility, to provide for enhanced penalties for accounting and auditing improprieties at publicly traded companies and to protect investors by improvingthe accuracy and reliability of corporate disclosures pursuant to the securities laws. Sarbanes-Oxley generally applies to all companies, both U.S. and non-U.S., that file or are required to file periodic reports under the Securities Exchange Act of 1934(the “Exchange Act”).
Sarbanes-Oxley includes very specific additional disclosure requirements and corporate governance rules, required the SEC and securities exchanges to adopt extensive additional disclosure, corporate governance and other related rules and mandates furtherstudies of certain issues. Sarbanes-Oxley represents significant federal involvement in matters traditionally left to state regulatory systems, such as the regulation of the accounting profession, and to state corporate law, such as the relationship between a boardof directors and management and between a board of directors and its committees and public company shareholders. Sarbanes-Oxley addresses, among other matters: (i) independent audit committees for reporting companies whose securities are listed on national exchanges or automated quotation systems (the “Exchanges”) and expanded duties and responsibilities for audit committees; (ii) certification of financial statements by the chief executive officer and the chief financial officer; (iii) theforfeiture of bonuses or other incentive-based compensation and profits from the sale of an issuer’s securities by directors andsenior officers in the twelve month period following initial publication of any financial statements that later require restatement; (iv) a prohibition on insider trading during pension plan blackout periods; (v) disclosure of off-balance sheet transactions; (vi) a prohibition on personal loans to directors and officers under most circumstances with exceptions for certain normal course transactions by regulated financial institutions; (vii) expedited electronic filing requirements related to trading by insiders in an issuer’s securities on Form 4; (viii) disclosure of a code of ethics and filing a Form 8-K for a change or waiver of such code; (ix) accelerated filing of periodic reports; (x) the formation of the Public Company Accounting Oversight Board (“PCAOB”) to regulate public accounting firms and the audit of public companies that are subject to the securities laws; (xi) auditor independence; (xii) internal control evaluation and reporting; and (xiii) various increased criminal penalties for violations ofsecurities laws.
Programs To Mitigate Identity Theft
In November 2007, federal banking agencies together with the National Credit Union Administration and Federal Trade Commission adopted regulations under the Fair and Accurate Credit Transactions Act of 2003 to require financial institutions andother creditors to develop and implement a written identity theft prevention program to detect, prevent and mitigate identity theft in connection with certain new and existing accounts. Covered accounts generally include consumer accounts and other accounts that present a reasonably foreseeable risk of identity theft. Each institution’s program must include policies and procedures designed to: (i) identify indicators, or “red flags,” of possible risk of identity theft; (ii) detect the occurrence of red flags; (iii) respond appropriately to red flags that are detected; and (iv) ensure that the program is updated periodically as appropriate toaddress changing circumstances. The regulations include guidelines that each institution must consider and, to the extent appropriate, include in its program.
Pending Legislation
Changes to state laws and regulations (including changes in interpretation or enforcement) can affect the operating environmentof BHCs and their subsidiaries in substantial and unpredictable ways. From time to time, various legislative and regulatory proposals are introduced. These proposals, if codified, may change banking statutes and regulations and the Company’s operatingenvironment in substantial and unpredictable ways. If codified, these proposals could increase or decrease the cost of doing business, limit or expand permissible activities or affect the competitive balance among banks, savings associations, credit unions and other financial institutions. The Company cannot accurately predict whether those changes in laws and regulations will occur, and, if those changes occur, the ultimate effect they would have upon our financial condition or results of operations. It is likely, however, that the current level of enforcement and compliance-related activities of federal and state authorities will continue and potentially increase.
20
14
W
EST
AM
ER
ICA
BA
NC
OR
PO
RA
TIO
N F
OR
M 1
0-K
20
15
W
EST
AM
ER
ICA
BA
NC
OR
PO
RA
TIO
N P
RO
XY
9 - 9 -
Competition
In the past, the Bank’s principal competitors for deposits and loans have been major banks and smaller community banks, savingsand loan associations and credit unions. To a lesser extent, competition was also provided by thrift and loans, mortgage brokerage companies and insurance companies. Other institutions, such as brokerage houses, mutual fund companies, credit card companies, and certain retail establishments have offered investment vehicles that also compete with banks for deposit business. Federal legislation in recent years has encouraged competition between different types of financial institutions and fostered new entrants into the financial services market.
Legislative changes, as well as technological and economic factors, can be expected to have an ongoing impact on competitive conditions within the financial services industry. While the future impact of regulatory and legislative changes cannot be predicted with certainty, the business of banking will remain highly competitive.
ITEM 1A. RISK FACTORS
Readers and prospective investors in the Company’s securities should carefully consider the following risk factors as well as the other information contained or incorporated by reference in this report.
The risks and uncertainties described below are not the only ones facing the Company. Additional risks and uncertainties that Management is not aware of or focused on or that Management currently deems immaterial may also impair the Company’s business operations. This report is qualified in its entirety by these risk factors.
If any of the following risks actually occur, the Company’s financial condition and results of operations could be materially andadversely affected. If this were to happen, the value of the company’s securities could decline significantly, and investors could lose all or part of their investment in the Company’s common stock.
Market and Interest Rate Risk
Changes in interest rates could reduce income and cash flow.
The discussion in this report under “Item 7 Management’s Discussion and Analysis of Financial Condition and Results of Operations – Asset, Liability and Market Risk Management” and “- Liquidity and Funding” and “Item 7A Quantitative and Qualitative Disclosures About Market Risk” is incorporated by reference in this paragraph. The Company’s income and cash flow depend to a great extent on the difference between the interest earned on loans and investment securities and the interest paid on deposits and other borrowings, and the Company’s success in competing for loans and deposits. The Company cannot control or prevent changes in the level of interest rates which fluctuate in response to general economic conditions, the policies of various governmental and regulatory agencies, in particular, the Federal Open Market Committee of the FRB, and pricing practices of theCompany’s competitors. Changes in monetary policy, including changes in interest rates, will influence the origination of loans,the purchase of investments, the generation of deposits and other borrowings, and the rates received on loans and investment securities and paid on deposits and other liabilities.
Changes in capital market conditions could reduce asset valuations.
Capital market conditions, including liquidity, investor confidence, bond issuer credit worthiness, perceived counter-party risk,the supply of and demand for financial instruments, the financial strength of market participants, and other factors can materiallyimpact the value of the Company’s assets. An impairment in the value of the Company’s assets could result in asset write-downs,reducing the Company’s asset values, earnings, and equity.
The value of securities in the Company’s investment securities portfolio may be negatively affected by disruptions in securitiesmarkets
The market for some of the investment securities held in the Company’s portfolio can be extremely volatile. Volatile market conditions may detrimentally affect the value of these securities, such as through reduced valuations due to the perception of heightened credit and liquidity risks. There can be no assurance that the declines in market value will not result in other thantemporary impairments of these assets, which would lead to loss recognition that could have a material adverse effect on the Company’s net income and capital levels.

20
14
W
EST
AM
ER
ICA
BA
NC
OR
PO
RA
TIO
N FO
RM
10
-K
20
15
W
EST
AM
ER
ICA
BA
NC
OR
PO
RA
TIO
N P
RO
XY
10
- 10 -
The weakness of other financial institutions could adversely affect the Company.
Financial services institutions are interrelated as a result of trading, clearing, counterparty, or other relationships. The Company routinely executes transactions with counterparties in the financial services industry, including brokers and dealers, commercialbanks, investment banks, and other institutional clients. Many of these transactions expose the Company to credit risk in the event of default of the Company’s counterparty or client. In addition, the Company’s credit risk may be increased when the collateralthe Company holds cannot be realized or is liquidated at prices not sufficient to recover the full amount of the secured obligation.There is no assurance that any such losses would not materially and adversely affect the Company’s results of operations or earnings.
Shares of Company common stock eligible for future sale or grant of stock options could have a dilutive effect on the market for Company common stock and could adversely affect the market price.
The Articles of Incorporation of the Company authorize the issuance of 150 million shares of common stock (and two additional classes of 1 million shares each, denominated “Class B Common Stock” and “Preferred Stock”, respectively) of which approximately 25.7 million shares of common stock were outstanding at December 31, 2014. Pursuant to its stock option plans, atDecember 31, 2014, the Company had outstanding options for 1.9 million shares of common stock, of which 1.4 million were currently exercisable. As of December 31, 2014, 1.2 million shares of Company common stock remained available for grants under the Company’s stock option plans. Sales of substantial amounts of Company common stock in the public market could adversely affect the market price of its common stock.
The Company’s payment of dividends on common stock could be eliminated or reduced.
Holders of the Company’s common stock are entitled to receive dividends only when, as and if declared by the Company’s Board of Directors. Although the Company has historically paid cash dividends on the Company’s common stock, the Company is not required to do so and the Company’s Board of Directors could reduce or eliminate the Company’s common stock dividend in the future.
The Company could repurchase shares of its common stock at price levels considered excessive.
The Company repurchases and retires its common stock in accordance with Board of Directors-approved share repurchase programs. At December 31, 2014, approximately 1.7 million shares remained available to repurchase under such plans. The Company has been active in repurchasing and retiring shares of its common stock when alternative uses of excess capital, such asacquisitions, have been limited. The Company could repurchase shares of its common stock at price levels considered excessive, thereby spending more cash on such repurchases as deemed reasonable and effectively retiring fewer shares than would be retiredif repurchases were affected at lower prices.
Risks Related to the Nature and Geographical Location of the Company’s Business
The Company invests in loans that contain inherent credit risks that may cause the Company to incur losses.
The Company can provide no assurance that the credit quality of the loan portfolio will not deteriorate in the future and that such deterioration will not adversely affect the Company.
The Company’s operations are concentrated geographically in California, and poor economic conditions may cause the Company to incur losses.
Substantially all of the Company’s business is located in California. A portion of the loan portfolio of the Company is dependent on real estate. At December 31, 2014, real estate served as the principal source of collateral with respect to approximately 52% of the Company’s loan portfolio. The Company’s financial condition and operating results will be subject to changes in economic conditions in California. The California economy is recovering from a severe recession. Much of the California real estate marketexperienced a decline in values of varying degrees. This decline had an adverse impact on the business of some of the Company’sborrowers and on the value of the collateral for many of the Company’s loans. Generally, the counties surrounding and near San Francisco Bay have been recovering from the recent recession more soundly than counties in the California “Central Valley,” from Sacramento in the north to Bakersfield in the south. Approximately 27% of the Company’s loans are to borrowers in the California “Central Valley.” Economic conditions in California are subject to various uncertainties at this time, including the pace of recovery in construction and real estate sectors, the effect of drought on the agricultural sector and its infrastructure, and the California state government’s budgetary difficulties and fiscal condition. The Company can provide no assurance that conditionsin the California economy will not deteriorate in the future and that such deterioration will not adversely affect the Company.

20
14
W
EST
AM
ER
ICA
BA
NC
OR
PO
RA
TIO
N F
OR
M 1
0-K
20
15
W
EST
AM
ER
ICA
BA
NC
OR
PO
RA
TIO
N P
RO
XY
11 - 11 -
The markets in which the Company operates are subject to the risk of earthquakes and other natural disasters.
All of the properties of the Company are located in California. Also, most of the real and personal properties which currently secure a majority of the Company’s loans are located in California. California is prone to earthquakes, brush and forest fires,flooding, drought and other natural disasters. In addition to possibly sustaining uninsured damage to its own properties, if there is a major earthquake, flood, drought, fire or other natural disaster, the Company faces the risk that many of its borrowers may experience uninsured property losses, or sustained job interruption and/or loss which may materially impair their ability to meetthe terms of their loan obligations. A major earthquake, flood, prolonged drought, fire or other natural disaster in California could have a material adverse effect on the Company’s business, financial condition, results of operations and cash flows.
Adverse changes in general business or economic conditions could have a material adverse effect on the Company’s financial condition and results of operations.
A sustained or continuing weakness or weakening in business and economic conditions generally or specifically in the principal markets in which the Company does business could have one or more of the following adverse impacts on the Company’s business:
• a decrease in the demand for loans and other products and services offered by the Company; • an increase or decrease in the usage of unfunded credit commitments; • a decrease in the amount of deposits; • a decrease in non-depository funding available to the Company; • an impairment of certain intangible assets, such as goodwill; • an increase in the number of clients and counterparties who become delinquent, file for protection under bankruptcy laws
or default on their loans or other obligations to the Company, which could result in a higher level of nonperforming assets, net charge-offs, provision for loan losses, and valuation adjustments on assets;
• an impairment in the value of investment securities; • an impairment in the value of life insurance policies owned by the Company; • an impairment in the value of real estate owned by the Company.
The recent financial crisis led to the failure or merger of a number of financial institutions. Financial institution failures can result in further losses as a consequence of defaults on securities issued by them and defaults under contracts entered into with suchentities as counterparties. Weak economic conditions can significantly weaken the strength and liquidity of financial institutions.
The Company’s financial performance generally, and in particular the ability of borrowers to pay interest on and repay principalof outstanding loans and the value of collateral securing those loans, is highly dependent upon on the business environment in the markets where the Company operates, in the State of California and in the United States as a whole. A favorable business environment is generally characterized by, among other factors, economic growth, healthy labor markets, efficient capital markets, low inflation, high business and investor confidence, and strong business earnings. Unfavorable or uncertain economic and market conditions can be caused by: declines in economic growth, high rates of unemployment, deflation, declines in business activity or consumer, investor or business confidence; limitations on the availability of or increases in the cost of credit and capital; increases in inflation or interest rates; natural disasters; or a combination of these or other factors.
Such business conditions could adversely affect the credit quality of the Company’s loans, the demand for loans, loan volumes and related revenue, securities valuations, amounts of deposits, availability of funding, results of operations and financial condition.
Regulatory Risks
Restrictions on dividends and other distributions could limit amounts payable to the Company.
As a holding company, a substantial portion of the Company’s cash flow typically comes from dividends paid by the Bank. Various statutory provisions restrict the amount of dividends the Company’s subsidiaries can pay to the Company without regulatory approval. A reduction in subsidiary dividends paid to the Company could limit the capacity of the Company to pay dividends. In addition, if any of the Company’s subsidiaries were to liquidate, that subsidiary’s creditors will be entitled to receive distributions from the assets of that subsidiary to satisfy their claims against it before the Company, as a holder of an equityinterest in the subsidiary, will be entitled to receive any of the assets of the subsidiary.
20
14
W
EST
AM
ER
ICA
BA
NC
OR
PO
RA
TIO
N FO
RM
10
-K
20
15
W
EST
AM
ER
ICA
BA
NC
OR
PO
RA
TIO
N P
RO
XY
12
- 12 -
Adverse effects of changes in banking or other laws and regulations or governmental fiscal or monetary policies could adversely affect the Company.
The Company is subject to significant federal and state regulation and supervision, which is primarily for the benefit and protection of the Company’s customers and not for the benefit of investors. In the past, the Company’s business has been materially affected by these regulations. As an example, the FRB amended Regulation E, which implements the Electronic Fund Transfer Act, in a manner that limits the ability of a financial institution to assess an overdraft fee for paying automated teller machine (ATM) and one-time debit card transactions that overdraw a consumer’s account, unless the consumer affirmatively consents, or opts in, to the institution’s payment of overdrafts for these transactions. Implementation of the new provisions significantly reduced overdraft fees assessed by the Bank.
Laws, regulations or policies, including accounting standards and interpretations currently affecting the Company and the Company’s subsidiaries, may change at any time. Regulatory authorities may also change their interpretation of these statutes and regulations. Therefore, the Company’s business may be adversely affected by any future changes in laws, regulations, policies orinterpretations or regulatory approaches to compliance and enforcement including future acts of terrorism, major U.S. corporatebankruptcies and reports of accounting irregularities at U.S. public companies.
Additionally, the Company’s business is affected significantly by the fiscal and monetary policies of the federal government and its agencies. The Company is particularly affected by the policies of the FRB, which regulates the supply of money and credit inthe United States of America. Among the instruments of monetary policy available to the FRB are (a) conducting open market operations in U.S. government securities, (b) changing the discount rates of borrowings by depository institutions, (c) changinginterest rates paid on balances financial institutions deposit with the FRB, and (d) imposing or changing reserve requirements against certain borrowings by banks and their affiliates. These methods are used in varying degrees and combinations to directlyaffect the availability of bank loans and deposits, as well as the interest rates charged on loans and paid on deposits. The policiesof the FRB may have a material effect on the Company’s business, results of operations and financial condition. Under long- standing policy of the FRB, a BHC is expected to act as a source of financial strength for its subsidiary banks. As a result of that policy, the Company may be required to commit financial and other resources to its subsidiary bank in circumstances where the Company might not otherwise do so.
Recently, the FRB has been providing vast amounts of liquidity into the banking system due to current economic and capital market conditions. The FRB has been purchasing large quantities of U.S. government securities, including agency-backed mortgage securities, increasing the demand for such securities thereby reducing interest rates. The FRB began reducing these activities in the fourth quarter 2013 which could reduce liquidity in the markets and cause interest rates to rise, thereby increasingfunding costs to the Bank, reducing the availability of funds to the Bank to finance its existing operations, and causing fixed-rate investment securities and loans to decline in value.
Federal and state governments could pass legislation detrimental to the Company’s performance.
As an example, the Company could experience higher credit losses because of federal or state legislation or regulatory action that reduces the amount the Bank's borrowers are otherwise contractually required to pay under existing loan contracts. Also, the Company could experience higher credit losses because of federal or state legislation or regulatory action that limits or delays the Bank's ability to foreclose on property or other collateral or makes foreclosure less economically feasible.
The FDIC insures deposits at insured financial institutions up to certain limits. The FDIC charges insured financial institutionspremiums to maintain the Deposit Insurance Fund. The FDIC may increase premium assessments to maintain adequate funding of the Deposit Insurance Fund.
The behavior of depositors in regard to the level of FDIC insurance could cause our existing customers to reduce the amount of deposits held at the Bank, and could cause new customers to open deposit accounts at the Bank. The level and composition of theBank's deposit portfolio directly impacts the Bank's funding cost and net interest margin.
Systems, Accounting and Internal Control Risks
The accuracy of the Company’s judgments and estimates about financial and accounting matters will impact operating results and financial condition.
The discussion under “Item 7 Management’s Discussion and Analysis of Financial Condition and Results of Operations - Critical Accounting Policies” in this report and the information referred to in that discussion is incorporated by reference in this

20
14
W
EST
AM
ER
ICA
BA
NC
OR
PO
RA
TIO
N F
OR
M 1
0-K
20
15
W
EST
AM
ER
ICA
BA
NC
OR
PO
RA
TIO
N P
RO
XY
13 - 13 -
paragraph. The Company makes certain estimates and judgments in preparing its financial statements. The quality and accuracy of those estimates and judgments will have an impact on the Company’s operating results and financial condition.
The Company’s information systems may experience an interruption or breach in security.
The Company relies heavily on communications and information systems, including those of third party vendors and other service providers, to conduct its business. Any failure, interruption or breach in security of these systems could result in failures ordisruptions in the Company’s data processing, accounting, customer relationship management and other systems. Communication and information systems failures can result from a variety of risks including, but not limited to, events that are wholly or partially out of the Company’s control, such as telecommunication line integrity, weather, terrorist acts, natural disasters, accidental disasters, unauthorized breaches of security systems, cyber attacks, and other events. Although the Company devotes significantresources to maintain and regularly upgrade its systems and processes that are designed to protect the security of the Company’scomputer systems, software, networks and other technology assets and the confidentiality, integrity and availability of information belonging to the Company and its customers, there is no assurance that any such failures, interruptions or securitybreaches will not occur or, if they do occur, that they will be adequately corrected by the Company or its vendors. The occurrenceof any such failures, interruptions or security breaches could damage the Company’s reputation, result in a loss of customer business, subject the Company to additional regulatory scrutiny, or expose the Company to litigation and possible financial liability, any of which could have a material adverse effect on the Company’s financial condition and results of operations.
The Company’s controls and procedures may fail or be circumvented.
Management regularly reviews and updates the Company’s internal control over financial reporting, disclosure controls and procedures, and corporate governance policies and procedures. The Company maintains controls and procedures to mitigate against risks such as processing system failures and errors, and customer or employee fraud, and maintains insurance coverage for certain of these risks. Any system of controls and procedures, however well designed and operated, is based in part on certain assumptions and can provide only reasonable, not absolute, assurances that the objectives of the system are met. Events could occur which are not prevented or detected by the Company’s internal controls or are not insured against or are in excess of theCompany’s insurance limits or insurance underwriters’ financial capacity. Any failure or circumvention of the Company’s controls and procedures or failure to comply with regulations related to controls and procedures could have a material adverse effect on the Company’s business, results of operations and financial condition.
ITEM 1B. UNRESOLVED STAFF COMMENTS
None
ITEM 2. PROPERTIES
Branch Offices and Facilities
Westamerica Bank is engaged in the banking business through 92 branch offices in 21 counties in Northern and Central California. WAB believes all of its offices are constructed and equipped to meet prescribed security requirements.
The Company owns 32 banking office locations and one centralized administrative service center facility and leases 68 facilities.Most of the leases contain renewal options and provisions for rental increases, principally for changes in the cost of living index, and for changes in other operating costs such as property taxes and maintenance.
ITEM 3. LEGAL PROCEEDINGS
Neither the Company nor any of its subsidiaries is a party to any material pending legal proceeding, nor is their property the subject of any material pending legal proceeding, other than ordinary routine legal proceedings arising in the ordinary course ofthe Company’s business. None of these proceedings is expected to have a material adverse impact upon the Company’s business, financial position or results of operations.

20
14
W
EST
AM
ER
ICA
BA
NC
OR
PO
RA
TIO
N FO
RM
10
-K
20
15
W
EST
AM
ER
ICA
BA
NC
OR
PO
RA
TIO
N P
RO
XY
14
- 14 -
ITEM 4. MINE SAFETY DISCLOSURES
Not applicable
PART II
ITEM 5. MARKET FOR REGISTRANT’S COMMON EQUITY, RELATED STOCKHOLDER MATTERS ANDISSUER PURCHASES OF EQUITY SECURITIES
The Company’s common stock is traded on the NASDAQ Global Select Market (“NASDAQ”) under the symbol “WABC”. The following table shows the high and the low sales prices for the common stock, for each quarter, as reported by NASDAQ:
High Low 2014:
First quarter......................................................................................................... $56.51 $48.36 Second quarter .................................................................................................... 55.34 47.85Third quarter ....................................................................................................... 53.93 46.12 Fourth quarter ..................................................................................................... 51.24 42.71
2013: First quarter......................................................................................................... $45.80 $42.59 Second quarter .................................................................................................... 46.56 41.76Third quarter ....................................................................................................... 50.78 45.73 Fourth quarter ..................................................................................................... 57.59 48.29
As of January 31, 2015, there were approximately 6,300 shareholders of record of the Company’s common stock.
The Company has paid cash dividends on its common stock in every quarter since its formation in 1972. See Item 8, Financial Statements and Supplementary Data, Note 20 to the Consolidated Financial Statements for recent quarterly dividend information. It is currently the intention of the Board of Directors of the Company to continue payment of cash dividends on a quarterly basis.There is no assurance, however, that any dividends will be paid since they are dependent upon earnings, cash balances, financialcondition and capital requirements of the Company and its subsidiaries as well as policies of the FRB pursuant to the BHCA. SeeItem 1, “Business - Supervision and Regulation.”
The notes to the consolidated financial statements included in this report contain additional information regarding the Company’scapital levels, capital structure, regulations affecting subsidiary bank dividends paid to the Company, the Company’s earnings,financial condition and cash flows, and cash dividends declared and paid on common stock.
[The remainder of this page intentionally left blank]

20
14
W
EST
AM
ER
ICA
BA
NC
OR
PO
RA
TIO
N F
OR
M 1
0-K
20
15
W
EST
AM
ER
ICA
BA
NC
OR
PO
RA
TIO
N P
RO
XY
15 - 15 -
Stock performance
The following chart compares the cumulative return on the Company’s stock during the ten years ended December 31, 2014 with the cumulative return on the S&P 500 composite stock index and NASDAQ’S Bank Index. The comparison assumes $100 invested in each on December 31, 2004 and reinvestment of all dividends.
December 31, 2004 2005 2006 2007 2008 2009
Westamerica Bancorporation (WABC) ...................................... $100.00 $93.17 $91.22 $82.58 $97.30 $108.42S&P 500 (SPX)........................................................................... 100.00 104.91 121.46 128.13 80.73 102.10NASDAQ Bank Index (CBNK) ................................................. 100.00 98.07 111.61 89.40 70.16 58.73
December 31, 2010 2011 2012 2013 2014
Westamerica Bancorporation (WABC) ........................................................ $111.55 $91.02 $91.23 $124.83 $111.76S&P 500 (SPX)............................................................................................. 117.51 119.96 139.14 184.16 209.31NASDAQ Bank Index (CBNK) ................................................................... 67.05 60.01 71.24 100.95 105.91
[The remainder of this page intentionally left blank]

20
14
W
EST
AM
ER
ICA
BA
NC
OR
PO
RA
TIO
N FO
RM
10
-K
20
15
W
EST
AM
ER
ICA
BA
NC
OR
PO
RA
TIO
N P
RO
XY
16
- 16 -
The following chart compares the cumulative return on the Company’s stock during the five years ended December 31, 2014 with the cumulative return on the S&P 500 composite stock index and NASDAQ’S Bank Index. The comparison assumes $100 invested in each on December 31, 2009 and reinvestment of all dividends.
December 31, 2009 2010 2011 2012 2013 2014
Westamerica Bancorporation (WABC) ...................................... $100.00 $102.89 $83.95 $84.15 $115.14 $103.08S&P 500 (SPX)........................................................................... 100.00 115.09 117.49 136.27 180.37 205.00NASDAQ Bank Index (CBNK) ................................................. 100.00 114.17 102.18 121.31 171.89 180.34
ISSUER PURCHASES OF EQUITY SECURITIES
The table below sets forth the information with respect to purchases made by or on behalf of Westamerica Bancorporation or any “affiliated purchaser” (as defined in Rule 10b-18(a)(3) under the Securities Exchange Act of 1934), of common stock during the quarter ended December 31, 2014 (in thousands, except per share data).
Period
(a)TotalNumber of SharesPurchased
(b) AveragePricePaidper Share
(c)Total Number of Shares Purchased as Part of PubliclyAnnouncedPlans orPrograms*
(d) Maximum Number of Shares that May Yet Be Purchased Under the Plans or Programs
October 1 through October 31 .................................................................. 41 $47.72 41 1,853 November 1 through November 30........................................................... 87 49.54 87 1,766 December 1 through December 31 ........................................................... 33 47.84 33 1,733 Total .......................................................................................................... 161 48.73 161 1,733
* Includes 3 thousand, 1 thousand and 3 thousand shares purchased in October, November and December, respectively, by the Company in private transactions with the independent administrator of the Company’s Tax Deferred Savings/Retirement Plan (ESOP). The Company includes the shares purchased in such transactions within the total number of shares authorized for purchase pursuant to the currently existing publicly announced program.

20
14
W
EST
AM
ER
ICA
BA
NC
OR
PO
RA
TIO
N F
OR
M 1
0-K
20
15
W
EST
AM
ER
ICA
BA
NC
OR
PO
RA
TIO
N P
RO
XY
17 - 17 -
The Company repurchases shares of its common stock in the open market to optimize the Company’s use of equity capital and enhance shareholder value and with the intention of lessening the dilutive impact of issuing new shares under stock option plans,and other ongoing requirements.
Shares were repurchased during the fourth quarter of 2014 pursuant to a program approved by the Board of Directors on July 24, 2014 authorizing the purchase of up to 2 million shares of the Company’s common stock from time to time prior to September 1, 2015.
[The remainder of this page intentionally left blank]

20
14
W
EST
AM
ER
ICA
BA
NC
OR
PO
RA
TIO
N FO
RM
10
-K
20
15
W
EST
AM
ER
ICA
BA
NC
OR
PO
RA
TIO
N P
RO
XY
18
- 18 -
ITEM 6. SELECTED FINANCIAL DATA
The following financial information for the five years ended December 31, 2014 has been derived from the Company’s audited consolidated financial statements. This information should be read in conjunction with those statements, notes and other information included elsewhere herein.
WESTAMERICA BANCORPORATION FINANCIAL SUMMARY(In thousands, except per share data and ratios)
For the Years Ended December 31: 2014 2013 2012 2011 2010 Interest and loan fee income ...................................... $140,209 $154,396 $183,364 $207,979 $221,155 Interest expense........................................................... 3,444 4,671 5,744 8,382 12,840 Net interest income ..................................................... 136,765 149,725 177,620 199,597 208,315 Provision for loan losses ............................................. 2,800 8,000 11,200 11,200 11,200 Noninterest income:
Net losses from securities......................................... –– –– (1,287) –– –– Gain on acquisition................................................... –– –– –– –– 178 Deposit service charges and other ............................ 51,787 57,011 58,309 60,097 61,276
Total noninterest income............................................ 51,787 57,011 57,022 60,097 61,454 Noninterest expense
Settlements ............................................................... –– –– –– 2,100 43 Other noninterest expense ........................................ 106,799 112,614 116,885 125,578 127,104
Total noninterest expense........................................... 106,799 112,614 116,885 127,678 127,147 Income before income taxes ....................................... 78,953 86,122 106,557 120,816 131,422 Provision for income taxes ......................................... 18,307 18,945 25,430 32,928 36,845 Net income................................................................... $60,646 $67,177 $81,127 $87,888 $94,577
Average common shares outstanding........................ 26,099 26,826 27,654 28,628 29,166 Average diluted common shares outstanding........... 26,160 26,877 27,699 28,742 29,471 Shares outstanding at December 31 .......................... 25,745 26,510 27,213 28,150 29,090
Per common share: Basic earnings .......................................................... $2.32 $2.50 $2.93 $3.07 $3.24 Diluted earnings ....................................................... 2.32 2.50 2.93 3.06 3.21 Book value at December 31...................................... 20.45 20.48 20.58 19.85 18.74
Financial Ratios: Return on assets ........................................................ 1.22% 1.38% 1.64% 1.78% 1.95% Return on common equity......................................... 11.57% 12.48% 14.93% 16.14% 18.11% Net interest margin (FTE)* ....................................... 3.70% 4.08% 4.79% 5.32% 5.54% Net loan losses to average loans................................ 0.17% 0.33% 0.59% 0.52% 0.56% Efficiency ratio **..................................................... 52.24% 50.11% 46.01% 45.77% 44.13% Equity to assets ......................................................... 10.46% 11.20% 11.31% 11.08% 11.06%
Period End Balances: Assets........................................................................ $5,035,724 $4,847,055 $4,952,193 $5,042,161 $4,931,524 Loans ........................................................................ 1,700,290 1,827,744 2,111,357 2,523,806 2,922,084Allowance for loan losses ......................................... 31,485 31,693 30,234 32,597 35,636 Investment securities................................................. 2,639,439 2,211,680 1,981,677 1,561,556 1,252,212 Deposits .................................................................... 4,349,191 4,163,781 4,232,492 4,249,921 4,132,961Identifiable intangible assets and goodwill ............... 135,960 140,230 144,934 150,302 156,277 Short-term borrowed funds ....................................... 89,784 62,668 53,687 115,689 107,385 Federal Home Loan Bank advances.......................... 20,015 20,577 25,799 26,023 61,698 Term repurchase agreement ...................................... –– 10,000 10,000 10,000 –– Debt financing........................................................... –– –– 15,000 15,000 26,363 Shareholders’ equity ................................................. 526,603 542,934 560,102 558,641 545,287
Capital Ratios at Period End:Total risk based capital ............................................. 14.54% 16.18% 16.33% 15.75% 15.50% Tangible equity to tangible assets ............................. 7.97% 8.56% 8.64% 8.35% 8.15%
Dividends Paid Per Common Share .......................... $1.52 $1.49 $1.48 $1.45 $1.44 Common Dividend Payout Ratio ............................... 66% 60% 51% 47% 45%
____________ * Yields on securities and certain loans have been adjusted upward to a “fully taxable equivalent” (“FTE”) basis, which is a non-GAAP financial measure, in
order to reflect the effect of income which is exempt from federal income taxation at the current statutory tax rate. ** The efficiency ratio is defined as noninterest expense divided by total revenue (net interest income on an FTE basis, which is a non-GAAP financial
measure, and noninterest income).

20
14
W
EST
AM
ER
ICA
BA
NC
OR
PO
RA
TIO
N F
OR
M 1
0-K
20
15
W
EST
AM
ER
ICA
BA
NC
OR
PO
RA
TIO
N P
RO
XY
19 - 19 -
ITEM 7. MANAGEMENT’S DISCUSSION AND ANALYSIS OF FINANCIAL CONDITION AND RESULTS OFOPERATIONS
The following discussion addresses information pertaining to the financial condition and results of operations of Westamerica Bancorporation and subsidiaries (the “Company”) that may not be otherwise apparent from a review of the consolidated financial statements and related footnotes. It should be read in conjunction with those statements and notes found on pages 50 through 88,as well as with the other information presented throughout the Report.
Critical Accounting Policies
The Company’s consolidated financial statements are prepared in accordance with accounting principles generally accepted in theUnited States of America and follow general practices within the banking industry. Application of these principles requires theCompany to make certain estimates, assumptions, and judgments that affect the amounts reported in the financial statements and accompanying notes. These estimates, assumptions, and judgments are based on information available as of the date of the financial statements; accordingly, as this information changes, the financial statements could reflect different estimates, assumptions, and judgments. Certain accounting policies inherently have a greater reliance on the use of estimates, assumptionsand judgments and as such have a greater possibility of producing results that could be materially different than originally reported. Estimates, assumptions and judgments are necessary when assets and liabilities are required to be recorded at fair value, when a decline in the value of an asset not carried on the financial statements at fair value warrants an impairment writedown orvaluation reserve to be established, or when an asset or liability needs to be recorded contingent upon a future event. Carryingassets and liabilities at fair value inherently results in more financial statement volatility. The fair values and the information used to record valuation adjustments for certain assets and liabilities are based either on quoted market prices or are provided by other third-party sources, when available.
The most significant accounting policies followed by the Company are presented in Note 1 to the consolidated financial statements. These policies, along with the disclosures presented in the other financial statement notes and in this discussion,provide information on how significant assets and liabilities are valued in the financial statements and how those values are determined. Based on the valuation techniques used and the sensitivity of financial statement amounts to the methods, assumptions, and estimates underlying those amounts, Management has identified the allowance for loan losses accounting to be the accounting area requiring the most subjective or complex judgments, and as such could be most subject to revision as new information becomes available. A discussion of the factors affecting accounting for the allowance for loan losses and purchasedloans is included in the “Loan Portfolio Credit Risk” discussion below.
Net Income
During the three years ended December 31, 2014, market interest rates declined and remained at low levels. The Federal Reserve’s Federal Open Market Committee has maintained highly accommodative monetary policies to influence interest rates to low levels in order to provide stimulus to the economy following the “financial crisis” recession. The Company’s principal source of revenue is net interest and fee income, which represents interest earned on loans and investment securities (“earning assets”) reduced by interest paid on deposits and other borrowings (“interest-bearing liabilities”). The relatively low level of market interest rates has reduced the spread between interest rates on earning assets and interest bearing liabilities. The Company’s net interest margin and net interest income declined as market interest rates on newly originated loans remain below the yields earned on older-dated loans and on the overall loan portfolio. The Company is reducing its exposure to rising interest rates by purchasing shorter-duration investment securities with lower yields than longer-duration securities. The Company’s credit quality continuedto improve, as nonperforming assets declined thirty percent in the twelve months ended December 31, 2014 and net loan losses declined in 2014 compared with 2013. The improvement in credit quality has resulted in Management reducing the provision for loan losses by sixty-five percent in the twelve months ended December 31, 2014 compared with 2013. The credit quality improvement also contributed to reducing noninterest expenses related to nonperforming assets. Management is focused on controlling all noninterest expense levels, particularly due to market interest rate pressure on net interest income.
The Company reported net income of $60.6 million or $2.32 diluted earnings per common share for the year ended December 31, 2014 compared with net income of $67.2 million or $2.50 diluted earnings per common share for the year ended December 31, 2013 and net income of $81.1 million or $2.93 diluted earnings per common share for the year ended December 31, 2012.

20
14
W
EST
AM
ER
ICA
BA
NC
OR
PO
RA
TIO
N FO
RM
10
-K
20
15
W
EST
AM
ER
ICA
BA
NC
OR
PO
RA
TIO
N P
RO
XY
20
- 20 -
Components of Net Income
For the Years Ended December 31, ($ in thousands except per share amounts) 2014 2013 2012 Net interest and loan fee income (FTE)* ............................................................. $152,656 $167,737 $197,027 Provision for loan losses ...................................................................................... (2,800) (8,000) (11,200) Noninterest income .............................................................................................. 51,787 57,011 57,022 Noninterest expense ............................................................................................. (106,799) (112,614) (116,885) Income before income taxes (FTE)*.................................................................... 94,844 104,134 125,964Taxes *................................................................................................................. (34,198) (36,957) (44,837)
Net income ...................................................................................................... $60,646 $67,177 $81,127 Net income per average fully-diluted common share .......................................... $2.32 $2.50 $2.93 Net income as a percentage of average shareholders’ equity............................... 11.57% 12.48% 14.93% Net income as a percentage of average total assets.............................................. 1.22% 1.38% 1.64% * Fully taxable equivalent (FTE)
Comparing 2014 with 2013, net income decreased $6.5 million primarily due to lower net interest and fee income (FTE) and lower noninterest income, partially offset by decreases in the provision for loan losses, noninterest expense and income tax provision (FTE). The lower net interest and fee income (FTE) was primarily caused by a lower average volume of loans and lower yields on interest earning assets, partially offset by higher average balances of investments and lower average balances of higher-costing interest-bearing liabilities. The provision for loan losses was reduced, reflecting Management's evaluation of lossesinherent in the loan portfolio. Lower noninterest income was mostly attributable to lower merchant processing service fees, lower service charges on deposit accounts and the recognition in 2013 of a loan principal recovery exceeding the purchase date fair value (included in “other noninterest income”). Noninterest expense decreased mostly due to reduced OREO expense net of disposition gains, personnel costs, loan administration expenses, professional fees and limited partnership operating losses (included in “other noninterest expense”).
Comparing 2013 to 2012, net income decreased $14.0 million or 17.2%, primarily due to lower net interest and loan fee income (FTE), partially offset by decreases in loan loss provision, noninterest expense and income tax provision (FTE). The lower net interest and loan fee income (FTE) was primarily caused by a lower average volume of loans and lower yields on interest-earningassets, partially offset by higher average balances of investments, lower average balances of interest-bearing liabilities and lower rates paid on interest-bearing deposits. The provision for loan losses was reduced, reflecting Management's evaluation of lossesinherent in the loan portfolio; net loan losses and nonperforming loan volumes have declined relative to earlier periods. Noninterest expense decreased $4.3 million primarily due to reduced personnel costs, professional fees, loan administration costs,expenses related to other real estate owned and intangible asset amortization.
Net Interest and Loan Fee Income (FTE)
The Company's primary source of revenue is net interest income, or the difference between interest income earned on loans and investment securities and interest expense paid on interest-bearing deposits and other borrowings.
Components of Net Interest and Loan Fee Income (FTE)
For the Years Ended December 31, ($ in thousands) 2014 2013 2012 Interest and loan fee income............................................................................................ $140,209 $154,396 $183,364 Interest expense............................................................................................................... (3,444) (4,671) (5,744) FTE adjustment ............................................................................................................... 15,891 18,012 19,407
Net interest and loan fee income (FTE)....................................................................... $152,656 $167,737 $197,027 Net interest margin (FTE) ............................................................................................... 3.70% 4.08% 4.79%
Comparing 2014 with 2013, net interest and fee income (FTE) decreased $15.1 million or 9.0% primarily due to a lower average volume of loans (down $182 million) and lower yields on interest-earning assets (down 41 basis points “bp”), partially offset byhigher average balances of investments (up $206 million) and lower average balances of higher-costing interest-bearing liabilities.
Comparing 2013 with 2012, net interest and loan fee income (FTE) decreased $29.3 million or 14.9%, primarily due to a lower average volume of loans (down $360 million) and lower yields on interest-earning assets (down 74 bp), partially offset by higheraverage balances of investments (up $355 million), lower average balances of interest-bearing liabilities (down $161 million) and lower rates paid on interest-bearing deposits (down 2 bp).

20
14
W
EST
AM
ER
ICA
BA
NC
OR
PO
RA
TIO
N F
OR
M 1
0-K
20
15
W
EST
AM
ER
ICA
BA
NC
OR
PO
RA
TIO
N P
RO
XY
21 - 21 -
Loan volumes have declined due to problem loan workout activities (such as chargeoffs, collateral repossessions and principal payments), particularly with purchased loans, and reduced volumes of loan originations. In Management’s opinion, current levelsof competitive loan pricing do not provide adequate forward earnings potential. As a result, the Company has not currently takenan aggressive posture relative to loan portfolio growth. Management has maintained relatively stable interest-earning asset volumes by increasing investment securities as loan volumes have declined.
Yields on interest-earning assets have declined due to relatively low interest rates prevailing in the market. The net interestmargin (FTE) was 3.70% in 2014, 4.08% in 2013 and 4.79% in 2012. During the three years ended December 31, 2014, the net interest margin (FTE) was affected by declining market interest rates. The volume of older-dated higher-yielding loans declineddue to principal maturities and paydowns. Newly originated loans have lower yields. The Company, in anticipation of rising interest rates, has been purchasing floating rate and shorter-duration investment securities with lower yields than longer-duration securities to increase liquidity. The Company’s high levels of liquidity will provide an opportunity to obtain higher yielding assets once market interest rates start rising. The Company has been purchasing securities of U. S. government sponsored entities whichhave call options; the issuing entities have been exercising the call options, and the Company has re-invested the proceeds at higher rates; interest rates in the two to five-year time horizon have increased throughout 2014. The Company has been replacinghigher-cost funding sources with low-cost deposits and interest expense has declined to offset some of the decline in interest income. Interest expense has been reduced by lowering rates paid on interest-bearing deposits and borrowings and by reducing thevolume of higher-cost funding sources. A $15 million long-term note was repaid in October 2013 and a $10 million term repurchase agreement was repaid in August 2014. Average balances of time deposits declined $134 million in 2014 compared with 2013. Lower-cost checking and savings deposits accounted for 89.8% of total average deposits in 2014 compared with 86.3% in 2013 and 82.8% in 2012.
Comparing 2014 with 2013, interest and fee income (FTE) was down $16.3 million or 9.5%. The decrease resulted from a lower average volume of loans and lower yields on interest-earning assets, partially offset by higher average balances of investments.Average balances of loans decreased $182 million primarily attributable to decreases in average balances of commercial real estate loans (down $105 million), consumer installment and other loans (down $54 million), residential real estate loans (down $40 million) and tax-exempt commercial loans (down $19 million), partially offset by a $40 million increase in the average balance of taxable commercial loans. The average investment portfolio increased $206 million mostly due to higher average balances of U.S. government sponsored entities (up $284 million) and corporate securities (up $55 million), partially offset by a $105 million decrease in average balances of collateralized mortgage obligations and mortgage-backed securities.
The average yield on earning assets in 2014 was 3.78% compared with 4.19% in 2013. The loan portfolio yield for 2014 was 5.12% compared with 5.36% for 2013 due to lower yields on taxable commercial loans (down 89 bp), consumer installment and other loans (down 28 bp), commercial real estate loans (down 9 bp), construction loans (down 189 bp) and tax-exempt commercial loans (down 13 bp). Nonperforming loans are included in average loan volumes used to compute loan yields; fluctuations in nonaccrual loan volumes impact loan yields. The yield on construction loans in 2013 was elevated due to higher interest received on nonaccrual loans and discount accretion on purchased loans. The investment portfolio yield decreased 37 bpto 2.76% primarily due to lower yields on municipal securities (down 46 bp) and corporate securities (down 19 bp), partially offset by higher yields on securities of U.S. government sponsored entities (up 44 bp). The yield on securities of U.S. government sponsored entities rose as securities added to the portfolio in 2014 were higher yielding than securities held in the prior period.
Comparing 2014 with 2013, interest expense declined $1.2 million or 26.3% due to lower average balances of higher-costing interest-bearing liabilities. Average balances of debt financing and Federal Home Loan Bank advances declined $12 million and $5 million, respectively. Average balances of interest-bearing deposits decreased primarily due to lower average balances of time deposits $100 thousand or more (down $104 million), time deposits less than $100 thousand (down $30 million) and preferred money market savings (down $10 million), partially offset by higher average balances of money market savings (up $54 million), money market checking accounts (up $32 million), and regular savings (up $20 million). Rates paid on interest-bearing liabilities averaged 0.14% in 2014 compared with 0.18% in 2013. Rates paid on interest-bearing deposits were 0.12% in 2014 compared with 0.14% in 2013.
In 2013, interest and loan fee income (FTE) was down $30.4 million or 15.0% from 2012. The decrease resulted from a lower average volume of loans and lower yields on interest-earning assets, partially offset by higher average balances of investments.The total average balances of loans declined due to decreases in the average balances of commercial real estate loans (down $155million), taxable commercial loans (down $63 million), consumer loans (down $57 million), residential real estate loans (down $53 million), tax-exempt commercial loans (down $22 million) and construction loans (down $11 million). The average investment portfolio increased largely due to higher average balances of corporate securities (up $205 million), collateralizedmortgage obligations (up $172 million) and municipal securities (up $47 million), partially offset by decreases in average balances of mortgage backed securities (down $37 million) and securities of U.S. government sponsored entities (down $30 million).

20
14
W
EST
AM
ER
ICA
BA
NC
OR
PO
RA
TIO
N FO
RM
10
-K
20
15
W
EST
AM
ER
ICA
BA
NC
OR
PO
RA
TIO
N P
RO
XY
22
- 22 -
The average yield on the Company's earning assets decreased from 4.93% in 2012 to 4.19% in 2013. The composite yield on loans declined 41 bp to 5.36% mostly due to lower yields on commercial real estate loans (down 45 bp), consumer loans (down 62 bp), residential real estate loans (down 14 bp), taxable commercial loans (down 8 bp) and tax-exempt loans (down 20 bp). Nonperforming loans are included in average loan volumes used to compute loan yields; fluctuations in nonaccrual loan volumes impact loan yields. The yield on construction loans in 2013 was elevated due to interest received on nonaccrual loans and discount accretion on purchased loans. The investment yields in general declined due to market rates. The investment portfolio yield decreased 71 bp to 3.13% in 2013 primarily due to lower yields on collateralized mortgage obligations and mortgage backedsecurities (down 65 bp), municipal securities (down 55 bp) and corporate securities (down 46 bp).
Comparing 2013 with 2012, interest expense declined $1.1 million or 18.7% due to lower average balances of interest-bearing liabilities and lower rates paid on interest-bearing deposits. Lower-cost checking and savings deposits accounted for 86.3% of total average deposits in 2013 compared with 82.8% in 2012. Average interest-bearing liabilities fell $161 million in 2013 compared with 2012 primarily due to declines in the average balances of time deposits $100 thousand or more (down $120 million) and time deposits less than $100 thousand (down $36 million), preferred money market accounts (down $23 million) and customer sweep accounts (down $23 million), partially offset by increases in the average balances of regular savings (up $25 million) and money market savings (up $17 million). Rates paid on interest-bearing deposits averaged 0.14% in 2013 compared with 0.16% for 2012 as a result of decreases in rates paid on time deposits less than $100 thousand (down 10 bp).
[The remainder of this page intentionally left blank]

20
14
W
EST
AM
ER
ICA
BA
NC
OR
PO
RA
TIO
N F
OR
M 1
0-K
20
15
W
EST
AM
ER
ICA
BA
NC
OR
PO
RA
TIO
N P
RO
XY
23 - 23 -
Summary of Average Balances, Yields/Rates and Interest Differential
The following tables present information regarding the consolidated average assets, liabilities and shareholders’ equity, the amounts of interest income earned from average interest earning assets and the resulting yields, and the amounts of interest expense incurred on average interest-bearing liabilities and the resulting rates. Average loan balances include nonperforming loans. Interest income includes reversal of previously accrued interest on loans placed on non-accrual status during the period and proceeds from loans on nonaccrual status only to the extent cash payments have been received and applied as interest income andaccretion of purchased loan discounts. Yields on tax-exempt securities and loans have been adjusted upward to reflect the effectof income exempt from federal income taxation at the current statutory tax rate.
Distribution of Assets, Liabilities & Shareholders’ Equity and Yields, Rates & Interest Margin
For the Year Ended December 31, 2014
($ in thousands) Average Balance
Interest Income/ Expense
Yields/Rates
Assets Investment securities:
Available for sale: Taxable........................................................................................................................... $1,117,869 $18,050 1.61% Tax-exempt (1)............................................................................................................... 172,042 9,884 5.75%
Held to maturity: Taxable........................................................................................................................... 356,710 6,716 1.88% Tax-exempt (1)............................................................................................................... 714,890 30,641 4.29%
Loans: Commercial
Taxable........................................................................................................................... 296,163 15,877 5.36% Tax-exempt (1)............................................................................................................... 87,633 5,022 5.73%
Commercial real estate....................................................................................................... 757,047 46,428 6.13% Real estate construction ..................................................................................................... 13,132 752 5.73% Real estate residential ........................................................................................................ 171,267 5,870 3.43% Consumer........................................................................................................................... 447,720 16,860 3.77%
Total Loans (1) ...................................................................................................................... 1,772,962 90,809 5.12% Interest-earning assets (1) ...................................................................................................... 4,134,473 156,100 3.78% Other assets............................................................................................................................ 821,170
Total assets..................................................................................................................... $4,955,643 Liabilities and shareholders’ equity Deposits:
Noninterest bearing demand .............................................................................................. $1,841,522 –– –– Savings and interest-bearing transaction............................................................................ 2,005,502 1,174 0.06% Time less than $100,000 .................................................................................................... 197,821 820 0.41% Time $100,000 or more...................................................................................................... 237,002 893 0.38%
Total interest-bearing deposits ....................................................................................... 2,440,325 2,887 0.12% Short-term borrowed funds.................................................................................................... 70,252 90 0.13% Federal Home Loan Bank advances ...................................................................................... 20,308 407 2.00% Term repurchase agreement................................................................................................... 6,082 60 0.99%
Total interest-bearing liabilities ......................................................................................... 2,536,967 3,444 0.14% Other liabilities ...................................................................................................................... 52,866 Shareholders’ equity .............................................................................................................. 524,288
Total liabilities and shareholders’ equity ........................................................................... $4,955,643 Net interest spread (2)............................................................................................................ 3.64% Net interest income and interest margin (1)(3) ...................................................................... $152,656 3.70%
____________ (1) Amounts calculated on a fully taxable equivalent basis using the current statutory federal tax rate. (2) Net interest spread represents the average yield earned on interest earning assets less the average rate incurred on interest-
bearing liabilities. (3) Net interest margin is computed by calculating the difference between interest income and expense, divided by the average
balance of interest-earning assets. The net interest margin is greater than the net interest spread due to the benefit of noninterest-bearing demand deposits.

20
14
W
EST
AM
ER
ICA
BA
NC
OR
PO
RA
TIO
N FO
RM
10
-K
20
15
W
EST
AM
ER
ICA
BA
NC
OR
PO
RA
TIO
N P
RO
XY
24
- 24 -
Distribution of Assets, Liabilities & Shareholders’ Equity and Yields, Rates & Interest Margin
For the Year Ended December 31, 2013
($ in thousands) Average Balance
Interest Income/ Expense
Yields/Rates
Assets Investment securities:
Available for sale: Taxable........................................................................................................................... $823,228 $14,685 1.78% Tax-exempt (1)............................................................................................................... 186,101 10,435 5.61%
Held to maturity: Taxable........................................................................................................................... 431,246 7,516 1.74% Tax-exempt (1)............................................................................................................... 714,515 34,961 4.89%
Loans: Commercial
Taxable........................................................................................................................... 256,638 16,042 6.25% Tax-exempt (1)............................................................................................................... 106,871 6,264 5.86%
Commercial real estate....................................................................................................... 862,266 53,615 6.22% Real estate construction ..................................................................................................... 15,514 1,182 7.62% Real estate residential ........................................................................................................ 211,360 7,357 3.48% Consumer........................................................................................................................... 501,932 20,351 4.05%
Total Loans (1) ...................................................................................................................... 1,954,581 104,811 5.36% Interest-earning assets (1) ...................................................................................................... 4,109,671 172,408 4.19% Other assets............................................................................................................................ 754,191
Total assets..................................................................................................................... $4,863,862 Liabilities and shareholders’ equity Deposits:
Noninterest bearing demand .............................................................................................. $1,683,447 –– –– Savings and interest-bearing transaction............................................................................ 1,910,131 1,182 0.06% Time less than $100,000 .................................................................................................... 228,061 1,070 0.47% Time $100,000 or more...................................................................................................... 341,184 1,096 0.32%
Total interest-bearing deposits ....................................................................................... 2,479,376 3,348 0.14% Short-term borrowed funds.................................................................................................... 57,454 77 0.13% Federal Home Loan Bank advances ...................................................................................... 25,499 480 1.88% Term repurchase agreement................................................................................................... 10,000 98 0.98% Debt financing ....................................................................................................................... 12,452 668 5.37%
Total interest-bearing liabilities ......................................................................................... 2,584,781 4,671 0.18% Other liabilities ...................................................................................................................... 57,469 Shareholders’ equity .............................................................................................................. 538,165
Total liabilities and shareholders’ equity ........................................................................... $4,863,862 Net interest spread (2)............................................................................................................ 4.01% Net interest income and interest margin (1)(3) ...................................................................... $167,737 4.08%
____________ (1) Amounts calculated on a fully taxable equivalent basis using the current statutory federal tax rate. (2) Net interest spread represents the average yield earned on interest earning assets less the average rate incurred on interest-
bearing liabilities. (3) Net interest margin is computed by calculating the difference between interest income and expense, divided by the average
balance of interest-earning assets. The net interest margin is greater than the net interest spread due to the benefit of noninterest-bearing demand deposits.

20
14
W
EST
AM
ER
ICA
BA
NC
OR
PO
RA
TIO
N F
OR
M 1
0-K
20
15
W
EST
AM
ER
ICA
BA
NC
OR
PO
RA
TIO
N P
RO
XY
25 - 25 -
Distribution of Assets, Liabilities & Shareholders’ Equity and Yields, Rates & Interest Margin
For the Year Ended December 31, 2012
($ in thousands) Average Balance
Interest Income/ Expense
Yields/Rates
Assets Investment securities:
Available for sale: Taxable........................................................................................................................... $491,338 $11,430 2.33% Tax-exempt (1)............................................................................................................... 214,268 12,603 5.88%
Held to maturity: Taxable........................................................................................................................... 460,381 9,916 2.15% Tax-exempt (1)............................................................................................................... 634,482 35,277 5.56%
Loans: Commercial
Taxable........................................................................................................................... 319,235 20,216 6.33% Tax-exempt (1)............................................................................................................... 128,887 7,815 6.06%
Commercial real estate....................................................................................................... 1,016,805 67,863 6.67% Real estate construction ..................................................................................................... 26,314 1,946 7.40% Real estate residential ........................................................................................................ 264,497 9,583 3.62% Consumer........................................................................................................................... 559,132 26,122 4.67%
Total Loans (1) ...................................................................................................................... 2,314,870 133,545 5.77% Interest-earning assets (1) ...................................................................................................... 4,115,339 202,771 4.93% Other assets............................................................................................................................ 838,963
Total assets..................................................................................................................... $4,954,302 Liabilities and shareholders’ equity Deposits:
Noninterest bearing demand .............................................................................................. $1,603,981 –– –– Savings and interest-bearing transaction............................................................................ 1,887,959 1,238 0.07% Time less than $100,000 .................................................................................................... 264,466 1,515 0.57% Time $100,000 or more...................................................................................................... 460,833 1,530 0.33%
Total interest-bearing deposits ....................................................................................... 2,613,258 4,283 0.16% Short-term borrowed funds.................................................................................................... 81,323 77 0.09% Federal Home Loan Bank advances ...................................................................................... 25,916 483 1.86% Term repurchase agreement................................................................................................... 10,000 99 0.99% Debt financing ....................................................................................................................... 15,000 802 5.35%
Total interest-bearing liabilities ......................................................................................... 2,745,497 5,744 0.21% Other liabilities ...................................................................................................................... 61,515 Shareholders’ equity .............................................................................................................. 543,309
Total liabilities and shareholders’ equity ........................................................................... $4,954,302 Net interest spread (2)............................................................................................................ 4.72% Net interest income and interest margin (1)(3) ...................................................................... $197,027 4.79%
____________ (1) Amounts calculated on a fully taxable equivalent basis using the current statutory federal tax rate. (2) Net interest spread represents the average yield earned on interest earning assets less the average rate incurred on interest-
bearing liabilities. (3) Net interest margin is computed by calculating the difference between interest income and expense, divided by the average
balance of interest-earning assets. The net interest margin is greater than the net interest spread due to the benefit of noninterest-bearing demand deposits.
20
14
W
EST
AM
ER
ICA
BA
NC
OR
PO
RA
TIO
N FO
RM
10
-K
20
15
W
EST
AM
ER
ICA
BA
NC
OR
PO
RA
TIO
N P
RO
XY
26
- 26 -
Summary of Changes in Interest Income and Expense due to Changes in Average Asset & Liability Balances and Yields Earned & Rates Paid
The following tables set forth a summary of the changes in interest income and interest expense due to changes in average assetsand liability balances (volume) and changes in average interest yields/rates for the periods indicated. Changes not solely attributable to volume or yields/rates have been allocated in proportion to the respective volume and yield/rate components.
Summary of Changes in Interest Income and Expense
For the Years Ended December 31, 2014 Compared with 2013 (In thousands) Volume Yield/Rate Total Increase (decrease) in interest and loan fee income:
Investment securities: Available for sale:
Taxable ............................................................................................................. $5,256 ($1,891) $3,365 Tax- exempt (1)................................................................................................. (788) 237 (551)
Held to maturity: Taxable ............................................................................................................. (1,299) 499 (800)Tax- exempt (1)................................................................................................. 18 (4,338) (4,320)
Loans: Commercial:
Taxable.............................................................................................................. 2,471 (2,636) (165)Tax- exempt (1)................................................................................................. (1,128) (114) (1,242)
Commercial real estate .......................................................................................... (6,542) (645) (7,187)Real estate construction......................................................................................... (181) (249) (430)Real estate residential............................................................................................ (1,396) (91) (1,487)Consumer .............................................................................................................. (2,198) (1,293) (3,491)
Total loans (1) ................................................................................................... (8,974) (5,028) (14,002)Total decrease in interest and loan fee income (1)............................................................ (5,787) (10,521) (16,308)Increase (decrease) in interest expense:
Deposits: Savings/ interest-bearing....................................................................................... 59 (67) (8)Time less than $100,000 ....................................................................................... (142) (108) (250)Time $100,000 or more ........................................................................................ (335) 132 (203)
Total interest-bearing deposits .......................................................................... (418) (43) (461)Short-term borrowed funds ........................................................................................... 17 (4) 13 Federal Home Loan Bank advances.............................................................................. (97) 24 (73)Term repurchase agreement .......................................................................................... (38) –– (38)Debt financing .............................................................................................................. (668) –– (668)
Total decrease in interest expense......................................................................... (1,204) (23) (1,227)Decrease in net interest income (1) ........................................................................... ($4,583) ($10,498) ($15,081)
____________ (1) Amounts calculated on a fully taxable equivalent basis using the current statutory federal tax rate.
[The remainder of this page intentionally left blank]

20
14
W
EST
AM
ER
ICA
BA
NC
OR
PO
RA
TIO
N F
OR
M 1
0-K
20
15
W
EST
AM
ER
ICA
BA
NC
OR
PO
RA
TIO
N P
RO
XY
27 - 27 -
Summary of Changes in Interest Income and Expense
For the Years Ended December 31, 2013 Compared with 2012 (In thousands) Volume Yield/Rate Total Increase (decrease) in interest and loan fee income:
Investment securities: Available for sale:
Taxable ............................................................................................................. $6,370 ($3,115) $3,255 Tax- exempt (1)................................................................................................. (1,607) (561) (2,168)
Held to maturity: Taxable ............................................................................................................. (612) (1,788) (2,400)Tax- exempt (1)................................................................................................. 4,127 (4,443) (316)
Loans: Commercial:
Taxable.............................................................................................................. (3,919) (255) (4,174)Tax- exempt (1)................................................................................................. (1,300) (251) (1,551)
Commercial real estate .......................................................................................... (9,871) (4,377) (14,248)Real estate construction......................................................................................... (821) 57 (764)Real estate residential............................................................................................ (1,865) (361) (2,226)Consumer .............................................................................................................. (2,548) (3,223) (5,771)
Total loans (1) ................................................................................................... (20,324) (8,410) (28,734)Total decrease in interest and loan fee income (1)............................................................ (12,046) (18,317) (30,363)Increase (decrease) in interest expense:
Deposits: Savings/ interest-bearing....................................................................................... 12 (68) (56)Time less than $100,000 ....................................................................................... (194) (251) (445)Time $100,000 or more ........................................................................................ (386) (48) (434)
Total interest-bearing deposits .......................................................................... (568) (367) (935)Short-term borrowed funds ........................................................................................... (27) 27 –– Federal Home Loan Bank advances.............................................................................. (13) 10 (3)Term repurchase agreement .......................................................................................... –– (1) (1)Debt financing .............................................................................................................. (137) 3 (134)
Total decrease in interest expense......................................................................... (745) (328) (1,073)Decrease in net interest income (1) ........................................................................... ($11,301) ($17,989) ($29,290)
____________ (1) Amounts calculated on a fully taxable equivalent basis using the current statutory federal tax rate.
Provision for Loan Losses
The Company manages credit costs by consistently enforcing conservative underwriting and administration procedures and aggressively pursuing collection efforts with debtors experiencing financial difficulties. The provision for loan losses reflectsManagement's assessment of credit risk in the loan portfolio during each of the periods presented.
The Company provided $2.8 million, $8.0 million and $11.2 million for loan losses in 2014, 2013 and 2012, respectively. The reduced provision for loan losses for 2014 and 2013 reflects Management’s current evaluation of credit quality for the loan portfolio. The Company recorded purchased County Bank and Sonoma Valley Bank loans at estimated fair value upon the acquisition dates, February 6, 2009 and August 20, 2010, respectively. Such estimated fair values were recognized for individualloans, although small balance homogenous loans were pooled for valuation purposes. The valuation discounts recorded for purchased loans included Management’s assessment of the risk of principal loss under economic and borrower conditions prevailing on the dates of purchase. The purchased County Bank loans secured by single-family residential real estate are “covered” through February 6, 2019 by loss-sharing agreements the Company entered with the FDIC which mitigates losses during the term of the agreements. The FDIC indemnification of purchased County Bank non-single-family residential real estate secured loans expired February 6, 2014. Any deterioration in estimated value related to principal loss subsequent to the acquisition dates requires additional loss recognition through a provision for loan losses. No assurance can be given that future provisions for loan losses related to purchased loans will not be necessary. For further information regarding credit risk, the FDIC loss-sharing agreements, net credit losses and the allowance for loan losses, see the “Loan Portfolio Credit Risk” and “Allowance for Credit Losses” sections of this report.

20
14
W
EST
AM
ER
ICA
BA
NC
OR
PO
RA
TIO
N FO
RM
10
-K
20
15
W
EST
AM
ER
ICA
BA
NC
OR
PO
RA
TIO
N P
RO
XY
28
- 28 -
Noninterest Income
Components of Noninterest Income
For the Years Ended December 31, (In thousands) 2014 2013 2012 Service charges on deposit accounts................................................................................ $24,191 $25,693 $27,691 Merchant processing services.......................................................................................... 7,219 9,031 9,734 Debit card fees................................................................................................................. 5,960 5,829 5,173 Other service charges ...................................................................................................... 2,717 2,846 2,801 Trust fees ......................................................................................................................... 2,582 2,313 2,078 ATM processing fees....................................................................................................... 2,473 2,758 3,396 Financial services commissions....................................................................................... 757 831 689 Loss on sale of securities ................................................................................................. — — (1,287) Other................................................................................................................................ 5,888 7,710 6,747
Total............................................................................................................................. $51,787 $57,011 $57,022
In 2014, noninterest income decreased $5.2 million or 9.2% compared with 2013. Merchant processing services fees decreased $1.8 million primarily due to customer attrition and lower transaction volumes. Service charges on deposits decreased $1.5 million compared with 2013 primarily due to declines in fees charged on overdrawn and insufficient funds accounts (down $1.0 million) and lower activity on checking accounts (down $410 thousand). ATM processing fees decreased $285 thousand mainly because the Bank customers had fewer transactions at non-Westamerica ATMs and other cash dispensing terminals. Other noninterest income decreased $1.8 million primarily due to the recognition in 2013 of a loan principal recovery exceeding the purchase date fair value. Trust fees increased $269 thousand mostly due to marketing efforts to increase customer accounts and higher court-approved fees. Debit card fees increased $131 thousand primarily due to higher transaction volumes.
In 2013, noninterest income was $57.0 million, unchanged from 2012. In 2012 noninterest income included a $1.3 million loss realized from the sale of a collateralized mortgage obligation bond whose underlying support tranches began experiencing escalating losses. In 2013, service charges on deposits decreased $2.0 million or 7.2% due to declines in fees charged on overdrawn accounts and insufficient funds (down $1.1 million) and deficit fees charged on analyzed accounts (down $762 thousand). Merchant processing services income decreased $703 thousand mainly due to lower transaction volumes. ATM processing fees decreased $638 thousand primarily because the Bank customers had fewer transactions at non-Westamerica ATMs and other cash dispensing terminals. Offsetting these decreases were higher debit card fees (up $656 thousand) due to higher transaction volumes. Additionally, trust fees and financial services commissions increased $235 thousand and $142 thousand, respectively, from increased sales. Other noninterest income increased $963 thousand primarily due to higher recoveries of charged off purchased loans and life insurance proceeds.
[The remainder of this page intentionally left blank]

20
14
W
EST
AM
ER
ICA
BA
NC
OR
PO
RA
TIO
N F
OR
M 1
0-K
20
15
W
EST
AM
ER
ICA
BA
NC
OR
PO
RA
TIO
N P
RO
XY
29 - 29 -
Noninterest Expense
Components of Noninterest Expense
For the Years Ended December 31, (In thousands) 2014 2013 2012 Salaries and related benefits............................................................................................. $54,777 $56,633 $57,388 Occupancy ....................................................................................................................... 14,992 15,137 15,460 Outsourced data processing services................................................................................ 8,411 8,548 8,531 Amortization of intangible assets..................................................................................... 4,270 4,704 5,368 Furniture and equipment .................................................................................................. 4,174 3,869 3,775 Courier service ................................................................................................................. 2,624 2,868 3,117 Professional fees .............................................................................................................. 2,346 3,057 3,217 Other Real Estate Owned................................................................................................. (642) 1,035 1,235 Other ................................................................................................................................ 15,847 16,763 18,794
Total ............................................................................................................................. $106,799 $112,614 $116,885
In 2014, noninterest expense decreased $5.8 million or 5.2% compared with 2013. Salaries and related benefits decreased $1.9 million primarily due to employee attrition and lower employee benefits. Expenses for other real estate owned, net of disposition gains, declined $1.7 million due to higher net gains on sale of repossessed loan collateral. Professional fees declined $711 thousand due to lower legal fees associated with nonperforming assets. Amortization of identifiable intangibles decreased $434 thousand as assets are amortized on a declining balance method. Other noninterest expense decreased $916 thousand primarily due to lower loan administration costs and lower limited partnership operating losses. Furniture and equipment expenses increased $305 thousand primarily due to increased depreciation costs associated with computer system and software upgrades.
Noninterest expense decreased $4.3 million or 3.7% in 2013 compared with 2012. Salaries and related benefits decreased $755 thousand or 1.3% primarily due to employee attrition. Amortization of identifiable intangibles decreased $664 thousand as such assets are amortized on a declining balance method. Occupancy expense decreased $323 thousand or 2.1% mainly due to lower lease rates on bank premises and utility costs. Expenses relating to other real estate owned decreased $200 thousand mainly due to lower writedowns. Professional fees declined $160 thousand or 5.0% due to lower legal fees associated with nonperforming assets. Other noninterest expense decreased $2.0 million primarily due to lower administration expenses related to nonperforming loans and decreases in postage, customer check printing expenses and correspondent bank service charges.
Provision for Income Tax
The income tax provision (FTE) was $34.2 million in 2014 compared with $37.0 million in 2013 and $44.8 million in 2012. The 2014 effective tax rate (FTE) was 36.1% compared with 35.5% in 2013 and 35.6% in 2012. The effective tax rates without FTE adjustments were 23.2% for 2014 and 22.0% for 2013 and 23.9% for 2012. The 2013 tax provision reflected tax-exempt life insurance proceeds and recognized California enterprise zone hiring credits for filed amended returns (2007-2009).
On July 11, 2013, California’s Governor Jerry Brown signed two bills which end a 30-year-old enterprise zone tax incentive program and replace it with new incentives. Due to the passage of these bills, many California tax benefits were phased out by the end of 2014. The Company had been realizing California tax benefits under the historical enterprise zone tax incentive program,including:
• Exclusions of net interest income on loans funding economic activity within enterprise zones
• Tax credits realized by hiring employees within enterprise zones; however, the economic value of the tax credits is partially offset by a reduction in deductible compensation expense by the amount of the tax credits.
Effective January 1, 2014, the new law eliminated the net interest deduction for enterprise zone loans and the hiring credits were significantly altered. The Company did not incur a significant change in its tax provision due to the new laws; the state tax benefits recognized from the current enterprise zone tax incentive program for the years ended December 31, 2014 and 2013 were $47 thousand and $121 thousand, net of federal income tax consequences, respectively.

20
14
W
EST
AM
ER
ICA
BA
NC
OR
PO
RA
TIO
N FO
RM
10
-K
20
15
W
EST
AM
ER
ICA
BA
NC
OR
PO
RA
TIO
N P
RO
XY
30
- 30 -
Investment Portfolio
The Company maintains a securities portfolio consisting of securities issued by U.S. Treasury, U.S. Government sponsored entities, state and political subdivisions and corporations, and asset-backed and other securities. Investment securities are held in safekeeping by an independent custodian.
Management has maintained relatively stable interest-earning asset volumes by increasing investment securities as loan volumes have declined. The carrying value of the Company’s investment securities portfolio was $2.6 billion as of December 31, 2014, anincrease of $427.8 million or 19.3% compared to December 31, 2013.
Management continually evaluates the Company’s investment securities portfolio in response to established asset/liability management objectives, changing market conditions that could affect profitability, and the level of interest rate risk to which the Company is exposed. These evaluations may cause Management to change the level of funds the Company deploys into investment securities, change the composition of the Company’s investment securities portfolio, and change the proportion of investments allocated into the available for sale and held to maturity investment categories.
The Company has been reducing its positions in mortgage-related securities since the second quarter 2013 in an effort to manageextension risk. Extension risk represents the risk mortgages underlying the securities experience slower principal reductions asrising market interest rates cause a disincentive for borrowers to reduce principal balances; under such circumstances the Company will hold these securities for a longer period than anticipated at current yield levels rather than having the opportunity to reinvest cash flows at higher yields. The Company’s positioning of the balance sheet for rising interest rates has resulted in the purchase of floating rate corporate bonds, federal agency bonds, and short-term state and municipal bonds. As of December 31, 2014, substantially all of the Company’s investment securities continue to be investment grade rated by one or more major ratingagencies. In addition to monitoring credit rating agency evaluations, Management performs its own evaluations regarding the credit worthiness of the issuer or the securitized assets underlying asset-backed securities.
The Company’s procedures for evaluating investments in securities issued by states, municipalities and political subdivisions are in accordance with guidance issued by the Board of Governors of the Federal Reserve System, “Investing in Securities without Reliance on Nationally Recognized Statistical Rating Agencies” (SR 12-15) and other regulatory guidance. Credit ratings are considered in our analysis only as a guide to the historical default rate associated with similarly-rated bonds. There have been no significant differences in our internal analyses compared with the ratings assigned by the third party credit rating agencies.
The following table shows the fair value carrying amount of the Company’s investment securities available for sale as of the datesindicated:
Available for Sale Portfolio
At December 31, (In thousands) 2014 2013 2012 U.S. Treasury securities.............................................................. $3,505 $3,506 $3,558 Securities of U.S. Government sponsored entities ..................... 635,188 130,492 49,525 Residential mortgage backed securities...................................... 26,407 34,176 56,932 Commercial mortgage backed securities .................................... 2,919 3,425 4,145 Obligations of states and political subdivisions.......................... 181,799 191,386 215,247 Residential collateralized mortgage obligations......................... 222,457 252,896 221,105 Asset-backed securities .............................................................. 8,313 14,555 16,005 FHLMC and FNMA stock ......................................................... 5,168 13,372 2,880 Corporate securities.................................................................... 512,239 432,431 252,838 Other securities........................................................................... 2,786 3,142 3,401
Total ....................................................................................... $1,600,781 $1,079,381 $825,636

20
14
W
EST
AM
ER
ICA
BA
NC
OR
PO
RA
TIO
N F
OR
M 1
0-K
20
15
W
EST
AM
ER
ICA
BA
NC
OR
PO
RA
TIO
N P
RO
XY
31 - 31 -
The following table sets forth the relative maturities and contractual yields of the Company’s available for sale securities (statedat fair value) at December 31, 2014. Yields on state and political subdivision securities have been calculated on a fully taxableequivalent basis using the current federal statutory rate. Mortgage-backed securities are shown separately because they are typically paid in monthly installments over a number of years.
Available for Sale Maturity Distribution
At December 31, 2014 ($ in thousands)
Within one year
After one but within five years
After five but within ten years
After ten years
Mortgage- backed Other Total
U.S. Treasury securities ................ $3,505 $–– $–– $–– $–– $–– $3,505 Interest rate........................ 0.47% ––% ––% ––% ––% ––% 0.47%
U.S. Government sponsored entities......................................... –– 156,816 478,372 –– –– –– 635,188
Interest rate........................ ––% 1.54% 1.59% –– –– –– 1.58%States and political subdivisions ... 12,964 23,778 82,051 63,006 –– –– 181,799
Interest rate (FTE) ............. 3.08% 5.58% 5.90% 5.97% –– –– 5.67%Asset-backed securities.................. –– 5,009 3,304 –– –– –– 8,313
Interest rate........................ –– 0.63% 0.44% –– –– –– 0.54%Corporate securities ...................... 41,522 445,194 25,523 –– –– –– 512,239
Interest rate........................ 1.82% 1.38% 1.59% –– –– –– 1.42%Subtotal ..................................... 57,991 630,797 589,250 63,006 –– –– 1,341,044
Interest rate (FTE) ............. 2.02% 1.57% 2.18% 5.97% –– –– 2.06%Mortgage backed securities and
residential collateralized mortgage obligations................... –– –– –– –– 251,783 –– 251,783
Interest rate........................ –– –– –– –– 1.81% –– 1.81%Other without set maturities.......... –– –– –– –– –– 7,954 7,954
Interest rate (FTE) ............. –– –– –– –– –– 1.76% 1.76%Total ...................................... $57,991 $630,797 $589,250 $63,006 $251,783 $7,954 $1,600,781
Interest rate (FTE) ............. 2.02% 1.57% 2.18% 5.97% 1.81% 1.76% 2.00%
The following table shows the amortized cost carrying amount and fair value of the Company’s investment securities held to maturity as of the dates indicated:
Held to Maturity Portfolio
At December 31, (In thousands) 2014 2013 2012Securities of U.S. Government sponsored entities................ $1,066 $1,601 $3,232Residential mortgage backed securities................................ 59,078 65,076 72,807Obligations of states and political subdivisions.................... 720,189 756,707 680,802Residential collateralized mortgage obligations ................... 258,325 308,915 399,200
$1,038,658 $1,132,299 $1,156,041Total..................................................................................Fair value.............................................................................. $1,048,562 $1,112,676 $1,184,557
[The remainder of this page intentionally left blank]

20
14
W
EST
AM
ER
ICA
BA
NC
OR
PO
RA
TIO
N FO
RM
10
-K
20
15
W
EST
AM
ER
ICA
BA
NC
OR
PO
RA
TIO
N P
RO
XY
32
- 32 -
The following table sets forth the relative maturities and contractual yields of the Company’s held to maturity securities at December 31, 2014. Yields on state and political subdivision securities have been calculated on a fully taxable equivalent basisusing the current federal statutory rate. Mortgage-backed securities are shown separately because they are typically paid in monthly installments over a number of years.
Held to Maturity Maturity Distribution
At December 31, 2014 ($ in thousands)
Within One year
After one but within five years
After five but within ten years
After ten years
Mortgage- backed Total
Securities of U.S. Government sponsored entities.......................... $–– $–– $1,066 $–– $–– $1,066
Interest rate.......................... ––% ––% 1.76% ––% ––% 1.76%States and political subdivisions ..... 15,355 228,380 284,153 192,301 –– 720,189
Interest rate (FTE) ............... 4.89% 3.86% 3.88% 4.61% –– 4.09%Subtotal ....................................... 15,355 228,380 285,219 192,301 –– 721,255
Interest rate (FTE) ............... 4.89% 3.86% 3.87% 4.61% –– 4.09%Mortgage backed securities and
residential collateralized mortgage obligations .................... –– –– –– –– 317,403 317,403
Interest rate.......................... –– –– –– –– 1.95% 1.95%Total ........................................ $15,355 $228,380 $285,219 $192,301 $317,403 $1,038,658
Interest rate (FTE) ............... 4.89% 3.86% 3.87% 4.61% 1.95% 3.43%
The following tables summarize the total general obligation and revenue bonds issued by states and political subdivisions held in the Company’s investment securities portfolios as of the dates indicated, identifying the state in which the issuing governmentmunicipality or agency operates.
At December 31, 2014, the Company’s investment securities portfolios included securities issued by 763 state and local government municipalities and agencies located within 45 states with a fair value of $911.0 million. The largest exposure to any one municipality or agency was $7.4 million (fair value) represented by three revenue bonds.
Amortized FairCost Value
Obligations of states and political subdivisions:General obligation bonds:
California $107,997 $110,563Texas 65,292 66,162Pennsylvania 48,675 49,546Minnesota 33,524 33,840New Jersey 30,223 30,598Arizona 28,492 29,378Other (34 states) 249,513 254,043
Total general obligation bonds $563,716 $574,130
Revenue bonds:California $60,473 $62,788Pennsylvania 29,462 30,101Kentucky 19,975 20,370Iowa 18,225 18,898Colorado 18,532 18,862Indiana 16,865 16,859Other (31 states) 164,848 168,972
Total revenue bonds $328,380 $336,850Total obligations of states and political subdivisions $892,096 $910,980
At December 31, 2014
(In thousands)

20
14
W
EST
AM
ER
ICA
BA
NC
OR
PO
RA
TIO
N F
OR
M 1
0-K
20
15
W
EST
AM
ER
ICA
BA
NC
OR
PO
RA
TIO
N P
RO
XY
33 - 33 -
At December 31, 2013, the Company’s investment securities portfolios included securities issued by 808 state and local government municipalities and agencies located within 47 states with a fair value of $932.6 million. The largest exposure to any one municipality or agency was $5.3 million (fair value) represented by two revenue bonds.
Amortized FairCost Value
Obligations of states and political subdivisions:General obligation bonds:
California $119,215 $119,360Texas 57,433 56,594Pennsylvania 48,722 47,394Other (37 states) 375,640 371,215
Total general obligation bonds $601,010 $594,563
Revenue bonds:California $63,001 $64,246Pennsylvania 29,537 28,898Colorado 18,176 17,563Indiana 17,811 17,031Other (37 states) 213,254 210,336
Total revenue bonds $341,779 $338,074Total obligations of states and political subdivisions $942,789 $932,637
At December 31, 2013
(In thousands)
At December 31, 2014, the revenue bonds in the Company’s investment securities portfolios were issued by state and local government municipalities and agencies to fund public services such as water utility, sewer utility, recreational and school facilities, and general public and economic improvements. The revenue bonds were payable from 25 revenue sources. The revenue sources that represent 5% or more individually of the total revenue bonds are summarized in the following table.
Amortized FairCost Value
Revenue bonds by revenue sourceWater $66,305 $68,885Sewer 48,461 49,773Sales tax 35,045 36,289Lease (renewal) 21,789 22,091Lease (abatement) 19,002 19,710College & University 17,655 17,849Other 120,123 122,253
Total revenue bonds by revenue source $328,380 $336,850
(In thousands)
At December 31, 2014
At December 31, 2013, the revenue bonds in the Company’s investment securities portfolios were issued by state and local government municipalities and agencies to fund public services such as water utility, sewer utility, recreational and school facilities, and general public and economic improvements. The revenue bonds were payable from 27 revenue sources. The revenue sources that represent 5% or more individually of the total revenue bonds are summarized in the following table.

20
14
W
EST
AM
ER
ICA
BA
NC
OR
PO
RA
TIO
N FO
RM
10
-K
20
15
W
EST
AM
ER
ICA
BA
NC
OR
PO
RA
TIO
N P
RO
XY
34
- 34 -
Amortized FairCost Value
Revenue bonds by revenue sourceWater $70,924 $70,948Sewer 49,625 48,911Sales tax 34,291 33,465Lease (abatement) 21,821 22,033Lease (renewal) 21,353 20,742Other 143,765 141,975
Total revenue bonds by revenue source $341,779 $338,074
At December 31, 2013
(In thousands)
See Note 2 to the unaudited consolidated financial statements for additional information related to the investment securities.
Loan Portfolio
The Company originates loans with the intent to hold such assets until principal is repaid. Management follows written loan underwriting policies and procedures which are approved by the Bank’s Board of Directors. Loans are underwritten following approved underwriting standards and lending authorities within a formalized organizational structure. The Board of Directors alsoapproves independent real estate appraisers to be used in obtaining estimated values for real property serving as loan collateral.Prevailing economic trends and conditions are also taken into consideration in loan underwriting practices.
All loan applications must be for clearly defined legitimate purposes with a determinable primary source of repayment, and as appropriate, secondary sources of repayment. All loans are supported by appropriate documentation such as current financial statements, tax returns, credit reports, collateral information, guarantor asset verification, title reports, appraisals, and other relevant documentation.
Commercial loans represent term loans used to acquire durable business assets or revolving lines of credit used to finance working capital. Underwriting practices evaluate each borrower’s cash flow as the principal source of loan repayment. Commercial loans are generally secured by the borrower’s business assets as a secondary source of repayment. Commercial loans are evaluated for credit-worthiness based on prior loan performance, borrower financial information including cash flow, borrower net worth and aggregate debt.
Commercial real estate loans represent term loans used to acquire real estate to be operated by the borrower in a commercial capacity. Underwriting practices evaluate each borrower’s global cash flow as the principal source of loan repayment, independent appraisal of value of the property, and other relevant factors. Commercial real estate loans are generally secured by a first lien on the property as a secondary source of repayment.
Real estate construction loans represent the financing of real estate development. Loan principal disbursements are controlled through the use of project budgets, and disbursements are approved based on construction progress, which is validated by projectsite inspections. The real estate serves as collateral, secured by a first lien position on the property.
Residential real estate loans generally represent first lien mortgages used by the borrower to purchase or refinance a principalresidence. For interest-rate risk purposes, the Company offers only fully-amortizing, adjustable-rate mortgages. In underwritingfirst lien mortgages, the Company evaluates each borrower’s ability to repay the loan, an independent appraisal of the value of the property, and other relevant factors. The Company does not offer riskier mortgage products, such as non-amortizing “interest-only” mortgages and “negative amortization” mortgages.
For loans secured by real estate, the Bank requires title insurance to insure the status of its lien and each borrower is obligated to insure the real estate collateral, naming the Company as loss payee, in an amount sufficient to repay the principal amount outstanding in the event of a property casualty loss.
Consumer installment and other loans are predominantly comprised of indirect automobile loans with underwriting based on credit history and scores, personal income, debt service capacity, and collateral values.
For management purposes, the Company segregates its loan portfolio into three segments. Loans originated by the Company following its loan underwriting policies and procedures are separated from purchased loans. Former County Bank loans purchased

20
14
W
EST
AM
ER
ICA
BA
NC
OR
PO
RA
TIO
N F
OR
M 1
0-K
20
15
W
EST
AM
ER
ICA
BA
NC
OR
PO
RA
TIO
N P
RO
XY
35 - 35 -
from the FDIC are segregated as are former Sonoma Valley Bank loans also purchased from the FDIC. Loan volumes have declined due to problem loan workout activities, particularly with purchased loans, and reduced volumes of loan originations. InManagement’s opinion, current levels of competitive loan pricing do not provide adequate forward earnings potential. As a result,the Company has not currently taken an aggressive posture relative to loan portfolio growth.
The following table shows the composition of the loan portfolio of the Company by type of loan and type of borrower, on the dates indicated:
Loan Portfolio
At December 31, (In thousands) 2014 2013 2012 2011 2010Commercial .................................................................... $391,815 $364,159 $401,331 $513,362 $658,988Commercial real estate.................................................... 718,604 799,019 916,594 1,114,496 1,271,510Construction.................................................................... 13,872 13,896 16,515 34,437 74,645Residential real estate ..................................................... 149,827 185,057 234,035 286,727 335,625Consumer installment and other ..................................... 426,172 465,613 542,882 574,784 581,316Total loans ...................................................................... $1,700,290 $1,827,744 $2,111,357 $2,523,806 $2,922,084
The following table shows the maturity distribution and interest rate sensitivity of commercial, commercial real estate, and construction loans at December 31, 2014. Balances exclude residential real estate loans and consumer loans totaling $576.0 million. These types of loans are typically paid in monthly installments over a number of years.
Loan Maturity Distribution
At December 31, 2014 (In thousands)
Within One Year
One to Five Years
After Five Years Total
Commercial and commercial real estate .......................................................... $416,567 $510,027 $183,825 $1,110,419Construction..................................................................................................... 13,872 –– –– 13,872
Total ............................................................................................................. $430,439 $510,027 $183,825 $1,124,291Loans with fixed interest rates ......................................................................... $151,968 $90,384 $64,016 $306,368Loans with floating or adjustable interest rates................................................ 278,471 419,643 119,809 817,923
Total ............................................................................................................. $430,439 $510,027 $183,825 $1,124,291
Commitments and Letters of Credit
The Company issues formal commitments on lines of credit to well-established and financially responsible commercial enterprises. Such commitments can be either secured or unsecured and are typically in the form of revolving lines of credit forseasonal working capital needs. Occasionally, such commitments are in the form of letters of credit to facilitate the customers’particular business transactions. Commitment fees are generally charged for commitments and letters of credit. Commitments on lines of credit and letters of credit typically mature within one year. For further information, see the accompanying notes to the consolidated financial statements.
Loan Portfolio Credit Risk
The Company extends loans to commercial and consumer customers in Northern and Central California. These lending activities expose the Company to the risk borrowers will default, causing loan losses. The Company’s lending activities are exposed to various qualitative risks. All loan segments are exposed to risks inherent in the economy and market conditions. Significant riskcharacteristics related to the commercial loan segment include the borrowers’ business performance and financial condition, andthe value of collateral for secured loans. Significant risk characteristics related to the commercial real estate segment include the borrowers’ business performance and the value of properties collateralizing the loans. Significant risk characteristics related to the construction loan segment include the borrowers’ performance in successfully developing the real estate into the intended purposeand the value of the property collateralizing the loans. Significant risk characteristics related to the residential real estate segment include the borrowers’ financial wherewithal to service the mortgages and the value of the property collateralizing the loans. Significant risk characteristics related to the consumer loan segment include the financial condition of the borrowers and the value of collateral securing the loans.
The preparation of the financial statements requires Management to estimate the amount of losses inherent in the loan portfolioand establish an allowance for credit losses. The allowance for credit losses is established by assessing a provision for loan losses

20
14
W
EST
AM
ER
ICA
BA
NC
OR
PO
RA
TIO
N FO
RM
10
-K
20
15
W
EST
AM
ER
ICA
BA
NC
OR
PO
RA
TIO
N P
RO
XY
36
- 36 -
against the Company’s earnings. In estimating credit losses, Management must exercise judgment in evaluating information deemed relevant, such as financial information regarding individual borrowers, overall credit loss experience, the amount of pastdue, nonperforming and classified loans, recommendations of regulatory authorities, prevailing economic conditions and other information. The amount of ultimate losses on the loan portfolio can vary from the estimated amounts. Management follows a systematic methodology to estimate loss potential in an effort to reduce the differences between estimated and actual losses.
The Company closely monitors the markets in which it conducts its lending operations and follows a strategy to control exposureto loans with high credit risk. The Bank’s organization structure separates the functions of business development and loan underwriting; Management believes this segregation of duties avoids inherent conflicts of combining business development and loan approval functions. In measuring and managing credit risk, the Company adheres to the following practices.
• The Bank maintains a Loan Review Department which reports directly to the Board of Directors. The Loan Review Department performs independent evaluations of loans and assigns credit risk grades to evaluated loans using grading standards employed by bank regulatory agencies. Those loans judged to carry higher risk attributes are referred to as “classified loans.” Classified loans receive elevated management attention to maximize collection.
• The Bank maintains two loan administration offices whose sole responsibility is to manage and collect classified loans.
Classified loans with higher levels of credit risk are further designated as “nonaccrual loans.” Management places classified loans on nonaccrual status when full collection of contractual interest and principal payments is in doubt. Uncollected interest previously accrued on loans placed on nonaccrual status is reversed as a charge against interest income. The Company does not accrue interest income on loans following placement on nonaccrual status. Interest payments received on nonaccrual loans are applied to reduce the carrying amount of the loan unless the carrying amount is well secured by loan collateral. “Nonperformingassets” include nonaccrual loans, loans 90 or more days past due and still accruing, and repossessed loan collateral (commonly referred to as “Other Real Estate Owned”).
The former County Bank loans and repossessed loan collateral were purchased from the FDIC with indemnifying loss-sharing agreements. The loss-sharing agreement on single-family residential real estate assets expires February 6, 2019. The loss-sharingagreement on non-single-family residential real estate assets expired February 6, 2014 as to losses and expires February 6, 2017as to loss recoveries; the Company reclassified assets for which loss indemnification expired during the first quarter 2014 from“purchased covered” to “purchased non-covered”.
[The remainder of this page intentionally left blank]

20
14
W
EST
AM
ER
ICA
BA
NC
OR
PO
RA
TIO
N F
OR
M 1
0-K
20
15
W
EST
AM
ER
ICA
BA
NC
OR
PO
RA
TIO
N P
RO
XY
37 - 37 -
Nonperforming Assets
2014 2013 2012 2011 2010
Originated:Nonperforming nonaccrual loans $5,296 $5,301 $10,016 $10,291 $20,845Performing nonaccrual loans 13 75 1,759 5,256 23Total nonaccrual loans 5,309 5,376 11,775 15,547 20,868Accruing loans 90 or more days past due 502 410 455 2,047 766Total nonperforming loans 5,811 5,786 12,230 17,594 21,634Other real estate owned 4,809 5,527 9,295 14,868 11,424Total nonperforming assets $10,620 $11,313 $21,525 $32,462 $33,058
Purchased covered:Nonperforming nonaccrual loans $297 $11,672 $11,698 $9,388 $28,581Performing nonaccrual loans - 636 1,323 4,924 18,564Total nonaccrual loans 297 12,308 13,021 14,312 47,145Accruing loans 90 or more days past due - - 155 241 355Total nonperforming loans 297 12,308 13,176 14,553 47,500Other real estate owned - 7,793 13,691 19,135 21,791Total nonperforming assets $297 $20,101 $26,867 $33,688 $69,291
Purchased non-covered:Nonperforming nonaccrual loans $11,901 $2,920 $7,038 $16,170 $29,311Performing nonaccrual loans 97 698 461 7,037 9,852Total nonaccrual loans 11,998 3,618 7,499 23,207 39,163Accruing loans 90 or more days past due - - 4 34 1Total nonperforming loans 11,998 3,618 7,503 23,241 39,164Other real estate owned 1,565 - 3,366 11,632 2,196Total nonperforming assets $13,563 $3,618 $10,869 $34,873 $41,360
Total nonperforming assets $24,480 $35,032 $59,261 $101,023 $143,709
(In thousands)
At December 31,
The Bank’s commercial loan customers are primarily small businesses and professionals. As a result, average loan balances are relatively small, providing risk diversification within the overall loan portfolio. At December 31, 2014, the Bank’s nonaccrualloans reflected this diversification: nonaccrual originated loans with a carrying value totaling $5 million comprised eleven borrowers, and nonaccrual purchased loans with a carrying value totaling $12 million comprised thirteen borrowers.
Management believes the overall credit quality of the loan portfolio is reasonably stable; however, classified and nonperformingassets could fluctuate from period to period. The performance of any individual loan can be affected by external factors such asthe interest rate environment, economic conditions, and collateral values or factors particular to the borrower. No assurance canbe given that additional increases in nonaccrual and delinquent loans will not occur in the future.
Allowance for Credit Losses
The Company’s allowance for credit losses represents Management’s estimate of credit losses inherent in the loan portfolio. In evaluating credit risk for loans, Management measures loss potential of the carrying value of loans. As described above, paymentsreceived on nonaccrual loans may be applied against the principal balance of the loans until such time as full collection of theremaining recorded balance is expected. Further, the carrying value of purchased loans includes fair value discounts assigned at the time of purchase under the provisions of FASB ASC 805, Business Combinations, and FASB ASC 310-30, Loans or Debt Securities with Deteriorated Credit Quality. The allowance for credit losses represents Management’s estimate of credit losses in excess of these reductions to the carrying value of loans within the loan portfolio.

20
14
W
EST
AM
ER
ICA
BA
NC
OR
PO
RA
TIO
N FO
RM
10
-K
20
15
W
EST
AM
ER
ICA
BA
NC
OR
PO
RA
TIO
N P
RO
XY
38
- 38 -
The following table summarizes the allowance for credit losses, chargeoffs and recoveries of the Company for the periods indicated:
For the Years Ended December 31, ($ in thousands) 2014 2013 2012 2011 2010 Analysis of the Allowance for Credit Losses Balance, beginning of period ............................. $34,386 $32,927 $35,290 $38,329 $43,736 Provision for loan losses .................................. 2,800 8,000 11,200 11,200 11,200 Provision for unfunded commitments.............. –– –– –– –– –– Loans charged off:
Commercial ................................................... (1,890) (2,857) (6,851) (8,280) (6,844) Commercial real estate................................... (762) (997) (1,202) (1,332) (1,256) Real estate construction ................................. –– –– (2,217) (2,167) (1,668) Real estate residential .................................... (30) (109) (1,156) (739) (1,686) Consumer and other installment .................... (4,214) (4,097) (5,685) (6,754) (8,814) Purchased covered loans ................................ –– (2,286) (953) (987) –– Purchased non-covered loans......................... (522) (385) (110) –– ––
Total chargeoffs ............................................... (7,418) (10,731) (18,174) (20,259) (20,268) Recoveries of loans previously charged off:
Commercial ................................................... 2,250 1,575 1,317 3,129 948 Commercial real estate................................... 213 191 203 –– 4 Real estate construction ................................. 3 –– 224 1 –– Consumer and other installment .................... 1,869 2,152 2,723 2,890 2,709 Purchased covered loans ................................ –– 272 144 –– –– Purchased non-covered loans......................... 75 –– –– –– ––
Total recoveries ............................................... 4,410 4,190 4,611 6,020 3,661 Net loan losses ................................................. (3,008) (6,541) (13,563) (14,239) (16,607) Balance, end of period ..................................... $34,178 $34,386 $32,927 $35,290 $38,329 Components: Allowance for loan losses .................................. $31,485 $31,693 $30,234 $32,597 $35,636 Liability for off-balance sheet credit exposure .. 2,693 2,693 2,693 2,693 2,693 Allowance for credit losses................................ $34,178 $34,386 $32,927 $35,290 $38,329 Net loan losses: Originated loans............................................... ($2,561) ($4,142) ($12,644) ($13,252) ($16,607) Purchased covered loans .................................. –– (2,014) (809) (987) –– Purchased non-covered loans........................... (447) (385) (110) –– –– Net loan losses as a percentage of average loans....... 0.17% 0.33% 0.59% 0.52% 0.56%
The Company's allowance for credit losses is maintained at a level considered appropriate to provide for losses that can be estimated based upon specific and general conditions. These include conditions unique to individual borrowers, as well as overallcredit loss experience, the amount of past due, nonperforming and classified loans, the amount of non-indemnified purchased loans, recommendations of regulatory authorities, prevailing economic conditions and other factors. A portion of the allowance is individually allocated to impaired loans whose full collectability of principal is uncertain. Such allocations are determined byManagement based on loan-by-loan analyses. The Company evaluates all loans with outstanding principal balances in excess of $500 thousand which are classified or on nonaccrual status and all “troubled debt restructured” loans for impairment. The remainder of the loan portfolio is collectively evaluated for impairment based in part on quantitative analyses of historical credit loss experience of loan portfolio segments to determine standard loss rates for each segment. The loss rate for each loan portfolio segment reflects both the historical loss experience during a look-back period and the loss emergence period. During 2014, the Company refined its processes used to measure look-back periods and loss emergence periods. The loss rates are applied to segmented loan balances to allocate the allowance to the segments of the loan portfolio.
Purchased loans were recorded on the date of purchase at estimated fair value; fair value discounts include a component for estimated credit losses. The Company evaluates all nonaccrual purchased loans with outstanding principal balances in excess of $500 thousand for impairment; the impaired loan value is compared to the recorded investment in the loan, which has been reduced by the credit default discount estimated on the date of purchase. If Management’s impairment analysis determines the impaired loan value is less than the recorded investment in the purchased loan, an allocation of the allowance for credit losses is established for the deficiency. For all other purchased loan portfolio segments, Management applies the standard loss rates to the purchased loan portfolio segments to determine initial allocations of the allowance. Further, liquidating purchased consumer installment loans are evaluated separately by applying historical loss rates to forecasted liquidating principal balances to initially measure losses inherent in this portfolio segment. The initial allocations of the allowance to purchased loan portfolio segments are

20
14
W
EST
AM
ER
ICA
BA
NC
OR
PO
RA
TIO
N F
OR
M 1
0-K
20
15
W
EST
AM
ER
ICA
BA
NC
OR
PO
RA
TIO
N P
RO
XY
39 - 39 -
compared to credit default discounts ascribed to each segment. Management establishes allocations of the allowance for credit losses for any estimated deficiency.
The remainder of the allowance is considered to be unallocated. The unallocated allowance is established to provide for probablelosses that have been incurred as of the reporting date but not reflected in the allocated allowance. The unallocated allowanceaddresses additional qualitative factors consistent with Management's analysis of the level of risks inherent in the loan portfolio, which are related to the risks of the Company's general lending activity. Included in the unallocated allowance is the risk of losses that are attributable to national or local economic or industry trends which have occurred but have not yet been recognized in loan chargeoff history (external factors). The primary external factor evaluated by the Company and the judgmental amount of unallocated reserve assigned by Management as of December 31, 2014 are economic and business conditions $1.7 million. Also included in the unallocated allowance is the risk of losses attributable to general attributes of the Company's loan portfolio and credit administration (internal factors). The internal factors evaluated by the Company and the judgmental amount of unallocatedreserve assigned by Management are: loan review system $1.8 million, adequacy of lending Management and staff $1.7 million, concentrations of credit $3.2 million, and other factors. By their nature, these risks are not readily allocable to any specific loan category in a statistically meaningful manner and are difficult to quantify with a specific number. Management assigns a range ofestimated risk to the qualitative risk factors described above based on Management's judgment as to the level of risk, and assigns a quantitative risk factor from the range of loss estimates to determine the appropriate level of the unallocated portion of theallowance.
The following table presents the allocation of the allowance for credit losses as of December 31 for the years indicated:
At December 31, 2014 2013 2012 2011 2010
($ in thousands)
Allocation of the Allowance Balance
Loans as Percent of Total Loans
Allocation of the Allowance Balance
Loans as Percent
of Total Loans
Allocation of the Allowance Balance
Loans as Percent
of Total Loans
Allocation of the Allowance Balance
Loans as Percent
of Total Loans
Allocation of the Allowance Balance
Loans as Percent
of Total Loans
Originated loans: Commercial .................... $7,868 22% $5,663 18% $8,179 16% $7,672 16% $9,878 16% Commercial real
estate ........................... 4,245 33% 12,070 33% 10,072 30% 10,611 28% 9,607 26% Construction ................... 988 1% 639 –% 484 –% 2,376 –% 3,559 1% Residential real estate..... 2,241 9% 405 10% 380 10% 781 11% 617 10% Consumer installment
& other ........................ 8,154 22% 3,695 22% 3,613 22% 3,270 19% 6,982 16%Purchased covered
loans ............................... – 1% 1,561 14% 1,005 18% – 21% – 24%Purchased non-covered
loans ............................... 2,120 12% – 3% – 4% – 5% – 7%Unallocated portion.......... 8,562 –% 10,353 –% 9,194 –% 10,580 –% 7,686 –%Total.................................. $34,178 100% $34,386 100% $32,927 100% $35,290 100% $38,329 100%
Consumer Purchased PurchasedCommercial Residential Installment Non-covered Covered
Commercial Real Estate Construction Real Estate and Other Loans Loans Unallocated Total
Allowance for loan losses: Balance at beginning of period $4,005 $12,070 $602 $405 $3,198 $- $1,561 $9,852 $31,693 Additions: Provision 1,095 (7,276) 39 1,866 6,864 1,006 - (794) 2,800 Deductions: Chargeoffs (1,890) (762) - (30) (4,214) (522) - - (7,418) Recoveries 2,250 213 3 - 1,869 75 - - 4,410 Net loan recoveries (losses) 360 (549) 3 (30) (2,345) (447) - - (3,008) Indemnification expiration - - - - - 1,561 (1,561) - - Balance at end of period 5,460 4,245 644 2,241 7,717 2,120 - 9,058 31,485Liability for off-balance sheet credit exposure 2,408 - 344 - 437 - - (496) 2,693 Total allowance for credit losses $7,868 $4,245 $988 $2,241 $8,154 $2,120 $- $8,562 $34,178
(In thousands)
Allowance for Credit LossesFor the Year Ended December 31, 2014

20
14
W
EST
AM
ER
ICA
BA
NC
OR
PO
RA
TIO
N FO
RM
10
-K
20
15
W
EST
AM
ER
ICA
BA
NC
OR
PO
RA
TIO
N P
RO
XY
40
- 40 -
CommercialCommercial Real Estate Construction
Residential Real Estate
Consumer Installment and
OtherPurchased Non-covered Loans
Purchased Covered Loans Unallocated Total
Allowance for credit losses:Individually evaluated for impairment $496 $- $- $- $- $- $- $- $496Collectively evaluated for impairment 7,372 4,245 988 2,241 8,154 2,120 - 8,562 33,682Purchased loans with evidence of credit deterioration - - - - - - - - -
Total $7,868 $4,245 $988 $2,241 $8,154 $2,120 $- $8,562 $34,178Carrying value of loans:
Individually evaluated for impairment $11,811 $2,970 $- $574 $599 $12,364 $- $- $28,318Collectively evaluated for impairment 362,194 564,624 11,003 146,351 370,243 196,034 16,851 - 1,667,300 Purchased loans with evidence of credit deterioration - - - - - 4,445 227 - 4,672
Total $374,005 $567,594 $11,003 $146,925 $370,842 $212,843 $17,078 $- $1,700,290
Allowance for Credit Losses and Recorded Investment in Loans Evaluated for ImpairmentAt December 31, 2014
(In thousands)
Management considers the $34.2 million allowance for credit losses to be adequate as a reserve against credit losses inherent inthe loan portfolio as of December 31, 2014.
See Note 3 to the consolidated financial statements for additional information related to the loan portfolio, loan portfolio creditrisk, and allowance for credit losses.
Asset/Liability and Market Risk Management
Asset/liability management involves the evaluation, monitoring and management of interest rate risk, market risk, liquidity andfunding. The fundamental objective of the Company's management of assets and liabilities is to maximize its economic value while maintaining adequate liquidity and a conservative level of interest rate risk.
Interest Rate Risk
Interest rate risk is a significant market risk affecting the Company. Many factors affect the Company’s exposure to interest rates,such as general economic and financial conditions, customer preferences, historical pricing relationships, and re-pricing characteristics of financial instruments. Assets and liabilities may mature or re-price at different times. Assets and liabilities may re-price at the same time but by different amounts. Short-term and long-term market interest rates may change by different amounts. The timing and amount of cash flows of various assets or liabilities may shorten or lengthen as interest rates change. In addition, the changing levels of interest rates may have an impact on loan demand, demand for various deposit products, credit losses, and other elements of earnings such as account analysis fees on commercial deposit accounts and correspondent bank service charges.
The Company’s earnings are affected not only by general economic conditions, but also by the monetary and fiscal policies of theU.S. and its agencies, particularly the Federal Reserve Board (the “FRB”). The monetary policies of the FRB can influence the overall growth of loans, investment securities, and deposits and the level of interest rates earned on assets and paid for liabilities. The nature and impact of future changes in monetary policies are generally not predictable.
The Federal Open Market Committee’s January 28, 2015 press release stated “To support continued progress toward maximum employment and price stability, the Committee today reaffirmed its view that the current 0 to 1/4 percent target range for the federal funds rate remains appropriate. In determining how long to maintain this target range, the Committee will assess progress --both realized and expected--toward its objectives of maximum employment and 2 percent inflation. This assessment will take into account a wide range of information, including measures of labor market conditions, indicators of inflation pressures and inflation expectations, and readings on financial and international developments. Based on its current assessment, the Committeejudges that it can be patient in beginning to normalize the stance of monetary policy” In this context, Management’s most likelyearnings forecast for the twelve months ending December 31, 2015 assumes market interest rates remain relatively stable and yields on newly originated or refinanced loans and on purchased investment securities will reflect current interest rates, which are generally lower than yields on the Company’s older dated loans and investment securities.
In adjusting the Company's asset/liability position, Management attempts to manage interest rate risk while enhancing the net interest margin and net interest income. At times, depending on expected increases or decreases in general interest rates, the relationship between long and short term interest rates, market conditions and competitive factors, Management may adjust the Company's interest rate risk position in order to manage its net interest margin and net interest income. The Company's results of

20
14
W
EST
AM
ER
ICA
BA
NC
OR
PO
RA
TIO
N F
OR
M 1
0-K
20
15
W
EST
AM
ER
ICA
BA
NC
OR
PO
RA
TIO
N P
RO
XY
41 - 41 -
operations and net portfolio values remain subject to changes in interest rates and to fluctuations in the difference between long and short term interest rates.
The Company’s asset and liability position was slightly “asset sensitive” at December 31, 2014, depending on the interest rate assumptions applied to the simulation model employed by Management to measure interest rate risk. An “asset sensitive” positionresults in a slightly larger change in interest income than in interest expense resulting from application of assumed interest ratechanges. Simulation estimates depend on, and will change with, the size and mix of the actual and projected balance sheet at thetime of each simulation. Management’s interest rate risk management is currently biased toward stable interest rates in the near-term, and ultimately, rising interest rates. Management continues to monitor the interest rate environment as well as economic conditions and other factors it deems relevant in managing the Company's exposure to interest rate risk.
The Company does not currently engage in trading activities or use derivative instruments to control interest rate risk, even though such activities may be permitted with the approval of the Company's Board of Directors.
Market Risk - Equity Markets
Equity price risk can affect the Company. As an example, any preferred or common stock holdings, as permitted by banking regulations, can fluctuate in value. Management regularly assesses the extent and duration of any declines in market value, thecauses of such declines, the likelihood of a recovery in market value, and its intent to hold securities until a recovery in value occurs. Declines in value of preferred or common stock holdings that are deemed “other than temporary” could result in loss recognition in the Company's income statement.
Fluctuations in the Company's common stock price can impact the Company's financial results in several ways. First, the Company has regularly repurchased and retired its common stock; the market price paid to retire the Company's common stock can affect the level of the Company's shareholders' equity, cash flows and shares outstanding. Second, the Company's common stock price impacts the number of dilutive equivalent shares used to compute diluted earnings per share. Third, fluctuations in the Company's common stock price can motivate holders of options to purchase Company common stock through the exercise of such options thereby increasing the number of shares outstanding. Finally, the amount of compensation expense associated with share based compensation fluctuates with changes in and the volatility of the Company's common stock price.
Market Risk - Other
Market values of loan collateral can directly impact the level of loan charge-offs and the provision for loan losses. The financialcondition and liquidity of debtors issuing bonds and debtors whose mortgages or other obligations are securitized can directly impact the credit quality of the Company’s investment portfolio requiring the Company to recognize other than temporary impairment charges. Other types of market risk, such as foreign currency exchange risk and commodity price risk, are not significant in the normal course of the Company's business activities.
Liquidity and Funding
The objective of liquidity management is to manage cash flow and liquidity reserves so that they are adequate to fund the Company's operations and meet obligations and other commitments on a timely basis and at a reasonable cost. The Company achieves this objective through the selection of asset and liability maturity mixes that it believes best meet its needs. The Company's liquidity position is enhanced by its ability to raise additional funds as needed in the wholesale markets.
In recent years, the Company's deposit base has provided the majority of the Company's funding requirements. This relatively stable and low-cost source of funds, along with shareholders' equity, provided 97 percent of funding for average total assets in2014 and 2013. The stability of the Company’s funding from customer deposits is in part reliant on the confidence clients have in the Company. The Company places a very high priority in maintaining this confidence through conservative credit and capital management practices and by maintaining an appropriate level of liquidity reserves.
During 2014 and 2013, non-deposit funding has continued to be provided by short-term borrowings, a term repurchase agreement until repayment in August 2014, and Federal Home Loan Bank advances, and additionally, long-term debt until repayment in October 2013. These non-deposit sources of funds comprise a modest portion of total funding.
Liquidity is further provided by assets such as balances held at the Federal Reserve Bank, investment securities, and amortizingloans. The Company's investment securities portfolio provides a substantial secondary liquidity reserve. The Company held $2.6 billion in total investment securities at December 31, 2014. Under certain deposit, borrowing and other arrangements, the

20
14
W
EST
AM
ER
ICA
BA
NC
OR
PO
RA
TIO
N FO
RM
10
-K
20
15
W
EST
AM
ER
ICA
BA
NC
OR
PO
RA
TIO
N P
RO
XY
42
- 42 -
Company must hold and pledge investment securities as collateral. At December 31, 2014, such collateral requirements totaled approximately $758 million.
Liquidity risk can result from the mismatching of asset and liability cash flows, or from disruptions in the financial markets. The Company performs liquidity stress tests on a periodic basis to evaluate the sustainability of its liquidity. Under the stress testing, the Company assumes outflows of funds increase beyond expected levels. Measurement of such heightened outflows considers the composition of the Company’s deposit base, including any concentration of deposits, non-deposit funding such as short-term borrowings and Federal Home Loan Bank advances, and unfunded lending commitments. The Company evaluates its stock of highly liquid assets to meet the assumed higher levels of outflows. Highly liquid assets include cash and amounts due from otherbanks from daily transaction settlements, reduced by branch cash needs and Federal Reserve Bank reserve requirements, and investment securities based on regulatory risk-weighting guidelines. Based on the results of the most recent liquidity stress test,Management is satisfied with the liquidity condition of the Bank and the Company. However, no assurance can be given the Bank or Company will not experience a period of reduced liquidity.
Management will monitor the Company’s cash levels throughout 2015. Loan demand from credit-worthy borrowers will be dictated by economic and competitive conditions. The Company aggressively solicits non-interest bearing demand deposits and money market checking deposits, which are the least sensitive to changes in interest rates. The growth of these deposit balances is subject to heightened competition, the success of the Company's sales efforts, delivery of superior customer service, new regulations and market conditions. The Company does not aggressively solicit higher-costing time deposits; as a result, Management anticipates such deposits will decline. Changes in interest rates, most notably rising interest rates, could impact deposit volumes. Depending on economic conditions, interest rate levels, and a variety of other conditions, deposit growth may beused to fund loans, reduce borrowings or purchase investment securities. However, due to possible concerns such as uncertainty in the general economic environment, competition and political uncertainty, loan demand and levels of customer deposits are notcertain. Shareholder dividends are expected to continue subject to the Board's discretion and continuing evaluation of capital levels, earnings, asset quality and other factors.
Westamerica Bancorporation ("Parent Company") is a separate entity apart from Westamerica Bank (“Bank”) and must provide for its own liquidity. In addition to its operating expenses, the Parent Company is responsible for the payment of dividends declared for its shareholders, and interest and principal on any outstanding debt. Substantially all of the Parent Company's revenues are obtained from subsidiary dividends and service fees. The Bank’s dividends paid to the Parent Company and proceeds from the exercise of stock options provided adequate cash flow for the Parent Company in 2014 and 2013 to pay shareholder dividends of $40 million each in respective periods, and retire common stock in the amount of $53 million and $57 million, respectively. Payment of dividends to the Parent Company by the Bank is limited under California and Federal laws. TheCompany believes these regulatory dividend restrictions will not have an impact on the Parent Company's ability to meet its ongoing cash obligations.
Contractual Obligations
The following table sets forth the known contractual obligations, except short-term borrowing arrangements and post-retirement benefit plans, of the Company:
At December 31, 2014 (In thousands)
Within One Year
Over One to Three Years
Over Three to Five Years
After Five Years Total
Federal Home Loan Bank advances ................................................... $20,015 $–– $–– $–– $20,015Operating Lease Obligations .............................................................. 7,691 7,875 4,000 363 19,929
8,230 8,230 –– –– 16,460Purchase Obligations ..........................................................................Total................................................................................................ $35,936 $16,105 $4,000 $363 $56,404
Federal Home Loan Bank advances and operating lease obligations may be retired prior to the contractual maturity as discussed inthe notes to the consolidated financial statements. The purchase obligation consists of the Company’s minimum liabilities undercontracts with third-party automation services providers.
Capital Resources
The Company has historically generated high levels of earnings, which provides a means of raising capital. The Company's net income as a percentage of average shareholders' equity (“return on equity” or “ROE”) has been 11.6% in 2014, 12.5% in 2013 and 14.9% in 2012. The Company also raises capital as employees exercise stock options. Capital raised through the exercise of stock options totaled $12.4 million in 2014, $21.5 million in 2013 and $7.6 million in 2012.

20
14
W
EST
AM
ER
ICA
BA
NC
OR
PO
RA
TIO
N F
OR
M 1
0-K
20
15
W
EST
AM
ER
ICA
BA
NC
OR
PO
RA
TIO
N P
RO
XY
43 - 43 -
The Company paid common dividends totaling $39.8 million in 2014, $40.1 million in 2013 and $41.0 million in 2012, which represent dividends per common share of $1.52, $1.49 and $1.48, respectively. The Company's earnings have historically exceeded dividends paid to shareholders. The amount of earnings in excess of dividends provides the Company resources to finance growth and maintain appropriate levels of shareholders' equity. In the absence of profitable growth opportunities, the Company has repurchased and retired its common stock as another means to return earnings to shareholders. The Company repurchased and retired 1.0 million shares valued at $52.7 million in 2014, 1.2 million shares valued at $57.3 million in 2013 and 1.1 million shares valued at $51.5 million in 2012.
The Company's primary capital resource is shareholders' equity, which was $526.6 million at December 31, 2014 compared with $542.9 million at December 31, 2013. The Company's ratio of equity to total assets was 10.46% at December 31, 2014 and 11.20% at December 31, 2013.
The Company performs capital stress tests on a periodic basis to evaluate the sustainability of its capital. Under the stress testing, the Company assumes various scenarios such as deteriorating economic and operating conditions, unanticipated asset devaluations, and significant operational lapses. The Company measures the impact of these scenarios on its earnings and capital.Based on the results of the most recent stress tests, Management is satisfied with the capital condition of the Bank and the Company. However, no assurance can be given the Bank or Company will not experience a period of reduced earnings or a reduction in capital from unanticipated events and circumstances.
Capital to Risk-Adjusted Assets
The following summarizes the ratios of regulatory capital to risk-adjusted assets for the Company on the dates indicated:
At December 31, 2014 2013
Minimum Regulatory Requirement
Well Capitalized
Tier I Capital ........................................................................... 13.30% 14.71% 4.00% 6.00% Total Capital............................................................................ 14.54% 16.18% 8.00% 10.00% Leverage ratio ......................................................................... 7.95% 8.55% 4.00% 5.00%
The following summarizes the ratios of capital to risk-adjusted assets for the Bank on the dates indicated:
At December 31, 2014 2013
Minimum Regulatory Requirement
Well Capitalized
Tier I Capital ........................................................................... 12.04% 13.26% 4.00% 6.00% Total Capital............................................................................ 13.49% 14.93% 8.00% 10.00% Leverage ratio ......................................................................... 7.16% 7.67% 4.00% 5.00%
FDIC-indemnified assets are generally 20% risk-weighted. The FDIC indemnification expires on February 6, 2019 as to single-family residential real estate indemnified assets and expired on February 6, 2014 as to non-single-family residential real estateindemnified assets. Subsequent to such dates, previously FDIC-indemnified assets will generally be included in the 100% risk-weight category. The expiration of FDIC indemnification related to non-single-family residential real estate assets on February 6, 2014 caused an increase in risk-weighted assets, and a corresponding decline in the Tier 1 and Total Capital ratios.
On July 2, 2013, the Federal Reserve Board approved a final rule that implements changes to the regulatory capital framework forall banking organizations. The rule’s provisions which would most affect the regulatory capital requirements of the Company andthe Bank:
• Introduce a new “Common Equity Tier 1” capital measurement, • Establish higher minimum levels of capital, • Introduce a “capital conservation buffer,” • Increase the risk-weighting of certain assets, and • Establish limits on the amount of deferred tax assets with any excess treated as a deduction from Tier 1 capital.
Under the final rule, a banking organization that is not subject to the “advanced approaches rule” may make a one-time electionnot to include most elements of Accumulated Other Comprehensive Income, including net-of-tax unrealized gains and losses on

20
14
W
EST
AM
ER
ICA
BA
NC
OR
PO
RA
TIO
N FO
RM
10
-K
20
15
W
EST
AM
ER
ICA
BA
NC
OR
PO
RA
TIO
N P
RO
XY
44
- 44 -
available for sale investment securities, in regulatory capital. Neither the Company nor the Bank are subject to the “advanced approaches rule” and intend to make the election not to include most elements of Accumulated Other Comprehensive Income in regulatory capital.
Generally, banking organizations that are not subject to the “advanced approaches rule” must begin complying with the final ruleon January 1, 2015; on such date, the Company and the Bank become subject to the revised definitions of regulatory capital, thenew minimum regulatory capital ratios, and various regulatory capital adjustments and deductions according to transition provisions and timelines. All banking organizations must begin calculating standardized total risk-weighted assets on January 1,2015. The transition period for the capital conservation buffer for all banking organizations will begin on January 1, 2016 and end January 1, 2019. Any bank subject to the rule which is unable to maintain its “capital conservation buffer” will be restricted in the payment of discretionary executive compensation and shareholder distributions, such as dividends and share repurchases.
The final rule does not supersede provisions of the Federal Deposit Insurance Corporation Improvement Act (FDICIA) requiring federal banking agencies to take prompt corrective action (PCA) to resolve problems of insured depository institutions. The finalrule revises the PCA thresholds to incorporate the higher minimum levels of capital, including the newly proposed “common equity tier 1” ratio.
Management has evaluated the capital structure and assets for the Company and the Bank as of December 31, 2014 assuming the Federal Reserve’s final rule was currently fully phased-in. Based on this evaluation, the Company and the Bank currently maintain capital in excess of all the final rule regulatory ratios.
The Company and the Bank intend to maintain regulatory capital in excess of the highest regulatory standard. The Company and the Bank routinely project capital levels by analyzing forecasted earnings, credit quality, securities valuations, shareholder dividends, asset volumes, share repurchase activity, stock option exercise proceeds, and other factors. Based on current capitalprojections, the Company and the Bank expect to maintain regulatory capital levels exceeding the highest effective regulatory standard and pay quarterly dividends to shareholders. No assurance can be given that changes in capital management plans will not occur.
[The remainder of this page intentionally left blank]

20
14
W
EST
AM
ER
ICA
BA
NC
OR
PO
RA
TIO
N F
OR
M 1
0-K
20
15
W
EST
AM
ER
ICA
BA
NC
OR
PO
RA
TIO
N P
RO
XY
45 - 45 -
Deposit Categories
The Company primarily attracts deposits from local businesses and professionals, as well as through retail savings and checkingaccounts, and, to a more limited extent, certificates of deposit.
The following table summarizes the Company’s average daily amount of deposits and the rates paid for the periods indicated:
Deposit Distribution and Average Rates Paid
2014 2013 2012 For the Years Ended December 31, ($ in thousands) Average
Balance
Percentageof Total
Deposits RateAverageBalance
Percentageof Total
Deposits RateAverageBalance
Percentageof Total
Deposits RateNoninterest bearing
demand........................ $1,841,522 43.0% —% $1,683,447 40.4% —% $1,603,981 38.0% —%Interest bearing:
Transaction ................ 790,467 18.5% 0.03% 758,771 18.2% 0.03% 754,979 17.9% 0.04%Savings ...................... 1,215,035 28.4% 0.07% 1,151,360 27.7% 0.08% 1,132,980 26.9% 0.08%Time less than $100
thousand................... 197,821 4.6% 0.41% 228,061 5.5% 0.47% 264,466 6.3% 0.57%Time $100 thousand
or more .................... 237,002 5.5% 0.38% 341,184 8.2% 0.32% 460,833 10.9% 0.33%Total* ............................ $4,281,847 100.0% 0.07% $4,162,823 100.0% 0.08% $4,217,239 100.0% 0.10%
* The rates for total deposits reflect value of noninterest bearing deposits.
The Company’s strategy includes building the value of its deposit base by building balances of lower-costing deposits and avoiding reliance on higher-costing time deposits. From 2012 to 2014 the deposit composition shifted from higher costing time deposits to lower costing checking and savings accounts. The Company’s average balances of checking and savings accounts represented 90% of average balances of total deposits in 2014 compared with 86% in 2013 and 83% in 2012.
Total time deposits were $385.1 million and $492.8 million at December 31, 2014 and 2013, respectively. The following table sets forth, by time remaining to maturity, the Company’s total domestic time deposits. The Company has no foreign time deposits.
Time Deposits Maturity Distribution
The following sets forth, by time remaining to maturity, the Company’s domestic time deposits in amounts of $100 thousand or more:
Time Deposits Over $100,000 Maturity Distribution
(In thousands) At December 31, 2014
2015 ........................................................................................... $301,209 2016 ........................................................................................... 39,530 2017 ........................................................................................... 18,571 2018 ........................................................................................... 12,715 2019 ........................................................................................... 10,843 Thereafter .................................................................................. 2,275 Total........................................................................................... $385,143
(In thousands) At December 31, 2014
Three months or less.................................................................. $106,807 Over three through six months .................................................. 29,713 Over six through twelve months................................................ 35,545 Over twelve months................................................................... 43,119 Total........................................................................................... $215,184

20
14
W
EST
AM
ER
ICA
BA
NC
OR
PO
RA
TIO
N FO
RM
10
-K
20
15
W
EST
AM
ER
ICA
BA
NC
OR
PO
RA
TIO
N P
RO
XY
46
- 46 -
Short-term Borrowings
The following table sets forth the short-term borrowings of the Company:
Short-Term Borrowings Distribution
At December 31, (In thousands) 2014 2013 2012 Securities sold under agreements to repurchase the securities.................................. $89,784 $62,668 $53,687 Total short term borrowings ..................................................................................... $89,784 $62,668 $53,687
Further detail of federal funds purchased and other borrowed funds is as follows:
For the Years Ended December 31, ($ in thousands) 2014 2013 2012 Federal funds purchased balances and rates paid on outstanding amount:
Average balance for the year............................................................................... $8 $8 $8 Maximum month-end balance during the year.................................................... — — — Average interest rate for the year ........................................................................ 0.48% 0.60% 0.58%Average interest rate at period end...................................................................... —% —% —%
Securities sold under agreements to repurchase the securities balances and rates paid on outstanding amount: Average balance for the year............................................................................... $70,244 $57,446 $81,315 Maximum month-end balance during the year.................................................... 89,784 66,640 116,974 Average interest rate for the year ........................................................................ 0.07% 0.07% 0.07%Average interest rate at period end...................................................................... 0.06% 0.07% 0.07%
FHLB advances balances and rates paid on outstanding amount: Average balance for the year .............................................................................. $20,308 $25,499 $25,916 Maximum month-end balance during the year ................................................... 20,530 25,780 26,004 Average interest rate for the year ....................................................................... 2.00% 1.88% 1.86% Average interest rate at period end ..................................................................... 2.04% 1.96% 1.88%Term repurchase agreement balances and rates paid on outstanding amount:
Average balance for the year............................................................................... $6,082 $10,000 $10,000 Maximum month-end balance during the year.................................................... 10,000 10,000 10,000 Average interest rate for the year ........................................................................ 0.99% 0.98% 0.99%Average interest rate at period end...................................................................... —% 0.97% 0.97%
Financial Ratios
The following table shows key financial ratios for the periods indicated:
At and for the Years Ended December 31, 2014 2013 2012 Return on average total assets ..................................................... 1.22% 1.38% 1.64%Return on average common shareholders’ equity........................ 11.57% 12.48% 14.93%Average shareholders’ equity as a percentage of:
Average total assets ................................................................. 10.58% 11.06% 10.97%Average total loans .................................................................. 29.57% 27.53% 23.47%Average total deposits.............................................................. 12.24% 12.93% 12.88%
Common dividend payout ratio ................................................... 66% 60% 51%
20
14
W
EST
AM
ER
ICA
BA
NC
OR
PO
RA
TIO
N F
OR
M 1
0-K
20
15
W
EST
AM
ER
ICA
BA
NC
OR
PO
RA
TIO
N P
RO
XY
47 - 47 -
ITEM 7A. QUANTITATIVE AND QUALITATIVE DISCLOSURES ABOUT MARKET RISK
The Company does not currently engage in trading activities or use derivative instruments to control interest rate risk, even though such activities may be permitted with the approval of the Company’s Board of Directors.
Credit risk and interest rate risk are the most significant market risks affecting the Company, and equity price risk can also affect the Company’s financial results. These risks are described in the preceding sections regarding “Loan Portfolio Credit Risk,” and“Asset/Liability and Market Risk Management.” Other types of market risk, such as foreign currency exchange risk and commodity price risk, are not significant in the normal course of the Company’s business activities.
ITEM 8. FINANCIAL STATEMENTS AND SUPPLEMENTARY DATA
INDEX TO FINANCIAL STATEMENTS
Page
Management’s Internal Control Over Financial Reporting...................................................................................... 48
Report of Independent Registered Public Accounting Firm (on Internal Control over Financial Reporting) ......... 49
Consolidated Balance Sheets as of December 31, 2014 and 2013........................................................................... 50
Consolidated Statements of Income for the years ended December 31, 2014, 2013 and 2012................................ 51
Consolidated Statements of Comprehensive Income for the years ended December 31, 2014, 2013 and 2012...... 52
Consolidated Statements of Changes in Shareholders’ Equity for the years ended December 31, 2014, 2013 and 2012................................................................................................................................................................. 53
Consolidated Statements of Cash Flows for the years ended December 31, 2014, 2013 and 2012......................... 54
Notes to the Consolidated Financial Statements...................................................................................................... 55
Report of Independent Registered Public Accounting Firm (on Consolidated Financial Statements) .................... 89

20
14
W
EST
AM
ER
ICA
BA
NC
OR
PO
RA
TIO
N FO
RM
10
-K
20
15
W
EST
AM
ER
ICA
BA
NC
OR
PO
RA
TIO
N P
RO
XY
48
- 48 -
MANAGEMENT’S REPORT ON INTERNAL CONTROL OVER FINANCIAL REPORTING
Management of Westamerica Bancorporation and subsidiaries (the “Company”) is responsible for establishing and maintaining adequate internal control over financial reporting, and for performing an assessment of the effectiveness of internal control over financial reporting as of December 31, 2014. Internal control over financial reporting is a process designed to provide reasonable assurance regarding the reliability of financial reporting and the preparation of financial statements for external purposes inaccordance with generally accepted accounting principles. The Company’s system of internal control over financial reporting includes those policies and procedures that (i) pertain to the maintenance of records that, in reasonable detail, accurately and fairly reflect the transactions and dispositions of the assets of the Company; (ii) provide reasonable assurance that transactions arerecorded as necessary to permit preparation of financial statements in accordance with generally accepted accounting principles,and that receipts and expenditures of the Company are being made only in accordance with authorizations of Management and Directors of the Company; and (iii) provide reasonable assurance regarding prevention or timely detection of unauthorized acquisition, use or disposition of the Company’s assets that could have a material effect on the financial statements.
Management performed an assessment of the effectiveness of the Company’s internal control over financial reporting as of December 31, 2014 based upon criteria in Internal Control — Integrated Framework (1992) issued by the Committee of Sponsoring Organizations of the Treadway Commission (“COSO”). Based on this assessment, Management determined that the Company’s internal control over financial reporting was effective as of December 31, 2014 based on the criteria in Internal Control - Integrated Framework (1992) issued by COSO.
The Company’s independent registered public accounting firm has issued an attestation report on Management’s assessment of the Company’s internal control over financial reporting. This report is included below.
Dated: February 27, 2015

20
14
W
EST
AM
ER
ICA
BA
NC
OR
PO
RA
TIO
N F
OR
M 1
0-K
20
15
W
EST
AM
ER
ICA
BA
NC
OR
PO
RA
TIO
N P
RO
XY
49 - 49 -
REPORT OF INDEPENDENT REGISTERED PUBLIC ACCOUNTING FIRM
The Board of Directors and Stockholders Westamerica Bancorporation:
We have audited Westamerica Bancorporation and subsidiaries (the Company) internal control over financial reporting as of December 31, 2014, based on criteria established in Internal Control – Integrated Framework (1992) issued by the Committee of Sponsoring Organizations of the Treadway Commission (COSO). The Company’s management is responsible for maintaining effective internal control over financial reporting and for its assessment of the effectiveness of internal control over financialreporting, included in the accompanying Management’s Report on Internal Control over Financial Reporting. Our responsibility isto express an opinion on the Company’s internal control over financial reporting based on our audit.
We conducted our audit in accordance with the standards of the Public Company Accounting Oversight Board (United States). Those standards require that we plan and perform the audit to obtain reasonable assurance about whether effective internal control over financial reporting was maintained in all material respects. Our audit included obtaining an understanding of internal control over financial reporting, assessing the risk that a material weakness exists, and testing and evaluating the design and operating effectiveness of internal control based on the assessed risk. Our audit also included performing such other procedures as we considered necessary in the circumstances. We believe that our audit provides a reasonable basis for our opinion.
A company’s internal control over financial reporting is a process designed to provide reasonable assurance regarding the reliability of financial reporting and the preparation of financial statements for external purposes in accordance with generallyaccepted accounting principles. A company’s internal control over financial reporting includes those policies and procedures that(1) pertain to the maintenance of records that, in reasonable detail, accurately and fairly reflect the transactions and dispositions of the assets of the company; (2) provide reasonable assurance that transactions are recorded as necessary to permit preparation offinancial statements in accordance with generally accepted accounting principles, and that receipts and expenditures of the company are being made only in accordance with authorizations of management and directors of the company; and (3) provide reasonable assurance regarding prevention or timely detection of unauthorized acquisition, use, or disposition of the company’sassets that could have a material effect on the financial statements.
Because of its inherent limitations, internal control over financial reporting may not prevent or detect misstatements. Also, projections of any evaluation of effectiveness to future periods are subject to the risk that controls may become inadequate because of changes in conditions, or that the degree of compliance with the policies or procedures may deteriorate.
In our opinion, the Company maintained, in all material respects, effective internal control over financial reporting as of December 31, 2014, based on criteria established in Internal Control – Integrated Framework (1992) issued by the Committee of Sponsoring Organizations of the Treadway Commission.
We also have audited, in accordance with the standards of the Public Company Accounting Oversight Board (United States), the consolidated balance sheets of the Company as of December 31, 2014 and 2013, and the related consolidated statements of income, comprehensive income, changes in shareholders’ equity, and cash flows for each of the years in the three-year period ended December 31, 2014, and our report dated February 27, 2015 expressed an unqualified opinion on those consolidated financial statements.
/s/ KPMG LLP KPMG LLP
San Francisco, California February 27, 2015
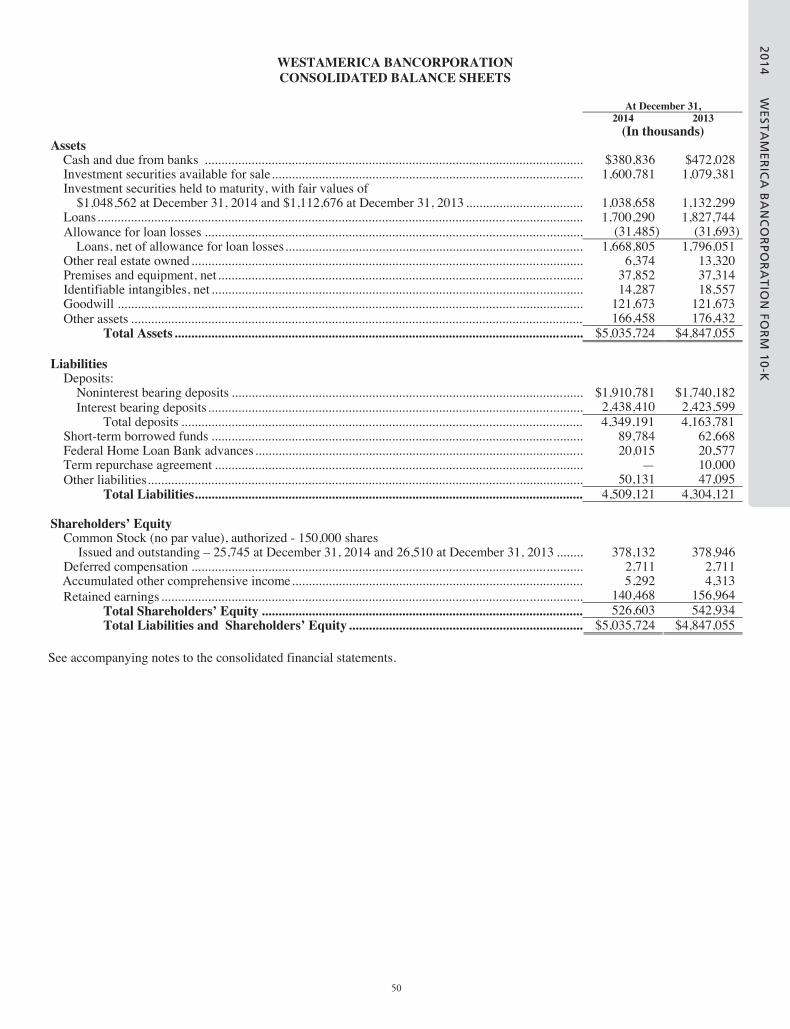
20
14
W
EST
AM
ER
ICA
BA
NC
OR
PO
RA
TIO
N FO
RM
10
-K
20
15
W
EST
AM
ER
ICA
BA
NC
OR
PO
RA
TIO
N P
RO
XY
50
- 50 -
WESTAMERICA BANCORPORATION CONSOLIDATED BALANCE SHEETS
At December 31, 2014 2013
(In thousands) Assets
Cash and due from banks ................................................................................................................. $380,836 $472,028 Investment securities available for sale............................................................................................. 1,600,781 1,079,381 Investment securities held to maturity, with fair values of
$1,048,562 at December 31, 2014 and $1,112,676 at December 31, 2013 ................................... 1,038,658 1,132,299Loans................................................................................................................................................. 1,700,290 1,827,744
(31,485) (31,693)Allowance for loan losses .................................................................................................................Loans, net of allowance for loan losses......................................................................................... 1,668,805 1,796,051
Other real estate owned..................................................................................................................... 6,374 13,320 Premises and equipment, net............................................................................................................. 37,852 37,314 Identifiable intangibles, net ............................................................................................................... 14,287 18,557 Goodwill ........................................................................................................................................... 121,673 121,673
166,458 176,432 Other assets .......................................................................................................................................Total Assets .......................................................................................................................... $5,035,724 $4,847,055
Liabilities Deposits:
Noninterest bearing deposits ......................................................................................................... $1,910,781 $1,740,182 2,438,410 2,423,599 Interest bearing deposits................................................................................................................
Total deposits ........................................................................................................................ 4,349,191 4,163,781 Short-term borrowed funds ............................................................................................................... 89,784 62,668 Federal Home Loan Bank advances.................................................................................................. 20,015 20,577 Term repurchase agreement .............................................................................................................. — 10,000
50,131 47,095 Other liabilities..................................................................................................................................Total Liabilities.................................................................................................................... 4,509,121 4,304,121
Shareholders’ EquityCommon Stock (no par value), authorized - 150,000 shares
Issued and outstanding – 25,745 at December 31, 2014 and 26,510 at December 31, 2013 ........ 378,132 378,946 Deferred compensation ..................................................................................................................... 2,711 2,711 Accumulated other comprehensive income....................................................................................... 5,292 4,313
140,468 156,964 526,603 542,934
Retained earnings ..............................................................................................................................Total Shareholders’ Equity ................................................................................................Total Liabilities and Shareholders’ Equity ...................................................................... $5,035,724 $4,847,055
See accompanying notes to the consolidated financial statements.
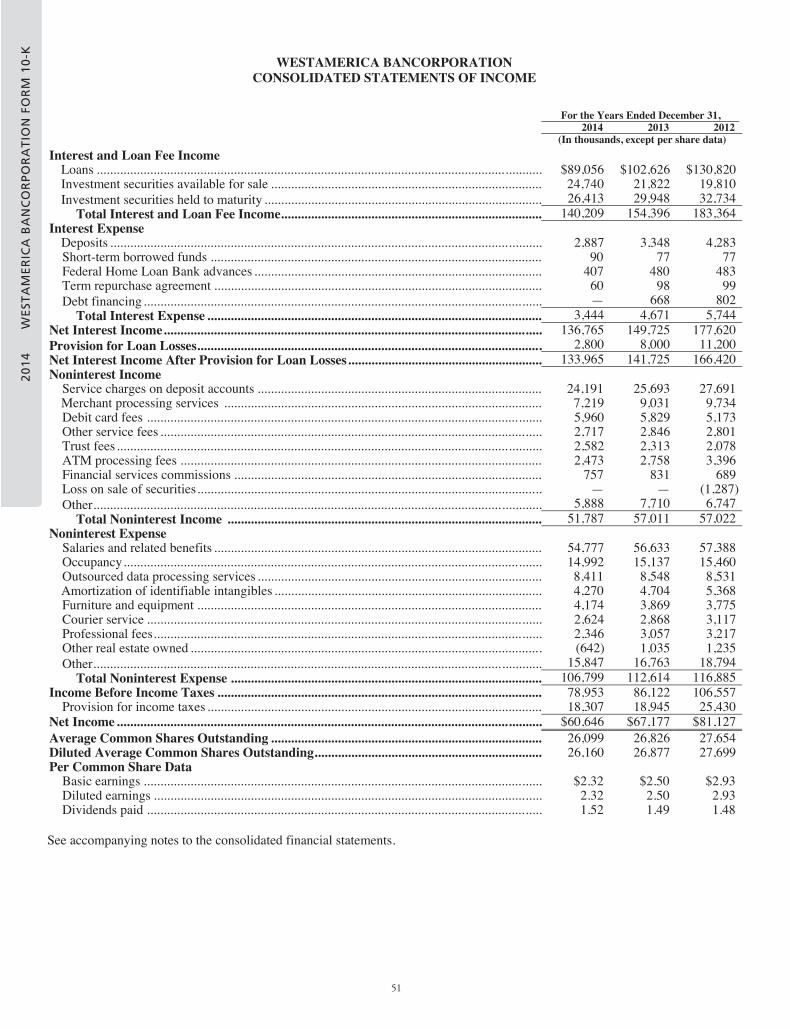
20
14
W
EST
AM
ER
ICA
BA
NC
OR
PO
RA
TIO
N F
OR
M 1
0-K
20
15
W
EST
AM
ER
ICA
BA
NC
OR
PO
RA
TIO
N P
RO
XY
51 - 51 -
WESTAMERICA BANCORPORATION CONSOLIDATED STATEMENTS OF INCOME
For the Years Ended December 31, 2014 2013 2012
(In thousands, except per share data) Interest and Loan Fee Income
Loans ..................................................................................................................................... $89,056 $102,626 $130,820 Investment securities available for sale ................................................................................. 24,740 21,822 19,810
26,413 29,948 32,734 140,209 154,396 183,364
Investment securities held to maturity ...................................................................................Total Interest and Loan Fee Income..............................................................................
Interest Expense Deposits ................................................................................................................................. 2,887 3,348 4,283 Short-term borrowed funds ................................................................................................... 90 77 77 Federal Home Loan Bank advances ...................................................................................... 407 480 483 Term repurchase agreement .................................................................................................. 60 98 99
— 668 802 3,444 4,671 5,744
Debt financing.......................................................................................................................Total Interest Expense ....................................................................................................
Net Interest Income................................................................................................................. 136,765 149,725 177,620 2,800 8,000 11,200 133,965 141,725 166,420
Provision for Loan Losses.......................................................................................................Net Interest Income After Provision for Loan Losses..........................................................Noninterest Income
Service charges on deposit accounts ..................................................................................... 24,191 25,693 27,691 Merchant processing services ............................................................................................... 7,219 9,031 9,734 Debit card fees ...................................................................................................................... 5,960 5,829 5,173 Other service fees .................................................................................................................. 2,717 2,846 2,801 Trust fees............................................................................................................................... 2,582 2,313 2,078 ATM processing fees ............................................................................................................ 2,473 2,758 3,396 Financial services commissions ............................................................................................ 757 831 689 Loss on sale of securities....................................................................................................... — — (1,287)
5,888 7,710 6,747 51,787 57,011 57,022
Other......................................................................................................................................Total Noninterest Income ..............................................................................................
Noninterest Expense Salaries and related benefits .................................................................................................. 54,777 56,633 57,388 Occupancy............................................................................................................................. 14,992 15,137 15,460 Outsourced data processing services ..................................................................................... 8,411 8,548 8,531 Amortization of identifiable intangibles ................................................................................ 4,270 4,704 5,368 Furniture and equipment ....................................................................................................... 4,174 3,869 3,775 Courier service ...................................................................................................................... 2,624 2,868 3,117 Professional fees.................................................................................................................... 2,346 3,057 3,217 Other real estate owned ......................................................................................................... (642) 1,035 1,235
15,847 16,763 18,794 106,799 112,614 116,885
Other......................................................................................................................................Total Noninterest Expense .............................................................................................
Income Before Income Taxes ................................................................................................. 78,953 86,122 106,557Provision for income taxes .................................................................................................... 18,307 18,945 25,430
Net Income............................................................................................................................... $60,646 $67,177 $81,127 Average Common Shares Outstanding ................................................................................. 26,099 26,826 27,654 Diluted Average Common Shares Outstanding.................................................................... 26,160 26,877 27,699 Per Common Share Data
Basic earnings ....................................................................................................................... $2.32 $2.50 $2.93 Diluted earnings .................................................................................................................... 2.32 2.50 2.93 Dividends paid ...................................................................................................................... 1.52 1.49 1.48
See accompanying notes to the consolidated financial statements.

20
14
W
EST
AM
ER
ICA
BA
NC
OR
PO
RA
TIO
N FO
RM
10
-K
20
15
W
EST
AM
ER
ICA
BA
NC
OR
PO
RA
TIO
N P
RO
XY
52
- 52 -
WESTAMERICA BANCORPORATION CONSOLIDATED STATEMENTS OF COMPREHENSIVE INCOME
For the Years Ended December 31, 2014 2013 2012
(In thousands)
Net income................................................................................................................................. $60,646 $67,177 $81,127Other comprehensive income (loss):
Increase (decrease) in net unrealized gains on securities available for sale ........................... 1,627 (17,855) 5,557Deferred tax (expense) benefit ............................................................................................... (684) 7,507 (2,337)
Increase (decrease) in net unrealized gains on securities available for sale, net of tax ...... 943 (10,348) 3,220Post-retirement benefit transition obligation amortization..................................................... 61 61 61Deferred tax expense ............................................................................................................. (25) (25) (25)
Post-retirement benefit transition obligation amortization, net of tax................................ 36 36 36Total other comprehensive income (loss) .................................................................................. 979 (10,312) 3,256Total comprehensive income ..................................................................................................... $61,625 $56,865 $84,383
See accompanying notes to the consolidated financial statements.

20
14
W
EST
AM
ER
ICA
BA
NC
OR
PO
RA
TIO
N F
OR
M 1
0-K
20
15
W
EST
AM
ER
ICA
BA
NC
OR
PO
RA
TIO
N P
RO
XY
53 - 53 -
WESTAMERICA BANCORPORATIONCONSOLIDATED STATEMENTS OF CHANGES IN SHAREHOLDERS’ EQUITY
Common Shares
OutstandingCommon
Stock
Accumulated Deferred
Compensation
Accumulated Other
ComprehensiveIncome (loss)
Retained Earnings Total
(In thousands)
Balance, December 31, 2011.............................. 28,150 $377,775 $3,060 $11,369 $166,437 $558,641 Net income for the year 2012........................... 81,127 81,127 Other comprehensive income 3,256 3,256 Exercise of stock options................................. 185 7,635 7,635 Tax benefit decrease upon exercise of stock
options........................................................... (119) (119) Restricted stock activity .................................. 11 482 41 523 Stock based compensation............................... 1,450 1,450 Stock awarded to employees ........................... 2 93 93 Retirement of common stock including
repurchases.................................................... (1,135) (15,304) (36,195) (51,499) (41,005) (41,005) Dividends ........................................................
Balance, December 31, 2012.............................. 27,213 372,012 3,101 14,625 170,364 560,102 Net income for the year 2013........................... 67,177 67,177
Other comprehensive loss (10,312) (10,312) Exercise of stock options ................................. 479 21,499 21,499 Tax benefit decrease upon exercise of stock options ........................................................... (298) (298) Restricted stock activity .................................... 15 1,068 (390) 678 Stock based compensation ................................ 1,397 1,397 Stock awarded to employees............................. 2 107 107
Retirement of common stock including repurchases .................................................... (1,199) (16,839) (40,481) (57,320)
(40,096) (40,096) Dividends..........................................................Balance, December 31, 2013.............................. 26,510 378,946 2,711 4,313 156,964 542,934
Net income for the year 2014........................... 60,646 60,646 Other comprehensive income 979 979 Exercise of stock options................................. 256 12,396 12,396 Tax benefit decrease upon exercise of stock
options........................................................... (447) (447) Restricted stock activity .................................. 21 1,114 1,114 Stock based compensation............................... 1,318 1,318 Stock awarded to employees ........................... 2 102 102 Retirement of common stock including
repurchases.................................................... (1,044) (15,297) (37,381) (52,678) (39,761) (39,761) Dividends ........................................................
Balance, December 31, 2014.............................. 25,745 $378,132 $2,711 $5,292 $140,468 $526,603
See accompanying notes to the consolidated financial statements.
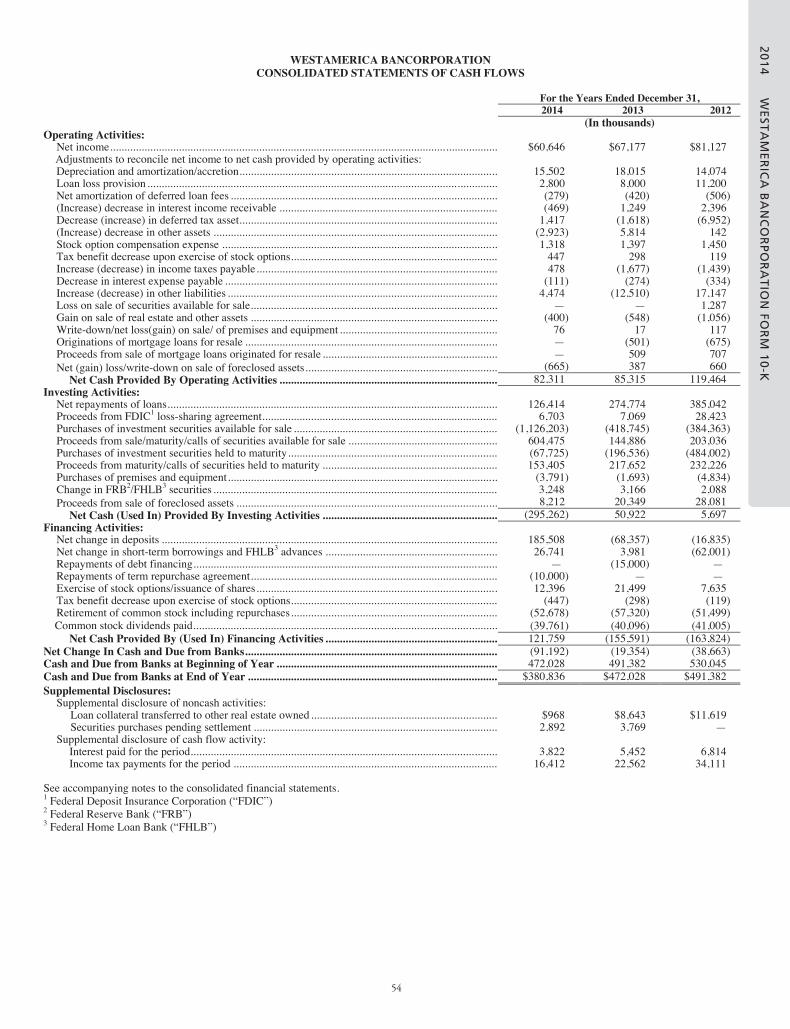
20
14
W
EST
AM
ER
ICA
BA
NC
OR
PO
RA
TIO
N FO
RM
10
-K
20
15
W
EST
AM
ER
ICA
BA
NC
OR
PO
RA
TIO
N P
RO
XY
54
- 54 -
WESTAMERICA BANCORPORATION CONSOLIDATED STATEMENTS OF CASH FLOWS
For the Years Ended December 31, 2014 2013 2012
(In thousands) Operating Activities:
Net income....................................................................................................................................... $60,646 $67,177 $81,127 Adjustments to reconcile net income to net cash provided by operating activities: Depreciation and amortization/accretion.......................................................................................... 15,502 18,015 14,074 Loan loss provision.......................................................................................................................... 2,800 8,000 11,200 Net amortization of deferred loan fees ............................................................................................. (279) (420) (506) (Increase) decrease in interest income receivable ............................................................................ (469) 1,249 2,396 Decrease (increase) in deferred tax asset.......................................................................................... 1,417 (1,618) (6,952) (Increase) decrease in other assets ................................................................................................... (2,923) 5,814 142 Stock option compensation expense ................................................................................................ 1,318 1,397 1,450 Tax benefit decrease upon exercise of stock options........................................................................ 447 298 119 Increase (decrease) in income taxes payable.................................................................................... 478 (1,677) (1,439) Decrease in interest expense payable ............................................................................................... (111) (274) (334) Increase (decrease) in other liabilities .............................................................................................. 4,474 (12,510) 17,147 Loss on sale of securities available for sale...................................................................................... — — 1,287 Gain on sale of real estate and other assets ...................................................................................... (400) (548) (1,056) Write-down/net loss(gain) on sale/ of premises and equipment ....................................................... 76 17 117Originations of mortgage loans for resale ........................................................................................ — (501) (675) Proceeds from sale of mortgage loans originated for resale ............................................................. — 509 707
(665) 387 660 82,311 85,315 119,464
Net (gain) loss/write-down on sale of foreclosed assets...................................................................Net Cash Provided By Operating Activities ............................................................................
Investing Activities: Net repayments of loans................................................................................................................... 126,414 274,774 385,042 Proceeds from FDIC1 loss-sharing agreement.................................................................................. 6,703 7,069 28,423 Purchases of investment securities available for sale ....................................................................... (1,126,203) (418,745) (384,363) Proceeds from sale/maturity/calls of securities available for sale .................................................... 604,475 144,886 203,036 Purchases of investment securities held to maturity......................................................................... (67,725) (196,536) (484,002) Proceeds from maturity/calls of securities held to maturity ............................................................. 153,405 217,652 232,226 Purchases of premises and equipment.............................................................................................. (3,791) (1,693) (4,834) Change in FRB2/FHLB3 securities ................................................................................................... 3,248 3,166 2,088
8,212 20,349 28,081 (295,262) 50,922 5,697
Proceeds from sale of foreclosed assets ...........................................................................................Net Cash (Used In) Provided By Investing Activities .............................................................
Financing Activities: Net change in deposits ..................................................................................................................... 185,508 (68,357) (16,835) Net change in short-term borrowings and FHLB3 advances ............................................................ 26,741 3,981 (62,001) Repayments of debt financing.......................................................................................................... — (15,000) — Repayments of term repurchase agreement...................................................................................... (10,000) — — Exercise of stock options/issuance of shares.................................................................................... 12,396 21,499 7,635 Tax benefit decrease upon exercise of stock options........................................................................ (447) (298) (119) Retirement of common stock including repurchases........................................................................ (52,678) (57,320) (51,499)
Common stock dividends paid.......................................................................................................... (39,761) (40,096) (41,005) Net Cash Provided By (Used In) Financing Activities ............................................................ 121,759 (155,591) (163,824)
Net Change In Cash and Due from Banks........................................................................................ (91,192) (19,354) (38,663) Cash and Due from Banks at Beginning of Year ............................................................................. 472,028 491,382 530,045 Cash and Due from Banks at End of Year ....................................................................................... $380,836 $472,028 $491,382 Supplemental Disclosures:
Supplemental disclosure of noncash activities: Loan collateral transferred to other real estate owned ................................................................. $968 $8,643 $11,619 Securities purchases pending settlement ..................................................................................... 2,892 3,769 —
Supplemental disclosure of cash flow activity: Interest paid for the period........................................................................................................... 3,822 5,452 6,814 Income tax payments for the period ............................................................................................ 16,412 22,562 34,111
See accompanying notes to the consolidated financial statements. 1 Federal Deposit Insurance Corporation (“FDIC”) 2 Federal Reserve Bank (“FRB”) 3 Federal Home Loan Bank (“FHLB”)

20
14
W
EST
AM
ER
ICA
BA
NC
OR
PO
RA
TIO
N F
OR
M 1
0-K
20
15
W
EST
AM
ER
ICA
BA
NC
OR
PO
RA
TIO
N P
RO
XY
55 - 55 -
WESTAMERICA BANCORPORATIONNOTES TO CONSOLIDATED FINANCIAL STATEMENTS
Note 1: Business and Accounting Policies
Westamerica Bancorporation, a registered bank holding company (the “Company”), provides a full range of banking services to corporate and individual customers in Northern and Central California through its subsidiary bank, Westamerica Bank (the “Bank”). The Bank is subject to competition from both financial and nonfinancial institutions and to the regulations of certainagencies and undergoes periodic examinations by those regulatory authorities.
The Company has evaluated events and transactions subsequent to the balance sheet date. Based on this evaluation, the Company is not aware of any events or transactions that occurred subsequent to the balance sheet date but prior to filing that would require recognition or disclosure in its consolidated financial statements. Certain amounts in prior periods have been reclassified to conform to the current presentation.
Summary of Significant Accounting Policies
The consolidated financial statements are prepared in conformity with accounting principles generally accepted in the United States of America. The following is a summary of significant policies used in the preparation of the accompanying financial statements.
Accounting Estimates. Certain accounting policies underlying the preparation of these financial statements require Management to make estimates and judgments about future economic and market conditions. These estimates and judgments may affect reported amounts of assets and liabilities, revenues and expenses, and disclosures of contingent assets and liabilities. Although the estimates contemplate current conditions and how Management expects them to change in the future, it is reasonably possible thatin 2015 actual conditions could be worse than anticipated in those estimates, which could materially affect our results of operations and financial conditions. The most significant of these involve the Allowance for Credit Losses, as discussed below under “Allowance for Credit Losses.”
Principles of Consolidation. The consolidated financial statements include the accounts of the Company and all the Company’s subsidiaries. Significant intercompany transactions have been eliminated in consolidation. The Company does not maintain or conduct transactions with any unconsolidated special purpose entities.
Cash Equivalents. Cash equivalents include Due From Banks balances which are readily convertible to known amounts of cash and are generally 90 days or less from maturity at the time of initiation, presenting insignificant risk of changes in value due to interest rate changes.
Securities. Investment securities consist of debt securities of the U.S. Treasury, government sponsored entities, states, counties, municipalities, corporations, mortgage-backed securities, asset-backed securities and equity securities. Securities transactions are recorded on a trade date basis. The Company classifies its debt and marketable equity securities in one of three categories: trading, available for sale or held to maturity. Trading securities are bought and held principally for the purpose of selling them in the near term. Trading securities are recorded at fair value with unrealized gains and losses included in earnings. Held to maturity securities are those debt securities which the Company has the ability and intent to hold until maturity. Held to maturity securities are recorded at cost, adjusted for the amortization of premiums or accretion of discounts. Securities not included in trading or held to maturity are classified as available for sale. Available for sale securities are recorded at fair value. Unrealized gains and losses, net of the related tax effect, on available for sale securities are included in other comprehensive income.
The Company utilizes third-party sources to value its investment securities; securities individually valued using quoted prices in active markets are classified as Level 1 assets in the fair value hierarchy, and securities valued using quoted prices in activemarkets for similar securities (commonly referred to as “matrix” pricing) are classified as Level 2 assets in the fair value hierarchy. The Company validates the reliability of third-party provided values by comparing individual security pricing for securities between more than one third-party source. When third-party information is not available, valuation adjustments are estimated in good faith by Management.
A decline in the market value of any available for sale or held to maturity security below amortized cost that is deemed other than temporary results in a charge to earnings and the establishment of a new cost basis for the security. Unrealized investment securities losses are evaluated at least quarterly to determine whether such declines in value should be considered “other thantemporary” and therefore be subject to immediate loss recognition in income. Although these evaluations involve significant

20
14
W
EST
AM
ER
ICA
BA
NC
OR
PO
RA
TIO
N FO
RM
10
-K
20
15
W
EST
AM
ER
ICA
BA
NC
OR
PO
RA
TIO
N P
RO
XY
56
- 56 -
judgment, an unrealized loss in the fair value of a debt security is generally deemed to be temporary when the fair value of thesecurity is below the carrying value primarily due to changes in risk-free interest rates, there has not been significant deterioration in the financial condition of the issuer, and the Company does not intend to sell or be required to sell the securities before recovery of its amortized cost. An unrealized loss in the value of an equity security is generally considered temporary when thefair value of the security declined primarily due to current market conditions and not deterioration in the financial condition of the issuer, the Company expects the fair value of the security to recover in the near term and the Company does not intend to sell orbe required to sell the securities before recovery of its amortized cost. Other factors that may be considered in determining whether a decline in the value of either a debt or an equity security is “other than temporary” include ratings by recognized rating agencies, actions of commercial banks or other lenders relative to the continued extension of credit facilities to the issuer of the security, the financial condition, capital strength and near-term prospects of the issuer, and recommendations of investment advisors or market analysts.
The Company follows the guidance issued by the Board of Governors of the Federal Reserve System, “Investing in Securities without Reliance on Nationally Recognized Statistical Rating Agencies” (SR 12-15) and other regulatory guidance when performing investment security pre-purchase analysis or evaluating investment securities for impairment. Credit ratings issued by recognized rating agencies are considered in the Company’s analysis only as a guide to the historical default rate associated with similarly-rated bonds.
Purchase premiums are amortized and purchase discounts are accreted over the estimated life of the related investment security as an adjustment to yield using the effective interest method. Unamortized premiums, unaccreted discounts, and early payment premiums are recognized as a component of gain or loss on sale upon disposition of the related security. Interest and dividend income are recognized when earned. Realized gains and losses from the sale of available for sale securities are included in earnings using the specific identification method.
Nonmarketable Equity Securities. Nonmarketable equity securities include securities that are not publicly traded, such as Visa Class B common stock, and securities acquired to meet regulatory requirements, such as Federal Home Loan Bank and Federal Reserve Bank stock, which are restricted. These restricted securities are accounted for under the cost method and are included in other assets. The Company reviews those assets accounted for under the cost method at least quarterly for possible declines in value that are considered “other than temporary”. The Company’s review typically includes an analysis of the facts and circumstances of each investment, the expectations for the investment’s cash flows and capital needs, the viability of its business model and any exit strategy. The asset value is reduced when a decline in value is considered to be other than temporary. The Company recognizes the estimated loss in noninterest income.
Loans. Loans are stated at the principal amount outstanding, net of unearned discount and unamortized deferred fees and costs. Interest is accrued daily on the outstanding principal balances. Loans which are more than 90 days delinquent with respect to interest or principal, unless they are well secured and in the process of collection, and other loans on which full recovery ofprincipal or interest is in doubt, are placed on nonaccrual status. Interest previously accrued on loans placed on nonaccrual statusis charged against interest income. In addition, some loans secured by real estate with temporarily impaired values and commercial loans to borrowers experiencing financial difficulties are placed on nonaccrual status (“performing nonaccrual loans”) even though the borrowers continue to repay the loans as scheduled. When the ability to fully collect nonaccrual loan principal is in doubt, payments received are applied against the principal balance of the loans on a cost-recovery method untilsuch time as full collection of the remaining recorded balance is expected. Any additional interest payments received after thattime are recorded as interest income on a cash basis. Performing nonaccrual loans are reinstated to accrual status when improvements in credit quality eliminate the doubt as to the full collectability of both interest and principal. Certain consumerloans or auto receivables are charged off against the allowance for credit losses when they become 120 days past due.
The Company evaluates all classified loans and nonaccrual loans with outstanding principal balances in excess of $500 thousand,and all “troubled debt restructured” loans for impairment. The Company recognizes a loan as impaired when, based on current information and events, it is probable that it will be unable to collect both the contractual interest and principal payments asscheduled in the loan agreement. Income recognition on impaired loans conforms to that used on nonaccrual loans. In certain circumstances, the Company might agree to restructured loan terms with borrowers experiencing financial difficulties; such restructured loans are evaluated under ASC 310-40, “Troubled Debt Restructurings by Creditors.” In general, a restructuring constitutes a troubled debt restructuring when the Company, for reasons related to a borrower’s financial difficulties, grants aconcession to the borrower it would not otherwise consider. Loans are evaluated on an individual basis. The Company follows itsgeneral nonaccrual policy for troubled debt restructurings. Performing troubled debt restructurings are reinstated to accrual status when improvements in credit quality eliminate the doubt as to full collectability of both principal and interest.
Nonrefundable fees and certain costs associated with originating or acquiring loans are deferred and amortized as an adjustmentto interest income over the contractual loan lives. Upon prepayment, unamortized loan fees, net of costs, are immediately

20
14
W
EST
AM
ER
ICA
BA
NC
OR
PO
RA
TIO
N F
OR
M 1
0-K
20
15
W
EST
AM
ER
ICA
BA
NC
OR
PO
RA
TIO
N P
RO
XY
57 - 57 -
recognized in interest income. Other fees, including those collected upon principal prepayments, are included in interest incomewhen received. Loans held for sale are identified upon origination and are reported at the lower of cost or market value on an aggregate loan basis.
Purchased Loans. Purchased loans are recorded at estimated fair value on the date of purchase. Impaired purchased loans are accounted for under FASB ASC 310-30, Loans and Debt Securities with Deteriorated Credit Quality, when the loans have evidence of credit deterioration since origination and it is probable at the date of acquisition that the Company will not collect all contractually required principal and interest payments. Evidence of credit quality deterioration as of the purchase date may include attributes such as past due and nonaccural status. Generally, purchased loans that meet the Company’s definition for nonaccrual status fall within the scope of FASB ASC 310-30. The difference between contractually required payments at acquisition and the cash flows expected to be collected at acquisition is referred to as the nonaccretable difference. Subsequent decreases to the expected cash flows will generally result in a provision for loan losses. Subsequent increases in cash flows result in a reversal of the provision for loan losses to the extent of prior charges, or a reclassification of the difference from nonaccretable to accretable with a positive impact on interest income. Any excess of expected cash flows over the estimated fairvalue is referred to as the accretable yield and is recognized into interest income over the remaining life of the loan when there is a reasonable expectation about the amount and timing of such cash flows. For covered purchased loans with an accretable difference, the corresponding FDIC receivable is amortized over the shorter of the contractual term of the indemnification asset or the remaining life of the loan. Further, the Company elected to analogize to ASC 310-30 and account for all other loans that hada discount due in part to credit not within the scope of ASC 310-30 using the same methodology.
Covered Loans. Loans covered under loss-sharing or similar credit protection agreements with the FDIC are reported in loans exclusive of the expected reimbursement cash flows from the FDIC. Covered loans are initially recorded at fair value at the acquisition date. Subsequent decreases in the amount expected to be collected results in a provision for loan losses and a corresponding increase in the estimated FDIC reimbursement, with the estimated net loss impacting earnings. Interest previouslyaccrued on covered loans placed on nonaccrual status is charged against interest income, net of estimated FDIC reimbursements of such accrued interest. The FDIC reimburses the Company up to 80% of 90 days interest on covered loans.
Allowance for Credit Losses. The Company extends loans to commercial and consumer customers in Northern and Central California. These lending activities expose the Company to the risk borrowers will default, causing loan losses. The Company’s lending activities are exposed to various qualitative risks. All loan segments are exposed to risks inherent in the economy andmarket conditions. Significant risk characteristics related to the commercial loan segment include the borrowers’ business performance and financial condition, and the value of collateral for secured loans. Significant risk characteristics related to the commercial real estate segment include the borrowers’ business performance and the value of properties collateralizing the loans.Significant risk characteristics related to the construction loan segment include the borrowers’ performance in successfully developing the real estate into the intended purpose and the value of the property collateralizing the loans. Significant risk characteristics related to the residential real estate segment include the borrowers’ financial wherewithal to service the mortgages and the value of the property collateralizing the loans. Significant risk characteristics related to the consumer loan segment include the financial condition of the borrowers and the value of collateral securing the loans.
The preparation of these financial statements requires Management to estimate the amount of losses inherent in the loan portfolioand establish an allowance for credit losses. The allowance for credit losses is established by assessing a provision for loan losses against the Company’s earnings. In estimating credit losses, Management must exercise significant judgment in evaluating information deemed relevant, such as financial information regarding individual borrowers, overall credit loss experience, the amount of past due, nonperforming and classified loans, recommendations of regulatory authorities, prevailing economic conditions and other information. The amount of ultimate losses on the loan portfolio can vary from the estimated amounts. Management follows a systematic methodology to estimate loss potential in an effort to reduce the differences between estimatedand actual losses.
The allowance for credit losses is established through provisions for credit losses charged to income. Losses on loans, includingimpaired loans, are charged to the allowance for loan losses when all or a portion of the recorded amount of a loan is deemed tobe uncollectible. Recoveries of loans previously charged off are credited to the allowance when realized. The Company’s allowance for credit losses is maintained at a level considered adequate to provide for losses that can be estimated based uponspecific and general conditions. These include conditions unique to individual borrowers, as well as overall credit loss experience, the amount of past due, nonperforming and classified loans, recommendations of regulatory authorities, prevailing economic conditions, FDIC loss-sharing or similar credit protection agreements and other factors. A portion of the allowance is specifically allocated to impaired loans whose full collectability is uncertain. Such allocations are determined by Management based on loan-by-loan analyses. The Company evaluates all classified loans and nonaccrual loans with outstanding principal balances in excessof $500 thousand, and all “troubled debt restructured” loans for impairment. A second allocation is based in part on quantitativeanalyses of historical credit loss experience. The results of this analysis are applied to current loan balances to allocate the reserve

20
14
W
EST
AM
ER
ICA
BA
NC
OR
PO
RA
TIO
N FO
RM
10
-K
20
15
W
EST
AM
ER
ICA
BA
NC
OR
PO
RA
TIO
N P
RO
XY
58
- 58 -
to the respective segments of the loan portfolio. In addition, consumer installment loans which have similar characteristics and are not usually criticized using regulatory guidelines are analyzed and reserves established based on the historical loss rates anddelinquency trends, grouped by the number of days the payments on these loans are delinquent. The remainder of the reserve is considered to be unallocated. The unallocated allowance is established to provide for probable losses that have been incurred as of the reporting date but not reflected in the allocated allowance. It addresses additional qualitative factors consistent with Management’s analysis of the level of risks inherent in the loan portfolio, which are related to the risks of the Company’s generallending activity. Included in the unallocated allowance is the risk of losses that are attributable to national or local economic or industry trends which have occurred but have not yet been recognized in past loan charge-off history (external factors). The external factors evaluated by the Company include: economic and business conditions, external competitive issues, and other factors. Also included in the unallocated allowance is the risk of losses that are attributable to general attributes of the Company’s loan portfolio and credit administration (internal factors). The internal factors evaluated by the Company include: loan reviewsystem, adequacy of lending Management and staff, loan policies and procedures, problem loan trends, concentrations of credit, and other factors. By their nature, these risks are not readily allocable to any specific segment of the loan portfolio in a statistically meaningful manner.
Liability for Off-Balance Sheet Credit Exposures. A liability for off-balance sheet credit exposures is established through expense recognition. Off-balance sheet credit exposures relate to letters of credit and unfunded loan commitments for commercial, construction and consumer loans. Historical credit loss factors for commercial, construction and consumer loans are applied to the amount of these off-balance sheet credit exposures to estimate inherent losses.
Other Real Estate Owned. Other real estate owned is comprised of property acquired through foreclosure proceedings, acceptances of deeds-in-lieu of foreclosure and, if applicable, vacated bank properties. Losses recognized at the time of acquiring property in full or partial satisfaction of debt are charged against the allowance for credit losses. Other real estate owned isrecorded at the fair value of the collateral, generally based upon an independent property appraisal, less estimated dispositioncosts. Losses incurred subsequent to acquisition due to any decline in annual independent property appraisals are recognized asnoninterest expense. Routine holding costs, such as property taxes, insurance and maintenance, and losses from sales and dispositions, are recognized as noninterest expense.
Covered Other Real Estate Owned. Other real estate owned covered under loss-sharing agreements with the FDIC is reported exclusive of expected reimbursement cash flows from the FDIC. Upon transferring covered loan collateral to covered other real estate owned status, the covered loan collateral is recorded at fair value, generally based upon an independent property appraisal,less estimated disposition costs with losses charged against acquisition date fair value discounts; the amount of losses exceeding acquisition date fair value discounts are recognized as noninterest expense inclusive of expected reimbursement cash flows fromthe FDIC. Subsequent losses incurred due to any decline in annual independent property appraisal valuations are recognized as noninterest expense inclusive of expected reimbursement cash flows from the FDIC.
Premises and Equipment. Premises and equipment are stated at cost, less accumulated depreciation and amortization. Depreciation is computed substantially on the straight-line method over the estimated useful life of each type of asset. Estimated useful lives of premises and equipment range from 20 to 50 years and from 3 to 20 years, respectively. Leasehold improvements are amortized over the terms of the lease or their estimated useful life, whichever is shorter.
Intangible Assets. Intangible assets are comprised of goodwill, core deposit intangibles and other identifiable intangibles acquired in business combinations. Intangible assets with definite useful lives are amortized on an accelerated basis over their respectiveestimated useful lives not exceeding 15 years. If an event occurs that indicates the carrying amount of an intangible asset may not be recoverable, Management reviews the asset for impairment. Any goodwill and any intangible asset acquired in a purchase business combination determined to have an indefinite useful life is not amortized, but is evaluated for impairment annually. The Company has the option to first assess qualitative factors to determine the likelihood of impairment pursuant to FASB ASU 2011-08, Testing for Goodwill Impairment. Although the Company has the option to first assess qualitative factors when determining if impairment exists, the Company has opted to perform a quantitative analysis to determine if an impairment exists.
Impairment of Long-Lived Assets. The Company reviews its long-lived and certain intangible assets for impairment whenever events or changes indicate that the carrying amount of an asset may not be recoverable. If such assets are considered to be impaired, the impairment to be recognized is measured by the amount by which the carrying amount of the assets exceeds the fairvalue of the assets. Assets to be disposed of are reported at the lower of the carrying amount or fair value less costs to sell.
Income Taxes. The Company and its subsidiaries file consolidated tax returns. The Company accounts for income taxes in accordance with FASB ASC 740, Income Taxes, resulting in two components of income tax expense: current and deferred. Current income tax expense approximates taxes to be paid or refunded for the current period. The Company determines deferred income taxes using the balance sheet method. Under this method, the net deferred tax asset or liability is based on the tax effects

20
14
W
EST
AM
ER
ICA
BA
NC
OR
PO
RA
TIO
N F
OR
M 1
0-K
20
15
W
EST
AM
ER
ICA
BA
NC
OR
PO
RA
TIO
N P
RO
XY
59 - 59 -
of the differences between the book and tax bases of assets and liabilities, and recognizes enacted changes in tax rates and laws in the period in which they occur. Deferred income tax expense results from changes in deferred tax assets and liabilities betweenperiods. Deferred tax assets are recognized subject to Management’s judgment that realization is more likely than not. A tax position that meets the more likely than not recognition threshold is measured to determine the amount of benefit to recognize.The tax position is measured at the largest amount of benefit that is greater than fifty percent likely of being realized upon settlement. Interest and penalties are recognized as a component of income tax expense.
Stock Options. The Company applies FASB ASC 718 – Compensation – Stock Compensation, to account for stock based awards granted to employees using the fair value method. The Company recognizes compensation expense for restricted performance share grants over the relevant attribution period. Restricted performance share grants have no exercise price, therefore, the intrinsic value is measured using an estimated per share price at the vesting date for each restricted performance share. The estimated per share price is adjusted during the attribution period to reflect actual stock price performance. The Company’s obligation for unvested outstanding restricted performance share grants is classified as a liability until the vesting date due to a cash settlement feature, at which time the issued shares become classified as shareholders’ equity.
Extinguishment of Debt. Gains and losses, including fees, incurred in connection with the early extinguishment of debt are charged to current earnings as reductions in noninterest income.
Postretirement Benefits. The Company uses an actuarial-based accrual method of accounting for post-retirement benefits.
Other. Securities and other property held by the Bank in a fiduciary or agency capacity are not included in the financial statements since such items are not assets of the Company or its subsidiaries.
Recently Issued Accounting Standards
FASB ASU 2014-11, Transfers and Servicing (Topic 860): Repurchase-to-Maturity Transactions, Repurchase Financings, and Disclosures, was issued on June 12, 2014. The Update improves the financial reporting of repurchase agreements and other similar transactions through a change in accounting for repurchase-to-maturity transactions and repurchase financings, and the introduction of two new disclosure requirements. New disclosures are required for (1) transfers accounted for as sales in transactions that are economically similar to repurchase agreements, in which the transferor retains substantially all of the exposure to the economic return on the transferred financial asset throughout the term of the transaction and (2) repurchase agreements, securities lending transactions, and repurchase-to-maturity transactions accounted for as secured borrowings about the nature of collateral pledged and the time to maturity of those transactions.
The Company will be required to adhere to new disclosure requirements when the Update is adopted April 1, 2015 for the interim period ending June 30, 2015.
FASB ASU 2014-01, Investments- Equity Method and Joint Ventures (Topic 323): Accounting for Investments in Qualified Affordable Housing Projects, was issued January 2014 to permit reporting entities to make an accounting policy election to account for their investments in qualified affordable housing projects using the proportional amortization method if certain conditions are met. Under the proportional amortization method, an entity amortizes the initial cost of the investment in proportion to the tax credits and other tax benefits received and recognizes the net investment performance in the income statement as a component of income tax expense (benefit). For those investments in qualified affordable housing projects not accounted for using the proportional amortization method, the investment should be accounted for as an equity method investment or a cost method investment in accordance with GAAP. The policy election must be applied consistently to all qualified affordable housing project investments.
The update also requires a reporting entity to disclose information regarding its investments in qualified affordable housing projects, and the effect of the measurement of its investments in qualified affordable housing projects and the related tax credits on its financial position and results of operations.
Management has evaluated the impact that the change in accounting policy and has elected to not implement the proportional amortization method. Therefore, the impact will be limited to additional disclosures only.

20
14
W
EST
AM
ER
ICA
BA
NC
OR
PO
RA
TIO
N FO
RM
10
-K
20
15
W
EST
AM
ER
ICA
BA
NC
OR
PO
RA
TIO
N P
RO
XY
60
- 60 -
Note 2: Investment Securities
An analysis of the amortized cost, gross unrealized gains and losses accumulated in other comprehensive income, and fair value of the available for sale investment securities portfolio follows:
(1) Federal Home Loan Mortgage Corporation (2) Federal National Mortgage Association
An analysis of the amortized cost, gross unrealized gains and losses, and fair value of the held to maturity investment securitiesportfolio follows:
Investment Securities Held to Maturity At December 31, 2014
Amortized Cost
GrossUnrealized
Gains
GrossUnrealized
LossesFair
Value(In thousands)
Securities of U.S. Government sponsored entities .............. $1,066 $11 $— $1,077 Residential mortgage-backed securities .............................. 59,078 1,183 (137) 60,124 Obligations of states and political subdivisions .................. 720,189 11,350 (2,358) 729,181
258,325 2,236 (2,381) 258,180 Residential collateralized mortgage obligations..................Total .................................................................................... $1,038,658 $14,780 ($4,876) $1,048,562
An analysis of the amortized cost, gross unrealized gains and losses accumulated in other comprehensive income, and fair value of the available for sale investment securities portfolio follows:
(1) Federal Home Loan Mortgage Corporation (2) Federal National Mortgage Association
Investment Securities Available for Sale At December 31, 2014
Amortized Cost
GrossUnrealized
Gains
GrossUnrealized
LossesFair
Value(In thousands)
U.S. Treasury securities ......................................................... $3,500 $5 $— $3,505Securities of U.S. Government sponsored entities ................. 635,278 937 (1,027) 635,188Residential mortgage-backed securities ................................. 24,647 1,776 (16) 26,407Commercial mortgage-backed securities ............................... 2,923 6 (10) 2,919Obligations of states and political subdivisions ..................... 171,907 10,015 (123) 181,799Residential collateralized mortgage obligations .................... 230,347 634 (8,524) 222,457Asset-backed securities .......................................................... 8,349 — (36) 8,313FHLMC(1) and FNMA(2) stock ............................................... 775 4,393 — 5,168Corporate securities................................................................ 511,699 2,169 (1,629) 512,239
2,039 871 (124) 2,786Other securities....................................................................... Total ....................................................................................... $1,591,464 $20,806 ($11,489) $1,600,781
Investment Securities Available for Sale At December 31, 2013
Amortized Cost
GrossUnrealized
Gains
GrossUnrealized
LossesFair
Value(In thousands)
U.S. Treasury securities ......................................................... $3,500 $9 ($3) $3,506Securities of U.S. Government sponsored entities ................. 131,080 75 (663) 130,492Residential mortgage-backed securities ................................. 32,428 1,763 (15) 34,176Commercial mortgage-backed securities ............................... 3,411 19 (5) 3,425Obligations of states and political subdivisions ..................... 186,082 5,627 (323) 191,386Residential collateralized mortgage obligations .................... 266,890 730 (14,724) 252,896Asset-backed securities .......................................................... 14,653 3 (101) 14,555FHLMC(1) and FNMA(2) stock ............................................... 804 12,568 — 13,372Corporate securities................................................................ 430,794 2,901 (1,264) 432,431
2,049 1,251 (158) 3,142Other securities....................................................................... Total ....................................................................................... $1,071,691 $24,946 ($17,256) $1,079,381

20
14
W
EST
AM
ER
ICA
BA
NC
OR
PO
RA
TIO
N F
OR
M 1
0-K
20
15
W
EST
AM
ER
ICA
BA
NC
OR
PO
RA
TIO
N P
RO
XY
61 - 61 -
An analysis of the amortized cost, gross unrealized gains and losses, and fair value of the held to maturity investment securitiesportfolio follows:
Investment Securities Held to Maturity At December 31, 2013
Amortized Cost
GrossUnrealized
Gains
GrossUnrealized
LossesFair
Value(In thousands)
Securities of U.S. Government sponsored entities .............. $1,601 $— ($4) $1,597 Residential mortgage-backed securities .............................. 65,076 854 (624) 65,306 Obligations of states and political subdivisions .................. 756,707 6,211 (21,667) 741,251
308,915 1,209 (5,602) 304,522 Residential collateralized mortgage obligations..................Total .................................................................................... $1,132,299 $8,274 ($27,897) $1,112,676
The amortized cost and fair value of securities by contractual maturity are shown in the following tables at the dates indicated:
At December 31, 2014 Securities Available
for Sale Securities Held
to Maturity Amortized
CostFair
ValueAmortized
CostFair
Value(In thousands)
Maturity in years: 1 year or less........................................................ $57,891 $57,991 $15,355 $15,855Over 1 to 5 years ................................................. 629,200 630,797 228,380 230,248Over 5 to 10 years ............................................... 584,872 589,250 285,219 288,631
58,770 63,006 192,301 195,524Over 10 years.......................................................Subtotal ................................................................... 1,330,733 1,341,044 721,255 730,258Mortgage-backed securities and residential
collateralized mortgage obligations....................... 257,917 251,783 317,403 318,304 2,814 7,954 — —Other securities........................................................
Total ........................................................................ $1,591,464 $1,600,781 $1,038,658 $1,048,562
Securities available for sale at December 31, 2014 with maturity dates over five years but less than ten years include $429,576thousand (fair value) of securities of U.S. Government sponsored entities with call options on dates within one year or less, ofwhich $279,961 thousand have interest coupons which will increase if the issuer does not exercise the call option.
At December 31, 2013 Securities Available
for Sale Securities Held
to Maturity Amortized
CostFair
ValueAmortized
CostFair
Value(In thousands)
Maturity in years: 1 year or less........................................................ $75,385 $75,609 $9,639 $9,900Over 1 to 5 years ................................................. 536,333 538,111 187,051 189,827Over 5 to 10 years ............................................... 66,669 68,166 314,630 310,104
87,722 90,484 246,988 233,017Over 10 years.......................................................Subtotal ................................................................... 766,109 772,370 758,308 742,848Mortgage-backed securities and residential
collateralized mortgage obligations....................... 302,729 290,497 373,991 369,828 2,853 16,514 — —Other securities........................................................
Total ........................................................................ $1,071,691 $1,079,381 $1,132,299 $1,112,676
Expected maturities of mortgage-backed securities can differ from contractual maturities because borrowers have the right to callor prepay obligations with or without call or prepayment penalties. In addition, such factors as prepayments and interest rates may affect the yield on the carrying value of mortgage-backed securities. At December 31, 2014 and December 31, 2013, the Company had no high-risk collateralized mortgage obligations as defined by regulatory guidelines.

20
14
W
EST
AM
ER
ICA
BA
NC
OR
PO
RA
TIO
N FO
RM
10
-K
20
15
W
EST
AM
ER
ICA
BA
NC
OR
PO
RA
TIO
N P
RO
XY
62
- 62 -
An analysis of the gross unrealized losses of the available for sale investment securities portfolio follows:
No. of No. of No. of Investment Unrealized Investment Unrealized Investment Unrealized Positions Fair Value Losses Positions Fair Value Losses Positions Fair Value Losses
Securities of U.S. Government sponsored entities 15 $253,632 ($989) 1 $9,963 ($38) 16 $263,595 ($1,027)Residential mortgage- backed securities - - - 2 822 (16) 2 822 (16) Commercial mortgage- backed securities 1 942 (7) 1 803 (3) 2 1,745 (10) Obligations of states and political subdivisions 7 2,548 (18) 17 5,518 (105) 24 8,066 (123) Residential collateralized mortgage obligations - - - 32 205,074 (8,524) 32 205,074 (8,524) Asset-backed securities 1 5,008 (7) 1 3,305 (29) 2 8,313 (36) Corporate securities 53 165,026 (1,304) 5 34,222 (325) 58 199,248 (1,629) Other securities - - - 1 1,876 (124) 1 1,876 (124) Total 77 $427,156 ($2,325) 60 $261,583 ($9,164) 137 $688,739 ($11,489)
Less than 12 months
Investment Securities Available for SaleAt December 31, 2014
12 months or longer Total
($ in thousands)
An analysis of gross unrealized losses of the held to maturity investment securities portfolio follows:
No. of No. of No. of Investment Unrealized Investment Unrealized Investment Unrealized Positions Fair Value Losses Positions Fair Value Losses Positions Fair Value Losses
Residential mortgage- backed securities 4 $19,467 ($132) 1 $201 ($5) 5 $19,668 ($137)Obligations of states and political subdivisions 103 76,202 (439) 138 123,370 (1,919) 241 199,572 (2,358)Residential collateralized mortgage obligations 5 13,932 (166) 22 119,513 (2,215) 27 133,445 (2,381)Total 112 $109,601 ($737) 161 $243,084 ($4,139) 273 $352,685 ($4,876)
Total
($ in thousands)
Investment Securities Held to MaturityAt December 31, 2014
Less than 12 months 12 months or longer
The unrealized losses on the Company’s investment securities were caused by market conditions for these types of investments, particularly changes in risk-free interest rates. The Company evaluates securities on a quarterly basis including changes in security ratings issued by ratings agencies, changes in the financial condition of the issuer, and, for mortgage-related and asset-backed securities, delinquency and loss information with respect to the underlying collateral, changes in the levels of subordination for the Company’s particular position within the repayment structure and remaining credit enhancement as compared to expected credit losses of the security. Substantially all of these securities continue to be investment grade rated by a major rating agency. In addition to monitoring credit rating agency evaluations, Management performs its own evaluations regarding the credit worthiness of the issuer or the securitized assets underlying asset backed securities.
The Company does not intend to sell any investments and has concluded that it is more likely than not that it will not be required to sell the investments prior to recovery of the amortized cost basis. Therefore, the Company does not consider these investments to be other-than-temporarily impaired as of December 31, 2014.
The fair values of the investment securities could decline in the future if the general economy deteriorates, inflation increases, credit ratings decline, the issuer’s financial condition deteriorates, or the liquidity for securities declines. As a result, other than temporary impairments may occur in the future.

20
14
W
EST
AM
ER
ICA
BA
NC
OR
PO
RA
TIO
N F
OR
M 1
0-K
20
15
W
EST
AM
ER
ICA
BA
NC
OR
PO
RA
TIO
N P
RO
XY
63 - 63 -
As of December 31, 2014, $757,623 thousand of investment securities were pledged to secure public deposits, short-term borrowed funds and FHLB advances. As of December 31, 2013, $778,588 thousand of investment securities were pledged to secure public deposits, short-term borrowed funds, FHLB advances and term repurchase agreements.
An analysis of gross unrealized losses of the available for sale investment securities portfolio follows:
No. of No. of No. of Investment Unrealized Investment Unrealized Investment Unrealized Positions Fair Value Losses Positions Fair Value Losses Positions Fair Value Losses
U.S. Treasury securities 1 $2,994 ($3) - $- $- 1 $2,994 ($3)Securities of U.S. Government sponsored entities 15 91,669 (663) - - - 15 91,669 (663)Residential mortgage- backed securities 3 864 (15) - - - 3 864 (15)Commercial mortgage- backed securities 1 1,072 (5) - - - 1 1,072 (5)Obligations of states and political subdivisions 35 17,516 (222) 11 3,214 (101) 46 20,730 (323)Residential collateralized mortgage obligations 34 187,848 (12,326) 6 40,575 (2,398) 40 228,423 (14,724)Asset-backed securities 1 5,002 (1) 1 4,475 (100) 2 9,477 (101)Corporate securities 25 117,751 (1,087) 2 9,824 (177) 27 127,575 (1,264)Other securities - - - 1 1,842 (158) 1 1,842 (158) Total 115 $424,716 ($14,322) 21 $59,930 ($2,934) 136 $484,646 ($17,256)
Less than 12 months
Investment Securities Available for SaleAt December 31, 2013
12 months or longer Total
($ in thousands)
An analysis of gross unrealized losses of the held to maturity investment securities portfolio follows:
No. of No. of No. of Investment Unrealized Investment Unrealized Investment Unrealized Positions Fair Value Losses Positions Fair Value Losses Positions Fair Value Losses
Securities of U.S. Government sponsored entities 1 $1,597 ($4) - $- $- 1 $1,597 ($4)Residential mortgage- backed securities 13 38,396 (616) 1 392 (8) 14 38,788 (624)Obligations of states and political subdivisions 530 355,797 (14,893) 64 64,427 (6,774) 594 420,224 (21,667)Residential collateralized mortgage obligations 42 214,981 (5,175) 5 14,120 (427) 47 229,101 (5,602)Total 586 $610,771 ($20,688) 70 $78,939 ($7,209) 656 $689,710 ($27,897)
Total
($ in thousands)
Investment Securities Held to MaturityAt December 31, 2013
Less than 12 months 12 months or longer
The unrealized losses on the Company’s investment securities were caused by market conditions for these types of investments, particularly rising risk-free interest rates causing bond prices to decline.

20
14
W
EST
AM
ER
ICA
BA
NC
OR
PO
RA
TIO
N FO
RM
10
-K
20
15
W
EST
AM
ER
ICA
BA
NC
OR
PO
RA
TIO
N P
RO
XY
64
- 64 -
The following table provides information about the amount of interest income earned on investment securities which is fully taxable and that is exempt from regular federal income tax:
2014 2013 2012
Taxable $24,766 $22,201 $21,346Tax-exempt from regular federal income tax 26,387 29,569 31,198Total interest income from investment securities $51,153 $51,770 $52,544
For the YearsEnded December 31,
(In thousands)
Note 3: Loans and Allowance for Credit Losses
The FDIC indemnification expired February 6, 2014 for County Bank non-single-family residential collateralized purchased loans; accordingly, such loans have been reclassified from purchased covered loans to purchased non-covered loans.
A summary of the major categories of loans outstanding is shown in the following tables.
ConsumerCommercial Residential Installment
Commercial Real Estate Construction Real Estate & Other Total
Originated loans $374,005 $567,594 $11,003 $146,925 $370,842 $1,470,369Purchased covered loans: Gross purchased covered loans - - - 2,626 14,920 17,546 Credit risk discount - - - (434) (34) (468) Purchased non-covered loans: Gross purchased non-covered loans 19,166 157,502 2,919 972 41,656 222,215 Credit risk discount (1,356) (6,492) (50) (262) (1,212) (9,372) Total $391,815 $718,604 $13,872 $149,827 $426,172 $1,700,290
At December 31, 2014
(In thousands)
ConsumerCommercial Residential Installment
Commercial Real Estate Construction Real Estate & Other Total
Originated loans $338,824 $596,653 $10,723 $176,196 $400,888 $1,523,284Purchased covered loans: Gross purchased covered loans 20,066 175,562 3,223 8,558 54,194 261,603 Credit risk discount (1,530) (8,122) (50) (434) (797) (10,933) Purchased non-covered loans: Gross purchased non-covered loans 7,525 35,712 - 999 12,799 57,035 Credit risk discount (726) (786) - (262) (1,471) (3,245) Total $364,159 $799,019 $13,896 $185,057 $465,613 $1,827,744
At December 31, 2013
(In thousands)
Changes in the carrying amount of impaired purchased loans were as follows:
2014 2013Impaired purchased loansCarrying amount at the beginning of the period $4,936 $14,629Reductions during the period (264) (9,693)Carrying amount at the end of the period $4,672 $4,936
(In thousands)
For the Years Ended December 31,
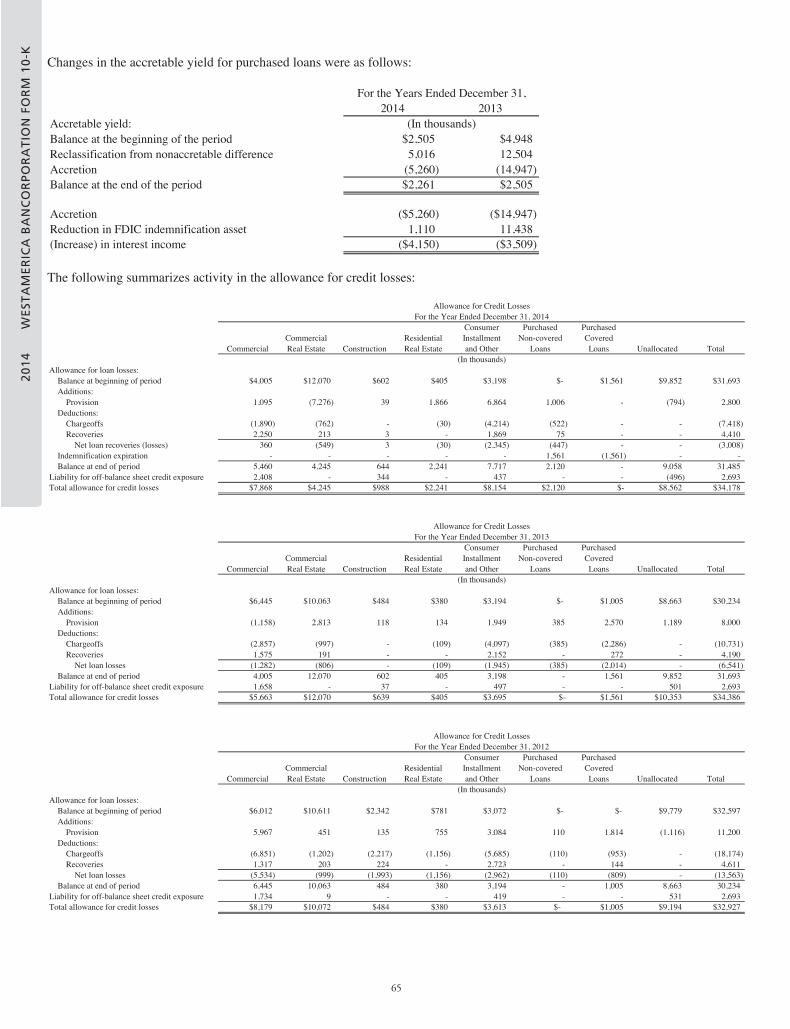
20
14
W
EST
AM
ER
ICA
BA
NC
OR
PO
RA
TIO
N F
OR
M 1
0-K
20
15
W
EST
AM
ER
ICA
BA
NC
OR
PO
RA
TIO
N P
RO
XY
65 - 65 -
Changes in the accretable yield for purchased loans were as follows:
2014 2013Accretable yield:Balance at the beginning of the period $2,505 $4,948Reclassification from nonaccretable difference 5,016 12,504Accretion (5,260) (14,947)Balance at the end of the period $2,261 $2,505
Accretion ($5,260) ($14,947)Reduction in FDIC indemnification asset 1,110 11,438(Increase) in interest income ($4,150) ($3,509)
(In thousands)
For the Years Ended December 31,
The following summarizes activity in the allowance for credit losses:
Consumer Purchased PurchasedCommercial Residential Installment Non-covered Covered
Commercial Real Estate Construction Real Estate and Other Loans Loans Unallocated Total
Allowance for loan losses: Balance at beginning of period $4,005 $12,070 $602 $405 $3,198 $- $1,561 $9,852 $31,693 Additions: Provision 1,095 (7,276) 39 1,866 6,864 1,006 - (794) 2,800 Deductions: Chargeoffs (1,890) (762) - (30) (4,214) (522) - - (7,418) Recoveries 2,250 213 3 - 1,869 75 - - 4,410 Net loan recoveries (losses) 360 (549) 3 (30) (2,345) (447) - - (3,008) Indemnification expiration - - - - - 1,561 (1,561) - - Balance at end of period 5,460 4,245 644 2,241 7,717 2,120 - 9,058 31,485Liability for off-balance sheet credit exposure 2,408 - 344 - 437 - - (496) 2,693 Total allowance for credit losses $7,868 $4,245 $988 $2,241 $8,154 $2,120 $- $8,562 $34,178
(In thousands)
Allowance for Credit LossesFor the Year Ended December 31, 2014
Consumer Purchased PurchasedCommercial Residential Installment Non-covered Covered
Commercial Real Estate Construction Real Estate and Other Loans Loans Unallocated Total
Allowance for loan losses: Balance at beginning of period $6,445 $10,063 $484 $380 $3,194 $- $1,005 $8,663 $30,234 Additions: Provision (1,158) 2,813 118 134 1,949 385 2,570 1,189 8,000 Deductions: Chargeoffs (2,857) (997) - (109) (4,097) (385) (2,286) - (10,731) Recoveries 1,575 191 - - 2,152 - 272 - 4,190 Net loan losses (1,282) (806) - (109) (1,945) (385) (2,014) - (6,541) Balance at end of period 4,005 12,070 602 405 3,198 - 1,561 9,852 31,693Liability for off-balance sheet credit exposure 1,658 - 37 - 497 - - 501 2,693 Total allowance for credit losses $5,663 $12,070 $639 $405 $3,695 $- $1,561 $10,353 $34,386
(In thousands)
Allowance for Credit LossesFor the Year Ended December 31, 2013
Consumer Purchased PurchasedCommercial Residential Installment Non-covered Covered
Commercial Real Estate Construction Real Estate and Other Loans Loans Unallocated Total
Allowance for loan losses: Balance at beginning of period $6,012 $10,611 $2,342 $781 $3,072 $- $- $9,779 $32,597 Additions: Provision 5,967 451 135 755 3,084 110 1,814 (1,116) 11,200 Deductions: Chargeoffs (6,851) (1,202) (2,217) (1,156) (5,685) (110) (953) - (18,174) Recoveries 1,317 203 224 - 2,723 - 144 - 4,611 Net loan losses (5,534) (999) (1,993) (1,156) (2,962) (110) (809) - (13,563) Balance at end of period 6,445 10,063 484 380 3,194 - 1,005 8,663 30,234Liability for off-balance sheet credit exposure 1,734 9 - - 419 - - 531 2,693 Total allowance for credit losses $8,179 $10,072 $484 $380 $3,613 $- $1,005 $9,194 $32,927
(In thousands)
Allowance for Credit LossesFor the Year Ended December 31, 2012

20
14
W
EST
AM
ER
ICA
BA
NC
OR
PO
RA
TIO
N FO
RM
10
-K
20
15
W
EST
AM
ER
ICA
BA
NC
OR
PO
RA
TIO
N P
RO
XY
66
- 66 -
The allowance for credit losses and recorded investment in loans were evaluated for impairment as follows:
CommercialCommercial Real Estate Construction
Residential Real Estate
Consumer Installment and
OtherPurchased Non-covered Loans
Purchased Covered Loans Unallocated Total
Allowance for credit losses:Individually evaluated for impairment $496 $- $- $- $- $- $- $- $496Collectively evaluated for impairment 7,372 4,245 988 2,241 8,154 2,120 - 8,562 33,682Purchased loans with evidence of credit deterioration - - - - - - - - -
Total $7,868 $4,245 $988 $2,241 $8,154 $2,120 $- $8,562 $34,178Carrying value of loans:
Individually evaluated for impairment $11,811 $2,970 $- $574 $599 $12,364 $- $- $28,318Collectively evaluated for impairment 362,194 564,624 11,003 146,351 370,243 196,034 16,851 - 1,667,300 Purchased loans with evidence of credit deterioration - - - - - 4,445 227 - 4,672
Total $374,005 $567,594 $11,003 $146,925 $370,842 $212,843 $17,078 $- $1,700,290
Allowance for Credit Losses and Recorded Investment in Loans Evaluated for ImpairmentAt December 31, 2014
(In thousands)
CommercialCommercial Real Estate Construction
Residential Real Estate
Consumer Installment and
OtherPurchased Non-covered Loans
Purchased Covered Loans Unallocated Total
Allowance for credit losses:Individually evaluated for impairment $100 $1,243 $- $- $- $- $153 $- $1,496Collectively evaluated for impairment 5,563 10,827 639 405 3,695 - 1,408 10,353 32,890Purchased loans with evidence of credit deterioration - - - - - - - - -
Total $5,663 $12,070 $639 $405 $3,695 $- $1,561 $10,353 $34,386Carrying value of loans:
Individually evaluated for impairment $3,901 $3,357 $- $- $- $3,785 $9,999 $- $21,042Collectively evaluated for impairment 334,923 593,296 10,723 176,196 400,888 47,571 238,169 - 1,801,766 Purchased loans with evidence of credit deterioration - - - - - 2,434 2,502 - 4,936
Total $338,824 $596,653 $10,723 $176,196 $400,888 $53,790 $250,670 $- $1,827,744
Allowance for Credit Losses and Recorded Investment in Loans Evaluated for ImpairmentAt December 31, 2013
(In thousands)
The Bank’s customers are small businesses, professionals and consumers. Given the scale of these borrowers, corporate credit rating agencies do not evaluate the borrowers’ financial condition. The Bank maintains a Loan Review Department which reports directly to the Board of Directors. The Loan Review Department performs independent evaluations of loans and assigns credit risk grades to evaluated loans using grading standards employed by bank regulatory agencies. Loans judged to carry lower-risk attributes are assigned a “pass” grade, with a minimal likelihood of loss. Loans judged to carry higher-risk attributes are referred to as “classified loans,” and are further disaggregated, with increasing expectations for loss recognition, as “substandard,” “doubtful,” and “loss.” Loan Review Department evaluations occur every calendar quarter. If the Bank becomes aware of deterioration in a borrower’s performance or financial condition between Loan Review Department examinations, assigned risk grades are re-evaluated promptly. Credit risk grades assigned by the Loan Review Department are subject to review by the Bank’sregulatory authorities during regulatory examinations.
The following summarizes the credit risk profile by internally assigned grade:
CommercialCommercial Real Estate Construction
Residential Real Estate
Consumer Installment and
OtherPurchased Non-covered Loans
Purchased CoveredLoans (1) Total
Grade:Pass $366,487 $527,980 $11,003 $144,902 $369,618 $182,644 $15,509 $1,618,143Substandard 7,506 39,614 - 2,023 734 39,473 2,037 91,387Doubtful 12 - - - 12 77 - 101Loss - - - - 478 21 - 499Credit risk discount - - - - - (9,372) (468) (9,840)
Total $374,005 $567,594 $11,003 $146,925 $370,842 $212,843 $17,078 $1,700,290
Credit Risk Profile by Internally Assigned GradeAt December 31, 2014
(In thousands)
(1) Credit risk profile reflects internally assigned grade of purchased covered loans without regard to FDIC indemnification.

20
14
W
EST
AM
ER
ICA
BA
NC
OR
PO
RA
TIO
N F
OR
M 1
0-K
20
15
W
EST
AM
ER
ICA
BA
NC
OR
PO
RA
TIO
N P
RO
XY
67 - 67 -
CommercialCommercial Real Estate Construction
Residential Real Estate
Consumer Installment and
OtherPurchased Non-covered Loans
Purchased CoveredLoans (1) Total
Grade:Pass $329,667 $554,991 $10,274 $174,113 $399,377 $41,490 $196,882 $1,706,794Substandard 8,142 41,662 449 2,083 1,127 14,587 64,624 132,674 Doubtful 1,015 - - - 19 958 97 2,089 Loss - - - - 365 - - 365 Credit risk discount - - - - - (3,245) (10,933) (14,178)
Total $338,824 $596,653 $10,723 $176,196 $400,888 $53,790 $250,670 $1,827,744
Credit Risk Profile by Internally Assigned GradeAt December 31, 2013
(In thousands)
(1) Credit risk profile reflects internally assigned grade of purchased covered loans without regard to FDIC indemnification.
The following tables summarize loans by delinquency and nonaccrual status:
Current and Accruing
30-59 Days Past Due and
Accruing
60-89 Days Past Due and
Accruing
Past Due 90 days or More and Accruing Nonaccrual Total Loans
Commercial $372,235 $1,704 $36 $ - $30 $374,005Commercial real estate 557,041 6,500 - - 4,053 567,594 Construction 11,003 - - - - 11,003 Residential real estate 144,021 1,513 817 - 574 146,925 Consumer installment and other 365,753 3,310 625 502 652 370,842
Total originated loans 1,450,053 13,027 1,478 502 5,309 1,470,369 Purchased non-covered loans 196,150 4,204 491 - 11,998 212,843 Purchased covered loans 16,389 389 3 - 297 17,078
Total $1,662,592 $17,620 $1,972 $502 $17,604 $1,700,290
Summary of Loans by Delinquency and Nonaccrual StatusAt December 31, 2014
(In thousands)
Current and Accruing
30-59 Days Past Due and
Accruing
60-89 Days Past Due and
Accruing
Past Due 90 days or More and Accruing Nonaccrual Total Loans
Commercial $336,497 $677 $383 $ - $1,267 $338,824Commercial real estate 586,619 4,012 2,473 - 3,549 596,653 Construction 10,275 - - - 448 10,723 Residential real estate 173,082 2,789 325 - - 176,196 Consumer installment and other 396,725 3,035 606 410 112 400,888
Total originated loans 1,503,198 10,513 3,787 410 5,376 1,523,284 Purchased non-covered loans 45,755 4,237 180 - 3,618 53,790 Purchased covered loans 236,577 845 940 - 12,308 250,670
Total $1,785,530 $15,595 $4,907 $410 $21,302 $1,827,744
Summary of Loans by Delinquency and Nonaccrual StatusAt December 31, 2013
(In thousands)
The following is a summary of the effect of nonaccrual loans on interest income:
For the Years Ended December 31,
2014 2013 2012 (In thousands)
Interest income that would have been recognized had the loans performed in accordance with their original terms.......................................... $1,146 $1,866 $2,936
(60) (402) (1,204) Less: Interest income recognized on nonaccrual loans ........................................Total reduction of interest income ....................................................................... $1,086 $1,464 $1,732

20
14
W
EST
AM
ER
ICA
BA
NC
OR
PO
RA
TIO
N FO
RM
10
-K
20
15
W
EST
AM
ER
ICA
BA
NC
OR
PO
RA
TIO
N P
RO
XY
68
- 68 -
There were no commitments to lend additional funds to borrowers whose loans were on nonaccrual status at December 31, 2014 and December 31, 2013.
The following summarizes impaired loans:
UnpaidRecorded Principal Related
Investment Balance Allowance
Impaired loans with no related allowance recorded: Commercial $2,031 $2,095 $ - Commercial real estate 19,478 25,519 - Construction 1,834 1,884 - Residential real estate 574 574 - Consumer installment and other 1,518 1,628 -
Impaired loans with an allowance recorded: Commercial 9,910 9,910 496 Commercial real estate - - - Construction - - - Residential real estate - - - Consumer installment and other - - -
Total: Commercial $11,941 $12,005 $496 Commercial real estate 19,478 25,519 - Construction 1,834 1,884 - Residential real estate 574 574 - Consumer installment and other 1,518 1,628
Impaired LoansAt December 31, 2014
(In thousands)
UnpaidRecorded Principal Related
Investment Balance Allowance
Impaired loans with no related allowance recorded: Commercial $3,931 $4,498 $ - Commercial real estate 11,002 13,253 - Construction 2,483 2,947 - Consumer installment and other 2,014 2,133 -
Impaired loans with an allowance recorded: Commercial 1,000 2,173 100 Commercial real estate 9,773 12,482 1,396 Construction - - - Consumer installment and other - - -
Total: Commercial $4,931 $6,671 $100 Commercial real estate 20,775 25,735 1,396 Construction 2,483 2,947 - Consumer installment and other 2,014 2,133 -
Impaired LoansAt December 31, 2013
(In thousands)
Impaired loans include troubled debt restructured loans. Impaired loans at December 31, 2014, included $4,837 thousand of restructured loans, none of which were on nonaccrual status. Impaired loans at December 31, 2013, included $5,453 thousand of restructured loans, including $529 thousand that were on nonaccrual status.

20
14
W
EST
AM
ER
ICA
BA
NC
OR
PO
RA
TIO
N F
OR
M 1
0-K
20
15
W
EST
AM
ER
ICA
BA
NC
OR
PO
RA
TIO
N P
RO
XY
69 - 69 -
Average Recognized Average RecognizedRecorded Interest Recorded Interest
Investment Income Investment Income
Commercial $5,240 $325 $10,566 $222Commercial real estate 19,880 469 27,186 763Construction 2,015 - 2,400 80Residential real estate 153 - 362 - Consumer installment and other 1,399 29 1,469 38 Total $28,687 $823 $41,983 $1,103
December 31, 2014 December 31, 2013
Impaired LoansFor the Years Ended
(In thousands)
The following tables provide information on troubled debt restructurings:
Period-EndIndividual
Number of Pre-Modification Period-End ImpairmentContracts Carrying Value Carrying Value Allowance
Commercial 3 $2,075 $1,901 $ - Commercial real estate 4 2,890 2,928 - Consumer installment and other 1 18 8 - Total 8 $4,983 $4,837 $ -
Troubled Debt RestructuringsAt December 31, 2014
(In thousands)
Period-EndIndividual
Number of Pre-Modification Period-End ImpairmentContracts Carrying Value Carrying Value Allowance
Commercial 4 $3,427 $3,164 $-Commercial real estate 2 2,291 2,289 - Total 6 $5,718 $5,453 $-
Troubled Debt RestructuringsAt December 31, 2013
(In thousands)
Period-EndIndividual
Number of Pre-Modification Period-End ImpairmentContracts Carrying Value Carrying Value Allowance
Commercial 3 $1,318 $1,196 $797Commercial real estate 2 5,391 5,482 - Total 5 $6,709 $6,678 $797
Troubled Debt RestructuringsAt December 31, 2012
(In thousands)
During the year ended December 31, 2014, the Company modified five loans with a total carrying value of $713 thousand that were considered troubled debt restructurings. The concessions granted in the five restructurings completed in 2014 consisted ofmodification of payment terms to extend the maturity date to allow for deferred principal repayment. During the year ended December 31, 2013, the Company modified five loans with a total carrying value of $4,966 thousand that were considered troubled debt restructurings. The concessions granted in the five restructurings completed in 2013 consisted of modification ofpayment terms to lower the interest rate and extend the maturity date to allow for deferred principal repayment. During the year

20
14
W
EST
AM
ER
ICA
BA
NC
OR
PO
RA
TIO
N FO
RM
10
-K
20
15
W
EST
AM
ER
ICA
BA
NC
OR
PO
RA
TIO
N P
RO
XY
70
- 70 -
ended December 31, 2012, the Company modified three loans with carrying values totaling $5,821 thousand that were considered troubled debt restructurings. The concessions granted in the restructurings completed in 2012 largely consisted of modificationsof payment terms extending maturity dates to allow for deferred principal repayment.
During the year ended December 31, 2014, no troubled debt restructured loans defaulted. During the year ended December 31, 2013 a commercial real estate loan with a carrying value of $3,954 thousand defaulted within 12 months of the modification date.During the year ended December 31, 2012, troubled debt restructured construction and commercial loans with carrying values totaling $3,068 thousand and $988 thousand, respectively, defaulted. A troubled debt restructuring is considered to be in default when payments are 90 days or more past due.
The Company pledges loans to secure borrowings from the Federal Home Loan Bank of San Francisco (FHLB). The carrying value of the FHLB advances was $20,015 thousand and $20,577 thousand at December 31, 2014 and December 31, 2013, respectively. The loans restricted due to collateral requirements approximated $18,366 thousand and $24,242 thousand at December 31, 2014 and December 31, 2013, respectively. The FHLB does not have the right to sell or repledge such loans.
There were no loans held for sale at December 31, 2014 and December 31, 2013.
Note 4: Concentration of Credit Risk
The Company’s business activity is with customers in Northern and Central California. The loan portfolio is well diversified within the Company’s geographic market, although the Company has significant credit arrangements that are secured by real estate collateral. In addition to real estate loans outstanding as disclosed in Note 3, the Company had loan commitments and standby letters of credit related to real estate loans of $66,086 thousand and $62,277 thousand at December 31, 2014 and December 31, 2013, respectively. The Company requires collateral on all real estate loans with loan-to-value ratios at origination generally no greater than 75% on commercial real estate loans and no greater than 80% on residential real estate loans. Under theCalifornia Financial Code, loans to any one person owing to a commercial bank at any one time shall not exceed the following limitations: (a) unsecured loans shall not exceed 15 percent of the sum of the shareholders' equity, allowance for loan losses,capital notes, and debentures of the bank, or (b) secured and unsecured loans in all shall not exceed 25 percent of the sum of the shareholders' equity, allowance for loan losses, capital notes, and debentures of the bank. At December 31, 2014, Westamerica Bank did not have loans to any one customer exceeding these limits; Westamerica Bank had 36 borrower relationships with aggregate loans exceeding $5 million.
Note 5: Premises, Equipment and Other Assets
Premises and equipment consisted of the following:
At December 31,
Cost
Accumulated Depreciation
and Amortization
Net Book Value
(In thousands) 2014 Land...................................................................................................... $11,933 $— $11,933Buildings and improvements ................................................................ 40,939 (23,267) 17,672 Leasehold improvements ...................................................................... 5,742 (4,664) 1,078
21,438 (14,269) 7,169 $80,052 ($42,200) $37,852
Furniture and equipment.......................................................................Total ..................................................................................................
2013 Land...................................................................................................... $11,983 $— $11,983Buildings and improvements ................................................................ 41,092 (22,321) 18,771 Leasehold improvements ...................................................................... 5,761 (4,453) 1,308
18,365 (13,113) 5,252 Furniture and equipment.......................................................................Total .................................................................................................. $77,201 ($39,887) $37,314
Depreciation and amortization of premises and equipment included in noninterest expense amounted to $3,177 thousand in 2014, $3,001 thousand in 2013 and $2,626 thousand in 2012.

20
14
W
EST
AM
ER
ICA
BA
NC
OR
PO
RA
TIO
N F
OR
M 1
0-K
20
15
W
EST
AM
ER
ICA
BA
NC
OR
PO
RA
TIO
N P
RO
XY
71 - 71 -
Other assets consisted of the following:
At December 31, 2014 2013
(In thousands) Cost method equity investments:
Federal Reserve Bank stock (1) ............................................................................... $14,069 $14,069 Federal Home Loan Bank stock (2) ......................................................................... 940 4,188
241 376 Other investments ..................................................................................................Total cost method equity investments................................................................ 15,250 18,633
Life insurance cash surrender value........................................................................... 46,479 43,896 Deferred taxes receivable ........................................................................................... 50,903 53,281 Limited partnership investments ................................................................................ 18,673 18,198 Interest receivable ...................................................................................................... 19,394 18,925 FDIC indemnification receivable............................................................................... — 4,032 Prepaid assets ............................................................................................................. 5,609 5,229 Other assets ................................................................................................................ 10,150 14,238
Total other assets ................................................................................................ $166,458 $176,432
(1) A bank applying for membership in the Federal Reserve System is required to subscribe to stock in the Federal Reserve Bank of SanFrancisco (FRB) in a sum equal to six percent of the bank’s paid-up capital stock and surplus. One-half of the amount of the bank's subscription shall be paid to the FRB and the remaining half will be subject to call when deemed necessary by the Board of Governors of the Federal Reserve System.
(2) Borrowings from the FHLB must be supported by capital stock holdings. The minimum activity-based requirement is 4.7% of the outstandingadvances. The requirement may be adjusted from time to time by the FHLB within limits established in the FHLB's Capital Plan.
Note 6: Goodwill and Identifiable Intangible Assets
The Company has recorded goodwill and other identifiable intangibles associated with purchase business combinations. Goodwill is not amortized, but is periodically evaluated for impairment. The Company did not recognize impairment during the years endedDecember 31, 2014 and December 31, 2013. Identifiable intangibles are amortized to their estimated residual values over their expected useful lives. Such lives and residual values are also periodically reassessed to determine if any amortization period adjustments are indicated. During the years ended December 31, 2014 and year ended December 31, 2013, no such adjustments were recorded.
The carrying values of goodwill were:
At December 31, 2014 2013 (In thousands) Goodwill............................................... $121,673 $121,673
The gross carrying amount of intangible assets and accumulated amortization was:
At December 31, 2014 2013
Gross Carrying Amount
Accumulated Amortization
GrossCarrying Amount
Accumulated Amortization
(In thousands) Core Deposit Intangibles ................................................... $56,808 ($43,188) $56,808 ($39,242) Merchant Draft Processing Intangible ............................... 10,300 (9,633) 10,300 (9,309)
Total Intangible Assets................................................... $67,108 ($52,821) $67,108 ($48,551)

20
14
W
EST
AM
ER
ICA
BA
NC
OR
PO
RA
TIO
N FO
RM
10
-K
20
15
W
EST
AM
ER
ICA
BA
NC
OR
PO
RA
TIO
N P
RO
XY
72
- 72 -
As of December 31, 2014, the current year and estimated future amortization expense for intangible assets was as follows:
CoreDeposit
Intangibles
Merchant Draft
Processing Intangible Total
(In thousands) For the Year ended December 31, 2014 (actual) ............................................ $3,946 $324 $4,270Estimate for year ended December 31,
2015 ................................................................................................ 3,594 262 3,8562016 ................................................................................................ 3,292 212 3,5042017 ................................................................................................ 2,913 164 3,0772018 ................................................................................................ 1,892 29 1,9212019 ................................................................................................ 538 — 538
Note 7: Deposits and Borrowed Funds
The following table provides additional detail regarding deposits.
Deposits At December 31,
2014 2013 (In thousands)
Noninterest bearing.................................................................... $1,910,781 $1,740,182 Interest bearing: Transaction .............................................................................. 792,448 763,088 Savings .................................................................................... 1,260,819 1,167,744 Time deposits less than $100 thousand ................................... 169,959 193,913 Time deposits $100 thousand through $250 thousand............. 113,023 100,514 Time deposits more than $250 thousand ................................. 102,161 198,340 Total deposits......................................................................... $4,349,191 $4,163,781
Demand deposit overdrafts of $3,173 thousand and $3,002 thousand were included as loan balances at December 31, 2014 and December 31, 2013, respectively. Interest expense for aggregate time deposits with individual account balances in excess of $100thousand was $893 thousand in 2014, $1,096 thousand in 2013 and $1,530 thousand in 2012.
Short-term borrowed funds of $89,784 thousand and $62,668 thousand at December 31, 2014 and December 31, 2013, respectively, represent securities sold under agreements to repurchase the securities. As the Company is obligated to repurchasethe securities, the transfer of the securities is accounted for as a secured borrowing rather than a sale. Securities sold underrepurchase agreements are held in the custody of independent securities brokers. The carrying amount of the securities approximates $148,014 thousand and $113,902 thousand at December 31, 2014 and December 31, 2013, respectively. The short-term borrowed funds mature on an overnight basis.
Federal Home Loan Bank (“FHLB”) advances with a carrying value of $20,015 thousand at December 31, 2014 and $20,577 thousand at December 31, 2013 are secured by residential real estate loans and securities. The amount of such loans and securities approximates $26,484 thousand at December 31, 2014 and $32,953 thousand at December 31, 2013. The FHLB advances are due in full at par value upon their maturity dates: $20,000 thousand mature in January 2015. The FHLB advances may be paid off prior to such maturity dates subject to prepayment fees.
The term repurchase agreement matured and was repaid in full in August 2014. At December 31, 2013, the carrying value of the term repurchase agreement was $10,000 thousand, representing securities sold under an agreement to repurchase the securities. The Company accounted for the transfer of the securities as a secured borrowing rather than a sale due to its obligation to repurchase the securities. At December 31, 2013, the carrying amount of the related securities was approximately $11,278 thousand, which were held in the custody of independent securities brokers.
The Company has a $35,000 thousand unsecured line of credit which had no outstanding balance at December 31, 2014 and December 31, 2013. The line of credit has a variable interest rate, which was 2.0% per annum at December 31, 2014, with interestpayable monthly on outstanding advances. Advances may be made up to the unused credit limit through March 18, 2015.

20
14
W
EST
AM
ER
ICA
BA
NC
OR
PO
RA
TIO
N F
OR
M 1
0-K
20
15
W
EST
AM
ER
ICA
BA
NC
OR
PO
RA
TIO
N P
RO
XY
73 - 73 -
The following table summarizes deposits and borrowed funds of the Company for the periods indicated:
Balance At December 31, 2014
Average Balance
For the Year Ended
December 31, 2014
Weighted Average Rate
Balance At December 31,
2013
AverageBalance
For the Year Ended
December 31, 2013
Weighted Average Rate
($ in thousands) Time deposits over $100 thousand .............. $215,184 $237,002 0.38% $298,854 $341,184 0.32% Securities sold under repurchase
agreements................................................. 89,784 70,244 0.07 62,668 57,446 0.07 Federal Home Loan Bank advances ............ 20,015 20,308 2.00 20,577 25,499 1.88 Term repurchase agreement......................... — 6,082 0.99 10,000 10,000 0.98 Federal funds purchased .............................. — 8 0.48 — 8 0.60
For the years ended December 31, 2014 2013
Highest Balance at Any Month-end
Highest Balance at Any Month-end
(In thousands) Securities sold under repurchase agreements........................... $89,784 $66,640 Federal Home Loan Bank advances ........................................ 20,530 25,780 Term repurchase agreement..................................................... 10,000 10,000
Note 8: Shareholders’ Equity
The Company grants stock options and restricted performance shares to employees in exchange for employee services, pursuant to the shareholder-approved 1995 Stock Option Plan, which was last amended and restated in 2012. Nonqualified stock option grants (“NQSO”) are granted with an exercise price equal to the fair market value of the related common stock on the grant date.NQSO generally become exercisable in equal annual installments over a three-year period with each installment vesting on the anniversary date of the grant. Each NQSO has a maximum ten-year term. A restricted performance share grant becomes vested after three years of being awarded, provided the Company has attained its performance goals for such three-year period.
The following table summarizes information about stock options granted under the Plan as of December 31, 2014. The intrinsic value is calculated as the difference between the market value as of December 31, 2014 and the exercise price of the shares. Themarket value as of December 31, 2014 was $48.96 as reported by the NASDAQ Global Select Market:
Options Outstanding Options Exercisable Number Outstanding at 12/31/2014 (in thousands)
AggregateIntrinsicValue
(in thousands)
Weighted Average Remaining Contractual Life (years)
Weighted Average Exercise Price
Number Exercisable at 12/31/2014 (in thousands)
Aggregate Intrinsic Value (in thousands)
Weighted Average Remaining Contractual Life (years)
Weighted Average Exercise Price
Range of Exercise Price
$40 – 45 283 $1,514 7.5 $44 103 $569 6.5 $43 45 – 50 339 738 5.0 47 262 506 4.3 47 50 – 55 1,074 — 4.1 52 832 — 2.7 52
193 — 5.1 57 193 — 5.1 57 55 – 60 $40 – 60 1,889 $2,252 4.9 50 1,390 $1,075 3.6 51
[The remainder of this page intentionally left blank]

20
14
W
EST
AM
ER
ICA
BA
NC
OR
PO
RA
TIO
N FO
RM
10
-K
20
15
W
EST
AM
ER
ICA
BA
NC
OR
PO
RA
TIO
N P
RO
XY
74
- 74 -
The Company applies the Roll-Geske option pricing model (Modified Roll) to determine grant date fair value of stock option grants. This model modifies the Black-Scholes Model to take into account dividends and American options. During the twelve months ended December 31, 2014, 2013 and 2012, the Company granted 294 thousand, 322 thousand and 296 thousand stock options, respectively. The following weighted average assumptions were used in the option pricing to value stock options grantedin the periods indicated:
2014 2013 2012 For the Years Ended December 31, Expected volatility*1..................................................................................................... 16% 17% 21%Expected life in years*2 ................................................................................................ 4.9 4.8 4.8 Risk-free interest rate*3 ................................................................................................ 1.59% 0.74% 0.72%Expected dividend yield ............................................................................................... 3.32% 3.57% 3.20%Fair value per award ..................................................................................................... $5.91 $4.61 $5.61
*1 Measured using daily price changes of Company’s stock over respective expected term of the option and the implied volatility derived from the market prices of the Company’s stock and traded options.
*2 The number of years that the Company estimates that the options will be outstanding prior to exercise. *3 The risk-free rate over the expected life based on the US Treasury yield curve in effect at the time of the grant.
Employee stock option grants are being expensed by the Company over the grants’ three year vesting period. The Company issues new shares upon the exercise of options. The number of shares authorized to be issued for options at December 31, 2014 is1,232 thousand.
A summary of option activity during the year ended December 31, 2014 is presented below:
Shares(in
thousands)
Weighted AverageExercise
Price
Weighted Average
Remaining Contractual
Term (years) Outstanding at January 1, 2014 .......................................................... 2,078 $49.66 Granted............................................................................................... 294 53.35 Exercised ............................................................................................ (256) 48.30 Forfeited or expired............................................................................ (227) 50.60 Outstanding at December 31, 2014 .................................................... 1,889 50.31 4.9 Exercisable at December 31, 2014 ..................................................... 1,390 50.87 3.6
A summary of the Company’s nonvested option activity during the year ended December 31, 2014 is presented below:
Shares(in
thousands)
Weighted Average
GrantDate
Fair Value Nonvested at January 1, 2014 .............................................................. 563 Granted ................................................................................................ 294 Vested .................................................................................................. (269) Forfeited............................................................................................... (89) Nonvested at December 31, 2014 ........................................................ 499 $5.40
The weighted average estimated grant date fair value for options granted under the Company’s stock option plan during the twelve months ended December 31, 2014, 2013 and 2012 was $5.91, $4.61 and $5.61 per share, respectively. The total remaining unrecognized compensation cost related to nonvested awards as of December 31, 2014 is $431 thousand and the weighted average period over which the cost is expected to be recognized is 1.9 years.
The total intrinsic value of options exercised during the twelve months ended December 31, 2014, 2013 and 2012 was $1,309 thousand, $2,058 thousand and $767 thousand, respectively. The total fair value of RPSs that vested during the twelve months ended December 31, 2014, 2013 and 2012 was $1,115 thousand, $678 thousand and $734 thousand, respectively. The total fair value of options vested during the twelve months ended December 31, 2014, 2013 and 2012 was $1,397 thousand, $1,514 thousand and $1,321 thousand, respectively. The decrease in tax benefits recognized for the tax deductions from the exercise ofoptions totaled $447 thousand, $298 thousand and $119 thousand, respectively, for the twelve months ended December 31, 2014, 2013 and 2012.

20
14
W
EST
AM
ER
ICA
BA
NC
OR
PO
RA
TIO
N F
OR
M 1
0-K
20
15
W
EST
AM
ER
ICA
BA
NC
OR
PO
RA
TIO
N P
RO
XY
75 - 75 -
A summary of the status of the Company’s restricted performance shares as of December 31, 2014 and 2013 and changes during the twelve months ended on those dates, follows (in thousands):
2014 2013 Outstanding at January 1, ............................................................................. 59 54 Granted......................................................................................................... 17 20 Issued upon vesting ...................................................................................... (21) (15) Forfeited ....................................................................................................... (5) —Outstanding at December 31, ....................................................................... 50 59
As of December 31, 2014 and 2013, the restricted performance shares had a weighted-average contractual life of 1.2 years and 1.3years, respectively. The compensation cost that was charged against income for the Company’s restricted performance shares granted was $575 thousand, $1,338 thousand and $710 thousand for the twelve months ended December 31, 2014, 2013 and 2012, respectively. There were no stock appreciation rights or incentive stock options granted in the twelve months ended December 31, 2014 and 2013.
On February 13, 2009, the Company issued a warrant to purchase 246,640 shares of the Company’s common stock at an exercise price of $50.92 per share. The warrants remain outstanding at December 31, 2014.
The Company repurchases and retires its common stock in accordance with Board of Directors approved share repurchase programs. At December 31, 2014, approximately 1,733 thousand shares remained available to repurchase under such plans.
Shareholders have authorized two additional classes of stock of one million shares each, to be denominated “Class B Common Stock” and “Preferred Stock,” respectively, in addition to the 150 million shares of common stock presently authorized. At December 31, 2014, no shares of Class B Common Stock or Preferred Stock were outstanding.
Note 9: Risk-Based Capital
The Company and the Bank are subject to various regulatory capital adequacy requirements administered by federal and state agencies. The Federal Deposit Insurance Corporation Improvement Act of 1991 (“FDICIA”) required that regulatory agencies adopt regulations defining five capital tiers for banks: well capitalized, adequately capitalized, undercapitalized, significantlyundercapitalized and critically undercapitalized. Failure to meet minimum capital requirements can initiate discretionary actionsby regulators that, if undertaken, could have a direct, material effect on the Company’s financial statements. Quantitative measures, established by the regulators to ensure capital adequacy, require that the Company and the Bank maintain minimum ratios of capital to risk-weighted assets. There are two categories of capital under the guidelines. Tier 1 capital includes common shareholders’ equity and qualifying preferred stock less goodwill, identifiable intangible assets, and other adjustments including the unrealized net gains and losses, after taxes, on available for sale securities. Tier 2 capital includes preferred stock notqualifying for Tier 1 capital, mandatory convertible debt, subordinated debt, certain unsecured senior debt and the allowance for loan losses, subject to limitations within the guidelines. Under the guidelines, capital is compared to the relative risk of theCompany’s assets, derived from applying one of four risk weights (0%, 20%, 50% and 100%) to various categories of assets and unfunded commitments to extend credit, primarily based on the credit risk of the counterparty. The capital amounts and classification are also subject to qualitative judgments by the regulators about components, risk weighting and other factors.
As of December 31, 2014, the Company and the Bank met all capital adequacy requirements to which they are subject.
[The remainder of this page intentionally left blank]

20
14
W
EST
AM
ER
ICA
BA
NC
OR
PO
RA
TIO
N FO
RM
10
-K
20
15
W
EST
AM
ER
ICA
BA
NC
OR
PO
RA
TIO
N P
RO
XY
76
- 76 -
The Company and the Bank are well capitalized under the FDICIA regulatory framework for prompt corrective action. To be well capitalized, the institution must maintain a total risk-based capital ratio as set forth in the following table and not be subject to a capital directive order. The following tables show capital ratios for the Company and the Bank as of December 31, 2014 and 2013:
For Capital Adequacy Purposes
To Be Well Capitalized Under
the FDICIA Prompt Corrective Action Provisions
Amount Ratio Amount Ratio Amount Ratio At December 31, 2014 ($ in thousands)
Total Capital (to risk-weighted assets) Consolidated Company ............................ $427,612 14.54% $235,289 8.00% $294,111 10.00% Westamerica Bank.................................... 391,219 13.49% 232,036 8.00% 290,045 10.00%
Tier 1 Capital (to risk-weighted assets) Consolidated Company ............................ 391,121 13.30% 117,644 4.00% 176,467 6.00% Westamerica Bank.................................... 349,120 12.04% 116,018 4.00% 174,027 6.00%
Leverage Ratio * Consolidated Company ............................ 391,121 7.95% 196,809 4.00% 246,011 5.00% Westamerica Bank.................................... 349,120 7.16% 195,149 4.00% 243,936 5.00%
For Capital Adequacy Purposes
To Be Well Capitalized Under
the FDICIA Prompt Corrective Action Provisions
Amount Ratio Amount Ratio Amount Ratio At December 31, 2013 ($ in thousands)
Total Capital (to risk-weighted assets) Consolidated Company ............................ $446,331 16.18% $220,745 8.00% $275,931 10.00% Westamerica Bank.................................... 406,418 14.93% 217,730 8.00% 272,162 10.00%
Tier 1 Capital (to risk-weighted assets) Consolidated Company ............................ 405,798 14.71% 110,372 4.00% 165,559 6.00% Westamerica Bank.................................... 360,809 13.26% 108,865 4.00% 163,297 6.00%
Leverage Ratio * Consolidated Company ............................ 405,798 8.55% 189,762 4.00% 237,203 5.00% Westamerica Bank.................................... 360,809 7.67% 188,109 4.00% 235,137 5.00%
* The leverage ratio consists of Tier 1 capital divided by average assets, excluding certain intangible assets, during the mostrecent calendar quarter.
FDIC-covered assets are included in the 20% risk-weight category until the loss-sharing agreements terminate; the residential loss-sharing agreement expires February 6, 2019 and the non-residential loss-sharing agreement expired (as to losses) February 6,2014.
[The remainder of this page intentionally left blank]
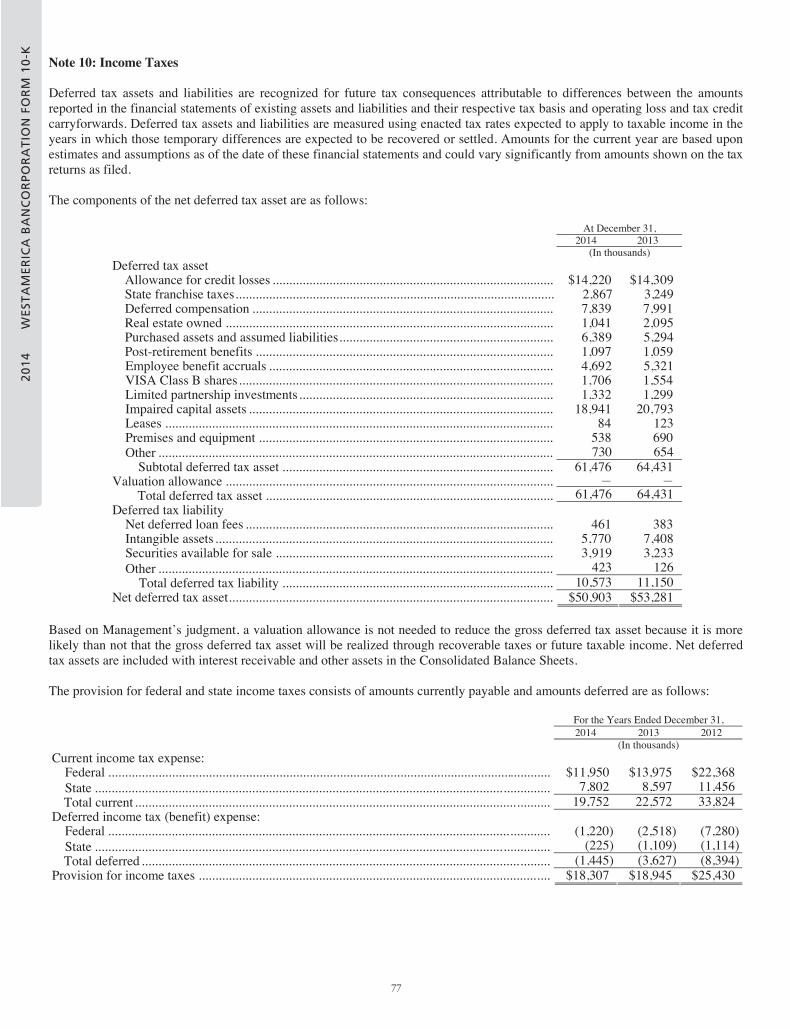
20
14
W
EST
AM
ER
ICA
BA
NC
OR
PO
RA
TIO
N F
OR
M 1
0-K
20
15
W
EST
AM
ER
ICA
BA
NC
OR
PO
RA
TIO
N P
RO
XY
77 - 77 -
Note 10: Income Taxes
Deferred tax assets and liabilities are recognized for future tax consequences attributable to differences between the amounts reported in the financial statements of existing assets and liabilities and their respective tax basis and operating loss and tax credit carryforwards. Deferred tax assets and liabilities are measured using enacted tax rates expected to apply to taxable income in the years in which those temporary differences are expected to be recovered or settled. Amounts for the current year are based uponestimates and assumptions as of the date of these financial statements and could vary significantly from amounts shown on the taxreturns as filed.
The components of the net deferred tax asset are as follows:
At December 31, 2014 2013
(In thousands) Deferred tax asset
Allowance for credit losses .................................................................................... $14,220 $14,309State franchise taxes............................................................................................... 2,867 3,249 Deferred compensation .......................................................................................... 7,839 7,991 Real estate owned .................................................................................................. 1,041 2,095 Purchased assets and assumed liabilities................................................................ 6,389 5,294 Post-retirement benefits ......................................................................................... 1,097 1,059Employee benefit accruals ..................................................................................... 4,692 5,321 VISA Class B shares.............................................................................................. 1,706 1,554Limited partnership investments............................................................................ 1,332 1,299 Impaired capital assets ........................................................................................... 18,941 20,793 Leases .................................................................................................................... 84 123 Premises and equipment ........................................................................................ 538 690
730 654 Other ...................................................................................................................... Subtotal deferred tax asset ................................................................................. 61,476 64,431
— — 61,476 64,431
Valuation allowance .................................................................................................. Total deferred tax asset ......................................................................................
Deferred tax liability Net deferred loan fees ............................................................................................ 461 383 Intangible assets ..................................................................................................... 5,770 7,408 Securities available for sale ................................................................................... 3,919 3,233
423 126 10,573 11,150
Other ...................................................................................................................... Total deferred tax liability ................................................................................. Net deferred tax asset................................................................................................. $50,903 $53,281
Based on Management’s judgment, a valuation allowance is not needed to reduce the gross deferred tax asset because it is more likely than not that the gross deferred tax asset will be realized through recoverable taxes or future taxable income. Net deferred tax assets are included with interest receivable and other assets in the Consolidated Balance Sheets.
The provision for federal and state income taxes consists of amounts currently payable and amounts deferred are as follows:
For the Years Ended December 31, 2014 2013 2012
(In thousands) Current income tax expense:
Federal .................................................................................................................................... $11,950 $13,975 $22,368 7,802 8,597 11,456 19,752 22,572 33,824
State ........................................................................................................................................ Total current ............................................................................................................................
Deferred income tax (benefit) expense: Federal .................................................................................................................................... (1,220) (2,518) (7,280)
(225) (1,109) (1,114) (1,445) (3,627) (8,394)
State ........................................................................................................................................ Total deferred ..........................................................................................................................
Provision for income taxes ......................................................................................................... $18,307 $18,945 $25,430

20
14
W
EST
AM
ER
ICA
BA
NC
OR
PO
RA
TIO
N FO
RM
10
-K
20
15
W
EST
AM
ER
ICA
BA
NC
OR
PO
RA
TIO
N P
RO
XY
78
- 78 -
The provision for income taxes differs from the provision computed by applying the statutory federal income tax rate to income before taxes, as follows:
For the Years Ended December 31, 2014 2013 2012
(In thousands) Federal income taxes due at statutory rate ......................................................................... $27,634 $30,142 $37,295 Reductions in income taxes resulting from:
Interest on state and municipal securities and loans not taxable for federal income tax purposes ................................................................................................................. (10,173) (11,565) (12,494)
State franchise taxes, net of federal income tax benefit ................................................. 4,925 4,712 6,722 Tax credits...................................................................................................................... (2,700) (3,190) (3,684) Dividend received deduction.......................................................................................... (39) (32) (28) Cash value life insurance ............................................................................................... (641) (747) (953) Other .............................................................................................................................. (699) (375) (1,428)
Provision for income taxes................................................................................................. $18,307 $18,945 $25,430
At December 31, 2014, the company had no net operating loss and general tax credit carryforwards for tax return purposes.
A reconciliation of the beginning and ending amounts of unrecognized tax benefits follow:
2014 2013 (In thousands)
Balance at January 1,.................................................................................................................... $1,437 $747 Additions for tax positions taken in the current period ................................................................ 245 483 Reductions for tax positions taken in the current period .............................................................. — —Additions for tax positions taken in prior years ........................................................................... — 212 Reductions for tax positions taken in prior years ......................................................................... (47) —Decreases related to settlements with taxing authorities .............................................................. — —Decreases as a result of a lapse in statute of limitations............................................................... — (5)Balance at December 31,.............................................................................................................. $1,635 $1,437
The Company does not anticipate any significant increase or decrease in unrecognized tax benefits during 2015. Unrecognized taxbenefits at December 31, 2014 and 2013 include accrued interest and penalties of $93 thousand and $85 thousand, respectively. Ifrecognized, the entire amount of the unrecognized tax benefits would affect the effective tax rate.
The Company classifies interest and penalties as a component of the provision for income taxes. The tax years ended December 31, 2014, 2013, 2012 and 2011 remain subject to examination by the Internal Revenue Service. The tax years ended December 31, 2014, 2013, 2012, 2011, 2010 and 2009 remain subject to examination by the California Franchise Tax Board. The deductibility of these tax positions will be determined through examination by the appropriate tax jurisdictions or the expiration of the tax statute of limitations.
Note 11: Fair Value Measurements
The Company uses fair value measurements to record fair value adjustments to certain assets and liabilities and to determine fairvalue disclosures. Available for sale investment securities are recorded at fair value on a recurring basis. Additionally, from time to time, the Company may be required to record at fair value other assets on a nonrecurring basis, such as other real estate owned, impaired loans, certain loans held for investment, investment securities held to maturity, and other assets. These nonrecurring fair value adjustments typically involve the lower-of-cost-or-fair value accounting of individual assets.
In accordance with the Fair Value Measurement and Disclosure topic of the Codification, the Company bases its fair values on theprice that would be received to sell an asset or paid to transfer a liability in the principal market or most advantageous market for an asset or liability in an orderly transaction between market participants on the measurement date under current market conditions. A fair value measurement reflects all of the assumptions that market participants would use in pricing the asset orliability, including assumptions about the risk inherent in a particular valuation technique, the effect of a restriction on the sale or use of an asset, and the risk of nonperformance.
The Company groups its assets and liabilities measured at fair value into a three-level hierarchy, based on the markets in whichthe assets and liabilities are traded and the reliability of the assumptions used to determine fair value. When the valuation
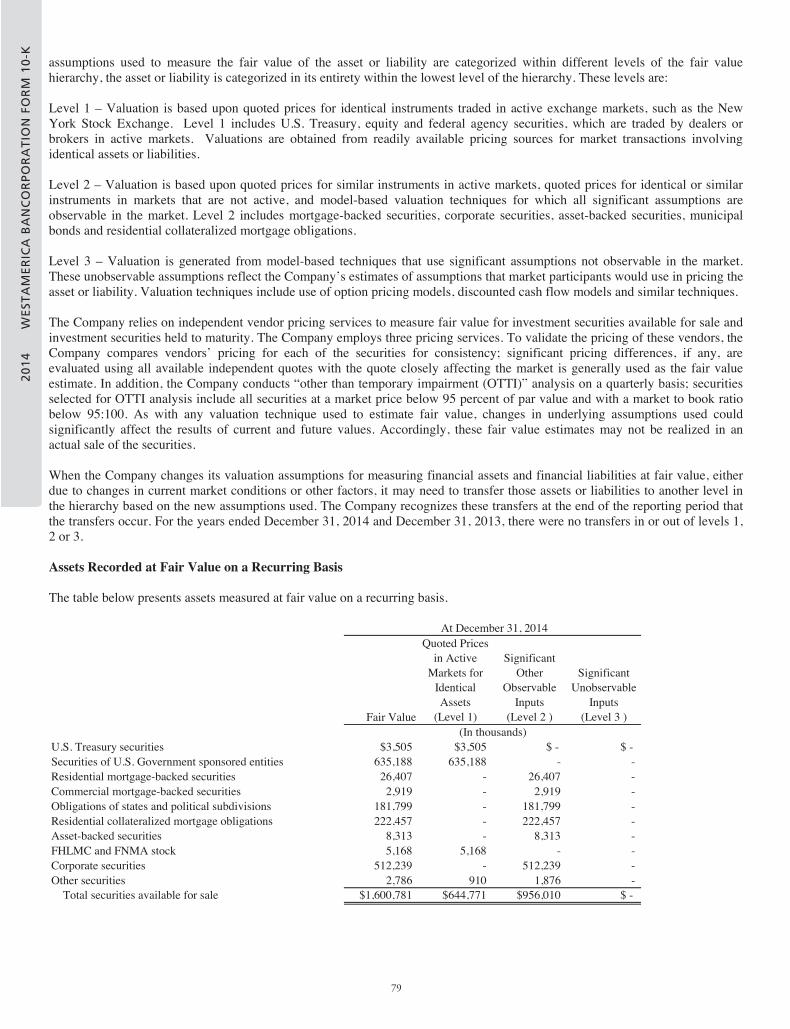
20
14
W
EST
AM
ER
ICA
BA
NC
OR
PO
RA
TIO
N F
OR
M 1
0-K
20
15
W
EST
AM
ER
ICA
BA
NC
OR
PO
RA
TIO
N P
RO
XY
79 - 79 -
assumptions used to measure the fair value of the asset or liability are categorized within different levels of the fair value hierarchy, the asset or liability is categorized in its entirety within the lowest level of the hierarchy. These levels are:
Level 1 – Valuation is based upon quoted prices for identical instruments traded in active exchange markets, such as the New York Stock Exchange. Level 1 includes U.S. Treasury, equity and federal agency securities, which are traded by dealers or brokers in active markets. Valuations are obtained from readily available pricing sources for market transactions involving identical assets or liabilities.
Level 2 – Valuation is based upon quoted prices for similar instruments in active markets, quoted prices for identical or similar instruments in markets that are not active, and model-based valuation techniques for which all significant assumptions are observable in the market. Level 2 includes mortgage-backed securities, corporate securities, asset-backed securities, municipalbonds and residential collateralized mortgage obligations.
Level 3 – Valuation is generated from model-based techniques that use significant assumptions not observable in the market. These unobservable assumptions reflect the Company’s estimates of assumptions that market participants would use in pricing theasset or liability. Valuation techniques include use of option pricing models, discounted cash flow models and similar techniques.
The Company relies on independent vendor pricing services to measure fair value for investment securities available for sale andinvestment securities held to maturity. The Company employs three pricing services. To validate the pricing of these vendors, theCompany compares vendors’ pricing for each of the securities for consistency; significant pricing differences, if any, are evaluated using all available independent quotes with the quote closely affecting the market is generally used as the fair valueestimate. In addition, the Company conducts “other than temporary impairment (OTTI)” analysis on a quarterly basis; securities selected for OTTI analysis include all securities at a market price below 95 percent of par value and with a market to book ratio below 95:100. As with any valuation technique used to estimate fair value, changes in underlying assumptions used could significantly affect the results of current and future values. Accordingly, these fair value estimates may not be realized in anactual sale of the securities.
When the Company changes its valuation assumptions for measuring financial assets and financial liabilities at fair value, eitherdue to changes in current market conditions or other factors, it may need to transfer those assets or liabilities to another level in the hierarchy based on the new assumptions used. The Company recognizes these transfers at the end of the reporting period thatthe transfers occur. For the years ended December 31, 2014 and December 31, 2013, there were no transfers in or out of levels 1,2 or 3.
Assets Recorded at Fair Value on a Recurring Basis
The table below presents assets measured at fair value on a recurring basis.
Fair Value
Quoted Prices in Active
Markets for Identical Assets
(Level 1)
Significant Other
Observable Inputs
(Level 2 )
Significant Unobservable
Inputs(Level 3 )
U.S. Treasury securities $3,505 $3,505 $ - $ - Securities of U.S. Government sponsored entities 635,188 635,188 - - Residential mortgage-backed securities 26,407 - 26,407 - Commercial mortgage-backed securities 2,919 - 2,919 - Obligations of states and political subdivisions 181,799 - 181,799 - Residential collateralized mortgage obligations 222,457 - 222,457 - Asset-backed securities 8,313 - 8,313 - FHLMC and FNMA stock 5,168 5,168 - - Corporate securities 512,239 - 512,239 - Other securities 2,786 910 1,876 - Total securities available for sale $1,600,781 $644,771 $956,010 $ -
(In thousands)
At December 31, 2014

20
14
W
EST
AM
ER
ICA
BA
NC
OR
PO
RA
TIO
N FO
RM
10
-K
20
15
W
EST
AM
ER
ICA
BA
NC
OR
PO
RA
TIO
N P
RO
XY
80
- 80 -
Fair Value
Quoted Prices in Active
Markets for Identical Assets
(Level 1)
Significant Other
Observable Inputs
(Level 2 )
Significant Unobservable
Inputs(Level 3 )
U.S. Treasury securities $3,506 $3,506 $ - $ - Securities of U.S. Government sponsored entities 130,492 130,492 - - Residential mortgage-backed securities 34,176 - 34,176 - Commercial mortgage-backed securities 3,425 - 3,425 - Obligations of states and political subdivisions 191,386 - 191,386 - Residential collateralized mortgage obligations 252,896 - 252,896 - Asset-backed securities 14,555 - 14,555 - FHLMC and FNMA stock 13,372 13,372 - - Corporate securities 432,431 - 432,431 - Other securities 3,142 1,300 1,842 - Total securities available for sale $1,079,381 $148,670 $930,711 $ -
(In thousands)
At December 31, 2013
Assets Recorded at Fair Value on a Nonrecurring Basis
The Company may be required, from time to time, to measure certain assets at fair value on a nonrecurring basis in accordance with GAAP. These adjustments to fair value usually result from application of lower-of-cost or fair-value accounting of individual assets. For assets measured at fair value on a nonrecurring basis that were recorded in the balance sheet at December31, 2014 and December 31, 2013, the following table provides the level of valuation assumptions used to determine each adjustment and the carrying value of the related assets at period end.
For theYear Ended
December 31, 2014Fair Value Level 1 Level 2 Level 3 Total Losses
Other real estate owned $6,374 $ - $6,374 $ - ($358)Impaired loans 17,085 - 7,670 9,415 (884) Total assets measured at fair value on a nonrecurring basis $23,459 $ - $14,044 $9,415 ($1,242)
(In thousands)
At December 31, 2014
For theYear Ended
December 31, 2013Fair Value Level 1 Level 2 Level 3 Total Losses
Other real estate owned $13,320 $ - $13,320 $ - ($814)Impaired loans 9,672 - 7,967 1,705 (233) Total assets measured at fair value on a nonrecurring basis $22,992 $ - $21,287 $1,705 ($1,047)
(In thousands)
At December 31, 2013
Level 2 – Valuation is based upon independent market prices or appraised value of the collateral, less 10% for selling costs, generally. Level 2 includes other real estate owned that has been measured at fair value upon transfer to foreclosed assets andimpaired loans collateralized by real property where a specific reserve has been established or a charge-off has been recorded.Losses on other real estate owned represent losses recognized in earnings during the period subsequent to its initial classification as foreclosed assets.
Level 3 – Valuation is based upon estimated liquidation values of loan collateral. The value of level 3 assets can also include a component of real estate, which is valued as described for level 2 inputs, when collateral for the impaired loan includes both business assets and real estate. Level 3 includes impaired loans where a specific reserve has been established or a charge-off has been recorded.
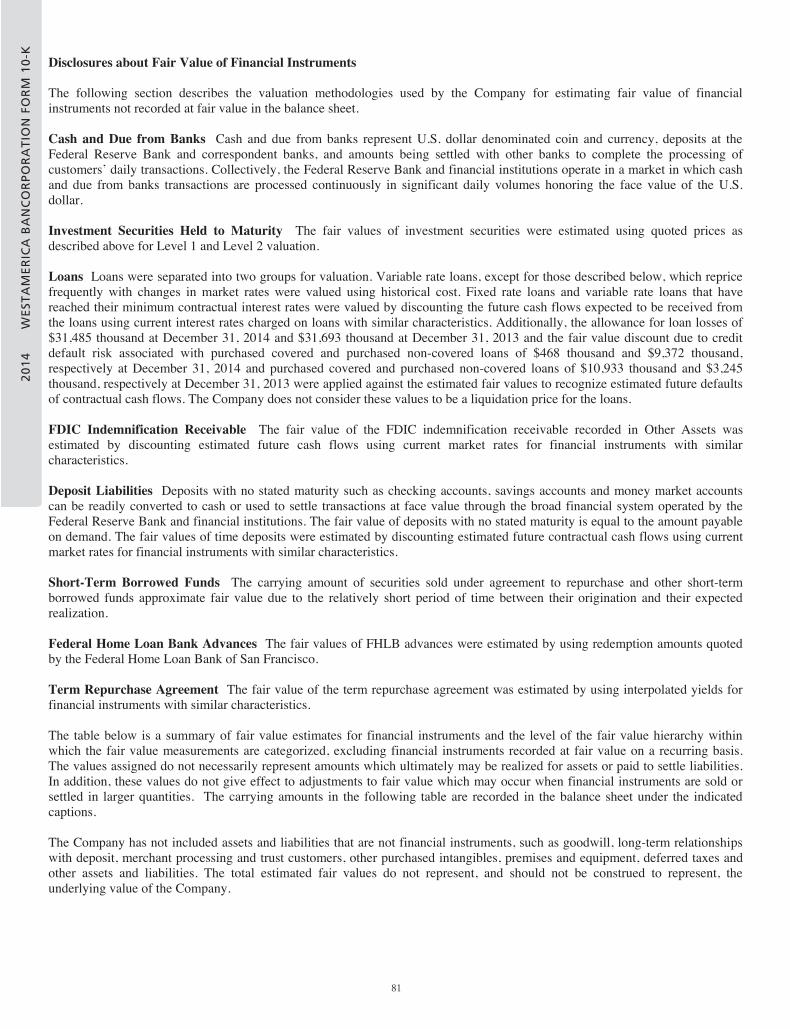
20
14
W
EST
AM
ER
ICA
BA
NC
OR
PO
RA
TIO
N F
OR
M 1
0-K
20
15
W
EST
AM
ER
ICA
BA
NC
OR
PO
RA
TIO
N P
RO
XY
81 - 81 -
Disclosures about Fair Value of Financial Instruments
The following section describes the valuation methodologies used by the Company for estimating fair value of financial instruments not recorded at fair value in the balance sheet.
Cash and Due from Banks Cash and due from banks represent U.S. dollar denominated coin and currency, deposits at the Federal Reserve Bank and correspondent banks, and amounts being settled with other banks to complete the processing of customers’ daily transactions. Collectively, the Federal Reserve Bank and financial institutions operate in a market in which cash and due from banks transactions are processed continuously in significant daily volumes honoring the face value of the U.S. dollar.
Investment Securities Held to Maturity The fair values of investment securities were estimated using quoted prices as described above for Level 1 and Level 2 valuation.
Loans Loans were separated into two groups for valuation. Variable rate loans, except for those described below, which reprice frequently with changes in market rates were valued using historical cost. Fixed rate loans and variable rate loans that have reached their minimum contractual interest rates were valued by discounting the future cash flows expected to be received from the loans using current interest rates charged on loans with similar characteristics. Additionally, the allowance for loan losses of $31,485 thousand at December 31, 2014 and $31,693 thousand at December 31, 2013 and the fair value discount due to credit default risk associated with purchased covered and purchased non-covered loans of $468 thousand and $9,372 thousand, respectively at December 31, 2014 and purchased covered and purchased non-covered loans of $10,933 thousand and $3,245 thousand, respectively at December 31, 2013 were applied against the estimated fair values to recognize estimated future defaultsof contractual cash flows. The Company does not consider these values to be a liquidation price for the loans.
FDIC Indemnification Receivable The fair value of the FDIC indemnification receivable recorded in Other Assets was estimated by discounting estimated future cash flows using current market rates for financial instruments with similar characteristics.
Deposit Liabilities Deposits with no stated maturity such as checking accounts, savings accounts and money market accounts can be readily converted to cash or used to settle transactions at face value through the broad financial system operated by theFederal Reserve Bank and financial institutions. The fair value of deposits with no stated maturity is equal to the amount payable on demand. The fair values of time deposits were estimated by discounting estimated future contractual cash flows using currentmarket rates for financial instruments with similar characteristics.
Short-Term Borrowed Funds The carrying amount of securities sold under agreement to repurchase and other short-term borrowed funds approximate fair value due to the relatively short period of time between their origination and their expected realization.
Federal Home Loan Bank Advances The fair values of FHLB advances were estimated by using redemption amounts quoted by the Federal Home Loan Bank of San Francisco.
Term Repurchase Agreement The fair value of the term repurchase agreement was estimated by using interpolated yields for financial instruments with similar characteristics.
The table below is a summary of fair value estimates for financial instruments and the level of the fair value hierarchy withinwhich the fair value measurements are categorized, excluding financial instruments recorded at fair value on a recurring basis.The values assigned do not necessarily represent amounts which ultimately may be realized for assets or paid to settle liabilities. In addition, these values do not give effect to adjustments to fair value which may occur when financial instruments are sold orsettled in larger quantities. The carrying amounts in the following table are recorded in the balance sheet under the indicatedcaptions.
The Company has not included assets and liabilities that are not financial instruments, such as goodwill, long-term relationshipswith deposit, merchant processing and trust customers, other purchased intangibles, premises and equipment, deferred taxes and other assets and liabilities. The total estimated fair values do not represent, and should not be construed to represent, the underlying value of the Company.

20
14
W
EST
AM
ER
ICA
BA
NC
OR
PO
RA
TIO
N FO
RM
10
-K
20
15
W
EST
AM
ER
ICA
BA
NC
OR
PO
RA
TIO
N P
RO
XY
82
- 82 -
Carrying Amount
Estimated Fair Value
Quoted Prices in Active
Markets for Identical Assets
(Level 1)
Significant Other
Observable Inputs
(Level 2 )
SignificantUnobservable
Inputs(Level 3 )
Financial Assets: Cash and due from banks $380,836 $380,836 $380,836 $ - $ - Investment securities held to maturity 1,038,658 1,048,562 1,077 1,047,485 - Loans 1,668,805 1,685,048 - - 1,685,048
Financial Liabilities: Deposits $4,349,191 $4,348,958 $ - $3,964,048 $384,910 Short-term borrowed funds 89,784 89,784 - 89,784 - Federal Home Loan Bank advances 20,015 20,014 20,014 - -
At December 31, 2014
(In thousands)
Carrying Amount
Estimated Fair Value
Quoted Prices in Active
Markets for Identical Assets
(Level 1)
Significant Other
Observable Inputs
(Level 2 )
SignificantUnobservable
Inputs(Level 3 )
Financial Assets: Cash and due from banks $472,028 $472,028 $472,028 $ - $ - Investment securities held to maturity 1,132,299 1,112,676 1,597 1,111,079 - Loans 1,796,051 1,800,625 - - 1,800,625 Other assets - FDIC indemnification receivable 4,032 4,032 - - 4,032
Financial Liabilities: Deposits $4,163,781 $4,162,935 $ - $3,671,014 $491,921 Short-term borrowed funds 62,668 62,668 - 62,668 - Federal Home Loan Bank advances 20,577 20,558 20,558 - - Term repurchase agreement 10,000 10,054 - 10,054 -
At December 31, 2013
(In thousands)
The majority of the Company’s standby letters of credit and other commitments to extend credit carry current market interest ratesif converted to loans. No premium or discount was ascribed to these commitments because virtually all funding would be at current market rates.
Note 12: Lease Commitments
Thirty-two banking offices and a centralized administrative service center are owned and 68 facilities are leased. Substantially all the leases contain renewal options and provisions for rental increases, principally for cost of living index. The Company also leases certain pieces of equipment.
Minimum future rental payments under noncancelable operating leases as of December 31, 2014 are as follows:
(In thousands) 2015 ................................................................................................................... $7,6912016 ................................................................................................................... 4,453 2017 ................................................................................................................... 3,422 2018 ................................................................................................................... 2,712 2019 ................................................................................................................... 1,288
363 Thereafter................................................................................................................Total minimum lease payments ................................................................................. $19,929
The total minimum lease payments have not been reduced by minimum sublease rentals of $3,702 thousand due in the future under noncancelable subleases. Total rentals for premises were $8,798 thousand in 2014, $8,953 thousand in 2013 and $9,252 thousand in 2012. Total sublease rentals were $1,833 thousand in 2014, $1,852 thousand in 2013 and $1,883 thousand in 2012. Total rentals for premises, net of sublease income, included in noninterest expense were $6,965 thousand in 2014, $7,101 thousand in 2013 and $7,369 thousand in 2012.
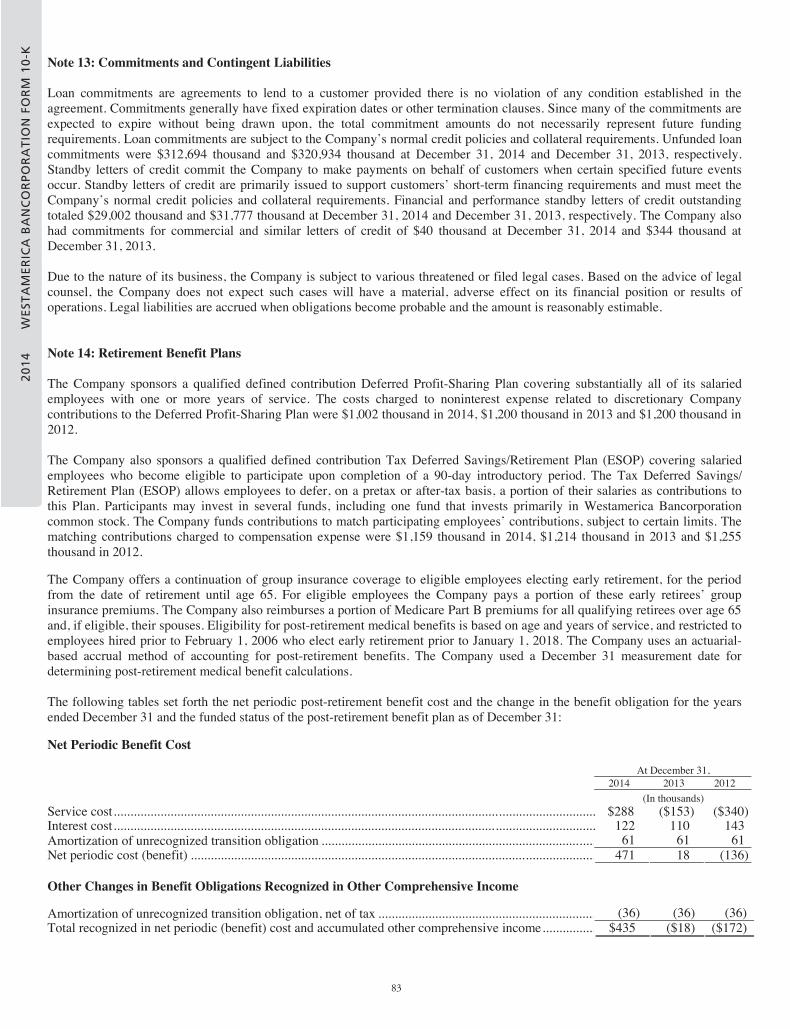
20
14
W
EST
AM
ER
ICA
BA
NC
OR
PO
RA
TIO
N F
OR
M 1
0-K
20
15
W
EST
AM
ER
ICA
BA
NC
OR
PO
RA
TIO
N P
RO
XY
83 - 83 -
Note 13: Commitments and Contingent Liabilities
Loan commitments are agreements to lend to a customer provided there is no violation of any condition established in the agreement. Commitments generally have fixed expiration dates or other termination clauses. Since many of the commitments are expected to expire without being drawn upon, the total commitment amounts do not necessarily represent future funding requirements. Loan commitments are subject to the Company’s normal credit policies and collateral requirements. Unfunded loan commitments were $312,694 thousand and $320,934 thousand at December 31, 2014 and December 31, 2013, respectively. Standby letters of credit commit the Company to make payments on behalf of customers when certain specified future events occur. Standby letters of credit are primarily issued to support customers’ short-term financing requirements and must meet theCompany’s normal credit policies and collateral requirements. Financial and performance standby letters of credit outstanding totaled $29,002 thousand and $31,777 thousand at December 31, 2014 and December 31, 2013, respectively. The Company also had commitments for commercial and similar letters of credit of $40 thousand at December 31, 2014 and $344 thousand at December 31, 2013.
Due to the nature of its business, the Company is subject to various threatened or filed legal cases. Based on the advice of legal counsel, the Company does not expect such cases will have a material, adverse effect on its financial position or results of operations. Legal liabilities are accrued when obligations become probable and the amount is reasonably estimable.
Note 14: Retirement Benefit Plans
The Company sponsors a qualified defined contribution Deferred Profit-Sharing Plan covering substantially all of its salaried employees with one or more years of service. The costs charged to noninterest expense related to discretionary Company contributions to the Deferred Profit-Sharing Plan were $1,002 thousand in 2014, $1,200 thousand in 2013 and $1,200 thousand in 2012.
The Company also sponsors a qualified defined contribution Tax Deferred Savings/Retirement Plan (ESOP) covering salaried employees who become eligible to participate upon completion of a 90-day introductory period. The Tax Deferred Savings/ Retirement Plan (ESOP) allows employees to defer, on a pretax or after-tax basis, a portion of their salaries as contributions to this Plan. Participants may invest in several funds, including one fund that invests primarily in Westamerica Bancorporation common stock. The Company funds contributions to match participating employees’ contributions, subject to certain limits. The matching contributions charged to compensation expense were $1,159 thousand in 2014, $1,214 thousand in 2013 and $1,255 thousand in 2012.
The Company offers a continuation of group insurance coverage to eligible employees electing early retirement, for the period from the date of retirement until age 65. For eligible employees the Company pays a portion of these early retirees’ group insurance premiums. The Company also reimburses a portion of Medicare Part B premiums for all qualifying retirees over age 65 and, if eligible, their spouses. Eligibility for post-retirement medical benefits is based on age and years of service, and restricted to employees hired prior to February 1, 2006 who elect early retirement prior to January 1, 2018. The Company uses an actuarial-based accrual method of accounting for post-retirement benefits. The Company used a December 31 measurement date for determining post-retirement medical benefit calculations.
The following tables set forth the net periodic post-retirement benefit cost and the change in the benefit obligation for the years ended December 31 and the funded status of the post-retirement benefit plan as of December 31:
Net Periodic Benefit Cost
At December 31, 2014 2013 2012
(In thousands) Service cost................................................................................................................................................ $288 ($153) ($340)Interest cost................................................................................................................................................ 122 110 143
61 61 61 Amortization of unrecognized transition obligation ..................................................................................Net periodic cost (benefit) ......................................................................................................................... 471 18 (136)
Other Changes in Benefit Obligations Recognized in Other Comprehensive Income
(36) (36) (36) Amortization of unrecognized transition obligation, net of tax .................................................................Total recognized in net periodic (benefit) cost and accumulated other comprehensive income................ $435 ($18) ($172)

20
14
W
EST
AM
ER
ICA
BA
NC
OR
PO
RA
TIO
N FO
RM
10
-K
20
15
W
EST
AM
ER
ICA
BA
NC
OR
PO
RA
TIO
N P
RO
XY
84
- 84 -
The remaining transition obligation cost for this post-retirement benefit plan that will be amortized from accumulated other comprehensive income into net periodic benefit cost over the next fiscal year is $61 thousand.
Obligation and Funded Status
For the Years Ended December 31, 2014 2013 2012
Change in benefit obligation (In thousands) Benefit obligation at beginning of year ........................................................................................ $2,544 $2,755 $3,117 Service cost................................................................................................................................... 288 (153) (340) Interest cost................................................................................................................................... 122 110 143
(172) (168) (165) $2,782 $2,544 $2,755
Benefits paid.................................................................................................................................Benefit obligation at end of year ..................................................................................................Accumulated post-retirement benefit obligation attributable to:
Retirees ..................................................................................................................................... $1,732 $1,443 $1,654 Fully eligible participants ......................................................................................................... 998 983 856
52 118 245 $2,782 $2,544 $2,755 $— $— $—
Other .........................................................................................................................................Total......................................................................................................................................
Fair value of plan assets................................................................................................................Accumulated post-retirement benefit obligation in excess of plan assets..................................... $2,782 $2,544 $2,755
Additional Information
Assumptions At December 31,
2014 2013 2012 Weighted-average assumptions used to determine benefit obligations as of December 31
Discount rate ........................................................................................................................................ 3.80% 4.80% 4.00% Weighted-average assumptions used to determine net periodic benefit cost as of December 31
Discount rate ........................................................................................................................................ 4.80% 4.00% 4.60%
The above discount rate is based on the Corporate Aa 25-year rate, the term of which approximates the term of the benefit obligations. The Company reserves the right to terminate or alter post-employment health benefits. Post-retirement medical benefits are currently fixed amounts without provision for future increases; as a result, the assumed annual average rate of inflation used to measure the expected cost of benefits covered by this program is zero percent for 2015 and beyond.
Assumed benefit inflation rates are not applicable for this program.
Estimated future benefit payments
(In thousands) 2015 .............................................................................................................. $173 2016 .............................................................................................................. 176 2017 .............................................................................................................. 181 2018 .............................................................................................................. 183 2019 .............................................................................................................. 179 Years 2020-2024........................................................................................... 821
Note 15: Related Party Transactions
Certain of the Directors, executive officers and their associates have had banking transactions with subsidiaries of the Company in the ordinary course of business. With the exception of the Company’s Employee Loan Program, all outstanding loans and commitments included in such transactions were made on substantially the same terms, including interest rates and collateral, asthose prevailing at the time for comparable transactions with other persons, did not involve more than a normal risk of collectability, and did not present other favorable features. As part of the Employee Loan Program, all employees, including executive officers, are eligible to receive mortgage loans at one percent below Westamerica Bank’s prevailing interest rate at the time of loan origination. All loans to executive officers under the Employee Loan Program are made by Westamerica Bank in compliance with the applicable restrictions of Section 22(h) of the Federal Reserve Act.

20
14
W
EST
AM
ER
ICA
BA
NC
OR
PO
RA
TIO
N F
OR
M 1
0-K
20
15
W
EST
AM
ER
ICA
BA
NC
OR
PO
RA
TIO
N P
RO
XY
85 - 85 -
The table below reflects information concerning loans to certain directors and executive officers and/or family members during 2014 and 2013:
2014 2013 (In thousands)
Beginning balance ............................................................................................ $1,013 $1,056 Originations ...................................................................................................... — —
(56) (43) $957 $1,013
Principal reductions ..........................................................................................At December 31,...............................................................................................Percent of total loans outstanding..................................................................... 0.06% 0.06%
Note 16: Regulatory Matters
Payment of dividends to the Company by the Bank is limited under regulations for state chartered banks. The amount that can be paid in any calendar year, without prior approval from regulatory agencies, cannot exceed the net profits (as defined) for the preceding three calendar years less dividends paid. Under this regulation, the Bank obtained approval for dividends paid to theCompany during 2014. The Company consistently has paid quarterly dividends to its shareholders since its formation in 1972.
The Bank is required to maintain reserves with the Federal Reserve Bank equal to a percentage of its reservable deposits. The Bank’s daily average on deposit at the Federal Reserve Bank was $400,039 thousand in 2014 and $304,834 thousand in 2013, which amounts exceed the Bank’s required reserves.
Note 17: Other Comprehensive Income
The components of other comprehensive income (loss) and other related tax effects were:
2014
Before tax Tax effect Net of tax Securities available for sale: (In thousands)
Net unrealized gains arising during the year......................................................................... $1,627 ($684) $943 Reclassification of gains (losses) included in net income..................................................... — — —
Net unrealized gains arising during the year............................................................................. 1,627 (684) 943 Post-retirement benefit obligation............................................................................................ 61 (25) 36 Other comprehensive income ................................................................................................... $1,688 ($709) $979
2013
Before tax Tax effect Net of tax Securities available for sale: (In thousands)
Net unrealized losses arising during the year........................................................................ ($17,855) $7,507 ($10,348) Reclassification of (losses) gains included in net income..................................................... — — —
Net unrealized losses arising during the year............................................................................ (17,855) 7,507 (10,348) Post-retirement benefit obligation............................................................................................ 61 (25) 36 Other comprehensive loss......................................................................................................... ($17,794) $7,482 ($10,312)
2012
Before tax Tax effect Net of tax Securities available for sale: (In thousands)
Net unrealized gains arising during the year......................................................................... $5,557 ($2,337) $3,220 Reclassification of gains (losses) included in net income..................................................... — — —
Net unrealized gains arising during the year............................................................................. 5,557 (2,337) 3,220 Post-retirement benefit obligation......................................................................................... 61 (25) 36
Other comprehensive income ................................................................................................... $5,618 ($2,362) $3,256

20
14
W
EST
AM
ER
ICA
BA
NC
OR
PO
RA
TIO
N FO
RM
10
-K
20
15
W
EST
AM
ER
ICA
BA
NC
OR
PO
RA
TIO
N P
RO
XY
86
- 86 -
Cumulative other comprehensive income (loss) balances were: Post- retirement Benefit Obligation
Net Unrealized gains(losses) on securities
Cumulative Other Comprehensive Income (Loss)
(In thousands) Balance, December 31, 2011 ............................................................................................. ($214) $11,583 $11,369
Net change...................................................................................................................... 36 3,220 3,256 Balance, December 31, 2012 ............................................................................................. (178) 14,803 14,625
Net change...................................................................................................................... 36 (10,348) (10,312) Balance, December 31, 2013 ............................................................................................. (142) 4,455 4,313
Net change...................................................................................................................... 36 943 979 Balance, December 31, 2014 ............................................................................................. ($106) $5,398 $5,292
Note 18: Earnings Per Common Share
The table below shows earnings per common share and diluted earnings per common share. Basic earnings per common share are computed by dividing net income by the average number of common shares outstanding during the period. Diluted earnings per common share are computed by dividing net income by the average number of common shares outstanding during the period plus the impact of common stock equivalents.
2014 2013 2012 For the Years Ended December 31, (In thousands, except per share data)
Net income (numerator).......................................................................................................... $60,646 $67,177 $81,127Basic earnings per common share Weighted average number of common shares outstanding — basic (denominator) .............. 26,099 26,826 27,654
$2.32 $2.50 $2.93Basic earnings per common share...........................................................................................Diluted earnings per common shareWeighted average number of common shares outstanding — basic ...................................... 26,099 26,826 27,654
61 51 45 26,160 26,877 27,699
Add common stock equivalents for options............................................................................Weighted average number of common shares outstanding — diluted (denominator) ...........Diluted earnings per common share........................................................................................ $2.32 $2.50 $2.93
For the years ended December 31, 2014, 2013, and 2012, options to purchase 1,133 thousand, 1,575 thousand and 2,049 thousand shares of common stock, respectively, were outstanding but not included in the computation of diluted earnings per common share because the option exercise price exceeded the fair value of the stock such that their inclusion would have had an anti-dilutive effect.
Note 19: Westamerica Bancorporation (Parent Company Only)
Statements of Income and Comprehensive Income
For the Years Ended December 31, 2014 2013 2012 For the Years Ended December 31,
(In thousands) Dividends from subsidiaries .................................................................................................. $75,369 $88,754 $88,755Interest income ...................................................................................................................... 7 14 8
7,182 8,684 7,90782,558 97,452 96,670
Other income .........................................................................................................................Total income......................................................................................................................
Interest on borrowings........................................................................................................... 42 707 820Salaries and benefits.............................................................................................................. 6,587 7,120 7,090
1,704 2,174 1,7348,333 10,001 9,644
Other expense........................................................................................................................Total expenses ...................................................................................................................
Income before taxes and equity in undistributed income of subsidiaries .............................. 74,225 87,451 87,026Income tax benefit ................................................................................................................. 742 732 1,847
(14,321) (21,006) (7,746)Earnings of subsidiaries less than subsidiary dividends ........................................................Net income ........................................................................................................................ 60,646 67,177 81,127
979 (10,312) 3,256Other comprehensive income (loss), net of tax .....................................................................Comprehensive income ..................................................................................................... $61,625 $56,865 $84,383

20
14
W
EST
AM
ER
ICA
BA
NC
OR
PO
RA
TIO
N F
OR
M 1
0-K
20
15
W
EST
AM
ER
ICA
BA
NC
OR
PO
RA
TIO
N P
RO
XY
87 - 87 -
Balance Sheets
At December 31, 2014 2013
Assets (In thousands)Cash .................................................................................................................................................................... $7,451 $12,839Investment securities available for sale ............................................................................................................... 910 1,300Investment in Westamerica Bank ........................................................................................................................ 490,098 503,219Investment in non-bank subsidiaries.................................................................................................................... 456 457Premises and equipment, net ............................................................................................................................... 9,679 9,932Accounts receivable from Westamerica Bank ..................................................................................................... 323 303
32,974 32,351 $541,891 $560,401
Other assets..........................................................................................................................................................Total assets ......................................................................................................................................................
LiabilitiesAccounts payable to Westamerica Bank.............................................................................................................. $790 $1,583
14,498 15,884Other liabilities ....................................................................................................................................................Total liabilities................................................................................................................................................. 15,288 17,467
526,603 542,934Shareholders’ equity ............................................................................................................................................Total liabilities and shareholders’ equity......................................................................................................... $541,891 $560,401
Statements of Cash Flows
For the Years Ended December 31, 2014 2013 2012
(In thousands) Operating Activities
Net income .......................................................................................................................... $60,646 $67,177 $81,127 Adjustments to reconcile net income to net cash provided by operating activities:
Depreciation and amortization ........................................................................................ 341 312 297 (Increase) decrease in accounts receivable from affiliates .............................................. (17) 26 105 Increase in other assets.................................................................................................... (1,668) (926) (1,960)Stock option compensation expense ............................................................................... 1,318 1,397 1,450Tax benefit decrease upon exercise of stock options....................................................... 447 298 119 Provision (benefit) for deferred income tax .................................................................... 616 (769) (1,306)(Decrease) increase in other liabilities ............................................................................ (814) 2,573 1,182 Earnings of subsidiaries less than subsidiary dividends .................................................. 14,321 21,006 7,746(Gain on sales) Writedown of property and equipment................................................... (88) (259) 1,504
Net cash provided by operating activities................................................................................ 75,102 90,835 90,264 Investing Activities
— — (420)— — (420)
Purchases of premises and equipment ............................................................................Net cash used in investing activities........................................................................................Financing Activities
Net reductions in debt financing ..................................................................................... — (15,000) — Exercise of stock options/issuance of shares ................................................................... 12,396 21,499 7,635 Tax benefit decrease upon exercise of stock options....................................................... (447) (298) (119)Retirement of common stock including repurchases....................................................... (52,678) (57,320) (51,499)
(39,761) (40,096) (41,005) (80,490) (91,215) (84,988)
Dividends ........................................................................................................................Net cash used in financing activities .......................................................................................Net change in cash................................................................................................................... (5,388) (380) 4,856
12,839 13,219 8,363 $7,451 $12,839 $13,219
Cash at beginning of year........................................................................................................Cash at end of year ..................................................................................................................Supplemental Cash Flow Disclosures: Supplemental disclosure of cash flow activity:
Interest paid for the period .............................................................................................. $42 $840 $1,105 Income tax payments for the period ................................................................................ 16,412 22,562 34,111

20
14
W
EST
AM
ER
ICA
BA
NC
OR
PO
RA
TIO
N FO
RM
10
-K
20
15
W
EST
AM
ER
ICA
BA
NC
OR
PO
RA
TIO
N P
RO
XY
88
- 88 -
Note 20: Quarterly Financial Information (Unaudited)
For the Three Months Ended March 31, June 30, September 30, December 31,
(In thousands, except per share data and price range of common stock)
2014 Interest and loan fee income......................................................... $35,564 $35,403 $34,900 $34,342Net interest income ...................................................................... 34,666 34,503 34,054 33,542Provision for credit losses ............................................................ 1,000 1,000 600 200Noninterest income ..................................................................... 12,990 13,198 13,054 12,545Noninterest expense ..................................................................... 26,873 26,957 26,616 26,353Income before taxes ..................................................................... 19,783 19,744 19,892 19,534Net income ................................................................................... 15,307 15,157 15,154 15,028Basic earnings per common share................................................ 0.58 0.58 0.58 0.58Diluted earnings per common share............................................. 0.58 0.58 0.58 0.58Dividends paid per common share ............................................... 0.38 0.38 0.38 0.38
48.36-56.51 47.85-55.34 46.12-53.93 42.71-51.24Price range, common stock ..........................................................2013 Interest and loan fee income......................................................... $40,465 $39,269 $37,956 $36,706Net interest income ...................................................................... 39,213 38,050 36,780 35,682Provision for credit losses ............................................................ 2,800 1,800 1,800 1,600Noninterest income ...................................................................... 14,278 14,284 14,419 14,030Noninterest expense ..................................................................... 28,677 28,192 27,758 27,987Income before taxes ..................................................................... 22,014 22,342 21,641 20,125Net income ................................................................................... 17,271 17,112 16,738 16,056Basic earnings per share............................................................... 0.64 0.64 0.63 0.60Diluted earnings per share............................................................ 0.64 0.64 0.63 0.60Dividends paid per share.............................................................. 0.37 0.37 0.37 0.38
42.59-45.80 41.76-46.56 45.73-50.78 48.29-57.59Price range, common stock ..........................................................2012 Interest and loan fee income......................................................... $48,298 $46,901 $45,272 $42,893Net interest income ...................................................................... 46,739 45,429 43,890 41,562Provision for credit losses ............................................................ 2,800 2,800 2,800 2,800Noninterest income ...................................................................... 14,669 13,533 14,626 14,194Noninterest expense ..................................................................... 30,034 29,349 29,269 28,233Income before taxes ..................................................................... 28,574 26,813 26,447 24,723Net income ................................................................................... 21,005 20,964 20,022 19,136Basic earnings per share............................................................... 0.75 0.76 0.73 0.70Diluted earnings per share............................................................ 0.75 0.75 0.73 0.70Dividends paid per share.............................................................. 0.37 0.37 0.37 0.37Price range, common stock .......................................................... 43.90-49.53 43.01-48.62 44.08-49.39 40.50-47.72
[The remainder of this page intentionally left blank]

20
14
W
EST
AM
ER
ICA
BA
NC
OR
PO
RA
TIO
N F
OR
M 1
0-K
20
15
W
EST
AM
ER
ICA
BA
NC
OR
PO
RA
TIO
N P
RO
XY
89 - 89 -
REPORT OF INDEPENDENT REGISTERED PUBLIC ACCOUNTING FIRM
The Board of Directors and Shareholders Westamerica Bancorporation:
We have audited the accompanying consolidated balance sheets of Westamerica Bancorporation and subsidiaries (the Company) as of December 31, 2014 and 2013, and the related consolidated statements of income, comprehensive income, changes in shareholders’ equity, and cash flows for each of the years in the three-year period ended December 31, 2014. These consolidatedfinancial statements are the responsibility of the Company’s management. Our responsibility is to express an opinion on these consolidated financial statements based on our audits.
We conducted our audits in accordance with the standards of the Public Company Accounting Oversight Board (United States). Those standards require that we plan and perform the audit to obtain reasonable assurance about whether the financial statementsare free of material misstatement. An audit includes examining, on a test basis, evidence supporting the amounts and disclosuresin the financial statements. An audit also includes assessing the accounting principles used and significant estimates made by management, as well as evaluating the overall financial statement presentation. We believe that our audits provide a reasonablebasis for our opinion.
In our opinion, the consolidated financial statements referred to above present fairly, in all material respects, the financial position of the Company as of December 31, 2014 and 2013, and the results of their operations and their cash flows for each of the yearsin the three-year period ended December 31, 2014, in conformity with U.S. generally accepted accounting principles.
We also have audited, in accordance with the standards of the Public Company Accounting Oversight Board (United States), Westamerica Bancorporation’s internal control over financial reporting as of December 31, 2014, based on criteria established inInternal Control – Integrated Framework (1992) issued by the Committee of Sponsoring Organizations of the Treadway Commission (COSO), and our report dated February 27, 2015 expressed an unqualified opinion on the effectiveness of the Company’s internal control over financial reporting.
/s/ KPMG LLPKPMG LLP
San Francisco, California February 27, 2015

20
14
W
EST
AM
ER
ICA
BA
NC
OR
PO
RA
TIO
N FO
RM
10
-K
20
15
W
EST
AM
ER
ICA
BA
NC
OR
PO
RA
TIO
N P
RO
XY
90
- 90 -
ITEM 9. CHANGES IN AND DISAGREEMENTS WITH ACCOUNTANTS ON ACCOUNTING AND FINANCIAL DISCLOSURE
None.
ITEM 9A. CONTROLS AND PROCEDURES
The Company’s principal executive officer and principal financial officer have evaluated the effectiveness of the Company’s “disclosure controls and procedures,” as such term is defined in Rule 13a-15(e) of the Securities Exchange Act of 1934, as amended, as of December 31, 2014.
Based upon their evaluation, the principal executive officer and principal financial officer concluded that the Company’s disclosure controls and procedures are effective to ensure that material information required to be disclosed by the Company inthe reports that it files or submits under the Exchange Act is recorded, processed, summarized and reported as and when requiredand that such information is communicated to the Company’s management, including the principal executive officer and the principal financial officer, to allow for timely decisions regarding required disclosures. The evaluation did not identify any change in the Company’s internal control over financial reporting that occurred during the quarter ended December 31, 2014 that has materially affected, or is reasonably likely to materially affect, the Company’s internal control over financial reporting. Management’s Report on Internal Control Over Financial Reporting and the attestation Report of Independent Registered Public Accounting Firm are found on pages 48 - 49, immediately preceding the financial statements.
ITEM 9B. OTHER INFORMATION
None.
[The remainder of this page intentionally left blank]

20
14
W
EST
AM
ER
ICA
BA
NC
OR
PO
RA
TIO
N F
OR
M 1
0-K
20
15
W
EST
AM
ER
ICA
BA
NC
OR
PO
RA
TIO
N P
RO
XY
91 - 91 -
PART III
ITEM 10. DIRECTORS, EXECUTIVE OFFICERS OF THE REGISTRANT AND CORPORATE GOVERNANCE
The information regarding Directors of the Registrant and compliance with Section 16(a) of the Securities Exchange Act of 1934 required by this Item 10 of this Annual Report on Form 10-K is incorporated by reference from the information contained under the captions “Board of Directors and Committees”, “Proposal 1 — Election of Directors” and “Section 16(a) Beneficial Ownership Reporting Compliance” in the Company’s Proxy Statement for its 2015 Annual Meeting of Shareholders which will be filed pursuant to Regulation 14A of the Securities Exchange Act of 1934.
Executive Officers
The executive officers of the Company and Westamerica Bank serve at the pleasure of the Board of Directors and are subject to annual appointment by the Board at its first meeting following the Annual Meeting of Shareholders. It is anticipated that each ofthe executive officers listed below will be reappointed to serve in such capacities at that meeting.
Name of Executive Position Held Since
David L. Payne Mr. Payne, born in 1955, is the Chairman of the Board, President and Chief Executive Officer of the Company. Mr. Payne is President and Chief Executive Officer of Gibson Printing and Publishing Company and Gibson Radio and Publishing Company which are newspaper, commercial printing and real estate investment companies headquartered in Vallejo, California.
1984
John “Robert” Thorson Mr. Thorson, born in 1960, is Senior Vice President and Chief Financial Officer for the Company. Mr. Thorson joined Westamerica Bancorporation in 1989, was Vice President and Manager of Human Resources from 1995 until 2001 and was Senior Vice President and Treasurer from 2002 until 2005.
2005
Dennis R. Hansen Mr. Hansen, born in 1950, is Senior Vice President and Manager of the Operations and Systems Administration of Community Banker Services Corporation. Mr. Hansen joined Westamerica Bancorporation in 1978 and was Senior Vice President and Controller for the Company until 2005.
2005
David L. Robinson Mr. Robinson, born in 1959, is Senior Vice President and Banking Division Manager of Westamerica Bank. Mr. Robinson joined Westamerica Bancorporation in 1993 and has held several banking positions, most recently, Senior Vice President and Southern Banking Division Manager until 2007.
2007
Russell W. Rizzardi Mr. Rizzardi, born in 1955, is Senior Vice President and Chief Credit Administrator of Westamerica Bank. Mr. Rizzardi joined Westamerica Bank in 2007. He has been in the banking industry since 1979 and was previously with Wells Fargo Bank and U.S. Bank.
2008
The Company has adopted a Code of Ethics (as defined in Item 406 of Regulation S-K of the Securities Act of 1933) that is applicable to its senior financial officers including its chief executive officer, chief financial officer, and principal accounting officer.
ITEM 11. EXECUTIVE COMPENSATION
The information required by this Item 11 of this Annual Report on Form 10-K is incorporated by reference from the information contained under the captions “Executive Compensation” in the Company’s Proxy Statement for its 2015 Annual Meeting of Shareholders which will be filed pursuant to Regulation 14A of the Securities Exchange Act of 1934.
[The remainder of this page intentionally left blank]

20
14
W
EST
AM
ER
ICA
BA
NC
OR
PO
RA
TIO
N FO
RM
10
-K
20
15
W
EST
AM
ER
ICA
BA
NC
OR
PO
RA
TIO
N P
RO
XY
92
- 92 -
ITEM 12. SECURITY OWNERSHIP OF CERTAIN BENEFICIAL OWNERS AND MANAGEMENT AND RELATED STOCKHOLDER MATTERS
The information required by this Item 12 of this Annual Report on Form 10-K is incorporated by reference from the information contained under the caption “Stock Ownership” in the Company’s Proxy Statement for its 2015 Annual Meeting of Shareholders which will be filed pursuant to Regulation 14A of the Securities Exchange Act of 1934.
Securities Authorized For Issuance Under Equity Compensation Plans
The following table summarizes the status of the Company’s equity compensation plans as of December 31, 2014 (in thousands, except exercise price):
Plan category Number of securities
to be issued upon exercise of outstanding options, warrants and rights
Weighted-average exercise price of outstanding options, warrants and rights
Number of securities remaining available for future issuance under equity compensation plans (excluding securities reflected in column (a))
(a) (b) (c) Equity compensation plans approved by security holders ............. 1,889 $50 1,232 Equity compensation plans not approved by security holders ....... — N/A — Total............................................................................................... 1,889 $50 1,232
ITEM 13. CERTAIN RELATIONSHIPS, RELATED TRANSACTIONS AND DIRECTOR INDEPENDENCE
The information required by this Item 13 of this Annual Report on Form 10-K is incorporated by reference from the information contained under the caption “Certain Relationships and Related Party Transactions” in the Company’s Proxy Statement for its 2015 Annual Meeting of Shareholders which will be filed pursuant to Regulation 14A of the Securities Exchange Act of 1934.
ITEM 14. PRINCIPAL ACCOUNTANT FEES AND SERVICES
The information required by this Item 14 of this Annual Report on Form 10-K is incorporated by reference from the information contained under the caption “Proposal 3 – Ratify Selection of Independent Auditor” in the Company’s Proxy Statement for its 2015 Annual Meeting of Shareholders which will be filed pursuant to Regulation 14A of the Securities Exchange Act of 1934.
PART IV
ITEM 15. EXHIBITS AND FINANCIAL STATEMENT SCHEDULES
(a) 1. Financial Statements:
See Index to Financial Statements on page 47. The financial statements included in Item 8 are filed as part of this report.
(a) 2. Financial statement schedules required. No financial statement schedules are filed as part of this report since the required information is included in the consolidated financial statements, including the notes thereto, or the circumstances requiring inclusion of such schedules are not present.
(a) 3. Exhibits:
The exhibit list required by this item is incorporated by reference to the Exhibit Index filed with this report.
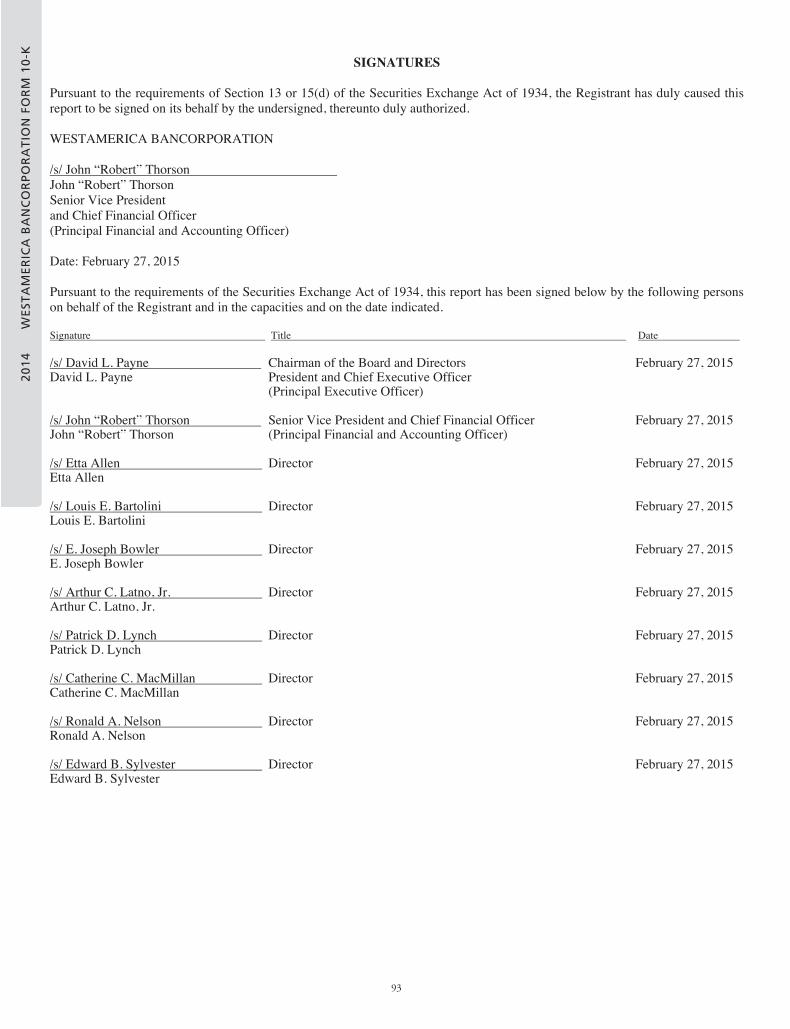
20
14
W
EST
AM
ER
ICA
BA
NC
OR
PO
RA
TIO
N F
OR
M 1
0-K
20
15
W
EST
AM
ER
ICA
BA
NC
OR
PO
RA
TIO
N P
RO
XY
93 - 93 -
SIGNATURES
Pursuant to the requirements of Section 13 or 15(d) of the Securities Exchange Act of 1934, the Registrant has duly caused thisreport to be signed on its behalf by the undersigned, thereunto duly authorized.
WESTAMERICA BANCORPORATION
/s/ John “Robert” Thorson John “Robert” Thorson Senior Vice President and Chief Financial Officer (Principal Financial and Accounting Officer)
Date: February 27, 2015
Pursuant to the requirements of the Securities Exchange Act of 1934, this report has been signed below by the following personson behalf of the Registrant and in the capacities and on the date indicated.
Signature Title Date
/s/ David L. Payne David L. Payne
Chairman of the Board and Directors President and Chief Executive Officer (Principal Executive Officer)
February 27, 2015
/s/ John “Robert” Thorson John “Robert” Thorson
Senior Vice President and Chief Financial Officer (Principal Financial and Accounting Officer)
February 27, 2015
/s/ Etta Allen Etta Allen
Director February 27, 2015
/s/ Louis E. Bartolini Louis E. Bartolini
Director February 27, 2015
/s/ E. Joseph Bowler E. Joseph Bowler
Director February 27, 2015
/s/ Arthur C. Latno, Jr. Arthur C. Latno, Jr.
Director February 27, 2015
/s/ Patrick D. Lynch Patrick D. Lynch
Director February 27, 2015
/s/ Catherine C. MacMillan Catherine C. MacMillan
Director February 27, 2015
/s/ Ronald A. Nelson Ronald A. Nelson
Director February 27, 2015
/s/ Edward B. Sylvester Edward B. Sylvester
Director February 27, 2015

20
14
W
EST
AM
ER
ICA
BA
NC
OR
PO
RA
TIO
N FO
RM
10
-K
20
15
W
EST
AM
ER
ICA
BA
NC
OR
PO
RA
TIO
N P
RO
XY
94
EXHIBIT INDEX
Exhibit Number 3(a) Restated Articles of Incorporation (composite copy), incorporated by reference to Exhibit 3(a) to the Registrant’s
Annual Report on Form 10-K for the fiscal year ended December 31, 1997, filed with the Securities and Exchange Commission on March 30, 1998.
3(b) By-laws, as amended (composite copy), incorporated by reference to Exhibit 3(b) to the Registrant’s Annual Report on Form 10-K for the fiscal year ended December 31, 2009, filed with the Securities and Exchange Commission on February 26, 2010.
3(c) Certificate of Determination of Fixed Rate Cumulative Perpetual preferred Stock, Series A of Westamerica Bancorporation dated February 10, 2009, incorporated by reference to Exhibit 99.1 to the Registrant’s Form 8-K, filed with the Securities and Exchange Commission on February 13, 2009.
4(c) Warrant to Purchase Common Stock pursuant to the Letter Agreement between the Company and the United States Department of the Treasury dated February 13, 2009 incorporated by reference to Exhibit 4.2 to the Registrant’s Form 8-K, filed with the Securities and Exchange Commission on February 19, 2009.
10(a)* Amended and Restated Stock Option Plan of 1995, incorporated by reference to Exhibit A to the Registrant’s definitive Proxy Statement pursuant to Regulation 14(a) filed with the Securities and Exchange Commission on March 17, 2003.
10(d)* Westamerica Bancorporation Chief Executive Officer Deferred Compensation Agreement by and between Westamerica Bancorporation and David L. Payne, dated December 18, 1998 incorporated by reference to Exhibit 10(e) to the Registrant’s Annual Report on Form 10-K for the fiscal year ended December 31, 1999, filed with the Securities and Exchange Commission on March 29, 2000.
10(e)* Description of Executive Cash Bonus Program incorporated by reference to Exhibit 10(e) to Exhibit 2.1 of Registrant’s Form 8-K filed with the Securities and Exchange Commission on March 11, 2005.
10(f)* Non-Qualified Annuity Performance Agreement with David L. Payne dated November 19, 1997 incorporated by reference to Exhibit 10(f) to the Registrant’s Annual Report on Form 10-K for the fiscal year ended December 31, 2004, filed with the Securities and Exchange Commission on March 15, 2005.
10(g)* Amended and Restated Westamerica Bancorporation Stock Option Plan of 1995 Nonstatutory Stock Option Agreement Form incorporated by reference to Exhibit 10(g) to the Registrant’s Annual Report on Form 10-K for the fiscal year ended December 31, 2004, filed with the Securities and Exchange Commission on March 15, 2005.
10(h)* Amended and Restated Westamerica Bancorporation Stock Option Plan of 1995 Restricted Performance Share Grant Agreement Form incorporated by reference to Exhibit 10(h) to the Registrant’s Annual Report on Form 10-K for the fiscal year ended December 31, 2004, filed with the Securities and Exchange Commission on March 15, 2005.
10(i)* Amended Westamerica Bancorporation and Subsidiaries Deferred Compensation Plan (As restated effective January 1, 2005) dated December 31, 2008 incorporated by reference to Exhibit 10(i) to the Registrant’s Annual Report on Form 10-K for the fiscal year ended December 31, 2008, filed with the Securities and Exchange Commission on February 27, 2009.
10(j)* Amended and Restated Westamerica Bancorporation Deferral Plan (Adopted October 26, 1995) dated December 31, 2008 incorporated by reference to Exhibit 10(j) to the Registrant’s Annual Report on Form 10-K for the fiscal year ended December 31, 2008, filed with the Securities and Exchange Commission on February 27, 2009.
10(k)* Form of Restricted Performance Share Deferral Election pursuant to the Westamerica Bancorporation Deferral Plan incorporated by reference to Exhibit 10(i) to the Registrant’s Annual Report on Form 10-K for the fiscal year ended December 31, 2005, filed with the Securities and Exchange Commission on March 10, 2006.
10(l) Purchase and Assumption Agreement by and between Federal Deposit Insurance Corporation and Westamerica Bank dated February 6, 2009, incorporated by reference to Exhibit 99.2 to the Registrant’s Form 8-K, filed with the Securities and Exchange Commission on February 11, 2009.
10(m) Letter Agreement between the Company and the United States Department of the Treasury dated February 13, 2009 incorporated by reference to Exhibit 10.1 to the Registrant’s Form 8-K, filed with the Securities and Exchange Commission on February 19, 2009.
10(r) Data Processing Agreement by and between Fidelity Information Services and Westamerica Bancorporationincorporated by reference to Exhibit 10(r) to the Registrant’s Annual Report on Form 10-K for the fiscal year ended December 31, 2011, filed with the Securities and Exchange Commission on February 27, 2012.
10(s)* Amended and Restated Stock Option Plan of 1995, incorporated by reference to Exhibit A to the Registrant’s definitive Proxy Statement pursuant to Regulation 14(a) filed with the Securities and Exchange Commission on March 13, 2012.
11.1 Statement re computation of per share earnings incorporated by reference to Note 18 of the Notes to the Consolidated Financial Statements of this report.
14 Code of Ethics incorporated by reference to Exhibit 14 to the Registrant’s Annual Report on Form 10-K for the fiscal year ended December 31, 2003, filed with the Securities and Exchange Commission on March 10, 2004.
21 Subsidiaries of the registrant. 23(a) Consent of KPMG LLP 31.1 Certification of Chief Executive Officer pursuant to Securities Exchange Act Rule 13a-14(a)/15d-14(a) 31.2 Certification of Chief Financial Officer pursuant to Securities Exchange Act Rule 13a-14(a)/15d-14(a) 32.1 Certification of Chief Executive Officer pursuant to 18 U.S.C. Section 1350, as adopted pursuant to Section 906 of

20
14
W
EST
AM
ER
ICA
BA
NC
OR
PO
RA
TIO
N F
OR
M 1
0-K
20
15
W
EST
AM
ER
ICA
BA
NC
OR
PO
RA
TIO
N P
RO
XY
95
the Sarbanes-Oxley Act of 2002 32.2 Certification of Chief Financial Officer pursuant to 18 U.S.C. Section 1350, as adopted pursuant to Section 906 of
the Sarbanes-Oxley Act of 2002 101** Pursuant to Rule 405 of Regulation S-T, the following financial information from the Company’s Annual Report
on Form 10-K for the period ended December 31, 2014, is formatted in XBRL interactive data files: (i) Consolidated Statements of Income for each of the years in the three-year period ended December 31, 2014; (ii) Consolidated Balance Sheets at December 31, 2014, and December 31, 2013; (iii) Consolidated Statements of Comprehensive Income for each of the years in the three-year period ended December 31, 2014, (iv) ConsolidatedStatements of Changes in Shareholders’ Equity for each of the years in the three-year period ended December 31, 2014; (v) Consolidated Statements of Cash Flows for each of the years in the three-year period ended December 31, 2014 and (vi) Notes to Consolidated Financial Statements.
____________ * Indicates management contract or compensatory plan or arrangement. ** As provided in Rule 406T of Regulation S-T, this information is furnished and not filed for purposes of Sections 11 and 12
of the Securities Act of 1933 and Section 18 of the Securities Exchange Act of 1934.
The Company will furnish to shareholders a copy of any exhibit listed above, but not contained herein, upon written request to the Office of the Corporate Secretary A-2M, Westamerica Bancorporation, P.O. Box 1200, Suisun City, California 94585-1200, and payment to the Company of $.25 per page.
[The remainder of this page intentionally left blank]

Corporate Information
Corporate ProfileWestamerica Bancorporation (Nasdaq:WABC) operates as a holding company for Westamerica Bank, a community bank serving 21 Northern and Central California counties.
Westamerica Bancorporation Headquarters1108 Fifth Avenue, San Rafael, CA 94901Telephone (415) 257-8000www.westamerica.com
Subsidiary BankWestamerica Bank1108 Fifth Avenue, San Rafael, CA 94901Telephone (415) 257-8000
Notice of Annual MeetingThursday, April 23, 2015 at 11:00 a.m. PTHilton Garden Inn2200 Gateway Court, Fairfield, CA 94533
Transfer AgentComputershare Investor Services LLCTelephone (877) 588-4258 (Toll-free)www.computershare.com/investor
Stock ListingThe NASDAQ Global Select Market, Symbol: WABC
Dividend Reinvestment and Stock Purchase PlanWestamerica Bancorporation offers a dividend reinvestment and stock purchase program whereby registered shareholders may reinvest their dividends in and/or purchase additional shares of the Company’s stock. Information concerning this optionalprogram is available from: Computershare Investor Services LLC Telephone (877) 588-4258 (Toll-free)
Annual Report CopiesWestamerica Bancorporation will provide its security holders, without charge, a copy of its 2014 Annual Report on Form 10-K, including the financial statements and schedules thereto,as filed with the Securities and Exchange Commission. Requests for copies of this annual report should be directed to: Westamerica Bancorporation, Investor Relations, A-2B Post Office Box 1250, Suisun City, CA 94585-1250 Telephone (707) 863-6992 E-mail: [email protected] www.westamerica.com
Westamerica Bancorporation and Westamerica Bank Board of DirectorsDavid L. Payne, Chairman, President and Chief Executive Officer, Westamerica Bancorporation; President and General Manager, Gibson PublicationsEtta Allen, President, Allen Heating and Sheet MetalLouis E. Bartolini, Retired Merrill Lynch ExecutiveE. Joseph Bowler, Retired Senior Vice President and Treasurer, Westamerica BancorporationArthur C. Latno, Jr., Retired Executive Vice President, Pacific Telesis CompanyPatrick D. Lynch, Consultant, High Technology CompaniesCatherine C. MacMillan, Retired AttorneyRonald A. Nelson, InvestmentsEdward B. Sylvester, Consulting Civil Engineer
Westamerica Bancorporation Corporate OfficersDavid L. Payne, Chairman, President and Chief Executive Officer
Dennis R. Hansen, Senior Vice President Operations and SystemsRussell Rizzardi, Senior Vice President Credit AdministrationDavid L. Robinson, Senior Vice President Banking DivisionJames J. Schneck, Vice President and General AuditorRobert A. Thorson, Senior Vice President and Chief Financial Officer
Westamerica Bank Management OfficersDavid L. Payne, Chairman, President and Chief Executive OfficerDennis R. Hansen, Senior Vice President Operations and SystemsRussell Rizzardi, Senior Vice President Credit AdministrationDavid L. Robinson, Senior Vice President Banking DivisionRobert A. Thorson, Senior Vice President and Chief Financial Officer

1108 Fifth Avenue
San Rafael, CA 94901
www.westamerica.com