western maricopa education center district no. 402
TRANSCRIPT

WESTERN MARICOPA EDUCATION CENTER DISTRICT NO. 402
Comprehensive Annual Financial Report
Fiscal Year Ended June 30, 2019
5487 North 99th Avenue ▪ Glendale, Arizona 85305

WESTERN MARICOPA EDUCATION CENTER DISTRICT NO. 402
GLENDALE, ARIZONA
COMPREHENSIVE ANNUAL FINANCIAL REPORT FOR THE FISCAL YEAR ENDED JUNE 30, 2019
Issued by: Business and Finance Department

WESTERN MARICOPA EDUCATION CENTER DISTRICT NO. 402
TABLE OF CONTENTS
INTRODUCTORY SECTION Page Letter of Transmittal 1 ASBO Certificate of Excellence 6 GFOA Certificate of Achievement 7 Organization Chart 8 List of Principal Officials 9 FINANCIAL SECTION INDEPENDENT AUDITOR’S REPORT 13 MANAGEMENT’S DISCUSSION AND ANALYSIS (MD&A) 17 BASIC FINANCIAL STATEMENTS
Government-Wide Financial Statements:
Statement of Net Position 30 Statement of Activities 31
Fund Financial Statements: Balance Sheet – Governmental Funds 34 Reconciliation of the Balance Sheet –
Governmental Funds to the Statement of Net Position 37 Statement of Revenues, Expenditures and Changes in Fund Balances –
Governmental Funds 38 Reconciliation of the Statement of Revenues, Expenditures and
Changes in Fund Balances – Governmental Funds to the Statement of Activities 40

WESTERN MARICOPA EDUCATION CENTER DISTRICT NO. 402
TABLE OF CONTENTS
FINANCIAL SECTION Page BASIC FINANCIAL STATEMENTS
Statement of Net Position – Proprietary Funds 41 Statement of Revenues, Expenses and Changes in Fund Net Position –
Proprietary Funds 42
Statement of Cash Flows – Proprietary Funds 43 Statement of Assets and Liabilities – Fiduciary Funds 44
Notes to Financial Statements 45
REQUIRED SUPPLEMENTARY INFORMATION Schedule of Revenues Expenditures and Changes in Fund Balances –
Budget and Actual: General Fund 70
Pension Schedules 71
OPEB Schedules 72 Notes to Required Supplementary Information 74
COMBINING AND INDIVIDUAL FUND FINANCIAL STATEMENTS AND
SCHEDULES Special Revenue Funds:
Combining Balance Sheet 78 Combining Statement of Revenues, Expenditures and Changes in
Fund Balances 82
Combining Schedule of Revenues, Expenditures and Changes in Fund Balances - Budget and Actual 86

WESTERN MARICOPA EDUCATION CENTER DISTRICT NO. 402
TABLE OF CONTENTS
FINANCIAL SECTION Page COMBINING AND INDIVIDUAL FUND FINANCIAL STATEMENTS AND
SCHEDULES Debt Service Fund:
Schedule of Revenues, Expenditures and Changes in Fund Balance – Budget and Actual 98
Capital Projects Funds:
Combining Schedule of Revenues, Expenditures and Changes in
Fund Balance – Budget and Actual 100
Agency Fund:
Combining Statement of Assets and Liabilities 104 Combining Statement of Changes in Assets and Liabilities 105
STATISTICAL SECTION Financial Trends:
Net Position by Component 108 Expenses, Program Revenues, and Net (Expense)/Revenue 109 General Revenues and Total Changes in Net Position 111 Fund Balances – Governmental Funds 113 Governmental Funds Revenues 115 Governmental Funds Expenditures and Debt Service Ratio 117 Other Financing Sources and Uses and Net Changes in Fund Balances – Governmental Funds 119
Revenue Capacity:
Net Limited Assessed Value and Full Cash Value of Taxable Property by Class 120 Net Full Cash Assessed Value of Taxable Property by Class 121

WESTERN MARICOPA EDUCATION CENTER DISTRICT NO. 402
TABLE OF CONTENTS
STATISTICAL SECTION Page Property Tax Assessment Ratios 122 Direct and Overlapping Property Tax Rates 123 Principal Property Taxpayers 124 Property Tax Levies and Collections 125
Debt Capacity:
Outstanding Debt by Type 126
Direct and Overlapping Governmental Activities Debt 127 Direct and Overlapping General Bonded Debt Ratios 128 Legal Debt Margin Information 129
Demographic and Economic Information:
County-Wide Demographic and Economic Statistics 130 Principal Employers 131
Operating Information: Full-Time Equivalent District Employees by Type 132 Operating Statistics 134
Capital Assets Information 135

(This page intentionally left blank)

INTRODUCTORY SECTION

(This page intentionally left blank)

623.738.0012 Western Maricopa Education Center www.west-mec.org 5487 North 99th Avenue Glendale, AZ 85305
December 19, 2019 Citizens and Governing Board Western Maricopa Education Center District No. 402 5487 North 99th Avenue Glendale, Arizona 85305 State law mandates that school districts required to undergo an annual audit publish a complete set of financial statements presented in conformity with accounting principles generally accepted in the United States of America and audited in accordance with auditing standards generally accepted in the United States by a certified public accounting firm licensed in the State of Arizona. Pursuant to that requirement, we hereby issue the comprehensive annual financial report of the Western Maricopa Education Center District No. 402 (District) for the fiscal year ended June 30, 2019.
This report consists of management’s representations concerning the finances of the District. Consequently, management assumes full responsibility for the completeness and reliability of all of the information presented in this report. To provide a reasonable basis for making these representations, management of the District has established a comprehensive internal control framework that is designed both to protect the District’s assets from loss, theft, or misuse and to compile sufficient reliable information for the preparation of the District’s financial statements in conformity with accounting principles generally accepted in the United States of America. Because the cost of internal controls should not outweigh their benefits, the District’s comprehensive framework of internal controls has been designed to provide reasonable rather than absolute assurance that the financial statements will be free of material misstatement. As management, we assert that, to the best of our knowledge and belief, this financial report is complete and reliable in all material respects.
The District’s financial statements have been audited by Heinfeld, Meech & Co., P.C., a certified public accounting firm. The goal of the independent audit was to provide reasonable assurance that the financial statements of the District for the fiscal year ended June 30, 2019, are free of material misstatement. The independent audit involved examining, on a test basis, evidence supporting the amounts and disclosures in the financial statements; assessing the accounting principles used and significant estimates made by management; and evaluating the overall financial statement presentation. The independent auditors concluded, based upon the audit, that there was a reasonable basis for rendering an unmodified opinion that the District’s financial statements for the fiscal year ended June 30, 2019, are fairly presented in conformity with accounting principles generally accepted in the United States of America. The independent auditor’s report is presented as the first component of the financial section of this report.
Page 1

Accounting principles generally accepted in the United States of America require that management provide a narrative introduction, overview, and analysis to accompany the basic financial statements in the form of Management’s Discussion and Analysis (MD&A). This letter of transmittal is designed to complement the MD&A and should be read in conjunction with it. The District’s MD&A can be found immediately following the report of the independent auditors. PROFILE OF THE DISTRICT The District is one of 58 public school districts located in Maricopa County, Arizona and one of two Career Technical Education Districts. It provides a program of career and technical education from Grade 10 through Grade 12, with a current estimated enrollment of 35,700 students. The District’s Governing Board is organized under Section 15-321 of the Arizona Revised Statutes (A.R.S.). Management of the District is independent of other state or local governments. The County Treasurer collects taxes for the District, but exercises no control over its expenditures/expenses. The membership of the Governing Board consists of seven members elected by the public. Under existing statutes, the Governing Board’s duties and powers include, but are not limited to, the acquisition, maintenance and disposition of school property; the development and adoption of a school program; and the establishment, organization and operation of schools. The Board also has broad financial responsibilities, including the approval of the annual budget, and the establishment of a system of accounting and budgetary controls. The financial reporting entity consists of a primary government and its component units. A component unit is a legally separate entity that must be included in the reporting entity in conformity with generally accepted accounting principles. The District is a primary government because it is a special-purpose government that has a separately elected governing body, is legally separate, and is fiscally independent of other state or local governments. Furthermore, there are no component units combined with the District for financial statement presentation purposes, and the District is not included in any other governmental reporting entity. Consequently, the District’s financial statements include only the funds of those organizational entities for which its elected governing board is financially accountable. The District’s major operation is education. The annual expenditure budget serves as the foundation for the District’s financial planning and control. The objective of these budgetary controls is to ensure compliance with legal provisions embodied in the annual expenditure budget approved by the District’s Governing Board. The expenditure budget is prepared by fund for all Governmental Funds, and includes function and object code detail for the General Fund and some Special Revenue and Capital Projects Funds. The legal level of budgetary control (that is, the level at which expenditures cannot exceed the appropriated amount) is established at the individual fund level for all funds. Funds that are not required to legally adopt a budget may have overexpenditures of budgeted funds. The budget for these funds is simply an estimate and does not prevent the District from exceeding the budget as long as the necessary revenue is earned. The District is not required to prepare an annual budget of revenue, therefore a deficit budgeted fund balance may be presented. However, this does not affect the District’s ability to expend monies.
Page 2

FACTORS AFFECTING FINANCIAL CONDITION The information presented in the financial statements is perhaps best understood when it is considered from the broader perspective of the specific environment within which the District operates. Local Economy. The economic condition of the West-MEC school district is solid, with expanded career and technical education programs and certifications available to students. This has helped West-MEC not only to sustain but to grow through the current economic downturn. West-MEC has worked with business and industry to help build programs. With projected new programs and continued efforts to provide students with skills and tools to enter the workforce, our projected enrollment is expected to grow at approximately 353 students per year over the next five years. Fiscal year 2019 student enrollment was 35,700, calculated by formula to 7,077 average daily membership (ADM). West-MEC is a Career Technical Education District (CTED) whose sole purpose is career and technical education. Most students remain at their home high school for career and technical education programs which are supported by West-MEC. West-MEC has built four campuses. The Central campus programs include aviation, avionics, welding machining programs, and law and public safety. West-MEC Northeast campus programs include medical assisting, veterinary assisting, pharmacy technician, auto collision and auto technology, medium heavy diesel, HVAC-R, and general construction. The Southwest campus programs include energy and industrial, general construction, pharmacy technician, medical assisting, and IT security. West-MEC’s fourth campus is Northwest campus. The Northwest campus programs include cosmetology, physical therapy, IT security, law and public safety, and medical assisting. West-MEC currently has 26 buildings with the oldest built in 2010 and the newest completed in July 2019. The City of Phoenix is the capital and largest city of Arizona and is the county seat as well. The city encompasses an area of over 500 square miles. Phoenix is the sixth most populous city in the United States according to the 2016 census. The population of the city is 1,715,067. The Phoenix metropolitan area is the population and economic activity center of the entire state. Phoenix is one of the leaders in the economics of the Southwestern area of the United States. The City of Phoenix maintains a Moody’s general obligation bond rating of Aa1. It enjoys a highly diversified economic base consisting of manufacturing, agriculture, tourism, construction, education, distribution centers, finance and retailing. The Phoenix metropolitan area and the rest of Maricopa County have become one of the largest regional markets in the United States. The number of manufacturing and wholesale businesses located in the metropolitan area is approaching 3,287. This growth has been stimulated by a combination of warm climate, a substantial well educated labor pool, a wide range of support industries, and a governmental climate that is supportive of economic growth and investment. A few of the major firms represented in the Phoenix metropolitan area include State of Arizona; Banner Health Systems; Fry’s Food Stores; Wal-Mart, Inc.; Wells Fargo Company; Maricopa County; City of Phoenix; Intel; Arizona State University; and Bank of America. In addition, the metropolitan area provides excellent educational and training opportunities through seven community colleges, four private colleges and graduate schools, and one state university.
Page 3
Maricopa County is currently the nation’s fourth largest county in terms of population size and the 14th in land area. The County’s 2018 population was estimated at 4,329,580 and is expected to grow over the next 15 years. Maricopa County has a very wide range of economic sectors supporting its substantial growth. Maricopa County has, for some time, enjoyed an unemployment rate that was somewhat lower than the national average. West-MEC is located in Maricopa County, Arizona and encompasses an area of approximately 3,685 square miles. West-MEC services the cities of Phoenix, Peoria, Glendale, Surprise, Buckeye, Avondale, Wickenburg, Youngtown, Tonopah, El Mirage, Goodyear, Litchfield Park and Tolleson. Service is the largest employment sector in the County, partly fueled by the $2+ billion per year tourist industry. The County has excellent accommodations, diverse cultural and recreational activities, and a favorable climate attracting millions to the area annually. Wholesale and retail trade is the second largest employment category, employing over a quarter million people. Manufacturing consisting primarily of high technology companies is the third largest employer. Other factors aiding economic growth include major expansions of the international airport serving the area, a favorable business climate and the presence of a well-developed and expanding transportation infrastructure. Long-term Financial Planning. During the 2018-19 school year, our Northwest campus added five programs: aesthetician, auto technology, biomedical sciences and veterinary sciences. The District purchased, in spring of 2009, two buildings located at 99th Avenue just south of Bethany Home Road. These buildings serve as a training site for teachers, student training programs, including the coding program, and District offices, all of which encompass 42,000 square feet. The District occupied this facility in November 2010. In November 2009, West-MEC purchased 17 acres of land in Buckeye, Arizona. This land is located at Verrado Way and Van Buren. This is located approximately ½ mile south of I-10 on Airport Road and Verrado Drive. Phase 3 of our Southwest campus was complete in August of 2017. Programs include energy and industrial, general construction, pharmacy technician, medical assisting, and IT security. The next phase is slated to be complete in August 2019, programs such as veterinary and hairstyling, will be added with dental and water sustainability to begin in fall 2020. West-MEC has received, through the generosity of the John F. Long family trust, a donation of six acres located at the Glendale Airport. This property is located on the southeast corner of Glendale Avenue and Glen Harbor Boulevard. This land had a building built during the 2010-11 school year to accommodate an Aviation Airframe and Power Plant training program. An additional building was built on the property which now accommodates machining and manufacturing, welding, and law and public safety, and coding. Through a voter approved Bond, West-MEC purchased 9.45 acres with two buildings near 16th Avenue and Williams Drive in Phoenix, Arizona. The buildings have been renovated along with new constructed buildings to accommodate medical assisting, veterinary assisting, pharmacy technician, auto collision and auto technology programs, medium heavy diesel, HVAC-R, and general construction. With the approval of the voters for another bond in November 2016 West-MEC is using these funds to finish the build-out of the Southwest and Northwest campuses.
Page 4
During the 2012 legislative session, Senate Bill (1617) was passed by the Arizona Legislature amending A.R.S. §15-393 (D) (11). This amendment requires that Career technical education districts only include pupils in grades 10 through 12 in the calculation of average daily membership. With the passage of Senate Bill (1617), Western Maricopa Education Center District no longer receives state funding for ninth grade students. This heavily impacted the budget in fiscal year 2012 and will continue to in future years. AWARDS AND ACKNOWLEDGMENTS Awards. The Association of School Business Officials (ASBO) awarded a Certificate of Excellence in Financial Reporting to the District for its comprehensive annual financial report for the fiscal year ended June 30, 2018. This was the 14th consecutive year that the District has received this prestigious award. In addition, the Government Finance Officers Association (GFOA) awarded a Certificate of Achievement for Excellence in Financial Reporting to the District for its comprehensive annual financial report for the fiscal year ended June 30, 2018. In order to be awarded these certificates, the District published an easily readable and efficiently organized comprehensive annual financial report. This report satisfied both accounting principles generally accepted in the United States of America and applicable legal requirements. These certificates are valid for a period of one year only. We believe that our current comprehensive annual financial report continues to meet the programs’ requirements and we are submitting it to ASBO and GFOA to determine its eligibility for the fiscal year ended June 30, 2019 certificates. Acknowledgments. The preparation of the comprehensive annual financial report on a timely basis was made possible by the dedicated service of the entire staff of the business and finance department. Each member of the department has our sincere appreciation for the contributions made in the preparation of this report. In closing, without the leadership and support of the Governing Board of the District, preparation of this report would not have been possible. Respectfully submitted, Gregory J. Donovan Barbara Thompson Superintendent Administrator for Business Services
Page 5

The Certificate of Excellence in Financial Reporting is presented to
Western Maricopa Education CenterDistrict No. 402
for its Comprehensive Annual Financial Report (CAFR) for the Fiscal Year Ended June 30, 2018.
The CAFR meets the criteria established for
ASBO International’s Certificate of Excellence.
Tom Wohlleber, CSRM David J. Lewis President Executive Director
Page 6

Page 7
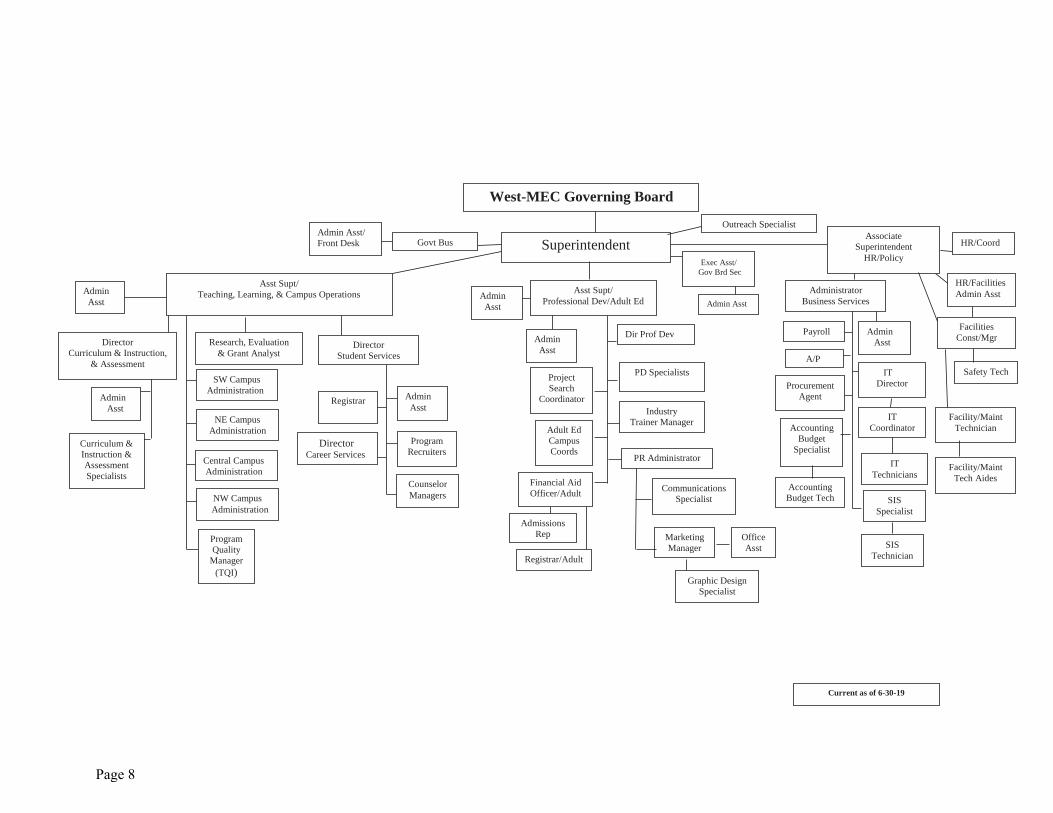
West-MEC Governing Board
Superintendent Exec Asst/
Gov Brd Sec
SIS Specialist
Asst Supt/ Teaching, Learning, & Campus Operations
Registrar Admin Asst
Admin Asst
Counselor Managers
Safety Tech
Admin Asst
HR/Coord
IT Director
Current as of 6-30-19
Program Recruiters
IT Coordinator
Program Quality
Manager (TQI)
Curriculum & Instruction & Assessment Specialists
Procurement Agent
Central Campus Administration
Administrator Business Services
Asst Supt/ Professional Dev/Adult Ed
SW Campus Administration
Payroll
Director Career Services
Research, Evaluation & Grant Analyst
NW Campus Administration
Adult Ed Campus Coords
Graphic Design Specialist
Govt Bus
Admissions Rep
Facility/Maint Technician
Industry Trainer Manager
Associate Superintendent
HR/Policy
Admin Asst
Dir Prof Dev Director
Student Services
Director Curriculum & Instruction,
& Assessment
NE Campus Administration
PR Administrator
Accounting Budget
Specialist
Admin Asst
Financial Aid Officer/Adult
Registrar/Adult
Marketing Manager SIS
Technician
Admin Asst
Facility/Maint Tech Aides
Accounting Budget Tech
Office Asst
Admin Asst
Project Search
Coordinator
Admin Asst/ Front Desk
PD Specialists
Communications Specialist
HR/Facilities Admin Asst
IT Technicians
Facilities Const/Mgr
Outreach Specialist
A/P
Page 8

WESTERN MARICOPA EDUCATION CENTER DISTRICT NO. 402
LIST OF PRINCIPAL OFFICIALS
GOVERNING BOARD
Barbara Wyllie, Chairman
Frank Straka, Vice Chairman
Charlie Ellis, Member
Dr. Peter Pingerelli, Member
Richard Oros, Member
Jim Migliorino, Member
James Kaltenbach, Member
ADMINISTRATIVE STAFF
Gregory J. Donovan, Superintendent
John J. Erb, Ed.D, Associate Superintendent
Barbara Thompson, Administrator for Business Services
Page 9

(This page intentionally left blank)
Page 10

FINANCIAL SECTION
Page 11

(This page intentionally left blank)
Page 12

INDEPENDENT AUDITOR’S REPORT Governing Board Western Maricopa Education Center District No. 402 Report on the Financial Statements We have audited the accompanying financial statements of the governmental activities, each major fund, and the aggregate remaining fund information of Western Maricopa Education Center District No. 402 (District), as of and for the year ended June 30, 2019, and the related notes to the financial statements, which collectively comprise the District’s basic financial statements as listed in the table of contents. Management’s Responsibility for the Financial Statements Management is responsible for the preparation and fair presentation of these financial statements in accordance with accounting principles generally accepted in the United States of America; this includes the design, implementation, and maintenance of internal control relevant to the preparation and fair presentation of financial statements that are free from material misstatement, whether due to fraud or error. Auditor’s Responsibility Our responsibility is to express opinions on these financial statements based on our audit. We conducted our audit in accordance with auditing standards generally accepted in the United States of America and the standards applicable to financial audits contained in Government Auditing Standards, issued by the Comptroller General of the United States. Those standards require that we plan and perform the audit to obtain reasonable assurance about whether the financial statements are free from material misstatement. An audit involves performing procedures to obtain audit evidence about the amounts and disclosures in the financial statements. The procedures selected depend on the auditor’s judgment, including the assessment of the risks of material misstatement of the financial statements, whether due to fraud or error. In making those risk assessments, the auditor considers internal control relevant to the entity’s preparation and fair presentation of the financial statements in order to design audit procedures that are appropriate in the circumstances, but not for the purpose of expressing an opinion on the effectiveness of the entity’s internal control. Accordingly, we express no such opinion. An audit also includes evaluating the appropriateness of accounting policies used and the reasonableness of significant accounting estimates made by management, as well as evaluating the overall presentation of the financial statements. We believe that the audit evidence we have obtained is sufficient and appropriate to provide a basis for our audit opinions. Opinions In our opinion, the financial statements referred to above present fairly, in all material respects, the respective financial position of the governmental activities, each major fund, and the aggregate remaining fund information of the Western Maricopa Education Center District No. 402, as of June 30, 2019, and the respective changes in financial position and, where applicable, cash flows thereof for the year then ended in accordance with accounting principles generally accepted in the United States of America.
Page 13

Other Matters Required Supplementary Information Accounting principles generally accepted in the United States of America require that the Management’s Discussion and Analysis budgetary comparison information, net pension liability information, and other postemployment benefit plan information, as listed in the table of contents, be presented to supplement the basic financial statements. Such information, although not a part of the basic financial statements, is required by the Governmental Accounting Standards Board, who considers it to be an essential part of financial reporting for placing the basic financial statements in an appropriate operational, economic, or historical context. We have applied certain limited procedures to the required supplementary information in accordance with auditing standards generally accepted in the United States of America, which consisted of inquiries of management about the methods of preparing the information and comparing the information for consistency with management’s responses to our inquiries, the basic financial statements, and other knowledge we obtained during our audit of the basic financial statements. We do not express an opinion or provide any assurance on the information because the limited procedures do not provide us with sufficient evidence to express an opinion or provide any assurance.
Other Information Our audit was conducted for the purpose of forming opinions on the financial statements that collectively comprise the District’s basic financial statements. The Introductory Section, Combining and Individual Fund Financial Statements and Schedules, and Statistical Section are presented for purposes of additional analysis and are not a required part of the basic financial statements.
The Combining and Individual Fund Financial Statements and Schedules are the responsibility of management and were derived from and relate directly to the underlying accounting and other records used to prepare the basic financial statements. Such information has been subjected to the auditing procedures applied in the audit of the basic financial statements and certain additional procedures, including comparing and reconciling such information directly to the underlying accounting and other records used to prepare the basic financial statements or to the basic financial statements themselves, and other additional procedures in accordance with auditing standards generally accepted in the United States of America. In our opinion, the Combining and Individual Fund Financial Statements and Schedules information is fairly stated in all material respects in relation to the basic financial statements as a whole.
The Introductory Section and Statistical Section have not been subjected to the auditing procedures applied in the audit of the basic financial statements and, accordingly, we do not express an opinion or provide any assurance on them.
Other Reporting Required by Government Auditing Standards In accordance with Government Auditing Standards, we have also issued our report dated December 19, 2019, on our consideration of Western Maricopa Education Center District No. 402’s internal control over financial reporting and on our tests of its compliance with certain provisions of laws, regulations, contracts, and grant agreements and other matters. The purpose of that report is solely to describe the scope of our testing of internal control over financial reporting and compliance and the results of that testing, and not to provide an opinion on the effectiveness of the Western Maricopa Education Center District No. 402’s internal control over financial reporting or on compliance. That report is an integral part of an audit performed in accordance with Government Auditing Standards in considering Western Maricopa Education Center District No. 402’s internal control over financial reporting and compliance.
Heinfeld, Meech & Co., P.C. Phoenix, Arizona December 19, 2019
Page 14

MANAGEMENT’S DISCUSSION AND ANALYSIS (MD&A) (Required Supplementary Information)
Page 15

(This page intentionally left blank)
Page 16

WESTERN MARICOPA EDUCATION CENTER DISTRICT NO. 402 MANAGEMENT’S DISCUSSION AND ANALYSIS (MD&A)
YEAR ENDED JUNE 30, 2019
As management of the Western Maricopa Education Center District No. 402 (District), we offer readers of the District’s financial statements this narrative overview and analysis of the financial activities of the District for the fiscal year ended June 30, 2019. The management’s discussion and analysis is presented as required supplementary information to supplement the basic financial statements. We encourage readers to consider the information presented here in conjunction with additional information that we have furnished in our letter of transmittal, which can be found in the introductory section of this report. FINANCIAL HIGHLIGHTS
The District’s total net position of governmental activities increased $10.2 million which
represents a 12 percent increase from the prior fiscal year primarily as a result of an increase in unrestricted state aid.
General revenues accounted for $56.4 million in revenue, or 96 percent of all current fiscal year revenues. Program specific revenue in the form of charges for services and grants and contributions accounted for $2.5 million or four percent of total current fiscal year revenues.
The District had approximately $48.7 million in expenses related to governmental
activities, an increase of 28 percent from the prior fiscal year. The increase was the result of increased spending on instructional supplies and equipment for new school programs.
Among major funds, the General Fund had $28.5 million of current fiscal year revenues,
which primarily consisted of state aid and property taxes, and $27.6 million in expenditures. The General Fund’s fund balance increased from $18.2 million at the prior fiscal year end, to $19.2 million at the end of the current fiscal year primarily due to salary increases, an increase in employees, and increased funding to member districts.
Net position for the Internal Service Fund increased $61,171 from the prior fiscal year.
Operating revenues of $136,106 exceeded operating expenses of $74,935 at the end of the current fiscal year.
OVERVIEW OF FINANCIAL STATEMENTS This discussion and analysis are intended to serve as an introduction to the District’s basic financial statements. The District’s basic financial statements comprise three components: 1) government-wide financial statements, 2) fund financial statements, and 3) notes to the financial statements. This report also contains other supplementary information in addition to the basic financial statements themselves.
Page 17

WESTERN MARICOPA EDUCATION CENTER DISTRICT NO. 402 MANAGEMENT’S DISCUSSION AND ANALYSIS (MD&A)
YEAR ENDED JUNE 30, 2019
OVERVIEW OF FINANCIAL STATEMENTS Government-wide financial statements. The government-wide financial statements are designed to provide readers with a broad overview of the District’s finances, in a manner similar to a private-sector business. The accrual basis of accounting is used for the government-wide financial statements. The statement of net position presents information on all of the District’s assets, liabilities, and deferred inflows/outflows of resources with the difference reported as net position. Over time, increases or decreases in net position may serve as a useful indicator of whether the financial position of the District is improving or deteriorating. The statement of activities presents information showing how the District’s net position changed during the most recent fiscal year. All changes in net position are reported as soon as the underlying event giving rise to the change occurs, regardless of the timing of related cash flows. Thus, revenues and expenses are reported in this statement for some items that will only result in cash flows in future fiscal periods (e.g., uncollected taxes and earned but unused compensated absences). The government-wide financial statements outline functions of the District that are principally supported by property taxes and intergovernmental revenues. The governmental activities of the District include instruction, support services, operation and maintenance of plant services and interest on long-term debt. Fund financial statements. A fund is a grouping of related accounts that is used to maintain control over resources that have been segregated for specific activities or objectives. The District uses fund accounting to ensure and demonstrate compliance with finance-related legal requirements. All of the funds of the District can be divided into three categories: governmental funds, proprietary funds, and fiduciary funds.
Governmental funds. Governmental funds are used to account for essentially the same functions reported as governmental activities in the government-wide financial statements. However, unlike the government-wide financial statements, governmental fund financial statements use the modified accrual basis of accounting and focus on near-term inflows of spendable resources, as well as on balances of spendable resources available at the end of the fiscal year. Such information may be useful in evaluating the District’s near-term financing requirements.
Page 18

WESTERN MARICOPA EDUCATION CENTER DISTRICT NO. 402 MANAGEMENT’S DISCUSSION AND ANALYSIS (MD&A)
YEAR ENDED JUNE 30, 2019
OVERVIEW OF FINANCIAL STATEMENTS
Because the focus of governmental funds is narrower than that of the government-wide financial statements, it is useful to compare the information presented for governmental funds with similar information presented for governmental activities in the government-wide financial statements. By doing so, readers may better understand the long-term impact of the District’s near-term financing decisions. Both the governmental fund balance sheet and the governmental fund statement of revenues, expenditures and changes in fund balances provide a reconciliation to facilitate this comparison between governmental funds and governmental activities.
Information is presented separately in the governmental fund balance sheet and in the governmental fund statement of revenues, expenditures and changes in fund balances for the General, Debt Service, Unrestricted Capital Outlay, and Bond Building Funds, all of which are considered to be major funds. Data from the other governmental funds are combined into a single, aggregated presentation. Individual fund data for each of these non-major governmental funds is provided in the form of combining statements and schedules.
Proprietary funds. The District maintains one type of proprietary fund. The internal service fund is an accounting device used to accumulate and allocate costs internally among the District’s various functions. The District uses its internal service fund to account for its Lobbying Fund which accounts for financial activities related to agreements with other governments where the District is the fiscal agent. Because these activities predominately benefit governmental functions, they have been included within governmental activities in the government-wide financial statements.
Fiduciary funds. Fiduciary funds are used to account for resources held for the benefit of parties outside the District. Fiduciary funds are not reflected in the government-wide financial statements because the resources of those funds are not available to support the District’s own programs. Due to their custodial nature, the fiduciary funds do not have a measurement focus.
Notes to the financial statements. The notes provide additional information that is essential to a full understanding of the data provided in the government-wide and fund financial statements. The notes to the financial statements can be found immediately following the basic financial statements.
Other information. In addition to the basic financial statements and accompanying notes, this report also presents certain required supplementary information concerning the District’s budget process and pension plan. The District adopts an annual expenditure budget for all governmental funds. A schedule of revenues, expenditures and changes in fund balances – budget and actual has been provided for the General Fund as required supplementary information. Schedules for the pension and other postemployment benefit plans have been provided as required supplementary information.
Page 19

WESTERN MARICOPA EDUCATION CENTER DISTRICT NO. 402 MANAGEMENT’S DISCUSSION AND ANALYSIS (MD&A)
YEAR ENDED JUNE 30, 2019
GOVERNMENT-WIDE FINANCIAL ANALYSIS Net position may serve over time as a useful indicator of a government’s financial position. In the case of the District, assets and deferred outflows exceeded liabilities and deferred inflows by $95.2 million at the current fiscal year end. A portion of the District’s net position reflects its investment in capital assets (e.g., land, leasehold improvements, buildings and improvements, vehicles, furniture and equipment and construction in progress), less any related outstanding debt used to acquire those assets. The District uses these capital assets to provide services to its students; consequently, these assets are not available for future spending. Although the District’s investment in its capital assets is reported net of related outstanding debt, it should be noted that the resources needed to repay this debt must be provided from other sources, since the capital assets themselves cannot be used to liquidate these liabilities. In addition, a portion of the District’s net position represents resources that are subject to external restrictions on how they may be used. The remaining balance is unrestricted and may be used to meet the District’s ongoing obligations to its citizens and creditors. The following table presents a summary of the District’s net position for the fiscal years ended June 30, 2019 and June 30, 2018.
As of As of June 30, 2019 June 30, 2018
Current assets $ 78,344,089 $ 116,641,633 Capital assets, net 173,794,038 138,128,269
Total assets 252,138,127 254,769,902
Deferred outflows 3,853,370 3,696,161
Current and other liabilities 10,383,120 11,253,291 Long-term liabilities 149,039,078 161,518,131
Total liabilities 159,422,198 172,771,422
Deferred inflows 1,373,635 664,272
Net position: Net investment in capital assets 42,397,958 37,803,401 Restricted 32,652,335 24,793,511 Unrestricted 20,145,371 22,433,457
Total net position $ 95,195,664 $ 85,030,369 At the end of the current fiscal year the District reported positive balances in all three categories of net position. The same situation held true for the prior fiscal year. The District’s financial position is the product of several financial transactions including the net results of activities, the acquisition and disposal of capital assets, and the depreciation of capital assets.
Page 20

WESTERN MARICOPA EDUCATION CENTER DISTRICT NO. 402 MANAGEMENT’S DISCUSSION AND ANALYSIS (MD&A)
YEAR ENDED JUNE 30, 2019
GOVERNMENT-WIDE FINANCIAL ANALYSIS The following are significant current year transactions that have had an impact on the Statement of Net Position.
The addition of $38.7 million in capital assets through the purchase of vehicles, furniture and equipment and construction of new facilities.
The depreciation of existing assets resulting in the addition of $3.1 million in accumulated depreciation.
Changes in net position. The District’s total revenues for the current fiscal year were $58.8 million. The total cost of all programs and services was $48.7 million. The following table presents a summary of the changes in net position for the fiscal years ended June 30, 2019 and June 30, 2018.
Fiscal Year Ended
Fiscal Year Ended
June 30, 2019 June 30, 2018 Revenues: Program revenues:
Charges for services $ 1,845,986 $ 1,760,297 Operating grants and contributions 569,476 217,179 Capital grants and contributions 67,861
General revenues: Property taxes 22,531,094 25,112,776 Investment income 1,936,977 1,202,191 Unrestricted county aid 2,979,765 2,624,181 Unrestricted state aid 28,910,813 23,044,177 Total revenues 58,841,972 53,960,801
Expenses: Instruction 28,381,606 20,559,036 Support services - students and staff 5,310,247 4,224,989 Support services - administration 8,192,043 5,919,305 Operation and maintenance of plant services 2,524,230 2,045,377 Student transportation services 99,476 43,960 Operation of non-instructional services 4,781 3,038 Interest on long-term debt 4,164,294 5,121,721
Total expenses 48,676,677 37,917,426 Changes in net position 10,165,295 16,043,375
Net position, beginning 85,030,369 68,986,994 Net position, ending $ 95,195,664 $ 85,030,369
Page 21

WESTERN MARICOPA EDUCATION CENTER DISTRICT NO. 402 MANAGEMENT’S DISCUSSION AND ANALYSIS (MD&A)
YEAR ENDED JUNE 30, 2019
GOVERNMENT-WIDE FINANCIAL ANALYSIS
Instruction58%
Support services -students and staff
11%
Support services -administration
17%
Operation and maintenance of plant
services5%
Student transportation
services0%
Operation of non-instructional services
0%
Interest on long-term debt
9%
Expenses - Fiscal Year 2019
The following are significant current year transactions that have had an impact on the change in net position.
A decrease of $2.6 million in property tax revenue as a result of a decrease in property tax rates.
An increase of $5.9 million in state aid as a result of increased District enrollment and recent legislation passed to fund an increase in teachers’ pay.
An increase of $7.8 in instructional expenses related to the increase in salaries and purchase of supplies, equipment, and technology for renovated school campuses.
An increase of $2.3 million in support services – administration expenses due to an increase in employees and staff salaries.
The following table presents the cost of the District’s major functional activities. The table also shows each function’s net cost (total cost less charges for services generated by the activities and intergovernmental aid provided for specific programs). The net cost shows the financial burden that was placed on the State and District’s taxpayers by each of these functions.
Page 22

WESTERN MARICOPA EDUCATION CENTER DISTRICT NO. 402 MANAGEMENT’S DISCUSSION AND ANALYSIS (MD&A)
YEAR ENDED JUNE 30, 2019
GOVERNMENT-WIDE FINANCIAL ANALYSIS
Year Ended June 30, 2019 Year Ended June 30, 2018 Total Net (Expense)/ Total Net (Expense)/
Expenses Revenue Expenses Revenue Instruction $ 28,381,606 $ (26,196,203) $ 20,559,036 $ (18,929,352) Support services - students and staff 5,310,247 (5,241,554) 4,224,989 (4,204,695) Support services - administration 8,192,043 (8,192,043) 5,919,305 (5,791,807) Operation and maintenance of plant services 2,524,230 (2,322,102) 2,045,377 (1,845,377) Student transportation services 99,476 (72,377) 43,960 (43,960) Operation of non-instructional services 4,781 (4,781) 3,038 (3,038) Interest on long-term debt 4,164,294 (4,164,294) 5,121,721 (5,121,721)
Total $ 48,676,677 $ (46,193,354) $ 37,917,426 $ (35,939,950)
The cost of all governmental activities this year was $48.7 million.
Federal and State governments and charges for services subsidized certain programs with grants and contributions and other local revenues of $2.5 million.
Net cost of governmental activities of $46.2 million was financed by general revenues, which are made up of primarily property taxes of $22.5 million and state and county aid of $31.9 million. Investment earnings accounted for $1.9 million of funding.
FINANCIAL ANALYSIS OF THE DISTRICT’S FUNDS As noted earlier, the District uses fund accounting to ensure and demonstrate compliance with finance-related legal requirements. Governmental funds. The focus of the District’s governmental funds is to provide information on near-term inflows, outflows, and balances of spendable resources. Such information is useful in assessing the District’s financing requirements. In particular, unassigned fund balance may serve as a useful measure of the District’s net resources available for spending at the end of the fiscal year. The financial performance of the District as a whole is reflected in its governmental funds. As the District completed the year, its governmental funds reported a combined fund balance of $57.5 million, a decrease of $35.5 million due primarily to the utilization of bond proceeds to fund construction and renovations to school campuses.
Page 23

WESTERN MARICOPA EDUCATION CENTER DISTRICT NO. 402 MANAGEMENT’S DISCUSSION AND ANALYSIS (MD&A)
YEAR ENDED JUNE 30, 2019
FINANCIAL ANALYSIS OF THE DISTRICT’S FUNDS The General Fund comprises 33 percent of the total fund balance. All $19.2 million of the General Fund’s fund balance is unassigned. The General Fund is the principal operating fund of the District. There was an increase in fund balance of $942,970 to $19.2 million as of fiscal year end primarily due to an increase in District enrollment and increased revenue generated by the District’s community school programs. General Fund revenues decreased $400,138. General Fund expenditures increased $2.8 million due to an increase in spending related to teachers’ salaries and benefits and an increase in the District’s average daily membership. The fund balance in the Debt Service Fund increased $452,359 to $1.1 million due to the District’s debt retirement payments decreasing relative to property tax revenues. The fund balance in the Unrestricted Capital Outlay Fund increased $6.3 million to $27.8 million primarily due to the increase of state aid allocated to the fund. The fund balance in the Bond Building Fund decreased $44.3 million to $5.8 million as of year end primarily due to capital spending of bond proceeds on construction and renovation projects to school campuses. Proprietary fund. Unrestricted net position of the Internal Service Fund at the end of the fiscal year amounted to $186,279. The increase of $61,171 from the prior fiscal year was a result of conservative spending. BUDGETARY HIGHLIGHTS Over the course of the year, the District revised the General Fund annual expenditure budget. The difference between the original budget and the final amended budget was a $1.3 million decrease, or four percent. Significant variances for the final amended budget and actual revenues resulted from the District not being required by the State of Arizona to prepare a revenue budget. A schedule showing the original and final budget amounts compared to the District’s actual financial activity for the General Fund is provided in this report as required supplementary information. The significant variance is summarized as follows:
The favorable variance of $1.4 million in instruction expenditures was primarily due to lower than anticipated payments to participating school district CTED programs.
Page 24

WESTERN MARICOPA EDUCATION CENTER DISTRICT NO. 402 MANAGEMENT’S DISCUSSION AND ANALYSIS (MD&A)
YEAR ENDED JUNE 30, 2019
CAPITAL ASSETS AND DEBT ADMINISTRATION At year end, the District had invested $186.5 million in capital assets, including land, buildings and improvements, vehicles, furniture, and equipment, and construction in progress. This amount represents a net increase prior to depreciation of $38.7 million from the prior fiscal year, primarily due to spending of bond proceeds on construction and renovation projects at multiple school campuses. Total depreciation expense for the current fiscal year was $3.1 million. The following schedule presents a summary of capital asset balances for the fiscal years ended June 30, 2019 and June 30, 2018.
As of As of
June 30, 2019 June 30, 2018 Capital assets - non-depreciable $ 45,994,764 $ 33,776,904 Capital assets - depreciable, net 127,799,274 104,351,365
Total $ 173,794,038 $ 138,128,269 The estimated cost to complete current construction projects is $4.4 million. Additional information on the District’s capital assets can be found in Note 7.
Debt Administration. At year end, the District had $137.2 million in long-term debt outstanding, $10.1 million due within one year. Long-term debt decreased by $13.3 million due to retirement of debt according to the District’s debt agreements. The District’s general obligation bonds are subject to two limits; the Constitutional debt limit (total debt limit) on all general obligation bonds and the statutory debt limit on Class B bonds. The total debt limitation and the Class B debt limit are the same for the District (up to one percent of the total net full cash assessed valuation). The current total debt limitation and Class B debt limit for the District is $192.9 million, which is more than the District’s total outstanding general obligation and Class B debt. Additional information on the District’s long-term debt can be found in Notes 9 and 10.
Page 25

WESTERN MARICOPA EDUCATION CENTER DISTRICT NO. 402 MANAGEMENT’S DISCUSSION AND ANALYSIS (MD&A)
YEAR ENDED JUNE 30, 2019
ECONOMIC FACTORS AND NEXT YEAR’S BUDGET AND RATES Many factors were considered by the District’s administration during the process of developing the fiscal year 2019-20 budget. Among them:
Fiscal year 2018-19 budget balance carry forward (estimated $1.5 million) Employee salaries District student population (estimated 2,049)
Also considered in the development of the budget is the local economy and inflation of the surrounding area. Budgeted expenditures in the General Fund increased four percent to $30.6 million in fiscal year 2019-20. This was a result of new programs and increased student enrollment. These programs will be added to the 2019-20 budget. CONTACTING THE DISTRICT’S FINANCIAL MANAGEMENT This financial report is designed to provide our citizens, taxpayers, and investors and creditors with a general overview of the District’s finances and to demonstrate the District’s accountability for the resources it receives. If you have questions about this report or need additional information, contact the Business and Finance Department, Western Maricopa Education Center District No. 402, 5487 North 99th Avenue, Glendale, Arizona 85305.
Page 26

BASIC FINANCIAL STATEMENTS
Page 27

(This page intentionally left blank)
Page 28

GOVERNMENT-WIDE FINANCIAL STATEMENTS
Page 29

ASSETSCurrent assets:
Cash and investmentsProperty taxes receivableDue from governmental entities
Total current assets
Noncurrent assets:Net other postemployment benefit assetsCapital assets not being depreciatedCapital assets, net of accumulated depreciation
Total noncurrent assetsTotal assets
DEFERRED OUTFLOWS OF RESOURCESPension and other postemployment benefit plan items
LIABILITIESCurrent liabilities:
Accounts payableConstruction contracts payableAccrued payroll and employee benefitsCompensated absences payableAccrued interest payableUnearned revenuesBonds payable
Total current liabilities
Noncurrent liabilities:Non-current portion of long-term obligations
Total noncurrent liabilitiesTotal liabilities
DEFERRED INFLOWS OF RESOURCESPension and other postemployment benefit plan items
NET POSITIONNet investment in capital assetsRestrictedUnrestricted
Total net position
Governmental Activities
$ 69,622,353293,520
8,401,51978,317,392
26,69745,994,764
127,799,274173,820,735252,138,127
3,853,370
692,8195,075,828
359,93479,409
2,680,4791,574,060
10,090,00020,552,529
138,869,669138,869,669159,422,198
1,373,635
42,397,95832,652,33520,145,371
$ 95,195,664
WESTERN MARICOPA EDUCATION CENTER DISTRICT NO. 402STATEMENT OF NET POSITION
JUNE 30, 2019
The notes to the basic financial statements are an integral part of this statement.
Page 30

Program Revenues
Net (Expense) Revenue and
Changes in Net Position
Functions/ProgramsGovernmental activities:
InstructionSupport services - students and staffSupport services - administrationOperation and maintenance of plant servicesStudent transportation servicesOperation of non-instructional servicesInterest on long-term debt
Total governmental activities
Expenses
$ 28,381,6065,310,2478,192,0432,524,230
99,4764,781
4,164,294$ 48,676,677
Charges for Services
$ 1,575,16568,693
202,128
$ 1,845,986
Operating Grants and
Contributions
$ 542,377
27,099
$ 569,476
Capital Grants and
Contributions
$ 67,861
$ 67,861
Governmental Activities
$ (26,196,203)(5,241,554)(8,192,043)(2,322,102)
(72,377)(4,781)
(4,164,294)(46,193,354)
General revenues:Taxes:
Property taxes, levied for general purposesProperty taxes, levied for debt service
Investment incomeUnrestricted county aidUnrestricted state aid
Total general revenues
Changes in net position
Net position, beginning of year
Net position, end of year
7,515,16015,015,9341,936,9772,979,765
28,910,81356,358,649
10,165,295
85,030,369
$ 95,195,664
WESTERN MARICOPA EDUCATION CENTER DISTRICT NO. 402STATEMENT OF ACTIVITIESYEAR ENDED JUNE 30, 2019
The notes to the basic financial statements are an integral part of this statement.
Page 31

(This page intentionally left blank)
Page 32

FUND FINANCIAL STATEMENTS
Page 33

ASSETSCash and investmentsProperty taxes receivableDue from governmental entities
Total assets
LIABILITIES, DEFERRED INFLOWS OF RESOURCES AND FUND BALANCESLiabilities:
Accounts payableConstruction contracts payableAccrued payroll and employee benefitsUnearned revenuesBonds payableBond interest payable
Total liabilities
Deferred inflows of resources:Unavailable revenues - property taxes
Fund balances:RestrictedUnassigned
Total fund balances
Total liabilities, deferred inflows of resourcesand fund balances
General
$ 13,204,27598,233
8,248,157$ 21,550,665
$ 585,491
142,1031,574,060
2,301,654
57,333
19,191,67819,191,678
$ 21,550,665
Debt Service
$ 13,826,751195,287
$ 14,022,038
$
10,090,0002,680,479
12,770,479
118,616
1,132,943
1,132,943
$ 14,022,038
Unrestricted Capital Outlay
$ 28,704,897
$ 28,704,897
$885,048
885,048
27,819,849
27,819,849
$ 28,704,897
WESTERN MARICOPA EDUCATION CENTER DISTRICT NO. 402 BALANCE SHEET - GOVERNMENTAL FUNDS
JUNE 30, 2019
The notes to the basic financial statements are an integral part of this statement.
Page 34

Bond Building
$ 9,947,427
$ 9,947,427
$4,190,780
4,190,780
5,756,647
5,756,647
$ 9,947,427
Non-Major Governmental
Funds
$ 3,732,441
153,362$ 3,885,803
$ 87,045
217,831
304,876
3,580,927
3,580,927
$ 3,885,803
Total Governmental
Funds
$ 69,415,791293,520
8,401,519$ 78,110,830
$ 672,5365,075,828
359,9341,574,060
10,090,0002,680,479
20,452,837
175,949
38,290,36619,191,67857,482,044
$ 78,110,830
Page 35

(This page intentionally left blank)
Page 36

Total governmental fund balances 57,482,044$
Amounts reported for governmental activities in the Statement of Net Position are different because:
Capital assets used in governmental activities are not financialresources and, therefore, are not reported in the funds.
Governmental capital assets 186,464,637$ Less accumulated depreciation (12,670,599) 173,794,038
Some receivables are not available to pay for current periodexpenditures and, therefore, are reported as unavailablerevenues in the funds.
Property taxes 175,949
Deferred outflows and inflows of resources related to pensions/OPEB are applicable to future periods and, therefore, are not reported in the funds.
Deferred outflows of resources related to pensions/OPEB 3,853,370Deferred inflows of resources related to pensions/OPEB (1,373,635) 2,479,735
The Net OPEB asset is not a current financial resource and,therefore, is not reported in the funds. 26,697
The Internal Service Fund is used by management to charge the cost of insurance to the individual funds. The assets andliabilities of the Internal Service Fund are included in theStatement of Net Position. 186,279
Long-term liabilities are not due and payable in the currentperiod and, therefore, are not reported in the funds.
Compensated absences payable (919,881)Net OPEB liability (40,797)Net pension liability (10,925,673)Bonds payable (127,062,727) (138,949,078)
Net position of governmental activities 95,195,664$
WESTERN MARICOPA EDUCATION CENTER DISTRICT NO. 402RECONCILIATION OF THE BALANCE SHEET - GOVERNMENTAL FUNDS
TO THE STATEMENT OF NET POSITIONJUNE 30, 2019
The notes to the basic financial statements are an integral part of this statement.
Page 37

Revenues:Other localProperty taxesState aid and grantsFederal aid, grants and reimbursements
Total revenues
Expenditures:Current -
InstructionSupport services - students and staffSupport services - administrationOperation and maintenance of plant servicesStudent transportation services
Capital outlayDebt service -
Principal retirementInterest and fiscal charges
Total expenditures
Excess (deficiency) of revenues over expenditures
Other financing sources (uses):Transfers inTransfers out
Total other financing sources (uses)
Changes in fund balances
Fund balances, beginning of year
Fund balances, end of year
General
$ 4,258,4367,503,083
16,784,895
28,546,414
16,598,9444,323,7754,456,0342,139,840
84,851
27,603,444
942,970
942,970
18,248,708
$ 19,191,678
Debt Service
$ 298,17215,022,048
15,320,220
10,090,0005,367,723
15,457,723
(137,503)
589,862
589,862
452,359
680,584
$ 1,132,943
Unrestricted Capital Outlay
$ 400,713
11,453,279
11,853,992
5,525,772
5,525,772
6,328,220
6,328,220
21,491,629
$ 27,819,849
WESTERN MARICOPA EDUCATION CENTER DISTRICT NO. 402STATEMENT OF REVENUES, EXPENDITURES AND CHANGES IN FUND BALANCES -
GOVERNMENTAL FUNDSYEAR ENDED JUNE 30, 2019
The notes to the basic financial statements are an integral part of this statement.
Page 38
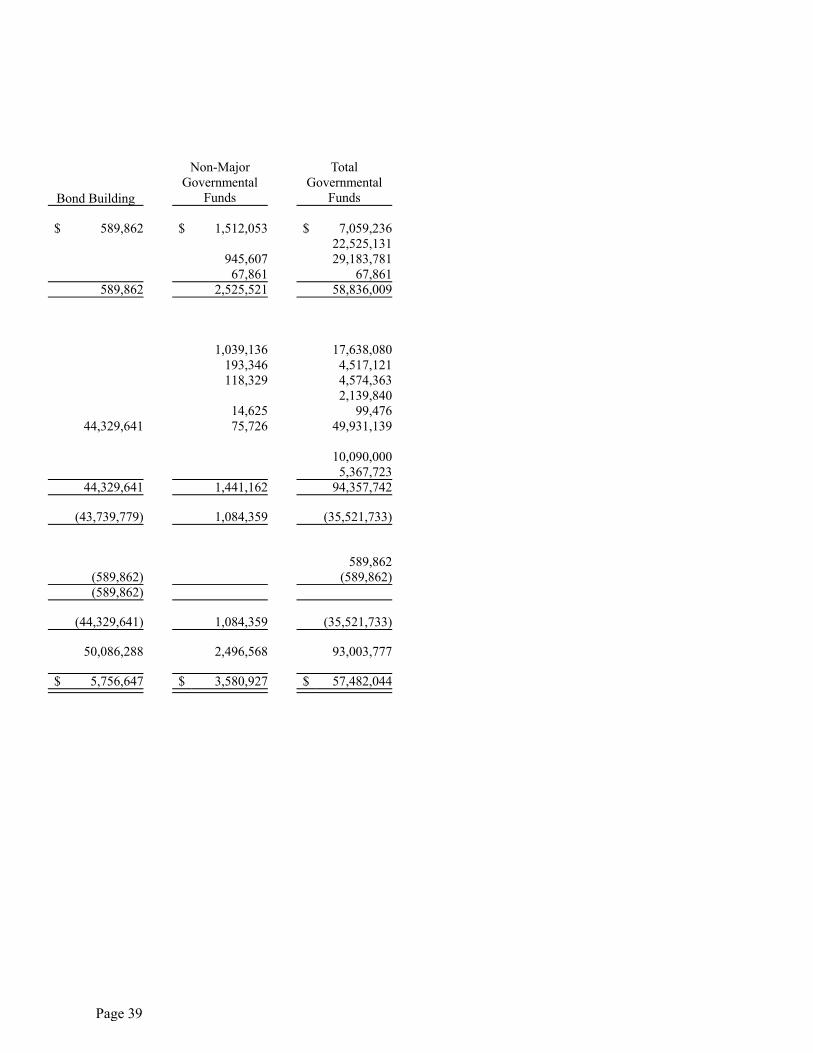
Bond Building
$ 589,862
589,862
44,329,641
44,329,641
(43,739,779)
(589,862)(589,862)
(44,329,641)
50,086,288
$ 5,756,647
Non-Major Governmental
Funds
$ 1,512,053
945,60767,861
2,525,521
1,039,136193,346118,329
14,62575,726
1,441,162
1,084,359
1,084,359
2,496,568
$ 3,580,927
Total Governmental
Funds
$ 7,059,23622,525,13129,183,781
67,86158,836,009
17,638,0804,517,1214,574,3632,139,840
99,47649,931,139
10,090,0005,367,723
94,357,742
(35,521,733)
589,862(589,862)
(35,521,733)
93,003,777
$ 57,482,044
Page 39

Changes in fund balances - total governmental funds (35,521,733)$
Amounts reported for governmental activities in the Statement of Activities are different because:
Governmental funds report the portion of capital outlay for capitalized assets as expenditures. However, in the Statement of Activities, the costs of those assets are allocated over theirestimated useful lives as depreciation expense.
Expenditures for capitalized assets 38,739,441$ Less current year depreciation (3,073,672) 35,665,769
Some revenues in the Statement of Activities that do not provide current financialresources are not reported as revenues in the funds.
Property taxes 5,963
Repayments of long-term debt principal are expenditures in the governmental funds, but the repayment reduces long-term liabilities in the Statement ofNet Position.
Bond principal retirement 10,090,000
Governmental funds report pension/OPEB contributions as expenditures. However,they are reported as deferred outflows of resources in the Statement of Net Position.The change in the net pension/OPEB liability, adjusted for deferred items, is reportedas pension/OPEB expense in the Statement of Activities.
Current year pension/OPEB contributions 1,075,252Pension/OPEB expense (2,193,745) (1,118,493)
Some expenses reported in the Statement of Activities do not require the use ofcurrent financial resources and, therefore, are not reported as expenditures in governmental funds.
Amortization of deferred bond items 1,203,429Compensated absences (220,811) 982,618
The Internal Service Fund is used by management to charge the cost of insurance to the individual funds. The changes in net position of the Internal Service Fund is reported with governmental activities in the Statement of Activities. 61,171
Changes in net position in governmental activities 10,165,295$
WESTERN MARICOPA EDUCATION CENTER DISTRICT NO. 402RECONCILIATION OF THE STATEMENT OF REVENUES, EXPENDITURES AND CHANGES
IN FUND BALANCES - GOVERNMENTAL FUNDS TO THE STATEMENT OF ACTIVITIESYEAR ENDED JUNE 30, 2019
The notes to the basic financial statements are an integral part of this statement.
Page 40

ASSETSCurrent assets:
Cash and investmentsTotal current assets
Total assets
LIABILITIESCurrent liabilities:
Accounts payableTotal current liabilities
Total liabilities
NET POSITIONUnrestricted
Total net position
Governmental Activities:
Internal Service Funds
$ 206,562206,562206,562
20,28320,28320,283
186,279$ 186,279
WESTERN MARICOPA EDUCATION CENTER DISTRICT NO. 402STATEMENT OF NET POSITION
PROPRIETARY FUNDSJUNE 30, 2019
The notes to the basic financial statements are an integral part of this statement.
Page 41

Operating revenues:Contributions
Total operating revenues
Operating expenses:Cost of services
Total operating expenses
Operating income (loss)
Changes in net position
Total net position, beginning of year
Total net position, end of year
Governmental Activities:
Internal Service Funds
$ 136,106136,106
74,93574,935
61,171
61,171
125,108
$ 186,279
WESTERN MARICOPA EDUCATION CENTER DISTRICT NO. 402STATEMENT OF REVENUES, EXPENSES AND CHANGES IN NET POSITION -
PROPRIETARY FUNDSFOR THE YEAR ENDED JUNE 30, 2019
The notes to the basic financial statements are an integral part of this statement.
Page 42

WESTERN MARICOPA EDUCATION CENTER DISTRICT NO. 402STATEMENT OF CASH FLOWS - PROPRIETARY FUNDS
YEAR ENDED JUNE 30, 2019
GovernmentalActivities:Internal
Service FundsIncrease/Decrease in Cash and Cash Equivalents
Cash flows from operating activities: Cash received from contributions $ 136,106Cash payments to suppliers for goods and services (61,090)
Net cash provided by/used for operating activities 75,016
Net increase/decrease in cash and cash equivalents 75,016
Cash and cash equivalents, beginning of year 131,546
Cash and cash equivalents, end of year $ 206,562
Reconciliation of Operating Income to Net Cash Provided by Operating Activities
Operating income/loss $ 61,171
Adjustments to reconcile operating income/loss to net cash provided by/used for operating activities:
Changes in assets and liabilities: Increase/decrease in accounts payable 13,845
Total adjustments 13,845
Net cash provided by/used for operating activities $ 75,016
The notes to the basic financial statements are an integral part of this statement.
Page 43

ASSETSCash and investments
Total assets
LIABILITIESAccounts payableDeposits held for othersDue to student groups
Total liabilities
Agency
$ 99,759$ 99,759
$ 11,46652,61735,676
$ 99,759
WESTERN MARICOPA EDUCATION CENTER DISTRICT NO. 402STATEMENT OF ASSETS AND LIABILITIES
FIDUCIARY FUNDSJUNE 30, 2019
The notes to the basic financial statements are an integral part of this statement.
Page 44

WESTERN MARICOPA EDUCATION CENTER DISTRICT NO. 402 NOTES TO FINANCIAL STATEMENTS
JUNE 30, 2019
NOTE 1 – SUMMARY OF SIGNIFICANT ACCOUNTING POLICIES The financial statements of the Western Maricopa Education Center District No. 402 (District) have been prepared in conformity with accounting principles generally accepted in the United States of America as applied to government units. The Governmental Accounting Standards Board (GASB) is the accepted standard-setting body for establishing governmental accounting and financial reporting principles. The more significant of the District’s accounting policies are described below. A. Reporting Entity The Governing Board is organized under Section 15-321 of the Arizona Revised Statutes (A.R.S.). Management of the District is independent of other state or local governments. The County Treasurer collects taxes for the District, but exercises no control over its expenditures/expenses. The membership of the Governing Board consists of seven members elected by the public. Under existing statutes, the Governing Board’s duties and powers include, but are not limited to, the acquisition, maintenance and disposition of school property; the development and adoption of a school program; and the establishment, organization and operation of schools. The Board also has broad financial responsibilities, including the approval of the annual budget, and the establishment of a system of accounting and budgetary controls. The financial reporting entity consists of a primary government and its component units. A component unit is a legally separate entity that must be included in the reporting entity in conformity with generally accepted accounting principles. The District is a primary government because it is a special-purpose government that has a separately elected governing body, is legally separate, and is fiscally independent of other state or local governments. Furthermore, there are no component units combined with the District for financial statement presentation purposes, and the District is not included in any other governmental reporting entity. Consequently, the District’s financial statements include only the funds of those organizational entities for which its elected governing board is financially accountable. The District’s major operations include education and construction and maintenance of District facilities.
Page 45

WESTERN MARICOPA EDUCATION CENTER DISTRICT NO. 402 NOTES TO FINANCIAL STATEMENTS
JUNE 30, 2019
NOTE 1 – SUMMARY OF SIGNIFICANT ACCOUNTING POLICIES B. Government-Wide and Fund Financial Statements The government-wide financial statements (i.e., the statement of net position and the statement of activities) present financial information about the District as a whole. The reported information includes all of the nonfiduciary activities of the District. For the most part, the effect of internal activity has been removed from these statements. These statements are to distinguish between the governmental and business-type activities of the District. Governmental activities normally are supported by taxes and intergovernmental revenues, and are reported separately from business-type activities, which rely to a significant extent on fees and charges for support. The District does not have any business-type activities. The statement of activities demonstrates the degree to which the direct expenses of a given function or segment are offset by program revenues. Direct expenses are those that are clearly identifiable with a specific function or segment. Program revenues include charges to customers or applicants who purchase, use, or directly benefit from goods, services, or privileges provided by a given function or segment. Taxes, unrestricted state and county aid, and other items not included among program revenues are reported instead as general revenues. Separate financial statements are provided for governmental, proprietary, and fiduciary funds even though the latter are excluded from the government-wide financial statements. Major individual governmental funds are reported as separate columns in the fund financial statements. C. Measurement Focus, Basis of Accounting, and Financial Statement Presentation Government-Wide Financial Statements – The government-wide financial statements are reported using the economic resources measurement focus and the accrual basis of accounting. Revenues are recorded when earned and expenses are recorded when a liability is incurred, regardless of the timing of related cash flows. Property taxes are recognized as revenues in the year for which they are levied. Grants and similar items are recognized as revenue as soon as all eligibility requirements imposed by the grantor or provider have been met. As a general rule, the effect of internal activity has been eliminated from the government-wide financial statements; however, the effects of interfund services provided and used between functions are reported as expenses and program revenues at amounts approximating their external exchange value.
Page 46
WESTERN MARICOPA EDUCATION CENTER DISTRICT NO. 402 NOTES TO FINANCIAL STATEMENTS
JUNE 30, 2019
NOTE 1 – SUMMARY OF SIGNIFICANT ACCOUNTING POLICIES Fund Financial Statements – Governmental fund financial statements are reported using the current financial resources measurement focus and the modified accrual basis of accounting. Revenues are recognized as soon as they are both measurable and available. Revenues are considered to be available when they are collectible within the current period or soon enough thereafter to pay liabilities of the current period. For this purpose, the District considers revenues to be available if they are collected within 60 days of the end of the current fiscal period. Expenditures generally are recorded when a liability is incurred, as under accrual accounting. However, debt service expenditures, as well as expenditures related to compensated absences, and claims and judgments, are recorded only when payment is due. As permitted by generally accepted accounting principles, the District applies the “early recognition” option for debt service payments. Property tax resources are provided in the Debt Service Fund during the current year for the payment of debt service principal and interest due early in the following year (less than one month). Therefore, the expenditures and related liabilities have been recognized in the current period. Property taxes, state and county aid, and investment income associated with the current fiscal period are all considered to be susceptible to accrual and have been recognized as revenues of the current fiscal period. Miscellaneous revenues are not susceptible to accrual because generally they are not measurable until received in cash. Grants and similar awards are recognized as revenue as soon as all eligibility requirements imposed by the grantor or provider have been met. Unearned revenues arise when resources are received by the District before it has legal claim to them, as when grant monies are received prior to meeting all eligibility requirements imposed by the provider. Delinquent property taxes and other receivables that will not be collected within the available period have been reported as unavailable revenues on the governmental fund financial statements. The focus of governmental fund financial statements is on major funds rather than reporting funds by type. Each major fund is presented in a separate column. Non-major funds are aggregated and presented in a single column. The Internal Service Fund is presented in a single column on the face of the proprietary fund statements. The fiduciary fund is reported by fund type.
The District reports the following major governmental funds:
General Fund – The General Fund is the District’s primary operating fund. It accounts for all resources used to finance District maintenance and operation except those required to be accounted for in other funds. The General Fund includes the District’s Maintenance and Operation Fund as well as certain activities budgeted in separate funds in accordance with A.R.S. These funds are maintained as separate funds for budgetary purposes but do not meet the criteria for separate reporting in the financial statements.
Page 47

WESTERN MARICOPA EDUCATION CENTER DISTRICT NO. 402 NOTES TO FINANCIAL STATEMENTS
JUNE 30, 2019
NOTE 1 – SUMMARY OF SIGNIFICANT ACCOUNTING POLICIES Debt Service Fund – The Debt Service Fund accounts for the accumulation of resources for, and the payment of, long-term debt principal, interest and related costs.
Unrestricted Capital Outlay Fund – The Unrestricted Capital Outlay Fund accounts for transactions relating to the acquisition of capital items. Bond Building Fund – The Bond Building Fund accounts for proceeds from District bond issues that are expended on the acquisition or lease of sites, construction or renovation of school buildings, improving school grounds, or purchasing pupil transportation vehicles.
Additionally, the District reports the following fund type: Proprietary Fund – The Proprietary Fund is an Internal Service Fund that accounts for activities related to agreements with other governments where the District is the fiscal agent. Fiduciary Funds – The Fiduciary Funds are Agency Funds which account for resources held by the District on behalf of others. This fund type includes the Student Activities Fund, which accounts for monies raised by students to finance student clubs and organizations held by the District as an agent. In addition, funds that account for employee withholdings before the monies are remitted to the appropriate entities are included in the Agency Funds. The Proprietary Fund financial statements are reported using the economic resources measurement focus and accrual basis of accounting and are presented in a single column. Proprietary funds distinguish operating revenues and expenses from nonoperating items. Operating revenues and expenses generally result from providing services and producing and delivering goods in connection with a proprietary fund’s principal ongoing operations. The principal operating revenues of the District’s internal service fund is contributions for shared lobbying services. Operating expenses for the internal service fund include the cost of professional lobbying services. All revenues and expenses not meeting this definition are reported as nonoperating revenues and expenses. The Agency Funds are custodial in nature and do not have a measurement focus and is reported using the accrual basis of accounting. The Agency Funds are reported by fund type. D. Cash and Investments For purposes of the Statement of Cash Flows, the District considers all highly liquid investments with a maturity of three months or less when purchased to be cash equivalents. Cash and cash equivalents at year end were cash and investments held by the County Treasurer.
Page 48

WESTERN MARICOPA EDUCATION CENTER DISTRICT NO. 402 NOTES TO FINANCIAL STATEMENTS
JUNE 30, 2019
NOTE 1 – SUMMARY OF SIGNIFICANT ACCOUNTING POLICIES A.R.S. require the District to deposit all cash with the County Treasurer, except as discussed below. Cash with the County Treasurer is pooled for investment purposes, except for cash of the Debt Service and Bond Building Funds that may be invested separately. Interest earned from investments purchased with pooled monies is allocated to each of the District’s funds based on their average balances. As required by statute, interest earnings of the Bond Building Fund are recorded initially in that fund, but then transferred to the Debt Service Fund. All investments are stated at fair value. Statute authorizes the District to separately invest monies of the Bond Building and Debt Service Funds in the State Treasurer’s investment pools; obligations issued and guaranteed by the United States or any of its agencies or instrumentalities; specified state and local government bonds and notes; and interest bearing savings accounts or certificates of deposit. Statute authorizes the District to deposit monies of the Auxiliary Operations and Student Activities Funds in bank accounts. Monies in these funds may also be invested. In addition, statute authorizes the District to maintain various bank accounts such as clearing accounts to temporarily deposit receipts before they are transmitted to the County Treasurer; revolving accounts to pay minor disbursements; and withholdings accounts for taxes and employee insurance programs. Some of these bank accounts may be interest bearing. Statute does not include any requirements for credit risk, concentration of credit risk, interest rate risk, or foreign currency risk. Arizona statute requires a pooled collateral program for public deposits and a Statewide Collateral Pool Administrator (Administrator) in the State Treasurer’s Office. The purpose of the pooled collateral program is to ensure that governmental entities’ public deposits placed in participating depositories are secured with collateral of 102 percent of the public deposits, less any applicable deposit insurance. An eligible depository may not retain or accept any public deposit unless it has deposited the required collateral with a qualified escrow agent or the Administrator. The Administrator manages the pooled collateral program, including reporting on each depository’s compliance with the program. E. Investment Income Investment income is composed of interest, dividends, and net changes in the fair value of applicable investments. Investment income is included in other local revenue in the fund financial statements.
Page 49

WESTERN MARICOPA EDUCATION CENTER DISTRICT NO. 402 NOTES TO FINANCIAL STATEMENTS
JUNE 30, 2019
NOTE 1 – SUMMARY OF SIGNIFICANT ACCOUNTING POLICIES F. Receivables and Payables Activity between funds that is representative of lending/borrowing arrangements outstanding at the end of the fiscal year is referred to as either “due to/from other funds” (i.e., the current portion of interfund loans) or “advances to/from other funds” (i.e., the non-current portion of interfund loans). All other outstanding balances between funds are reported as “due to/from other funds.” Interfund balances between governmental funds are eliminated on the Statement of Net Position.
All receivables, including property taxes receivable, are shown net of an allowance for uncollectibles. G. Property Tax Calendar The County Treasurer is responsible for collecting property taxes for all governmental entities within the county. The county levies real property taxes on or before the third Monday in August that become due and payable in two equal installments. The first installment is due on the first day of October and becomes delinquent after the first business day of November. The second installment is due on the first day of March of the next year and becomes delinquent after the first business day of May. Pursuant to A.R.S., a lien against assessed real and personal property attaches on the first day of January preceding assessment and levy; however according to case law, an enforceable legal claim to the asset does not arise. H. Prepaid Items Certain payments to vendors reflect costs applicable to future accounting periods and are recorded as prepaid items in both the government-wide and fund financial statements. Prepaid items are recorded as expenses when consumed in the government-wide financial statements and as expenditures when purchased in the fund financial statements. I. Capital Assets Capital assets, which include land, leasehold improvements; buildings and improvements; vehicles, furniture and equipment; and construction in progress, are reported in the government-wide financial statements.
Page 50

WESTERN MARICOPA EDUCATION CENTER DISTRICT NO. 402 NOTES TO FINANCIAL STATEMENTS
JUNE 30, 2019
NOTE 1 – SUMMARY OF SIGNIFICANT ACCOUNTING POLICIES Capital assets are defined by the District as assets with an initial, individual cost in excess of $5,000 and an estimated useful life of more than one year. Capital assets are recorded at historical cost if purchased or constructed. Donated capital assets are recorded at acquisition value at the date of donation. The costs of normal maintenance and repairs that do not add to the value of the asset or materially extend the life of the asset are not capitalized. Capital assets are depreciated using the straight-line method over the following estimated useful lives:
Land improvements 20 years Buildings and improvements 20 - 50 years Vehicles, furniture and equipment 5 - 20 years
J. Deferred Outflows/Inflows of Resources In addition to assets, the statement of financial position may report a separate section for deferred outflows of resources. This separate financial statement element, deferred outflows of resources, represents a consumption of net position that applies to a future period and so will not be recognized as an outflow of resources (expense/expenditure) until then. In addition to liabilities, the statement of financial position may report a separate section for deferred inflows of resources. This separate financial statement element, deferred inflows of resources, represents an acquisition of net position that applies to a future period and so will not be recognized as an inflow of resources (revenue) until that time. K. Compensated Absences The District’s employee vacation and sick leave policies generally provide for granting vacation and sick leave with pay in varying amounts. Only benefits considered vested are recognized in the financial statements. The liability for vacation and sick leave is reported in the government-wide financial statements. A liability for these amounts is reported in governmental funds only if they have matured, for example, as a result of employee leave, resignations and retirements. Generally, resources from the General Fund are used to pay for compensated absences.
Page 51

WESTERN MARICOPA EDUCATION CENTER DISTRICT NO. 402 NOTES TO FINANCIAL STATEMENTS
JUNE 30, 2019
NOTE 1 – SUMMARY OF SIGNIFICANT ACCOUNTING POLICIES L. Pensions and Other Postemployment Benefits
For purposes of measuring the net pension and other postemployment benefit (OPEB) assets and liabilities, related deferred outflows of resources and deferred inflows of resources, and related expenses, information about the pension and OPEB plans’ fiduciary net position and additions to/deductions from the plans’ fiduciary net position have been determined on the same basis as they are reported by the plan. For this purpose, benefit payments (including refunds of employee contributions) are recognized when due and payable in accordance with the benefit terms. Investments are reported at fair value. M. Long-term Obligations In the government-wide financial statements, and proprietary fund types in the fund financial statements, long-term debt and other long-term obligations are reported as liabilities on the statement of net position. Bond premiums and discounts are amortized over the life of the bonds using the straight-line method. Deferred amounts on refunding result from the difference between the carrying value of refunded debt and its reacquisition price. This amount is deferred and amortized over the shorter of the life of the refunded or refunding debt. In the fund financial statements, governmental fund types recognize bond premiums and discounts, as well as bond issuance costs, during the current period. The face amount of debt issued is reported as other financing sources. Premiums received on debt issuances are reported as other financing sources while discounts on debt issuances are reported as other financing uses. Issuance costs, whether or not withheld from the actual debt proceeds received, are reported as debt service expenditures. N. Interfund Activity Flows of cash from one fund to another without a requirement for repayment are reported as interfund transfers. Interfund transfers between governmental funds are eliminated in the Statement of Activities. Interfund transfers in the fund financial statements are reported as other financing sources/uses in governmental funds. O. Net Position Flow Assumption
In the government-wide and proprietary fund financial statements the District applies restricted resources first when outlays are incurred for purposes for which either restricted or unrestricted amounts are available.
Page 52

WESTERN MARICOPA EDUCATION CENTER DISTRICT NO. 402 NOTES TO FINANCIAL STATEMENTS
JUNE 30, 2019
NOTE 1 – SUMMARY OF SIGNIFICANT ACCOUNTING POLICIES P. Estimates The preparation of the financial statements in conformity with accounting principles generally accepted in the United States of America requires management to make estimates and assumptions that affect the amounts reported in the financial statements and accompanying notes. Actual results may differ from those estimates.
NOTE 2 – FUND BALANCE CLASSIFICATIONS Fund balances of the governmental funds are reported separately within classifications based on a hierarchy of the constraints placed on the use of those resources. The classifications are based on the relative strength of the constraints that control how the specific amounts can be spent. The classifications are nonspendable, restricted, and unrestricted, which includes committed, assigned, and unassigned fund balance classifications. Nonspendable. The nonspendable fund balance classification includes amounts that cannot be spent because they are not in spendable form, or legally or contractually required to be maintained intact. Restricted. Fund balance is reported as restricted when constraints placed on the use of resources are either externally imposed by creditors (such as through debt covenants), grantors, contributors, or laws or regulations of other governments or is imposed by law through constitutional provisions or enabling legislation. Committed. The committed fund balance classification includes amounts that can be used only for the specific purposes imposed by formal action of the Governing Board. Those committed amounts cannot be used for any other purpose unless the Governing Board removes or changes the specified use by taking the same type of action it employed to previously commit those amounts. The District does not have a formal policy or procedures for the utilization of committed fund balance, accordingly, no committed fund balance amounts are reported. Assigned. Amounts in the assigned fund balance classification are intended to be used by the District for specific purposes but do not meet the criteria to be classified as restricted or committed. In governmental funds other than the General Fund, assigned fund balance represents the remaining amount that is not restricted or committed. In the General Fund, assigned amounts represent intended uses established by the Governing Board or a management official delegated that authority by the formal Governing Board action. The District does not have a formal policy for the utilization of assigned fund balance, accordingly, no assigned fund balance amounts are reported.
Page 53

WESTERN MARICOPA EDUCATION CENTER DISTRICT NO. 402 NOTES TO FINANCIAL STATEMENTS
JUNE 30, 2019
NOTE 2 – FUND BALANCE CLASSIFICATIONS Unassigned. Unassigned fund balance is the residual classification for the General Fund and includes all spendable amounts not contained in the other classifications. In other governmental funds, the unassigned classification is used only to report a deficit balance resulting from overspending for specific purposes for which amounts had been restricted, committed, or assigned. The District applies restricted resources first when outlays are incurred for purposes for which either restricted or unrestricted (committed, assigned, and unassigned) amounts are available. Similarly, within unrestricted fund balance, committed amounts are reduced first followed by assigned, and then unassigned amounts when expenditures are incurred for purposes for which amounts in any of the unrestricted fund balance classifications could be used.
The table below provides detail of the major components of the District’s fund balance classifications at year end.
General
Fund
Debt
Service Fund
Unrestricted Capital Outlay Fund
Bond Building
Fund
Non-Major Governmental
Funds Fund Balances:
Restricted: Debt service $ $ 1,132,943 $ $ $ Capital projects 27,819,849 Bond building projects 5,756,647 Voter approved initiatives: Classroom site 1,429,840 Instructional improvement 260,065 Federal and state projects 435,600 Civic center 173,838 Community school 827,429 Extracurricular activities 28,354 Gifts and donations 359,344 Career, technical and vocational education 66,457
Unassigned 19,191,678Total fund balances $ 19,191,678 $ 1,132,943 $ 27,819,849 $ 5,756,647 $ 3,580,927
Page 54

WESTERN MARICOPA EDUCATION CENTER DISTRICT NO. 402 NOTES TO FINANCIAL STATEMENTS
JUNE 30, 2019
NOTE 3 – RESTRICTED NET POSITION
The table below provides detail of the major components of the District’s restricted net position at year end.
Governmental
Activities Restricted Net Position:
Debt service $ 1,251,559 Capital projects 27,819,849 Voter approved initiatives 1,689,905 Federal and state projects 435,600 Civic center 173,838 Community school 827,429 Extracurricular activities 28,354 Gifts and donations 359,344 Career, technical and vocational education 66,457
Total $ 32,652,335 NOTE 4 – STEWARDSHIP, COMPLIANCE AND ACCOUNTABILITY
Excess Expenditures Over Budget – At year end, the District had expenditures in funds that exceeded the budgets, however, this does not constitute a violation of any legal provisions.
NOTE 5 – CASH AND INVESTMENTS
Custodial Credit Risk – Deposits. Custodial credit risk is the risk that in the event of bank failure the District’s deposits may not be returned to the District. The District does not have a deposit policy for custodial credit risk. At year end, the carrying amount of the District’s deposits was $127,338 and the bank balance was $130,272. Fair Value Measurements. The District categorizes its fair value measurements within the fair value hierarchy established by generally accepted accounting principles. The hierarchy is based on the valuation inputs used to measure the fair value of the asset.
Level 1 inputs are quoted prices in active markets for identical assets Level 2 inputs are significant other observable inputs Level 3 inputs are significant unobservable inputs
Page 55

WESTERN MARICOPA EDUCATION CENTER DISTRICT NO. 402 NOTES TO FINANCIAL STATEMENTS
JUNE 30, 2019
NOTE 5 – CASH AND INVESTMENTS The County Treasurer’s pool is an external investment pool with no regulatory oversight. The pool is not required to register (and is not registered) with the Securities and Exchange Commission. The fair value of each participant’s position in the County Treasurer investment pool approximates the value of the participant’s shares in the pool and the participants’ shares are not identified with specific investments. Participants in the pool are not required to categorize the value of shares in accordance with the fair value hierarchy. At year end, the District’s investments consisted of the following:
Average Maturities Fair Value County Treasurer’s investment pool 318 days $ 69,594,774Total $ 69,594,774
Interest Rate Risk. The District does not have a formal investment policy that limits investment maturities as a means of managing its exposure to fair value losses arising from increasing interest rates. Credit Risk. The District has no investment policy that would further limit its investment choices. As of year end, the District’s investment in the County Treasurer’s investment pool did not receive a credit quality rating from a national rating agency. Custodial Credit Risk – Investments. The District’s investment in the County Treasurer’s investment pool represents a proportionate interest in the pool’s portfolio; however, the District’s portion is not identified with specific investments and is not subject to custodial credit risk.
NOTE 6 – RECEIVABLES
Receivable balances, net of allowance for uncollectibles, have been disaggregated by type and presented separately in the financial statements with the exception of due from governmental entities. Due from governmental entities, net of allowance for uncollectibles, as of year end for the District’s individual major funds and non-major governmental and internal service funds in the aggregate were as follows:
General
Fund
Non-Major Governmental
and Other Funds
Due from other governmental entities: Due from federal government $ $ 27,769Due from state government 8,248,157 125,593
Net due from governmental entities $ 8,248,157 $ 153,362
Page 56

WESTERN MARICOPA EDUCATION CENTER DISTRICT NO. 402 NOTES TO FINANCIAL STATEMENTS
JUNE 30, 2019
NOTE 7 – CAPITAL ASSETS A summary of capital asset activity for the current fiscal year follows:
Governmental Activities Beginning Balance Increase Decrease
Ending Balance
Capital assets, not being depreciated: Land $ 14,732,341 $ $ $ 14,732,341 Construction in progress 19,044,563 37,426,274 25,208,414 31,262,423
Total capital assets, not being depreciated 33,776,904 37,426,274 25,208,414 45,994,764 Capital assets, being depreciated:
Land improvements 996,703 106,128 1,102,831 Buildings and improvements 105,562,061 25,423,471 130,985,532 Vehicles, furniture and equipment 7,401,200 991,982 11,672 8,381,510
Total capital assets being depreciated 113,959,964 26,521,581 11,672 140,469,873 Less accumulated depreciation for:
Land and improvements (210,503) (51,234) (261,737)Buildings and improvements (7,055,005) (2,365,681) (9,420,686)Vehicles, furniture and equipment (2,343,091) (656,757) (11,672) (2,988,176)
Total accumulated depreciation (9,608,599) (3,073,672) (11,672) (12,670,599)
Total capital assets, being depreciated, net 104,351,365 23,447,909 127,799,274 Governmental activities capital assets, net $ 138,128,269 $ 60,874,183 $ 25,208,414 $ 173,794,038
Depreciation expense was charged to governmental functions as follows:
Instruction $ 2,701,964Support services – students and staff 133,203Support services – administration 193,264Operation and maintenance of plant services 40,460Operation of non-instructional services 4,781Total depreciation expense – governmental activities $ 3,073,672
Construction Commitments – At year end, the District had contractual commitments related to various capital projects for renovations and construction at the Southwest and Northwest Campuses as well as remodeling of the District office and Start Center locations. At year end the District had spent $31.3 million on the projects and had estimated remaining contractual commitments of $4.4 million. These projects are being funded with bond proceeds.
NOTE 8 – SHORT TERM DEBT – REVOLVING LINE OF CREDIT
The District has a $1.0 million revolving line of credit to provide cash flow during the year to mitigate the impact of timing differences of expenditures and the receipt of state aid and property tax revenues. At year end, the District had $1.0 million in unused line of credit.
Page 57

WESTERN MARICOPA EDUCATION CENTER DISTRICT NO. 402 NOTES TO FINANCIAL STATEMENTS
JUNE 30, 2019
NOTE 9 – GENERAL OBLIGATION BONDS PAYABLE Bonds payable at year end consisted of the following outstanding general obligation bonds. Of the total amount originally authorized, $61.0 million remains unissued. The bonds are both callable and noncallable with interest payable semiannually. Property taxes from the Debt Service Fund will be used to pay bonded debt. The District’s legal debt limit is $192.9 million, and the available margin is $58.7 million.
Purpose
Original Amount Issued
Interest Rates
RemainingMaturities
Outstanding Principal
June 30, 2019 Due Within One Year
Governmental activities: School Improvement Bonds,
Project of 2012, Series A (2013) $ 35,000,000
2.0-5.0% 7/1/19-32 $ 27,470,000 $ 975,000 School Improvement Bonds,
Project of 2012, Series B (2014) 25,000,000
2.0-4.5% 7/1/19-34 23,550,000 1,525,000 School Improvement Bonds,
Project of 2012, Series C (2015) 14,900,000
1.5-4.25% 7/1/19-35 14,900,000 445,000 School Improvement Bonds,
Project of 2016, Series A (2017) 70,035,000
2.75-5.0% 7/1/19-27 60,680,000 7,145,000 Total $126,600,000 $ 10,090,000
Annual debt service requirements to maturity on general obligation bonds at year end are summarized as follows:
Governmental Activities Year ending June 30: Principal Interest
2020 $ 10,090,000 $ 5,153,994 2021 7,735,000 4,798,656 2022 7,255,000 4,497,956 2023 8,025,000 4,167,006 2024 8,515,000 3,794,518 2025-29 52,875,000 11,483,445 2030-34 22,020,000 4,345,777 2035-36 10,085,000 416,738
Total $ 126,600,000 $ 38,658,090
Page 58

WESTERN MARICOPA EDUCATION CENTER DISTRICT NO. 402 NOTES TO FINANCIAL STATEMENTS
JUNE 30, 2019
NOTE 10 – CHANGES IN LONG-TERM LIABILITIES Long-term liability activity for the current fiscal year follows:
Beginning Balance Additions Reductions
Ending Balance
Due Within One Year
Governmental activities: Bonds payable:
General obligation bonds $ 138,655,000 $ $ 12,055,000 $ 126,600,000 $ 10,090,000Premium 11,756,156 1,203,429 10,552,727
Total bonds payable 150,411,156 13,258,429 137,152,727 10,090,000 Net OPEB liability 23,576 17,221 40,797 Net pension liability 10,384,329 541,344 10,925,673 Compensated absences payable 699,070 379,314 158,503 919,881 79,409 Governmental activity long-term
liabilities $ 161,518,131 $ 937,879 $ 13,416,932 $ 149,039,078 $ 10,169,409
NOTE 11 – INTERFUND TRANSFERS
At year end, interfund transfers were as follows: Transfers between funds of $589,862 were used to move investment income earned in the Bond Building Fund that is required by statute to be expended in the Debt Service Fund.
NOTE 12 – RISK MANAGEMENT
The District is exposed to various risks of loss related to torts; theft of, damage to, and destruction of assets; errors and omissions; injuries to employees; and natural disasters. The District was unable to obtain general property and liability insurance at a cost it considered to be economically justifiable. Therefore, the District joined the Arizona School Risk Retention Trust, Inc. (ASRRT). ASRRT is a public entity risk pool currently operating as a common risk management and insurance program for school districts and community colleges in the State. The District pays an annual premium to ASRRT for its general insurance coverage. The agreement provides that ASRRT will be self-sustaining through member premiums and will reinsure through commercial companies for claims in excess of specified amounts.
Page 59

WESTERN MARICOPA EDUCATION CENTER DISTRICT NO. 402 NOTES TO FINANCIAL STATEMENTS
JUNE 30, 2019
NOTE 12 – RISK MANAGEMENT The District’s employees have health and accident insurance coverage with the Arizona School Board Association Insurance Trust (ASBAIT). ASBAIT is a public entity risk pool currently operating as a common risk management and insurance program for school districts in the State. The District pays a monthly premium to ASBAIT for employees’ health and accident insurance coverage. The agreement provides that ASBAIT will be self-sustaining through member premiums and will reinsure through commercial companies for claims in excess of specified amounts. The District joined the Arizona School Alliance for Workers’ Compensation, Inc. (Alliance) together with other school districts in the state for risks of loss related to workers’ compensation claims. The Alliance is a public entity risk pool currently operating as a common risk management and insurance program for school districts in the State. The District pays quarterly premiums to the Alliance for its employee workers’ compensation coverage. The agreement provides that the Alliance will be self-sustaining through members’ premiums and will reinsure through commercial companies for claims in excess of specified amounts for each insured event.
NOTE 13 – PENSIONS AND OTHER POSTEMPLOYMENT BENEFITS
Plan Description. District employees participate in the Arizona State Retirement System (ASRS). The ASRS administers a cost-sharing multiple-employer defined benefit pension plan, a cost-sharing multiple-employer defined benefit health insurance premium benefit (OPEB) plan, and a cost-sharing multiple-employer defined benefit long-term disability (OPEB) plan. The Arizona State Retirement System Board governs the ASRS according to the provisions of A.R.S. Title 38, Chapter 5, Articles 2 and 2.1. ASRS is a component unit of the State of Arizona. The ASRS issues a publicly available financial report that includes its financial statements and required supplementary information. The report is available on the ASRS website at www.azasrs.gov. Aggregate Amounts. At June 30, 2019, the District reported the following aggregate amounts related to pensions and OPEB for all plans to which it contributes:
Pension OPEB
Net assets $ $ (26,697)
Net liability 10,925,673 40,797
Deferred outflows of resources 3,730,189 123,181
Deferred inflows of resources 1,291,679 81,956
Expense 2,149,232 44,513
Contributions 1,018,755 56,497
Page 60

WESTERN MARICOPA EDUCATION CENTER DISTRICT NO. 402 NOTES TO FINANCIAL STATEMENTS
JUNE 30, 2019
NOTE 13 – PENSIONS AND OTHER POSTEMPLOYMENT BENEFITS Benefits Provided. The ASRS provides retirement, health insurance premium supplement, long-term disability, and survivor benefits. State statute establishes benefit terms. Retirement benefits are calculated on the basis of age, average monthly compensation, and service credit as follows:
Retirement Initial Membership Date:
Before July 1, 2011 On or After July 1, 2011 Years of service and
age required to receive benefit
Sum of years and age equals 80 10 years, age 62 5 years, age 50* Any years, age 65
30 years, age 55 25 years, age 60 10 years, age 62 5 years, age 50* Any years, age 65
Final average salary is
based on Highest 36 months of last
120 months Highest 60 months of last
120 months Benefit percent per
year of service 2.1% to 2.3% 2.1% to 2.3%
*With actuarially reduced benefits
Retirement benefits for members who joined the ASRS prior to September 13, 2013, are subject to automatic cost-of-living adjustments based on excess investment earnings. Members with a membership date on or after September 13, 2013, are not eligible for cost-of-living adjustments. Survivor benefits are payable upon a member’s death. For retired members, the survivor benefit is determined by the retirement benefit option chosen. For all other members, the beneficiary is entitled to the member’s account balance that includes the member’s contributions and employer’s contributions, plus interest earned. Retired and disabled members, with at least five years of credited service, are eligible to receive health insurance premium benefits. The benefits are payable only with respect to allowable health insurance premiums for which the member is responsible. For members with 10 or more years of service, benefits range from $100 per month to $260 per month depending on the age of the member and dependents. For members with five to nine years of service, the benefits are the same dollar amounts as above multiplied by a vesting fraction based on completed years of service.
Page 61

WESTERN MARICOPA EDUCATION CENTER DISTRICT NO. 402 NOTES TO FINANCIAL STATEMENTS
JUNE 30, 2019
NOTE 13 – PENSIONS AND OTHER POSTEMPLOYMENT BENEFITS Active members are eligible for a long-term disability benefit in the event they become unable to perform their work. The monthly benefit is equal to two-thirds of their monthly earnings. Members receiving benefits continue to earn service credit up to their normal retirement dates. Members with long-term disability commencement dates after June 30, 1999 are limited to 30 years of service or the service on record as of the effective disability date, if their service is greater than 30 years.
Contributions. In accordance with state statutes, annual actuarial valuations determine active member and employer contribution requirements. The combined active member and employer contribution rates are expected to finance the costs of benefits employees earn during the year, with an additional amount to finance any unfunded accrued liability. For the current fiscal year, active ASRS members were required by statute to contribute at the actuarially determined rate of 11.80 percent (11.64 percent for retirement and 0.16 percent for long-term disability) of the members’ annual covered payroll, and the District was required by statute to contribute at the actuarially determined rate of 11.80 percent (11.18 percent for retirement, 0.46 percent for health insurance premium benefit, and 0.16 percent for long-term disability) of the active members’ annual covered payroll. The District’s contributions for the year ended June 30, 2019 were as follows:
Employers are also required to pay an Alternate Contribution Rate (ACR), for retired members who return to work in positions that would typically be filled by an employee who contributes to ASRS. The District was required by statute to contribute at the actuarially determined rate of 10.53 percent (10.41 for retirement, 0.06 percent for health insurance premium benefit, and 0.06 percent for long-term disability). ACR contributions are included in employer contributions presented above.
The District’s pension and OPEB contributions are paid by the same funds as the employee’s salary, with the largest component coming from the General Fund.
Contributions
Pension $ 1,018,755
Health Insurance Premium 41,917
Long-Term Disability 14,580
Page 62

WESTERN MARICOPA EDUCATION CENTER DISTRICT NO. 402 NOTES TO FINANCIAL STATEMENTS
JUNE 30, 2019
NOTE 13 – PENSIONS AND OTHER POSTEMPLOYMENT BENEFITS Pension and OPEB Assets/Liability. The net pension and OPEB assets/liability were measured as of June 30, 2018. The total liability used to calculate the net asset or net liability was determined using update procedures to roll forward the total liability from an actuarial valuation as of June 30, 2017, to the measurement date of June 30, 2018. The total liability as of June 30, 2018 reflects changes in actuarial assumptions based on the results of an actuarial experience study for the five-year period ended June 30, 2016, including decreasing the discount rate from 8.0 percent to 7.5 percent, changing the projected salary increases from 3-6.75 percent to 2.7-7.2 percent, decreasing the inflation rate from 3 percent to 2.3 percent, and changing the mortality rates. The District’s proportion of the net assets/liability was based on the District’s actual contributions to the applicable plan relative to the total of all participating employers’ contributions to the plan for the year ended June 30, 2018. At June 30, 2019, the District reported the following amounts for its proportionate share of the ASRS plans net assets/liability. In addition, at June 30, 2018, the District’s percentage proportion for each plan and the related change from its proportion measured as of June 30, 2017 was:
Pension/OPEB Expense and Deferred Outflows/Inflows of Resources. The District has deferred outflows and inflows of resources related to the net pension and OPEB assets/liabilities. Certain changes in the net pension and OPEB assets/liability are recognized as pension and OPEB expense over a period of time rather than the year of occurrence. For the year ended June 30, 2019, the District recognized pension and OPEB expense as follows:
Net(Assets) Liability
District% Proportion
Increase (Decrease)
Pension $ 10,925,673 0.078 0.011
Health Insurance Premium (26,697) 0.074 0.011
Long-Term Disability 40,797 0.078 0.013
Expense
Pension $ 2,149,232
Health Insurance Premium 29,060
Long-Term Disability 15,453
Page 63
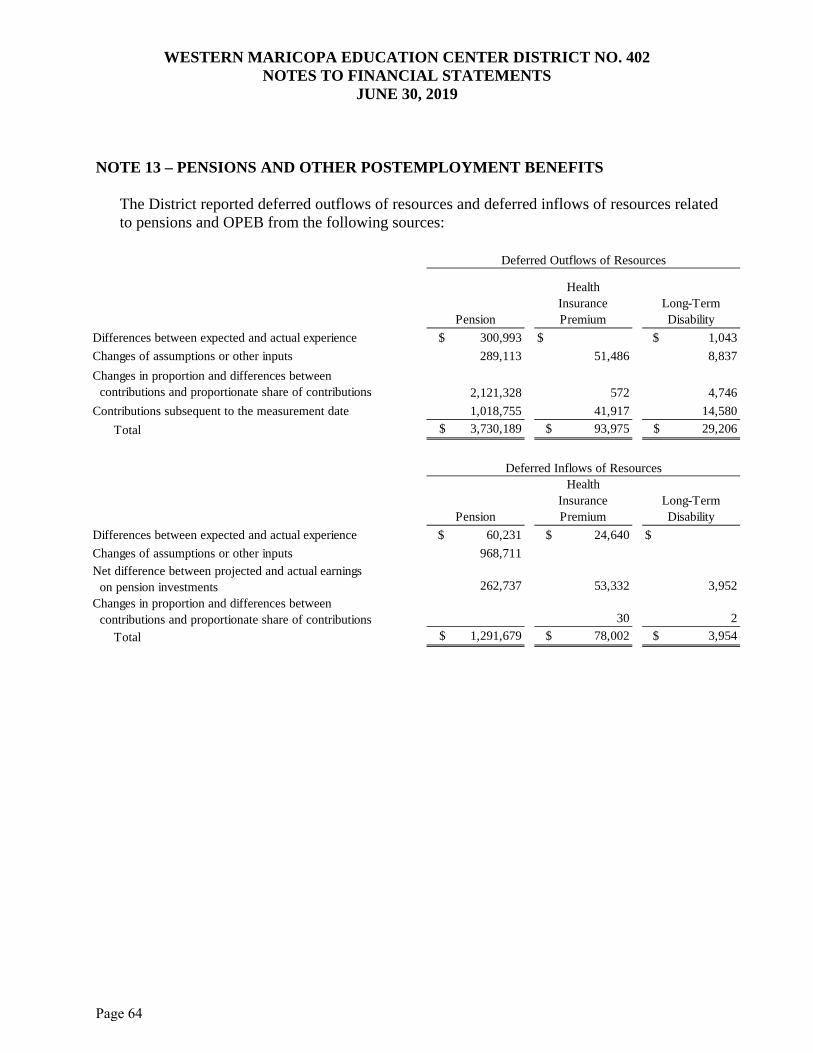
WESTERN MARICOPA EDUCATION CENTER DISTRICT NO. 402 NOTES TO FINANCIAL STATEMENTS
JUNE 30, 2019
NOTE 13 – PENSIONS AND OTHER POSTEMPLOYMENT BENEFITS The District reported deferred outflows of resources and deferred inflows of resources related to pensions and OPEB from the following sources:
Pension
HealthInsurance Premium
Long-TermDisability
Differences between expected and actual experience $ 300,993 $ $ 1,043
Changes of assumptions or other inputs 289,113 51,486 8,837
Changes in proportion and differences between contributions and proportionate share of contributions 2,121,328 572 4,746
Contributions subsequent to the measurement date 1,018,755 41,917 14,580
Total $ 3,730,189 $ 93,975 $ 29,206
Pension
HealthInsurance Premium
Long-TermDisability
Differences between expected and actual experience $ 60,231 $ 24,640 $
Changes of assumptions or other inputs 968,711
Net difference between projected and actual earnings on pension investments 262,737 53,332 3,952
Changes in proportion and differences between contributions and proportionate share of contributions 30 2
Total $ 1,291,679 $ 78,002 $ 3,954
Deferred Outflows of Resources
Deferred Inflows of Resources
Page 64

WESTERN MARICOPA EDUCATION CENTER DISTRICT NO. 402 NOTES TO FINANCIAL STATEMENTS
JUNE 30, 2019
NOTE 13 – PENSIONS AND OTHER POSTEMPLOYMENT BENEFITS The amounts of deferred outflows of resources resulting from contributions subsequent to the measurement date as reported in the table above will be recognized as an adjustment of the net pension and OPEB assets/liability in the year ended June 30, 2020. Other amounts reported as deferred outflows of resources and deferred inflows of resources related to pensions and OPEB will be recognized in pension and OPEB expense as follows:
Actuarial Assumptions. The significant actuarial assumptions used to measure the total pension and OPEB liability are as follows:
Pension OPEB Actuarial valuation date June 30, 2017 June 30, 2017 Actuarial roll forward date June 30, 2018 June 30, 2018 Actuarial cost method Entry age normal Entry age normal Investment rate of return 7.5% 7.5% Projected salary increases 2.7-7.2% Not applicable Inflation 2.3% 2.3% Permanent base increases Included Not applicable Mortality rates 2017 SRA Scale U-MP Health Ins: 2017
SRA Scale U-MP, LTD: 2012 GLDT
Healthcare cost trend rate Not applicable Not applicable
The actuarial assumptions used in the June 30, 2017 valuation were based on the results of an actuarial experience study for the five-year period ended June 30, 2016. The purpose of the experience study was to review actual experience in relation to the actuarial assumptions in effect. The ASRS Board adopted the experience study recommended changes which were applied to the June 30, 2017, actuarial valuation. The long-term expected rate of return on ASRS plan investments was determined to be 7.5 percent using a building-block method in which best-estimate ranges of expected future real rates of return (expected returns, net of investment expense and inflation) are developed for each major asset class. These ranges are combined to produce the long-term expected rate of return by weighting the expected future real rates of return by the target asset allocation percentage, excluding any expected inflation.
Year Ending June 30: Pension
HealthInsurance Premium
Long-TermDisability
2020 $ 1,467,910 $ (10,222) $ 778
2021 468,224 (10,221) 779
2022 (398,552) (10,221) 780
2023 (117,827) 1,146 1,838
2024 3,574 2,032
Thereafter 4,465
Page 65

WESTERN MARICOPA EDUCATION CENTER DISTRICT NO. 402 NOTES TO FINANCIAL STATEMENTS
JUNE 30, 2019
NOTE 13 – PENSIONS AND OTHER POSTEMPLOYMENT BENEFITS On June 29, 2018, the ASRS Board approved updated strategic asset allocation targets, to be effective July 2018. The target allocation and best estimates of geometric real rates of return for each major asset class for all ASRS plans are summarized in the following table:
Asset Class Target
Allocation
Long-Term Expected Real Rate of Return
Equity 50% 5.50% Fixed income 30% 3.83 Real estate 20% 5.85
Total 100% Discount Rate. The discount rate used to measure the ASRS total pension and OPEB liability was 7.5 percent, which was a decrease of 0.5 from the discount rate used as of June 30, 2017. The projection of cash flows used to determine the discount rate assumed that contributions from participating employers will be made based on the actuarially determined rates based on the ASRS Board’s funding policy, which establishes the contractually required rate under Arizona statute. Based on those assumptions, the plans’ fiduciary net position was projected to be available to make all projected future benefit payments of current plan members. Therefore, the long-term expected rate of return on investments was applied to all periods of projected benefit payments to determine the total pension and OPEB liability. Sensitivity of the Proportionate Share of the Net Pension and OPEB Asset/Liability to Changes in the Discount Rate. The following presents the District’s proportionate share of the net pension and OPEB assets/liability calculated using the discount rate of 7.5 percent, as well as what the proportionate share of the net pension and OPEB asset/liability would be if it were calculated using a discount rate that is 1-percentage-point lower or 1-percentage-point higher than the current rate:
Pension and OPEB Plan Fiduciary Net Position. Detailed information about the pension and OPEB plan’s fiduciary net position is available in the separately issued ASRS financial report. The report is available on the ASRS website at www.azasrs.gov.
1% DecreaseCurrent
Discount Rate 1% Increase
Rate 6.5% 7.5% 8.5%
Pension $ 15,574,798 $ 10,925,673 $ 7,041,404
Health Insurance Premium 94,594 (26,697) (130,013)
Long-Term Disability 46,234 40,797 35,521
Proportionate share of the net (assets) liability
Page 66

WESTERN MARICOPA EDUCATION CENTER DISTRICT NO. 402 NOTES TO FINANCIAL STATEMENTS
JUNE 30, 2019
NOTE 14 – JOINTLY FUNDED OPERATIONS The District is the fiscal agent for an agreement among other State of Arizona career technical education districts primarily to fund the services of a lobbyist, as well as costs for career meetings and ventures among the career technical education districts.
NOTE 15 - SUBSEQUENT EVENT
On September 5, 2019, the District issued School Improvement Bonds, Project of 2016, Series B in the amount of $53,035,000, maturing between July 1, 2020 and July 1, 2028, with an average interest rate of 4.35 percent. The purpose of these bonds is to construct and renovate school facilities, supply furniture, equipment, and technology, and purchase or lease land for school lots.
Page 67

(This page intentionally left blank)
Page 68
REQUIRED SUPPLEMENTARY INFORMATION
Page 69

Revenues:Other localProperty taxesState aid and grants
Total revenues
Expenditures:Current -
InstructionSupport services - students and staffSupport services - administrationOperation and maintenance of plant services
Total expenditures
Changes in fund balances
Fund balances, beginning of year
Fund balances (deficits), end of year
Budgeted Amounts
Original
$
18,486,2014,638,3825,070,3772,352,286
30,547,246
(30,547,246)
$ (30,547,246)
Final
$
17,656,9444,548,0124,698,1312,374,110
29,277,197
(29,277,197)
$ (29,277,197)
Non-GAAP Actual
$ 3,435,3317,503,083
16,784,89527,723,309
16,259,6164,322,1164,454,2182,139,840
27,175,790
547,519
17,559,528
$ 18,107,047
Variance with Final Budget
Positive (Negative)
$ 3,435,3317,503,083
16,784,89527,723,309
1,397,328225,896243,913234,270
2,101,407
29,824,716
17,559,528
$ 47,384,244
WESTERN MARICOPA EDUCATION CENTER DISTRICT NO. 402SCHEDULE OF REVENUES, EXPENDITURES AND
CHANGES IN FUND BALANCES - BUDGET AND ACTUALGENERAL
YEAR ENDED JUNE 30, 2019
See accompanying notes to this schedule.
Page 70

2019 2018 2017 2016 2015
Measurement date June 30, 2018 June 30, 2017 June 30, 2016 June 30, 2015 June 30, 2014
District's proportion of the net pension(assets) liability 0.08% 0.07% 0.05% 0.04% 0.03%
District's proportionate share of the netpension (assets) liability 10,925,673$ 10,384,329$ 8,720,985$ 6,473,683$ 4,782,969$
District's covered payroll 7,771,422$ 6,489,499$ 5,033,014$ 3,805,161$ 2,939,262$
District's proportionate share of the net pension (assets) liability as a percentageof its covered payroll 140.59% 160.02% 173.28% 170.13% 162.73%
Plan fiduciary net position as a percentage of the total pension liability 73.40% 69.92% 67.06% 68.35% 69.49%
2019 2018 2017 2016 2015
Actuarially determined contribution 1,018,755$ 847,085$ 699,568$ 546,082$ 414,382$
Contributions in relation to the actuarially determined contribution 1,018,755 847,085 699,568 546,082 414,382
Contribution deficiency (excess) $ $ $ $ $
District's covered payroll 9,112,299$ 7,771,422$ 6,489,499$ 5,033,014$ 3,805,161$
Contributions as a percentageof covered payroll 11.18% 10.90% 10.78% 10.85% 10.89%
NOTE:
WESTERN MARICOPA EDUCATION CENTER DISTRICT NO. 402SCHEDULE OF THE PROPORTIONATE SHARE OF THE NET PENSION LIABILITY
ARIZONA STATE RETIREMENT SYSTEMLAST FIVE FISCAL YEARS
SCHEDULE OF PENSION CONTRIBUTIONSARIZONA STATE RETIREMENT SYSTEM
LAST FIVE FISCAL YEARS
The pension and OPEB schedules in the required supplementary information are intended to show information for ten years, and additional information will be displayed as it becomes available.
See accompanying notes to this schedule.
Page 71
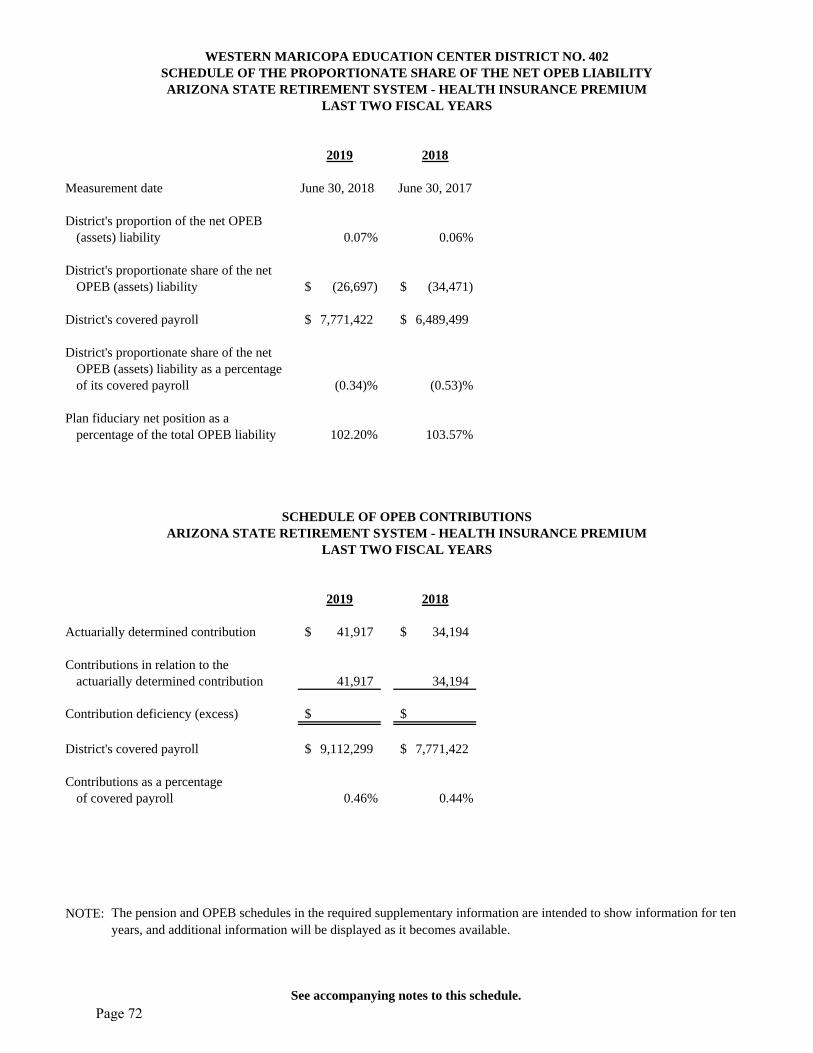
2019 2018 2017 2016 2015
Measurement date June 30, 2018 June 30, 2017 0 0 0
District's proportion of the net OPEB(assets) liability 0.07% 0.06% 0.00% 0.00% 0.00%
District's proportionate share of the netOPEB (assets) liability (26,697)$ (34,471)$ $ $ $
District's covered payroll 7,771,422$ 6,489,499$ $ $ $
District's proportionate share of the net OPEB (assets) liability as a percentageof its covered payroll (0.34)% (0.53)% #DIV/0! #DIV/0! #DIV/0!
Plan fiduciary net position as a percentage of the total OPEB liability 102.20% 103.57% 0.00% 0.00% 0.00%
2019 2018 2017 2016 2015
Actuarially determined contribution 41,917$ 34,194$ $ $ $
Contributions in relation to the actuarially determined contribution 41,917 34,194
Contribution deficiency (excess) $ $ $ $ $
District's covered payroll 9,112,299$ 7,771,422$ $ $ $
Contributions as a percentageof covered payroll 0.46% 0.44% #DIV/0! #DIV/0! #DIV/0!
NOTE:
LAST TWO FISCAL YEARS
The pension and OPEB schedules in the required supplementary information are intended to show information for ten years, and additional information will be displayed as it becomes available.
SCHEDULE OF OPEB CONTRIBUTIONSARIZONA STATE RETIREMENT SYSTEM - HEALTH INSURANCE PREMIUM
LAST TWO FISCAL YEARS
WESTERN MARICOPA EDUCATION CENTER DISTRICT NO. 402SCHEDULE OF THE PROPORTIONATE SHARE OF THE NET OPEB LIABILITYARIZONA STATE RETIREMENT SYSTEM - HEALTH INSURANCE PREMIUM
See accompanying notes to this schedule.
Page 72

2019 2018 2017 2016 2015
Measurement date June 30, 2018 June 30, 2017 0 0 0
District's proportion of the net OPEB(assets) liability 0.08% 0.07% 0.00% 0.00% 0.00%
District's proportionate share of the netOPEB (assets) liability 40,797$ 23,576$ $ $ $
District's covered payroll 7,771,422$ 6,489,499$ $ $ $
District's proportionate share of the net OPEB (assets) liability as a percentageof its covered payroll 0.52% 0.36% #DIV/0! #DIV/0! #DIV/0!
Plan fiduciary net position as a percentage of the total OPEB liability 77.83% 84.44% 0.00% 0.00% 0.00%
2019 2018 2017 2016 2015
Actuarially determined contribution 14,580$ 12,434$ $ $ $
Contributions in relation to the actuarially determined contribution 14,580 12,434
Contribution deficiency (excess) $ $ $ $ $
District's covered payroll 9,112,299$ 7,771,422$ $ $ $
Contributions as a percentageof covered payroll 0.16% 0.16% #DIV/0! #DIV/0! #DIV/0!
NOTE:
LAST TWO FISCAL YEARS
The pension and OPEB schedules in the required supplementary information are intended to show information for ten years, and additional information will be displayed as it becomes available.
SCHEDULE OF OPEB CONTRIBUTIONSARIZONA STATE RETIREMENT SYSTEM - LONG-TERM DISABILITY
LAST TWO FISCAL YEARS
WESTERN MARICOPA EDUCATION CENTER DISTRICT NO. 402SCHEDULE OF THE PROPORTIONATE SHARE OF THE NET OPEB LIABILITY
ARIZONA STATE RETIREMENT SYSTEM - LONG-TERM DISABILITY
See accompanying notes to this schedule.
Page 73

WESTERN MARICOPA EDUCATION CENTER DISTRICT NO. 402 NOTES TO REQUIRED SUPPLEMENTARY INFORMATION
JUNE 30, 2019
NOTE 1 – BUDGETARY BASIS OF ACCOUNTING The District budget is prepared on a basis consistent with accounting principles generally accepted in the United States of America, except for the following item.
Certain activities reported in the General Fund are budgeted in separate funds in accordance with Arizona Revised Statutes.
The following schedule reconciles expenditures and fund balances at the end of year.
Total
Expenditures Fund Balances
End of Year Statement of Revenues, Expenditures and Changes in
Fund Balances – Governmental Funds $ 27,603,444 $ 19,191,678 Activity budgeted as special revenue funds (427,654) (1,084,631)Schedule of Revenues, Expenditures and Changes in
Fund Balances – Budget and Actual – General Fund $ 27,175,790 $ 18,107,047
NOTE 2 – PENSION AND OPEB PLAN SCHEDULES Actuarial Assumptions for Valuations Performed. The information presented in the required supplementary schedules was determined as part of the actuarial valuations at the dates indicated, which is the most recent actuarial valuation. The actuarial assumptions used are disclosed in the notes to the financial statements. Factors that Affect Trends. The actuarial assumptions used in the June 30, 2017, valuation were based on the results of an actuarial experience study for the five-year period ended June 30, 2016. The purpose of the experience study was to review actual experience in relation to the actuarial assumptions in effect. The ASRS Board adopted the experience study recommended changes which were applied to the June 30, 2017, actuarial valuation.
Page 74
COMBINING AND INDIVIDUAL FUND FINANCIAL STATEMENTS
AND SCHEDULES
Page 75

(This page intentionally left blank)
Page 76

SPECIAL REVENUE FUNDS Classroom Site - to account for the financial activity for the portion of state sales tax collections and permanent state school fund earnings as approved by the voters in 2000. Instructional Improvement - to account for the activity of monies received from gaming revenue. E-Rate - to account for financial assistance received for broadband internet and telecommunication costs. College Credit Exam Incentives - to account for financial assistance received for college credit exams. Other State Projects - to account for financial assistance received for other State projects.
School Plant - to account for proceeds from the sale or lease of school property.
Civic Center - to account for monies received from the rental of school facilities for civic activities. Community School - to account for activity related to academic and skill development for all citizens.
Auxiliary Operations - to account for activity arising from bookstore, athletic and miscellaneous District related operations.
Extracurricular Activities Fees Tax Credit - to account for activity related to monies collected in support of extracurricular activities to be taken as a tax credit by the tax payer in accordance with A.R.S. §43-1089.01.
Gifts and Donations - to account for activity related to gifts, donations, bequests and private grants made to the District. Career, Technical and Vocational Education - to account for activity related to the production and subsequent sale of items produced in an instructional program by career and technical and vocational education pupils.
Insurance Proceeds - to account for the monies received from insurance claims.
Page 77

ASSETSCash and investmentsDue from governmental entities
Total assets
LIABILITIES AND FUND BALANCESLiabilities:
Accounts payableAccrued payroll and employee benefits
Total liabilities
Fund balances:Restricted
Total fund balances
Total liabilities and fund balances
Classroom Site
$ 1,537,906104,028
$ 1,641,934
$212,094212,094
1,429,8401,429,840
$ 1,641,934
Instructional Improvement
$ 238,50021,565
$ 260,065
$
260,065260,065
$ 260,065
E-Rate
$ 220,46527,769
$ 248,234
$ 44,764
44,764
203,470203,470
$ 248,234
WESTERN MARICOPA EDUCATION CENTER DISTRICT NO. 402COMBINING BALANCE SHEET - NON-MAJOR SPECIAL REVENUE FUNDS
JUNE 30, 2019
Page 78

College Credit Exam Incentives
$ 4,019
$ 4,019
$
4,0194,019
$ 4,019
Other State Projects
$ 229,331
$ 229,331
$ 1,220
1,220
228,111228,111
$ 229,331
Civic Center
$ 173,838
$ 173,838
$
173,838173,838
$ 173,838
Community School
$ 851,991
$ 851,991
$ 18,8255,737
24,562
827,429827,429
$ 851,991
Extracurricular Activities Fees
Tax Credit
$ 38,115
$ 38,115
$ 9,761
9,761
28,35428,354
$ 38,115
Gifts and Donations
$ 371,819
$ 371,819
$ 12,475
12,475
359,344359,344
$ 371,819
(Continued)
Page 79

ASSETSCash and investmentsDue from governmental entities
Total assets
LIABILITIES AND FUND BALANCESLiabilities:
Accounts payableAccrued payroll and employee benefits
Total liabilities
Fund balances:Restricted
Total fund balances
Total liabilities and fund balances
Career, Technical and Vocational
Education
$ 66,457
$ 66,457
$
66,45766,457
$ 66,457
Totals
$ 3,732,441153,362
$ 3,885,803
$ 87,045217,831304,876
3,580,9273,580,927
$ 3,885,803
WESTERN MARICOPA EDUCATION CENTER DISTRICT NO. 402COMBINING BALANCE SHEET - NON-MAJOR SPECIAL REVENUE FUNDS
JUNE 30, 2019
Page 80

(This page intentionally left blank)
Page 81

Revenues:Other localState aid and grantsFederal aid, grants and reimbursements
Total revenues
Expenditures:Current -
InstructionSupport services - students and staffSupport services - administrationStudent transportation services
Capital outlayTotal expenditures
Changes in fund balances
Fund balances, beginning of year
Fund balances, end of year
Classroom Site
$ 25,934624,169
650,103
322,6306,172
328,802
321,301
1,108,539
$ 1,429,840
Instructional Improvement
$ 77548,470
49,245
49,245
210,820
$ 260,065
E-Rate
$ 4,632
67,86172,493
44,76344,763
27,730
175,740
$ 203,470
WESTERN MARICOPA EDUCATION CENTER DISTRICT NO. 402COMBINING STATEMENT OF REVENUES, EXPENDITURES AND CHANGES IN FUND BALANCES -
NON-MAJOR SPECIAL REVENUE FUNDSYEAR ENDED JUNE 30, 2019
Page 82

College Credit Exam Incentives
$ 4,019
4,019
4,019
$ 4,019
Other State Projects
$272,968
272,968
58,772
58,772
214,196
13,915
$ 228,111
Civic Center
$ 74,122
74,122
5,26716,85316,840
38,960
35,162
138,676
$ 173,838
Community School
$ 1,097,979
1,097,979
502,558170,24994,820
25,963793,590
304,389
523,040
$ 827,429
Extracurricular Activities Fees
Tax Credit
$ 25,763
25,763
10,260
14,248
24,508
1,255
27,099
$ 28,354
Gifts and Donations
$ 240,759
240,759
114,15572
6,669300
5,000126,196
114,563
244,781
$ 359,344
(Continued)
Page 83

Revenues:Other localState aid and grantsFederal aid, grants and reimbursements
Total revenues
Expenditures:Current -
InstructionSupport services - students and staffSupport services - administrationStudent transportation services
Capital outlayTotal expenditures
Changes in fund balances
Fund balances, beginning of year
Fund balances, end of year
Career, Technical and Vocational
Education
$ 38,070
38,070
25,494
77
25,571
12,499
53,958
$ 66,457
Totals
$ 1,512,053945,60767,861
2,525,521
1,039,136193,346118,32914,62575,726
1,441,162
1,084,359
2,496,568
$ 3,580,927
WESTERN MARICOPA EDUCATION CENTER DISTRICT NO. 402COMBINING STATEMENT OF REVENUES, EXPENDITURES AND CHANGES IN FUND BALANCES -
NON-MAJOR SPECIAL REVENUE FUNDSYEAR ENDED JUNE 30, 2019
Page 84

(This page intentionally left blank)
Page 85

Total revenues
Revenues:Other localState aid and grantsFederal aid, grants and reimbursements
Expenditures:Current -
InstructionSupport services - students and staffSupport services - administrationOperation and maintenance of plant servicesStudent transportation services
Capital outlayTotal expenditures
Changes in fund balances
Fund balances, beginning of year
Fund balances (deficits), end of year
Classroom Site
Budget
$
12,105,1772,980,250
15,085,427
(15,085,427)
$ (15,085,427)
Actual
$ 25,934624,169
650,103
322,6306,172
328,802
321,301
1,108,539
$ 1,429,840
Variance - Positive
(Negative)
$ 25,934624,169
650,103
11,782,5472,974,078
14,756,625
15,406,728
1,108,539
$ 16,515,267
WESTERN MARICOPA EDUCATION CENTER DISTRICT NO. 402COMBINING SCHEDULE OF REVENUES, EXPENDITURES AND CHANGES IN FUND BALANCES -
BUDGET AND ACTUALALL SPECIAL REVENUE FUNDS
YEAR ENDED JUNE 30, 2019
Page 86

Instructional Improvement
Budget
$
190,786
190,786
(190,786)
$ (190,786)
Actual
$ 77548,470
49,245
49,245
210,820
$ 260,065
Variance - Positive
(Negative)
$ 77548,470
49,245
190,786
190,786
240,031
210,820
$ 450,851
E-Rate
Budget
$
230,835230,835
(230,835)
$ (230,835)
Actual
$ 4,632
67,86172,493
44,76344,763
27,730
175,740
$ 203,470
Variance - Positive
(Negative)
$ 4,632
67,86172,493
186,072186,072
258,565
175,740
$ 434,305
(Continued)
Page 87

Total revenues
Revenues:Other localState aid and grantsFederal aid, grants and reimbursements
Expenditures:Current -
InstructionSupport services - students and staffSupport services - administrationOperation and maintenance of plant servicesStudent transportation services
Capital outlayTotal expenditures
Changes in fund balances
Fund balances, beginning of year
Fund balances (deficits), end of year
College Credit Exam Incentives
Budget
$
$
Actual
$ 4,019
4,019
4,019
$ 4,019
Variance - Positive
(Negative)
$ 4,019
4,019
4,019
$ 4,019
WESTERN MARICOPA EDUCATION CENTER DISTRICT NO. 402COMBINING SCHEDULE OF REVENUES, EXPENDITURES AND CHANGES IN FUND BALANCES -
BUDGET AND ACTUALALL SPECIAL REVENUE FUNDS
YEAR ENDED JUNE 30, 2019
Page 88

Other State Projects
Budget
$
8,559
8,559
(8,559)
$ (8,559)
Actual
$272,968
272,968
58,772
58,772
214,196
13,915
$ 228,111
Variance - Positive
(Negative)
$272,968
272,968
(50,213)
(50,213)
222,755
13,915
$ 236,670
School Plant
Budget
$
2,012,589
2,012,589
(2,012,589)
$ (2,012,589)
Non-GAAP Actual
$ 202,128
202,128
202,128
506,769
$ 708,897
Variance - Positive
(Negative)
$ 202,128
202,128
2,012,589
2,012,589
2,214,717
506,769
$ 2,721,486
(Continued)
Page 89

Total revenues
Revenues:Other localState aid and grantsFederal aid, grants and reimbursements
Expenditures:Current -
InstructionSupport services - students and staffSupport services - administrationOperation and maintenance of plant servicesStudent transportation services
Capital outlayTotal expenditures
Changes in fund balances
Fund balances, beginning of year
Fund balances (deficits), end of year
Civic Center
Budget
$
37,559
37,559
(37,559)
$ (37,559)
Actual
$ 74,122
74,122
5,26716,85316,840
38,960
35,162
138,676
$ 173,838
Variance - Positive
(Negative)
$ 74,122
74,122
(5,267)20,706
(16,840)
(1,401)
72,721
138,676
$ 211,397
WESTERN MARICOPA EDUCATION CENTER DISTRICT NO. 402COMBINING SCHEDULE OF REVENUES, EXPENDITURES AND CHANGES IN FUND BALANCES -
BUDGET AND ACTUALALL SPECIAL REVENUE FUNDS
YEAR ENDED JUNE 30, 2019
Page 90

Community School
Budget
$
752,113
752,113
(752,113)
$ (752,113)
Actual
$ 1,097,979
1,097,979
502,558170,24994,820
25,963793,590
304,389
523,040
$ 827,429
Variance - Positive
(Negative)
$ 1,097,979
1,097,979
249,555(170,249)(94,820)
(25,963)(41,477)
1,056,502
523,040
$ 1,579,542
Auxiliary Operations
Budget
$
468,345
468,345
(468,345)
$ (468,345)
Non-GAAP Actual
$ 620,977
620,977
339,3281,6591,816
84,851
427,654
193,323
157,311
$ 350,634
Variance - Positive
(Negative)
$ 620,977
620,977
129,017(1,659)(1,816)
(84,851)
40,691
661,668
157,311
$ 818,979
(Continued)
Page 91

Total revenues
Revenues:Other localState aid and grantsFederal aid, grants and reimbursements
Expenditures:Current -
InstructionSupport services - students and staffSupport services - administrationOperation and maintenance of plant servicesStudent transportation services
Capital outlayTotal expenditures
Changes in fund balances
Fund balances, beginning of year
Fund balances (deficits), end of year
Extracurricular Activities Fees Tax Credit
Budget
$
28,750
28,750
(28,750)
$ (28,750)
Actual
$ 25,763
25,763
10,260
14,248
24,508
1,255
27,099
$ 28,354
Variance - Positive
(Negative)
$ 25,763
25,763
(10,260)
14,502
4,242
30,005
27,099
$ 57,104
WESTERN MARICOPA EDUCATION CENTER DISTRICT NO. 402COMBINING SCHEDULE OF REVENUES, EXPENDITURES AND CHANGES IN FUND BALANCES -
BUDGET AND ACTUALALL SPECIAL REVENUE FUNDS
YEAR ENDED JUNE 30, 2019
Page 92

Gifts and Donations
Budget
$
186,335
186,335
(186,335)
$ (186,335)
Actual
$ 240,759
240,759
114,15572
6,669
3005,000
126,196
114,563
244,781
$ 359,344
Variance - Positive
(Negative)
$ 240,759
240,759
72,180(72)
(6,669)
(300)(5,000)60,139
300,898
244,781
$ 545,679
Career, Technical and Vocational Education
Budget
$
35,565
35,565
(35,565)
$ (35,565)
Actual
$ 38,070
38,070
25,494
77
25,571
12,499
53,958
$ 66,457
Variance - Positive
(Negative)
$ 38,070
38,070
10,071
(77)
9,994
48,064
53,958
$ 102,022
(Continued)
Page 93

Total revenues
Revenues:Other localState aid and grantsFederal aid, grants and reimbursements
Expenditures:Current -
InstructionSupport services - students and staffSupport services - administrationOperation and maintenance of plant servicesStudent transportation services
Capital outlayTotal expenditures
Changes in fund balances
Fund balances, beginning of year
Fund balances (deficits), end of year
Insurance Proceeds
Budget
$
$
Non-GAAP Actual
$
25,100
$ 25,100
Variance - Positive
(Negative)
$
25,100
$ 25,100
WESTERN MARICOPA EDUCATION CENTER DISTRICT NO. 402COMBINING SCHEDULE OF REVENUES, EXPENDITURES AND CHANGES IN FUND BALANCES -
BUDGET AND ACTUALALL SPECIAL REVENUE FUNDS
YEAR ENDED JUNE 30, 2019
Page 94

Totals
Budget
$
13,746,8803,017,809
2,012,58928,750
230,83519,036,863
(19,036,863)
$ (19,036,863)
Non-GAAP Actual
$ 2,335,158945,60767,861
3,348,626
1,378,464195,005120,145
99,47675,726
1,868,816
1,479,810
3,185,748
$ 4,665,558
Variance - Positive
(Negative)
$ 2,335,158945,60767,861
3,348,626
12,368,4162,822,804(120,145)2,012,589
(70,726)155,109
17,168,047
20,516,673
3,185,748
$ 23,702,421
Page 95

(This page intentionally left blank)
Page 96

DEBT SERVICE FUND Debt Service - to account for the accumulation of resources for, and the payment of, long-term debt principal, interest and related costs.
Page 97

Total revenues
Revenues:Other localProperty taxes
Expenditures:Debt service -
Principal retirementInterest and fiscal charges
Total expenditures
Excess (deficiency) of revenues over expenditures
Other financing sources (uses):Transfers in
Total other financing sources (uses)
Changes in fund balances
Fund balances, beginning of year
Fund balances (deficits), end of year
Debt Service
Budget
$
10,090,0005,360,956
15,450,956
(15,450,956)
(15,450,956)
$ (15,450,956)
Actual
$ 298,17215,022,04815,320,220
10,090,0005,367,723
15,457,723
(137,503)
589,862589,862
452,359
680,584
$ 1,132,943
Variance - Positive
(Negative)
$ 298,17215,022,04815,320,220
(6,767)(6,767)
15,313,453
589,862589,862
15,903,315
680,584
$ 16,583,899
WESTERN MARICOPA EDUCATION CENTER DISTRICT NO. 402 SCHEDULE OF REVENUES, EXPENDITURES AND CHANGES IN FUND BALANCES -
BUDGET AND ACTUALALL DEBT SERVICE FUND
YEAR ENDED JUNE 30, 2019
Page 98

CAPITAL PROJECTS FUNDS Unrestricted Capital Outlay - to account for transactions relating to the acquisition of capital items. Bond Building - to account for proceeds from District bond issues that are expended on the acquisition or lease of sites; construction or renovation of school buildings; supplying school buildings with furniture, equipment, and technology; improving school grounds; or purchasing pupil transportation vehicles.
Page 99

Total revenues
Revenues:Other localState aid and grants
Expenditures:Capital outlay
Total expenditures
Excess (deficiency) of revenues over expenditures
Other financing sources (uses):Transfers out
Total other financing sources (uses)
Changes in fund balances
Fund balances, beginning of year
Fund balances (deficits), end of year
Unrestricted Capital Outlay
Budget
$
33,335,16133,335,161
(33,335,161)
(33,335,161)
$ (33,335,161)
Actual
$ 400,71311,453,27911,853,992
5,525,7725,525,772
6,328,220
6,328,220
21,491,629
$ 27,819,849
Variance - Positive
(Negative)
$ 400,71311,453,27911,853,992
27,809,38927,809,389
39,663,381
39,663,381
21,491,629
$ 61,155,010
WESTERN MARICOPA EDUCATION CENTER DISTRICT NO. 402COMBINING SCHEDULE OF REVENUES, EXPENDITURES AND CHANGES IN FUND BALANCES -
BUDGET AND ACTUALALL CAPITAL PROJECTS FUNDS
YEAR ENDED JUNE 30, 2019
Page 100

Bond Building
Budget
$
42,934,75442,934,754
(42,934,754)
(42,934,754)
$ (42,934,754)
Actual
$ 589,862
589,862
44,329,64144,329,641
(43,739,779)
(589,862)(589,862)
(44,329,641)
50,086,288
$ 5,756,647
Variance - Positive
(Negative)
$ 589,862
589,862
(1,394,887)(1,394,887)
(805,025)
(589,862)(589,862)
(1,394,887)
50,086,288
$ 48,691,401
Totals
Budget
$
76,269,91576,269,915
(76,269,915)
(76,269,915)
$ (76,269,915)
Non-GAAP Actual
$ 990,57511,453,27912,443,854
49,855,41349,855,413
(37,411,559)
(589,862)(589,862)
(38,001,421)
71,577,917
$ 33,576,496
Variance - Positive
(Negative)
$ 990,57511,453,27912,443,854
26,414,50226,414,502
38,858,356
(589,862)(589,862)
38,268,494
71,577,917
$ 109,846,411
Page 101

(This page intentionally left blank)
Page 102

AGENCY FUND Student Activities - to account for monies raised by students to finance student clubs and organizations but held by the District as an agent. Employee Withholding - to account for voluntary deductions temporarily held by the District as an agent.
Page 103

ASSETSCash and investments
Total assets
LIABILITIESAccounts payableDeposits held for othersDue to student groups
Total liabilities
Student Activities
$ 47,142$ 47,142
$ 11,466
35,676$ 47,142
Employee Insurance
$ 52,617$ 52,617
$52,617
$ 52,617
Totals
$ 99,759$ 99,759
$ 11,46652,61735,676
$ 99,759
WESTERN MARICOPA EDUCATION CENTER DISTRICT NO. 402COMBINING STATEMENT OF ASSETS AND LIABILITIES
AGENCY FUNDSJUNE 30, 2019
Page 104

WESTERN MARICOPA EDUCATION CENTER DISTRICT NO. 402COMBINING STATEMENT OF CHANGES IN ASSETS AND LIABILITIES
AGENCY FUNDSYEAR ENDED JUNE 30, 2019
Beginning EndingBalance Additions Deductions Balance
STUDENT ACTIVITIES FUND
AssetsCash and investments $ 19,590 $ 148,740 $ 121,188 $ 47,142
Total assets $ 19,590 $ 148,740 $ 121,188 $ 47,142
Liabilities
Accounts payable $ $ 11,466 $ $ 11,466Due to student groups 19,590 137,274 121,188 35,676
Total liabilities $ 19,590 $ 148,740 $ 121,188 $ 47,142
AssetsCash and investments $ 56,068 $ 237,445 $ 240,896 $ 52,617
Total assets $ 56,068 $ 237,445 $ 240,896 $ 52,617
LiabilitiesDeposits held for others $ 56,068 $ 237,445 $ 240,896 $ 52,617
Total liabilities $ 56,068 $ 237,445 $ 240,896 $ 52,617
TOTAL AGENCY FUNDS
AssetsCash and investments $ 75,658 $ 386,185 $ 362,084 $ 99,759
Total assets $ 75,658 $ 386,185 $ 362,084 $ 99,759
LiabilitiesAccounts payable $ $ 11,466 $ $ 11,466Deposits held for others 56,068 237,445 240,896 52,617Due to student groups 19,590 137,274 121,188 35,676
Total liabilities $ 75,658 $ 386,185 $ 362,084 $ 99,759
EMPLOYEE WITHHOLDING FUND
Page 105

(This page intentionally left blank)
Page 106
STATISTICAL SECTION
The statistical section presents financial statement trends as well as detailed financial and operational information not available elsewhere in the report. The statistical section is intended to enhance the reader’s understanding of the information presented in the financial statements, notes to the financial statements, and other supplementary information presented in this report. The statistical section is comprised of the five categories of statistical information presented below.
Financial Trends
These schedules contain information on financial trends to help the reader understand how the District’s financial position and financial activities have changed over time.
Revenue Capacity
These schedules contain information to help the reader assess the factors affecting the District’s ability to generate revenue.
Debt Capacity
These schedules present information to help the reader evaluate the District’s current levels of outstanding debt as well as assess the District’s ability to make debt payments and/or issue additional debt in the future.
Demographic and Economic Information These schedules present various demographic and economic indicators to help the reader understand the environment in which the District’s financial activities take place and to help make comparisons with other school districts.
Operating Information
These schedules contain information about the District’s operations and various resources to help the reader draw conclusions as to how the District’s financial information relates to the services provided by the District.
Due to cost considerations for the accumulation of data, the District has elected to present less than ten years of data, or data from less than nine years prior, for certain statistical schedules. This information will be accumulated and reported each year until the complete ten years of data is presented. Note: For locally assessed property (i.e., excluding mines, utilities, etc.) Proposition 117, approved by voters in 2012, amended the Arizona Constitution to require that all property taxes after fiscal year 2014-15 be based upon property values limited to five percent in annual growth. The aggregate assessed value of all taxable properties within a taxing jurisdiction (i.e., after applying assessment ratios based on the use of a property), including property values with a growth limit, is currently referred to as net limited assessed value and formerly as primary assessed value. In accordance with Proposition 117, this value is used for all taxing purposes beginning fiscal year 2015-16. Aggregate assessed value without a growth limit is currently referred to as net full cash assessed value and formerly as secondary assessed value. This remains the value utilized for determining debt capacity limits.
Page 107

2019 2018 2017 2016 2015Net Position:
Net investment in capital assets 42,397,958$ 37,803,401$ 36,382,033$ 30,496,841$ 28,641,485$ Restricted 32,652,335 24,793,511 22,653,975 24,190,160 29,780,068 Unrestricted 20,145,371 22,433,457 9,940,733 10,752,024 5,042,780
Total net position 95,195,664$ 85,030,369$ 68,976,741$ 65,439,025$ 63,464,333$
2014 2013 2012 2011 2010Net Position:
Net investment in capital assets 25,792,064$ 22,763,947$ 22,995,060$ 20,150,300$ 11,031,189$ Restricted 17,839,535 18,049,856 15,508,661 281,165 12,041,808 Unrestricted 18,268,975 16,416,827 14,791,796 26,591,568 17,264,763
Total net position 61,900,574$ 57,230,630$ 53,295,517$ 47,023,033$ 40,337,760$
The source of this information is the District's financial records.Source:
WESTERN MARICOPA EDUCATION CENTER DISTRICT NO. 402NET POSITION BY COMPONENT
LAST TEN FISCAL YEARS
Fiscal Year Ended June 30
(Accrual basis of accounting)
Page 108

2019 2018 2017 2016 2015
Instruction 28,381,606$ 20,559,036$ 20,352,708$ 19,272,358$ 17,237,909$ Support services - students and staff 5,310,247 4,224,989 3,722,992 2,727,203 2,552,598 Support services - administration 8,192,043 5,919,305 5,540,120 4,027,507 3,058,392 Operation and maintenance of plant services 2,524,230 2,045,377 1,723,476 1,429,262 1,295,613 Student transportation services 99,476 43,960 19,064 Operation of non-instructional services 4,781 3,038 80,825 Interest on long-term debt 4,164,294 5,121,721 2,406,922 2,362,337 1,907,578
Total expenses 48,676,677 37,917,426 33,846,107 29,818,667 26,052,090
Program RevenuesCharges for services:
Instruction 1,575,165 1,500,031 618,348 1,370,557 930,445 Other activities 270,821 260,266 829,668 316,392 115,755
Operating grants and contributions 569,476 217,179 310,480 327,669 291,325 Capital grants and contributions 67,861
Total program revenues 2,483,323 1,977,476 1,758,496 2,014,618 1,337,525
Net (Expense)/Revenue (46,193,354)$ (35,939,950)$ (32,087,611)$ (27,804,049)$ (24,714,565)$
The source of this information is the District's financial records.The provisions of the Governmental Accounting Standards Board (GASB) Statement No. 34 were adopted in fiscal year 2001 therefore
only six years are shown.
(Continued)
WESTERN MARICOPA EDUCATION CENTER DISTRICT NO. 402EXPENSES, PROGRAM REVENUES, AND NET (EXPENSE)/REVENUE
Source: Note:
LAST TEN FISCAL YEARS(Accrual basis of accounting)
Fiscal Year Ended June 30
Expenses
Page 109

2014 2013 2012 2011 2010Expenses
Instruction 14,622,386$ 12,691,847$ 12,804,981$ 17,528,425$ 15,524,170$ Support services - students and staff 2,202,106 1,635,037 1,099,995 2,475,245 1,211,052 Support services - administration 2,381,186 2,286,182 1,966,283 2,502,796 1,155,539 Operation and maintenance of plant services 808,740 727,675 323,495 906,735 443,793 Interest on long-term debt 1,402,423 145,839 250,000
Total expenses 21,416,841 17,486,580 16,444,754 23,413,201 18,334,554
Program RevenuesCharges for services:
Instruction 837,424 909,111 919,898 552,578 366,331 Other activities 5,400 250
Operating grants and contributions 196,544 71,499 1,365,994 53,857 2,384 Capital grants and contributions 60,000
Total program revenues 1,039,368 980,610 2,285,892 606,685 428,715
Net (Expense)/Revenue (20,377,473)$ (16,505,970)$ (14,158,862)$ (22,806,516)$ (17,905,839)$
(Concluded)
Source: The source of this information is the District's financial records.
WESTERN MARICOPA EDUCATION CENTER DISTRICT NO. 402EXPENSES, PROGRAM REVENUES, AND NET (EXPENSE)/REVENUE
LAST TEN FISCAL YEARS(Accrual basis of accounting)
Fiscal Year Ended June 30
Page 110

2019 2018 2017 2016 2015
Net (Expense)/Revenue (46,193,354)$ (35,939,950)$ (32,087,611)$ (27,804,049)$ (24,714,565)$
General Revenues: Taxes:
Property taxes, levied for general purposes 7,515,160 2,770,016 6,728,391 6,492,281 6,502,890 Property taxes, levied for debt service 15,015,934 18,060,147 4,579,540 2,559,612 4,056,403 Property taxes, levied for capital outlay 4,282,613
Investment income 1,936,977 1,202,191 366,734 286,706 248,957 Unrestricted county aid 2,979,765 2,624,181 2,434,275 2,036,013 1,884,200 Unrestricted state aid 28,910,813 23,044,177 22,169,857 18,404,129 17,925,620
Total general revenues 56,358,649 51,983,325 36,278,797 29,778,741 30,618,070
Changes in Net Position 10,165,295$ 16,043,375$ 4,191,186$ 1,974,692$ 5,903,505$
Source: The source of this information is the District's financial records.
Note: The provisions of the Governmental Accounting Standards Board (GASB) Statement No. 34 were adopted in fiscal year 2001 therefore only six years are shown.
(Continued)
Fiscal Year Ended June 30
WESTERN MARICOPA EDUCATION CENTER DISTRICT NO. 402GENERAL REVENUES AND TOTAL CHANGES IN NET POSITION
LAST TEN FISCAL YEARS(Accrual basis of accounting)
Page 111

2014 2013 2012 2011 2010
Net (Expense)/Revenue (20,377,473)$ (16,505,970)$ (14,158,862)$ (22,806,516)$ (17,905,839)$
General Revenues: Taxes:
Property taxes, levied for general purposes 5,999,883 6,124,902 6,686,258 8,703,638 10,364,731 Property taxes, levied for debt service 1,120,673
Investment income 232,620 161,848 162,782 311,403 307,859 Unrestricted county aid 1,781,106 1,512,376 1,561,593 2,258,711 1,736,297 Unrestricted state aid 15,913,135 12,641,957 12,020,713 17,918,989 14,196,508 Unrestricted federal aid 299,048 2,626,274
Total general revenues 25,047,417 20,441,083 20,431,346 29,491,789 29,231,669
Changes in Net Position 4,669,944$ 3,935,113$ 6,272,484$ 6,685,273$ 11,325,830$
(Concluded)
(Accrual basis of accounting)
The source of this information is the District's financial records.
Fiscal Year Ended June 30
Source:
GENERAL REVENUES AND TOTAL CHANGES IN NET POSITIONLAST TEN FISCAL YEARS
WESTERN MARICOPA EDUCATION CENTER DISTRICT NO. 402
Page 112

2019 2018 2017 2016 2015General Fund:
Unassigned 19,191,678$ 18,248,708$ 14,110,709$ 14,364,948$ 7,930,939$ Total General Fund 19,191,678$ 18,248,708$ 14,110,709$ 14,364,948$ 7,930,939$
All Other Governmental Funds:Restricted 38,290,366 74,755,069 99,962,780 32,923,791 40,785,168
Total all other governmental funds 38,290,366$ 74,755,069$ 99,962,780$ 32,923,791$ 40,785,168$
(Continued)
WESTERN MARICOPA EDUCATION CENTER DISTRICT NO. 402FUND BALANCES - GOVERNMENTAL FUNDS
Fiscal Year Ended June 30
LAST TEN FISCAL YEARS(Modified accrual basis of accounting)
Page 113

2014 2013 2012 2011 2010General Fund:
Nonspendable $ $ $ 112,197$ $ Unassigned 17,672,056 16,581,444 14,815,714 30,374,435 Unreserved 16,651,402
Total General Fund 17,672,056$ 16,581,444$ 14,815,714$ 30,486,632$ 16,651,402$
All Other Governmental Funds:Restricted 17,901,139$ 46,706,931$ 15,496,358$ 181,737$ $ Unassigned (4,216,792) Unreserved, reported in:
Special revenue funds 404,162 Capital projects funds 12,041,808
Total all other governmental funds 17,901,139$ 46,706,931$ 15,496,358$ (4,035,055)$ 12,445,970$
Source:Note:
(Concluded)
The provisions of the Governmental Accounting Standards Board (GASB) Statement No. 54 were adopted in fiscal year 2011. The standard replaces the previous reserved and unreserved fund balance categories with the following five fund balance classifications: nonspendable, restricted, committed, assigned, and unassigned fund balance.
The source of this information is the District's financial records.
WESTERN MARICOPA EDUCATION CENTER DISTRICT NO. 402FUND BALANCES - GOVERNMENTAL FUNDS
LAST TEN FISCAL YEARS(Modified accrual basis of accounting)
Page 114

2019 2018 2017 2016 2015Federal sources:
Federal grants 67,861$ 100,132$ 84,326$ 74,743$ 64,671$ Total federal sources 67,861 100,132 84,326 74,743 64,671
State sources:State equalization assistance 28,183,811 22,458,091 21,707,822 19,508,137 16,498,215 State grants 272,968 2,790 29,115 481 104,572 Other revenues 727,002 586,086 462,035 359,731 242,698 Total state sources 29,183,781 23,046,967 22,198,972 19,868,349 16,845,485
Local sources:Property taxes 22,525,131 25,016,123 11,323,260 9,083,676 10,541,099 County aid 2,979,765 2,624,181 2,434,275 2,036,013 1,884,200 Investment income 1,960,065 1,183,401 362,426 286,552 248,667 Other revenues 2,119,406 1,887,160 1,648,522 1,669,556 1,173,471 Total local sources 29,584,367 30,710,865 15,768,483 13,075,797 13,847,437 Total revenues 58,836,009$ 53,857,964$ 38,051,781$ 33,018,889$ 30,757,593$
(Continued)
WESTERN MARICOPA EDUCATION CENTER DISTRICT NO. 402GOVERNMENTAL FUNDS REVENUES
LAST TEN FISCAL YEARS
Fiscal Year Ended June 30
(Modified accrual basis of accounting)
Page 115

2014 2013 2012 2011 2010Federal sources:
Federal grants 22,297$ 24,736$ 11,221$ $ $ State Fiscal Stabilization (ARRA) 299,048 2,626,274 Education Jobs 1,201,103 Total federal sources 22,297 24,736 1,212,324 299,048 2,626,274
State sources:State equalization assistance 15,675,286 12,452,728 12,101,391 17,585,953 16,797,267 State grants 110,335 40,801 Other revenues 237,849 189,229 167,814 110,664 47,531 Total state sources 15,913,135 12,641,957 12,379,540 17,737,418 16,844,798
Local sources:Property taxes 7,143,120 6,184,760 6,853,602 8,709,294 10,345,348 County aid 1,781,106 1,512,376 1,561,593 2,258,711 1,736,297 Investment income 232,620 161,499 162,574 311,107 307,859 Other revenues 1,000,686 953,805 950,930 565,884 368,715 Total local sources 10,157,532 8,812,440 9,528,699 11,844,996 12,758,219 Total revenues 26,092,964$ 21,479,133$ 23,120,563$ 29,881,462$ 32,229,291$
(Concluded)
Source: The source of this information is the District's financial records.
WESTERN MARICOPA EDUCATION CENTER DISTRICT NO. 402GOVERNMENTAL FUNDS REVENUES
LAST TEN FISCAL YEARS(Modified accrual basis of accounting)
Page 116

2019 2018 2017 2016 2015
Expenditures:Current -
Instruction 17,638,080$ 16,335,919$ 16,202,003$ 15,864,936$ 14,601,176$ Support services - students and staff 4,517,121 3,723,915 3,240,145 2,488,848 2,311,993 Support services - administration 4,574,363 3,988,460 4,476,042 3,314,942 2,521,794 Operation and maintenance of plant services 2,139,840 1,825,030 1,499,152 1,309,909 1,243,331 Student transportation services 99,476 43,960 19,064 Operation of non-instructional services 3,038 30,894
Capital outlay 49,931,139 30,627,204 20,321,105 22,233,803 19,897,094 Debt service -
Interest and fiscal charges 5,367,723 6,325,150 2,556,806 2,512,221 2,039,935 Principal retirement 10,090,000 12,055,000 2,600,000 1,775,000 950,000 Bond issuance costs 622,628 197,140 282,250
Total expenditures 94,357,742$ 74,927,676$ 51,567,839$ 49,696,799$ 43,847,573$
Expenditures for capitalized assets 38,739,441$ 27,041,182$ 18,015,864$ 20,061,186$ 18,608,065$
Debt service as a percentage ofnoncapital expenditures 28% 38% 15% 14% 12%
Source: The source of this information is the District's financial records.Notes:
(Continued)
WESTERN MARICOPA EDUCATION CENTER DISTRICT NO. 402GOVERNMENTAL FUNDS EXPENDITURES AND DEBT SERVICE RATIO
Fiscal Year Ended June 30
LAST TEN FISCAL YEARS(Modified accrual basis of accounting)
Page 117

2014 2013 2012 2011 2010
Expenditures:Current -
Instruction 13,198,361$ 12,358,079$ 12,282,154$ 16,991,148$ 15,352,762$ Support services - students and staff 2,066,647 1,552,096 1,041,760 1,938,577 1,178,390 Support services - administration 1,769,688 2,107,391 1,706,899 1,494,867 1,224,358 Operation and maintenance of plant services 791,857 712,964 315,526 905,654 208,981 Student transportation services Operation of non-instructional services
Capital outlay 33,553,456 3,192,091 2,876,532 16,762,113 5,969,438 Debt service -
Interest and fiscal charges 1,473,135 145,839 250,000 Principal retirement 955,000 4,777,905 675,000 Bond issuance costs 323,500
Total expenditures 53,808,144$ 25,169,865$ 19,147,871$ 38,092,359$ 23,933,929$
Expenditures for capitalized assets 32,272,280$ 3,492,841$ 3,057,508$ 14,926,621$ 5,939,540$
Debt service as a percentage ofnoncapital expenditures 11% 23% 6% 0% 0%
Source:
(Concluded)
WESTERN MARICOPA EDUCATION CENTER DISTRICT NO. 402GOVERNMENTAL FUNDS EXPENDITURES AND DEBT SERVICE RATIO
The source of this information is the District's financial records.
Fiscal Year Ended June 30
LAST TEN FISCAL YEARS(Modified accrual basis of accounting)
Page 118
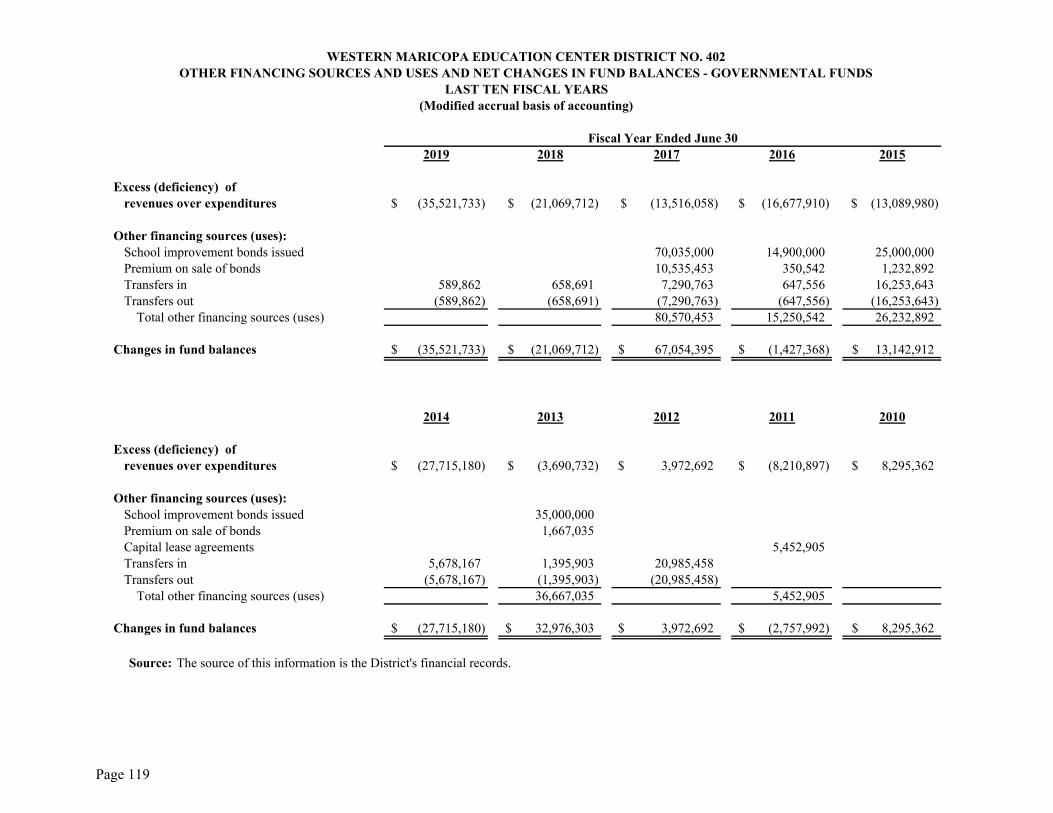
2019 2018 2017 2016 2015
Excess (deficiency) of revenues over expenditures (35,521,733)$ (21,069,712)$ (13,516,058)$ (16,677,910)$ (13,089,980)$
Other financing sources (uses):School improvement bonds issued 70,035,000 14,900,000 25,000,000 Premium on sale of bonds 10,535,453 350,542 1,232,892 Transfers in 589,862 658,691 7,290,763 647,556 16,253,643 Transfers out (589,862) (658,691) (7,290,763) (647,556) (16,253,643)
Total other financing sources (uses) 80,570,453 15,250,542 26,232,892
Changes in fund balances (35,521,733)$ (21,069,712)$ 67,054,395$ (1,427,368)$ 13,142,912$
2014 2013 2012 2011 2010
Excess (deficiency) of revenues over expenditures (27,715,180)$ (3,690,732)$ 3,972,692$ (8,210,897)$ 8,295,362$
Other financing sources (uses):School improvement bonds issued 35,000,000 Premium on sale of bonds 1,667,035 Capital lease agreements 5,452,905 Transfers in 5,678,167 1,395,903 20,985,458 Transfers out (5,678,167) (1,395,903) (20,985,458)
Total other financing sources (uses) 36,667,035 5,452,905
Changes in fund balances (27,715,180)$ 32,976,303$ 3,972,692$ (2,757,992)$ 8,295,362$
Source: The source of this information is the District's financial records.
WESTERN MARICOPA EDUCATION CENTER DISTRICT NO. 402OTHER FINANCING SOURCES AND USES AND NET CHANGES IN FUND BALANCES - GOVERNMENTAL FUNDS
LAST TEN FISCAL YEARS
Fiscal Year Ended June 30
(Modified accrual basis of accounting)
Page 119

Class 2019 2018 2017 2016 2015
Commercial, Industrial, Utilities and Mining $ 5,300,279,109 $ 5,132,211,689 $ 4,927,565,948 $ 4,874,184,349 $ $
Agricultural and Vacant 479,636,940 471,596,986 462,608,449 504,996,285
Residential (Owner Occupied) 6,444,238,034 5,983,886,022 5,584,502,253 5,273,415,434
Residential (Rental) 2,520,823,595 2,383,242,954 2,261,987,125 2,100,938,471
Railroad, Private Cars and Airlines 16,719,484 17,369,811 16,304,920 17,497,470
Historical Property 16,409,630 16,865,677 18,200,234 18,993,799
Certain Government Property Improvements 974,858 661,182 621,842 457,940
Total $ 14,779,081,650 $ 14,005,834,321 $ 13,271,790,771 $ 12,790,483,748 $ $
Gross Full Cash Value $ 185,742,509,338 $ 171,817,379,619 $ 158,920,689,132 $ 145,378,421,744 $ $
Ratio of Net Limited Assessed Value to Gross Full Cash Value 8% 8% 8% 9% #DIV/0!Total Direct Rate 0.15 0.18 0.08 0.07 -
Source: Notes:
2) Fiscal year 2016 is the District's first year of having a net limited assessed value.
WESTERN MARICOPA EDUCATION CENTER DISTRICT NO. 402NET LIMITED ASSESSED VALUE AND FULL CASH VALUE OF TAXABLE PROPERTY BY CLASS
LAST FOUR FISCAL YEARS
The source of this information is the State and County Abstract of the Assessment Roll, Arizona Department of Revenue.
Fiscal Year
1) On November 6, 2012, voters approved Proposition 117, an amendment to the Arizona Constitution. Beginning with Tax Year 2015 (Fiscal Year 2016), both primary and secondary taxes are levied against the net limited assessed value. Primary taxes are used for general District operations. Secondary taxes are used to service District bonded debt requirements and other voter-approved overrides.
Page 120

Class 2019 2018 2017 2016 2015
1 Commercial, Industrial, Utilities and Mining $ 6,382,292,818 $ 6,117,760,083 $ 5,617,637,297 $ 5,154,420,263 $ 5,025,236,725
2 Agricultural and Vacant 827,808,162 813,448,173 718,632,137 659,271,876 554,488,816
3 Residential (Owner Occupied) 8,483,137,081 7,656,293,107 7,166,687,452 6,718,998,804 5,345,752,510
4 Residential (Rental) 3,552,765,401 3,228,223,369 2,957,243,945 2,677,757,120 2,034,891,852
5 Railroad, Private Cars and Airlines 19,973,186 20,144,883 17,416,181 17,823,342 18,777,772
06, 07, 08 Historical Property 21,675,195 20,957,518 25,452,183 26,359,763 21,797,196
9 Certain Government Property Improvements 2,534,738 896,940 797,628 490,147 523,796
Total $ 19,290,186,581 $ 17,857,724,073 $ 16,503,866,823 $ 15,255,121,315 $ 13,001,468,667
Gross Full Cash Value $ 185,742,509,338 $ 171,817,379,619 $ 158,920,689,132 $ 121,491,950,287 $ 105,864,769,303
Ratio of Net Full Cash Assessed Value to Gross Full Cash Value 10% 10% 10% 13% 12%Estimated Net Full Cash Value $ 156,594,037,923 $ 143,776,768,363 $ 133,122,999,233 $ 121,208,517,916 $ 100,085,389,832 Total Direct Rate 0.15 0.18 0.08 0.07 0.08
Class 2014 2013 2012 2011 2010
1 Commercial, Industrial, Utilities and Mining $ 4,761,717,513 $ 5,166,347,557 $ 5,633,215,650 $ 7,421,158,170 $ 7,167,760,501
2 Agricultural and Vacant 547,771,936 611,314,002 849,984,216 1,459,250,837 2,049,337,394
3 Residential (Owner Occupied) 4,679,819,963 5,350,465,704 5,955,984,407 7,327,212,472 9,659,423,725
4 Residential (Rental) 1,547,345,705 1,128,230,651 1,187,480,809 1,476,243,217 1,648,528,115
5 Railroad, Private Cars and Airlines 15,639,837 15,459,545 14,867,222 15,076,358 15,970,160
06, 07, 08 Historical Property 16,962,517 12,176,160 11,465,242 19,854,637 5,496,655
9 Certain Government Property Improvements 383,893 332,038 329,680 - -
Total $ 11,569,641,364 $ 12,284,325,657 $ 13,653,327,226 $ 17,718,795,691 $ 20,546,516,550
Gross Full Cash Value $ 110,253,721,620 $ 122,863,333,856 $ 154,432,353,296 $ 179,834,250,360 $ 180,953,657,568
Ratio of Net Full Cash Assessed Value to Gross Full Cash Value 10% 10% 9% 10% 11%
Estimated Net Full Cash Value $ 87,093,577,766 $ 91,500,813,831 $ 101,535,347,107 $ 154,432,353,295 $ 153,994,127,978
Total Direct Rate 0.06 0.05 0.05 0.05 0.05
Source: The source of this information is the State and County Abstract of the Assessment Roll, Arizona Department of Revenue.Note: On November 6, 2012, voters approved Proposition 117, an amendment to the Arizona Constitution. Beginning with Tax Year 2015 (Fiscal Year
2016), both primary and secondary taxes are levied against the net limited assessed value. The net full cash assessed value is used for determining the District's boding capacity and as the ceiling for net limited assessed value.
WESTERN MARICOPA EDUCATION CENTER DISTRICT NO. 402NET FULL CASH ASSESSED VALUE OF TAXABLE PROPERTY BY CLASS
LAST TEN FISCAL YEARS
Fiscal Year
Fiscal Year
Page 121

Class 2019 2018 2017 2016 2015
Commercial, Industrial, Utilities and Mining 18 % 18 % 18 % 19 % 19 %
Agricultural and Vacant 15 15 15 16 16
Residential (Owner Occupied) 10 10 10 10 10
Residential (Rental) 10 10 10 10 10
Railroad, Private Cars and Airlines 14 15 14 15 16
Class 2014 2013 2012 2011 2010
Commercial, Industrial, Utilities and Mining 20 % 20 % 20 % 21 % 22 %
Agricultural and Vacant 16 16 16 16 16
Residential (Owner Occupied) 10 10 10 10 10
Residential (Rental) 10 10 10 10 10
Railroad, Private Cars and Airlines 15 15 15 17 18
Source: The source of this information is the State and County Abstract of the Assessment Roll, Arizona Department of Revenue.
Note:
WESTERN MARICOPA EDUCATION CENTER DISTRICT NO. 402PROPERTY TAX ASSESSMENT RATIOS
LAST TEN FISCAL YEARS
Additional classes of property exist, but do not amount to a significant portion of the District's total valuation, therefore they are not included on this schedule.
Fiscal Year
Fiscal Year
Page 122

Net LimitedAssessed Valuation
Fiscal Year Ended June 30 2019 2019 2018 2017 2016 2015 2014 2013 2012 2011 2010
State of Arizona 62,328,357,186$ 0.47 0.49 0.50 0.51 0.51 0.51 0.47 0.43 0.36 0.33Maricopa County 40,423,232,421$ 1.40 1.40 1.40 1.36 1.32 1.28 1.24 1.24 1.05 0.99Maricopa County CCD 40,423,232,421$ 1.38 1.41 1.47 1.49 1.52 1.53 1.38 1.21 0.97 0.88Maricopa County Library District 40,423,232,421$ 0.06 0.06 0.06 0.06 0.06 0.04 0.05 0.05 0.04 0.04Maricopa County Fire District 40,423,232,421$ 0.01 0.01 0.01 0.01 0.01 0.01 0.01 0.01 0.01 0.01Maricopa County Flood Control District 40,423,232,421$ 0.18 0.18 0.18 0.16 0.14 0.14 0.18 0.18 0.15 0.14Central AZ Water Conservation District 40,423,232,421$ 0.14 0.14 0.14 0.14 0.14 0.14 0.10 0.10 0.10 0.10City of Avondale 398,288,948$ 1.76 1.60 1.70 1.75 1.75 1.81 1.34 1.33 1.11 1.11City of Buckeye 432,220,285$ 1.80 1.80 1.80 1.80 1.80 1.80 1.80 1.61 1.19 0.89Town of Cave Creek 141,336,478$ 0.00 0.00 0.00 0.00 0.00 0.00 0.00 0.08 0.65 0.65City of El Mirage 106,804,478$ 3.96 3.63 3.78 3.84 3.54 4.04 3.89 2.87 2.29 1.57City of Phoenix 12,399,776,103$ 2.14 2.16 2.17 1.82 1.82 1.82 1.82 1.82 1.72 1.82City of Glendale 1,306,946,089$ 1.98 2.08 2.15 2.20 2.15 2.29 1.91 1.60 1.60 1.60City of Goodyear 818,550,538$ 1.74 1.73 1.86 1.87 1.87 1.90 1.77 1.60 1.42 1.60City of Peoria 1,439,812,989$ 1.44 1.44 1.44 1.44 1.44 1.44 1.44 1.44 1.44 1.44City of Surprise 1,038,070,507$ 0.76 0.76 0.76 0.76 0.76 0.78 0.74 0.67 0.67 0.57City of Tolleson 207,248,691$ 3.83 3.99 3.97 3.97 3.75 3.76 3.41 2.90 2.44 2.51Town of Wickenburg 66,092,364$ 0.53 0.53 0.53 0.53 0.53 0.42 0.41 0.01 0.01 0.01Agua Fria Union High School District No. 216 1,187,073,018$ 3.48 3.71 3.47 3.27 4.20 3.57 3.17 2.68 2.45 2.69Arlington Elementary School District No. 47 227,018,955$ 1.24 1.25 1.20 1.33 1.29 1.11 1.12 1.06 0.94 0.90Avondale Elementary School District No. 44 367,311,044$ 5.01 5.22 6.40 6.23 5.80 4.64 4.33 4.80 2.94 3.31Buckeye Elementary School District No. 33 310,362,409$ 5.67 5.39 5.92 5.58 5.91 5.86 6.10 5.07 5.02 5.47Buckeye Union High School District No. 201 707,975,117$ 3.27 3.34 3.22 3.34 3.51 3.65 3.43 3.08 2.80 2.60Cartwright Elementary School District No. 83 426,382,522$ 10.62 11.05 11.10 11.14 10.64 10.21 10.45 8.68 6.51 4.75Deer Valley Unified School District No. 97 2,575,110,830$ 6.63 6.75 6.70 6.32 6.48 6.58 6.76 6.25 5.34 4.49Dysart Unified School District No. 89 1,280,332,490$ 6.89 6.96 7.13 6.68 7.12 7.57 7.38 5.99 5.26 5.00Fowler Elementary School District No. 45 321,309,082$ 3.82 4.10 4.98 4.05 3.90 5.12 4.83 3.79 2.82 2.94Glendale Elementary School District No. 40 287,463,698$ 6.05 6.38 6.07 5.84 6.47 7.30 6.94 6.41 4.77 3.99Glendale Union High School District No. 205 1,576,504,529$ 4.11 4.60 4.67 4.46 4.42 4.58 4.10 3.53 2.68 2.60Liberty Elementary School District No. 25 242,901,538$ 3.54 3.72 3.79 4.28 4.50 3.46 3.54 3.20 3.31 2.66Litchfield Elementary School District No. 79 819,761,974$ 3.85 3.48 3.81 3.84 3.78 3.98 3.89 3.26 2.91 2.69Palo Verde Elementary School District No. 49 25,038,392$ 4.05 3.95 4.64 4.48 4.03 4.02 4.08 3.79 2.43 2.43Paradise Valley Unified School District No. 69 3,381,200,251$ 6.56 6.55 6.97 6.99 6.78 7.15 6.59 5.70 4.90 4.62Pendergast Elementary School District No. 92 316,256,282$ 6.71 6.85 6.69 6.88 7.19 7.27 6.38 6.61 5.80 5.20Peoria Unified School District No. 11 1,780,118,947$ 7.02 7.54 8.04 7.78 7.27 4.33 7.03 5.39 5.33 5.45Phoenix Union High School District No. 210 4,965,898,777$ 5.20 5.03 5.07 4.96 4.62 4.81 4.27 3.76 3.25 2.95Saddle Mountain Unified School District No. 90 742,127,564$ 2.50 2.54 2.55 2.60 2.62 1.70 1.28 1.38 2.10 1.83Tolleson Union High School District No. 214 1,134,931,491$ 4.45 3.94 3.57 4.01 4.53 5.49 4.84 4.07 2.72 3.91Washington Elementary School District No. 6 1,289,040,831$ 5.10 5.21 5.63 5.79 5.70 6.02 4.71 4.61 3.38 3.08Wickenburg Unified School District No. 9 183,780,454$ 4.64 5.02 5.40 5.08 5.55 4.33 5.05 4.45 3.56 4.55Buckeye Valley Fire District 133,011,119$ 3.25 3.25 3.25 3.25 3.25 3.10 3.10 3.10 2.55 2.55Daisy Mountain Fire District 413,804,044$ 3.50 3.74 3.25 3.25 3.25 3.25 3.25 2.98 2.42 1.91Harquahala Valley Fire District 38,060,336$ 2.90 2.90 2.19 2.29 2.13 1.96 1.96 1.91 1.44 1.29Sun City Fire District 419,003,462$ 3.14 3.47 3.25 3.25 3.25 3.25 3.37 3.15 2.75 2.39North County Fire District 543,962,735$ 2.86 2.86 2.80 2.86 2.92 2.92 2.72 2.43 2.26 1.97Tonopah Valley Fire District 20,888,411$ 3.50 3.50 3.25 3.25 3.25 3.25 3.48 3.09 1.66 1.06Wickenburg Fire District 18,691,372$ 1.72 1.75 1.54 1.33 1.40 1.19 1.39 1.21 0.79 0.68
Primary 0.00 0.00 0.00 0.00 0.00 0.00 0.00 0.00 0.00 0.00Secondary 0.15 0.18 0.08 0.07 0.08 0.06 0.05 0.05 0.05 0.05Total 24,032,705$ 0.15 0.18 0.08 0.07 0.08 0.06 0.05 0.05 0.05 0.05
Source:
Ove
rlap
pin
g R
ates
The source of this information is the Property Tax Rates and Assessed Values, Arizona Tax Research Foundation.
Dis
tric
t D
irec
t R
ates
WESTERN MARICOPA EDUCATION CENTER DISTRICT NO. 402DIRECT AND OVERLAPPING PROPERTY TAX RATES
LAST TEN FISCAL YEARS
Page 123

Net Limited Assessed
Valuation
Net Full Cash Assessed Valuation
Arizona Public Service Company 846,022,889$ 5.72 % 880,013,883$ 4.28 %Southern California Edison Company 116,341,170 0.79 179,758,160 0.87 El Paso Electric Co. 102,383,276 0.69 151,474,973 0.74 Public Service Company of New Mexico 64,631,734 0.44 87,829,351 0.43 Southwest Gas Corporation 59,014,495 0.40 69,815,367 0.34 Wal-Mart Stores Inc 51,091,612 0.35 75,351,259 0.37 Qwest Corporation 39,532,575 0.27 132,840,051 0.65 Mesquite Power LLC 36,396,000 0.25 87,367,090 0.43 Host Kierland, LLC 39,067,148 0.26 Southern California Public Power Auth. 38,442,905 0.26 68,023,472 0.33 JW Marriott Desert Ridge Resort & Spa 54,451,263 0.27 Total 1,392,923,804$ 9.43 % 1,786,924,869$ 8.7 %
Source:Note: On November 6, 2012, voters approved Proposition 117, an amendment to the Arizona Constitution. Beginning with
Tax Year 2015 (Fiscal Year 2016), both primary and secondary taxes are levied against the net limited assessed value.
The source of this information is the Maricopa County Assessor's records.
WESTERN MARICOPA EDUCATION CENTER DISTRICT NO. 402PRINCIPAL PROPERTY TAXPAYERS
CURRENT FISCAL YEAR AND FISCAL YEAR NINE YEARS PRIOR
Percentage of District's Net
Limited Assessed Valuation
Percentage of District's Net
Full Cash Assessed Valuation
2010
Taxpayer
2019
Page 124

FiscalYear Taxes Levied Collections in
Ended for the Subsequent June 30 Fiscal Year Amount Fiscal Years Amount(2)
2019 22,225,741$ 21,882,575$ 98.46 % $ 21,882,575$ 98.46 %2018 24,915,890 24,542,391 98.50 79,979 24,622,370 98.822017 11,160,892 10,984,292 98.42 172,690 11,156,982 99.962016 8,933,321 8,794,486 98.45 135,007 8,929,493 99.962015 10,503,241 10,311,873 98.18 186,918 10,498,791 99.962014 7,067,032 6,933,551 98.11 130,724 7,064,275 99.962013 6,152,651 6,036,245 98.11 114,305 6,150,550 99.972012 6,816,149 6,607,892 96.94 205,757 6,813,649 99.962011 8,706,992 8,364,241 96.06 339,795 8,704,036 99.972010 10,441,050 10,052,716 96.28 385,043 10,437,759 99.97
Source:Notes: 1)
2)
Fiscal Year of the LevyCollected within the
of the Current Fiscal Year
WESTERN MARICOPA EDUCATION CENTER DISTRICT NO. 402PROPERTY TAX LEVIES AND COLLECTIONS
LAST TEN FISCAL YEARS
Collected to the End
Unsecured personal property taxes are not included in this schedule because the dates of the monthly rollsvary each year. On the average, 90% of unsecured property taxes are collected within 90 days after thedue date.
Amounts collected are on a cash basis.The source of this information is the Maricopa County Treasurer's records.
of LevyPercentage
of LevyPercentage
Page 125

Fiscal Less: Percentage of Percentage of Year Estimated Estimated Percentage of
Ended Actual Value Per Actual Value Per Personal June 30 Total (Full Cash Value) Capita Total (Full Cash Value) Capita Income
2019 137,152,727$ 1,251,559$ 135,901,168$ 0.14 % 63$ $ 137,152,727$ 0.14 % 64$ N/A %2018 150,411,156 805,314 149,605,842 0.15 72 150,411,156 0.15 73 0.08 2017 154,214,585 365,214 153,849,371 0.03 76 154,214,585 0.03 76 0.08 2016 75,569,016 812,213 74,756,803 0.03 41 75,569,016 0.00 41 0.04 2015 61,418,358 2,262,643 59,155,715 #REF! 34 61,418,358 0.00 35 0.04 2014 36,272,823 103,523 36,169,300 #REF! 21 36,272,823 #REF! 21 0.02 2013 36,343,535 1,344,990 34,998,545 #REF! 22 36,343,535 #REF! 23 0.02 2012 #REF! 4,777,905 4,777,905 #REF! 3 0.00 2011 #REF! 5,452,905 5,452,905 #REF! 4 0.00 2010 #REF! #REF!
Source:Notes: 1) The District had no debt prior to fiscal year 2010-11.
2) N/A Indicates that the information is not available.
The source of this information is the District's financial records.
General Obligation Bonds
WESTERN MARICOPA EDUCATION CENTER DISTRICT NO. 402OUTSTANDING DEBT BY TYPE
LAST TEN FISCAL YEARS
Total Outstanding Debt
General Obligation
BondsCapital Leases
Amounts Restricted
for Principal
Page 126

Estimated EstimatedPercentage Amount
Debt Applicable to Applicable toOutstanding School District School District
Overlapping:Maricopa County Community College District 312,450,000 36.62 114,419,190 Maricopa County Special Healthcare District 459,125,000 36.62 168,131,575 City of Avondale 37,695,000 100.00 37,695,000 City of of El Mirage 22,440,000 97.85 21,957,540 City of Glendale 116,100,000 95.76 111,177,360 City of Goodyear 112,980,000 99.54 112,460,292 City of Peoria 132,365,000 97.73 129,360,315 City of Phoenix 1,085,050,000 46.76 507,369,380 City of Scottsdale 483,215,000 16.94 81,856,621 City of Surprise 35,215,000 97.11 34,197,287 City of Tolleson 25,606,118 100.00 25,606,118 Buckeye Valley Fire District 6,840,000 100.00 6,840,000 Sun City Fire District 8,895,000 7.80 693,810 Agua Fria Ranch Community Facilities District 2,155,000 100.00 2,155,000 Centerra Community Facilities District 2,910,000 100.00 2,910,000 Cortina Community Facilities District 1,745,000 100.00 1,745,000 Cottonflower Community Facilities District 1,700,000 100.00 1,700,000 Estrella Ranch Community Facilities District No. 1 11,925,000 100.00 11,925,000 Festival Ranch Community Facilities District 28,680,000 100.00 28,680,000 Goodyear Community Facilities General District No. 1 7,740,000 100.00 7,740,000 Goodyear Community Facilities Utilities District No. 1 33,130,000 100.00 33,130,000 Marley Park Community Facilities District 11,005,000 100.00 11,005,000 Palm Valley Community Facilities District No. 3 5,320,000 100.00 5,320,000 Sundance Community Facilities District 21,400,000 100.00 21,400,000 Tartesso West Community Facilities District 6,050,000 100.00 6,050,000 Verrado District No.1 Community Facilities District 32,075,000 100.00 32,075,000 Verrado Western Overlay Community Facilities District 7,400,000 100.00 7,400,000 Village at Litchfield Park Community Facilities District 2,255,000 100.00 2,255,000 Vistancia Community Facilities District 25,480,000 100.00 25,480,000 Vistancia West Community Facilities District 5,250,000 100.00 5,250,000 Westpark Community Facilities District 4,970,000 100.00 4,970,000 Wildflower Ranch Community Facilities District No. 1 390,000 100.00 390,000 Wildflower Ranch Community Facilities District No. 2 625,000 100.00 625,000 Arlington Elementary School District No. 47 1,055,000 100.00 1,055,000 Avondale Elementary School District No. 44 30,625,000 100.00 30,625,000 Buckeye Elementary School District No. 33 29,360,000 100.00 29,360,000 Cartwright Elementary School District No. 83 20,535,000 100.00 20,535,000 Fowler Elementary School District No. 45 9,675,000 100.00 9,675,000 Glendale Elementary School District No. 40 31,510,000 100.00 31,510,000 Liberty Elementary School District No. 25 15,205,000 100.00 15,205,000 Litchfield Elementary School District No. 79 46,335,000 100.00 46,335,000 Littleton Elementary School District No. 65 23,935,000 100.00 23,935,000 Pendergast Elementary School District No. 92 39,450,000 100.00 39,450,000 Tolleson Elementary School District No. 17 17,780,000 100.00 17,780,000 Union Elementary School District No. 62 8,720,000 100.00 8,720,000 Washington Elementary School District No. 6 (c) 108,250,000 100.00 108,250,000 Agua Fria Union High School District No. 216 87,815,000 100.00 87,815,000 Buckeye Union High School District No. 201 75,135,000 100.00 75,135,000 Glendale Union High School District No. 205 102,970,000 100.00 102,970,000 Phoenix Union High School District No. 210 389,120,000 4.63 18,016,256 Tolleson Union High School District No. 214 123,460,000 100.00 123,460,000 Deer Valley Unified School District No. 97 198,220,000 100.00 198,220,000 Dysart Unified School District No. 89 121,293,000 100.00 121,293,000 Paradise Valley Unified School District No. 69 292,028,000 100.00 292,028,000 Peoria Unified School District No. 11 212,545,000 100.00 212,545,000 Saddle Mountain Unified School District No. 90 13,305,000 100.00 13,305,000 Wickenburg Unified School District No. 9 9,283,000 100.00 9,283,000 Western Maricopa Education Center No. 402 116,510,000 100.00 116,510,000
Subtotal, Overlapping Debt 3,316,984,744
Direct:Western Maricopa Education Center District No. 402 137,152,727
Total Direct and Overlapping Governmental Activities Debt 3,454,137,471$
Source:
Note:Estimated percentage of debt outstanding applicable to the District is calculated based on a portion of the District's net limited assessed valuation as a percentage of the net limited assessed valuation of the overlapping jurisdiction.
WESTERN MARICOPA EDUCATION CENTER DISTRICT NO. 402DIRECT AND OVERLAPPING GOVERNMENTAL ACTIVITIES DEBT
JUNE 30, 2019
Governmental Unit
The source of this information is the District's records and the State and County Abstract of the Assessment Roll,Arizona Department of Revenue and the applicable governmental unit.
Page 127

Net Direct General Obligation Bonded DebtPer Capita 63$As a Percentage of Net Limited Assessed Valuation 0.92 %As a Percentage of Gross Full Cash Value 0.07 %
Net Direct and Overlapping General Bonded DebtPer Capita 1,601$ As a Percentage of Net Limited Assessed Valuation 23.36 %As a Percentage of Gross Full Cash Value 1.86 %
Source:
Notes: 1)
2)
WESTERN MARICOPA EDUCATION CENTER DISTRICT NO. 402
JUNE 30, 2019
The source of this information is the District's records and the State and County Abstract of the AssessmentRoll, Arizona Department of Revenue and the applicable governmental unit.
Estimated percentage of debt outstanding applicable to the District is calculated based on a portion of theDistrict's net limited assessed valuation as a percentage of the net limited assessed valuation of theoverlapping jurisdiction.Outstanding debt as of June 30, 2018 is presented for the overlapping governments as this is the most recent available information.
DIRECT AND OVERLAPPING GENERAL BONDED DEBT RATIOS
Page 128

Current Year Statistics for Fiscal Year 2019:
Net full cash assessed valuation 19,290,186,581$ 137,152,727$ Debt limit (1% of assessed value) 192,901,866 Net limited assessed valuation 14,779,081,650 Debt applicable to limit 134,217,281 Net full cash assessed valuation 19,290,186,581 Legal debt margin 58,684,585$ Estimated net full cash value 156,594,037,923
2019 2018 2017 2016 2015
Debt Limit 192,901,866$ 178,577,241$ 165,038,668$ 152,551,213$ 1,950,220,300$
Total net debt applicable to limit 134,217,281 147,288,914 151,220,000 72,995,000 59,045,000
Legal debt margin 58,684,585$ 31,288,327$ 13,818,668$ 79,556,213$ 1,891,175,300$
Total net debt applicable to the limit as a percentage of debt limit 70% 82% 92% 48% 3%
2014 2013 2012 2011 2010
Debt Limit 1,735,446,205$ 1,842,648,849$ 2,047,999,084$ 2,657,819,354$ 3,081,977,483$
Total net debt applicable to limit 35,000,000 35,000,000
Legal debt margin 1,700,446,205$ 1,807,648,849$ 2,047,999,084$ 2,657,819,354$ 3,081,977,483$
Total net debt applicable to the limit as a percentage of debt limit 2% 2% 0% 0% 0%
Source:Notes: 1)
2) Prior to FY17, net bond premium was restricted by amount and not subject to the statutory debt limit. Beginning with FY17, any additional net premium used for capital projects, bond counsel, printing and preparation of offering documents, a financial advisor, paying agent costs or to pay down debt is counted against both debt limits with the exception of amounts of premium deposited into the Debt Service Fund or a refunding escrow to pay interest payments.
The District’s general obligation bonds are subject to two limits; the Constitutional debt limit (total debt limit) on all general obligation bonds andthe statutory debt limit on Class B bonds. The calculations of the debt margins are presented in detail for the current fiscal year only.
WESTERN MARICOPA EDUCATION CENTER DISTRICT NO. 402LEGAL DEBT MARGIN INFORMATION
LAST TEN FISCAL YEARS
Fiscal Year Ended June 30
The source of this information is the District's financial records.
Total Legal Debt Margin and Class B Bond Legal Debt Margin Calculation for Fiscal Year 2019:
Total direct general obligation bonded debt outstanding
Page 129

Estimated
Year Population (thousands)
2018 4,294,460 $ N/A $ N/A % 2,156,839 2017 4,221,684 196,286,191 45,573 2,066,940 2016 4,137,076 185,111,698 43,628 2,025,085 2015 4,076,438 184,784,917 42,092 1,825,052 2014 4,008,651 168,483,421 41,222 1,739,119 2013 3,944,859 147,700,000 27,552 1,727,264 2012 3,884,705 147,374,500 38,238 1,600,135 2011 3,843,370 142,864,275 37,352 1,469,471 2010 3,817,117 142,091,618 35,319 1,468,780 2009 4,023,331 147,122,078 37,168 1,502,608
Sources:
Note: N/A indicates that the information is not available.
WESTERN MARICOPA EDUCATION CENTER DISTRICT NO. 402COUNTY-WIDE DEMOGRAPHIC AND ECONOMIC STATISTICS
LAST TEN CALENDAR YEARS
Personal Income Per Capita
IncomeUnemployment
RateDistrict
Population
4.1
The source of the "Personal Income" and "Per Capita" information is the Bureau of Economic Analysis.The source of the "Population" and "Unemployment Rate" information from 2009 through 2010 is theUniversity of Arizona, Eller College of Management, Economic and Business Research Center. For 2011through 2018, the source of the information is the Arizona Office of Employment and Population Statistics.
4.2 4.5 5.5 5.9 6.7 7.1 8.4 9.1 8.7
Page 130

Percentage Percentageof Total of Total
Employees Employment Employees Employment
Banner Health Systems 45,894 2.23 % 27,431 1.43 %State of Arizona 37,040 1.80 52,420 2.73 Wal-Mart Stores Inc. 33,619 1.63 31,280 1.63 Fry's Food and Drug Stores 20,165 0.98 Wells Fargo Company 16,300 0.79 14,000 0.73 University of Arizona 15,967 0.78 Amazon.com, Inc. 15,000 0.73 Arizona State University 14,889 0.72 12,043 0.63 City of Phoenix 14,821 0.72 16,375 0.85 Maricopa County 13,595 0.66 12,996 0.68 Apollo Group Inc. 12,299 0.64 Raytheon Co. 11,500 0.60 Honeywell 10,145 0.53
Total 227,290 11.04 % 200,489 10.45 %
Total employment 1,982,900 1,995,000
Source: Note: The principal employers were not available for the District alone, therefore, the principal employers for Maricopa County are
presented.
The source of this information is The Phoenix Business Journal Book of Lists.
WESTERN MARICOPA EDUCATION CENTER DISTRICT NO. 402PRINCIPAL EMPLOYERS
CURRENT FISCAL YEAR AND FISCAL YEAR NINE YEARS PRIOR
Employer
2019 2010
Page 131

2019 2018 2017 2016 2015
SupervisoryConsultants/supervisors of instruction 4 10 14 10 3
Total supervisory 4 10 14 10 3 Instruction
Teachers 53 62 51 43 22 Total instruction 53 62 51 43 22
Support and AdministrationService workers 99 79 65 77 60
Total support and administration 99 79 65 77 60
Total 156 151 130 130 85
(Continued)
Full-time Equivalent Employees as of June 30
LAST TEN FISCAL YEARS
WESTERN MARICOPA EDUCATION CENTER DISTRICT NO. 402FULL-TIME EQUIVALENT DISTRICT EMPLOYEES BY TYPE
Page 132

2014 2013 2012 2011 2010
SupervisoryConsultants/supervisors of instruction 2 2 2 1 3
Total supervisory 2 2 2 1 3 Instruction
Teachers 13 10 7 5 2 Total instruction 13 10 7 5 2
Support and AdministrationService workers 44 32 25 23 16
Total support and administration 44 32 25 23 16
Total 59 44 34 29 21
Source:
(Concluded)
WESTERN MARICOPA EDUCATION CENTER DISTRICT NO. 402FULL-TIME EQUIVALENT DISTRICT EMPLOYEES BY TYPE
LAST TEN FISCAL YEARS
The source of this information is District personnel records.
Page 133

FiscalYear Cost Cost Pupil-
Ended per Percentage per Percentage Teaching TeacherJune 30 Pupil Change Expenses Pupil Change Staff Ratio
2019 7,076 28,968,880$ 4,094$ 8.11 % 48,676,677$ 6,879$ 24.18 % 53 133.5 2018 6,845 25,920,322 3,787 (2.65) 37,917,426 5,539 7.15 62 110.4 2017 6,547 25,467,300 3,890 2.84 33,846,107 5,170 5.32 51 128.4 2016 6,075 22,978,635 3,782 (0.09) 29,818,667 4,908 2.91 43 141.3 2015 5,462 20,678,294 3,786 14.26 26,052,090 4,770 19.82 22 248.3 2014 5,380 17,826,553 3,313 (9.11) 21,416,841 3,981 4.47 13 413.8 2013 4,589 16,730,530 3,646 8.54 17,486,580 3,811 5.87 10 458.9 2012 4,569 15,346,339 3,359 4.65 16,444,754 3,599 2.17 7 652.7 2011 6,646 21,330,246 3,209 13.75 23,413,201 3,523 22.34 5 1,329.2 2010 6,367 17,964,491 2,822 (6.68) 18,334,554 2,880 (5.64) 2 3,183.5 2009 4,601 13,910,789 3,023 14,041,474 3,052 1 4,601.0
Operating expenditures are total expenditures less debt service and capital outlay.The source of this information is the District's financial records.Source:
Note:
Average Daily
MembershipOperating
Expenditures
WESTERN MARICOPA EDUCATION CENTER DISTRICT NO. 402OPERATING STATISTICSLAST TEN FISCAL YEARS
Page 134

2019 2018 2017 2016 2015 2014 2013 2012 2011 2010
SchoolsBuildings 26 17 15 12 9 9 5 5 5 1 Square feet 562,634 421,284 411,496 343,092 261,195 261,195 154,371 154,371 154,371 4,700
Source: The source of this information is the District's facilities records.
WESTERN MARICOPA EDUCATION CENTER DISTRICT NO. 402CAPITAL ASSETS INFORMATION
LAST TEN FISCAL YEARS
Fiscal Year Ended June 30
Page 135

(This page intentionally left blank)
Page 136