wfm 2013: the store employee in the customer age€¦ · wfm 2013: the store employee in the...
TRANSCRIPT

WFM 2013: The Store Employee in the Customer Age
Benchmark Report Paula Rosenblum & Brian Kilcourse, Managing Partners
December 2012
Supporting Sponsors:

ii
Executive Summary
To enhance the value of the in-store experience for consumers, RSR recommends that retailers “wrap” customer service around standardized assortments. Aside from the instant gratification that comes from taking a product home after a purchase, it’s the store employee that can make the difference to the in-store experience. But there’s a long way to go before consumers are satisfied – and the purpose of the store is validated. A strong argument for workforce management disciplines and technology- especially for those retailers who put a premium on a high-touch customer service strategy, is to give retailers the visibility they need into store labor at a task level so that they can optimize non-selling processes and to ensure that the more costly customer service functions are yielding the desired results.
Key Findings
• Most retailers agree that the role of the workforce in enabling customer service is more important than ever. However, Fashion/short lifecycle and Hard goods retailers feel most strongly that a high-touch customer service strategy with skilled employees is essential, while those selling fast moving consumer goods like food (FMCG) generally do not believe that much in the way of special skills or training is required to make execute that strategy.
• “Meeting consumer demands for better service” and “driving sales through a more enjoyable shopping experience” are top business challenges, along with “consistency in store execution”. Both Winners and average performers are concerned that employee time away from the sales floor is the top operational challenge to improving customer service. Laggards suffer from an unfocused angst; their top internal concern is that employees are being pulled in “too many different directions”.
• There is a dramatic variance in the KPIs that retailers perceive as very valuable in assessing Workforce Management technology investments vs. the ones they actually use.
• There’s a big gap between perceived importance in saving manager time vs. actually quantifying that time saving.
• Laggards believe that optimizing processes & metrics and improving their forecasting & scheduling abilities are important to overcome the internal challenge of employees being pulled in too many directions, but they rate the value of investments in technology that would facilitate those opportunities lower than either Winners or average performers.
• Under-performers rate “too many other priorities” as a top inhibitor to investing, along with “lack of ROI” and “lack of budget”.
• Winners are concerned about organizational change management – and feel that change will start with the company finding a balance between non-differentiating activities needed to keep the stores going and differentiating ones that build revenue.
• More Retailer Winners have implemented workforce management technologies than the study group as a whole. In addition to basic Time & Attendance, Winners’ top focus areas to-date have been schedule and labor requirements optimization, forecasting & budgeting, and automated schedule creation. All of these capabilities are enablers for a more balanced distribution of labor according to the retailer’s Brand requirements for a higher-profile service offering.
• Most Retail Winners have chosen a commercial package for their workforce management needs. However, the majority of laggards are running “homegrown” or customized

iii
workforce management applications, and surprisingly, ½ of those have no plans to change.
BOOTstrap Recommendations
• Change Management is About More than Just Technology. The role of the in-store workforce is changing, and retailers in this survey generally recognize that they need new technologies to support this change.
• Take the opportunity to codify job descriptions. This will insure that labor scheduling is optimized to the capability constraints of employees.
• Stop Rolling Your Own! Workforce Management software isn’t a Differentiator (but lack of it is – a negative one!)
• Measure What You Value; Value What You Measure • Forecasting Isn’t Just for Supply Chain and Merchandising Anymore. Merchandise
receipt and sales forecasts have direct implications to the in-store labor force. Both these forecasts should be direct inputs into labor scheduling.
• Get Your Store Manager Mobile and Out of the Weeds. The store manager’s time is the most valuable of all, and his or her presence on the selling floor is critical to setting the right tone. Freeing up the store manager from the mundane tasks of labor scheduling and juggling priorities can create a host of new opportunities:
o On-boarding new employees. o Working with customers. o Managing exceptions. The value of mobile alerts delivered to smaller mobile
devices is it keeps the store manager educated and engaged at the same time

iv
Table of Contents Executive Summary .......................................................................................................................... ii Research Overview ......................................................................................................................... 1
Why Study Workforce Management Adoption? ........................................................................... 1 The Focus Of Labor ..................................................................................................................... 1 Aiming High .................................................................................................................................. 2 Defining Winners and Why They Win .......................................................................................... 4 Methodology................................................................................................................................. 4 Survey Respondent Characteristics ............................................................................................ 5
Business Challenges ....................................................................................................................... 6 Conflicted Concerns Highlight Retailer Challenges ..................................................................... 6 Laggards Try to Reduce Costs, Average Performers Try to Improve ......................................... 6 Even in an Uncertain Economy, Turnover Remains a Problem .................................................. 7 Capabilities to Manage the Employee Lifecycle Remains Weak ................................................. 8
Opportunities ................................................................................................................................. 10 Opportunities Correlate to Solving Business Challenges .......................................................... 10 The Most Valued Measurements are Not Always Used ............................................................ 10
Organizational Inhibitors ................................................................................................................ 12 Who Is Working The Sales Floor? ............................................................................................. 12 Culture And Priorities ................................................................................................................. 13 Seeing The Problem – Then Solving It ...................................................................................... 14
Technology Enablers ..................................................................................................................... 16 Keeping Time vs. Optimization .................................................................................................. 16 Spend vs. Value ......................................................................................................................... 17 Different Approaches To Implementation .................................................................................. 18 Someone Tell Laggards: Homegrown Is Old-and-in-the-way .................................................... 19
BOOTstrap Recommendations ..................................................................................................... 21 Change Management is About More than Just Technology ...................................................... 21 Stop Rolling Your Own! Workforce Management isn’t a Differentiator ...................................... 21 Measure What You Value; Value What You Measure ............................................................... 21 Forecasting Isn’t Just for Supply Chain and Merchandising Anymore ...................................... 21 Get Your Store Manager Mobile and Out of the Weeds ............................................................ 21
Appendix A: RSR’s Research Methodology .................................................................................... a Appendix B: About Our Sponsors.................................................................................................... b Appendix C: About RSR Research ................................................................................................... c

v
Figures
Figure 1: Grocery – Lots Of Labor, Little Experience ...................................................................... 2
Figure 2: Fashion – Customer Engagement Is Key ........................................................................ 2
Figure 3: Employees in the Customer Age ...................................................................................... 2
Figure 4: High-Touch = High Skills .................................................................................................. 3
Figure 5: Walking the Talk ............................................................................................................... 4
Figure 6: Satisfying Customers Conflict with Satisfying Shareholders ............................................ 6
Figure 7: Different Priorities at Various Levels of Performance ...................................................... 7
Figure 8: Employee Turnover Remains a Significant Issue ............................................................ 8
Figure 9: A Serious Lack of Process Capabilities ........................................................................... 9
Figure 10: Opportunities Focused on Improving Business Capabilities ........................................ 10
Figure 11: Measurements: High Understanding, Low Actual Usage ............................................ 11
Figure 12: Trouble Getting Focused .............................................................................................. 12
Figure 13: Change Management or Technology? ......................................................................... 13
Figure 14: Look Before You Leap.................................................................................................. 14
Figure 15: Counting the Time ........................................................................................................ 16
Figure 16: Winners Are Ahead On Optimization ........................................................................... 17
Figure 17: Getting The ROI ........................................................................................................... 18
Figure 18: Own or Rent? .............................................................................................................. 19

1
Research Overview
Why Study Workforce Management Adoption? We live in a world of converged digital and physical shopping “channels.” Consumers routinely begin their dialogue with retailers outside the store in the digital realm, even if their intent is to ultimately buy the item at a store. But order fulfillment doesn’t have to happen in the store. For many lines of products, a customer order can just as easily be fulfilled online with a direct shipment to the home. This reality threatens the viability of “the store” in an unprecedented way, and has given rise to concerns about “showrooming”, or “The Amazon Effect”. Given the extent that information about products can easily be a proxy for the product itself, stores are definitely threatened. For example, we don’t need to see, feel, or try most consumer electronics products to decide to buy them- feature, function, price, and availability can be easily described.
But as we said in our May 2012 benchmark report entitled The 2012 Retail Store: In Transition:
“Even as retailers struggle to improve the in-store customer experience and combat the phenomenon known as ‘showrooming’, it has also become apparent that the land-based channel isn’t going away any time soon. Until computing can offer the tactile and immediate satisfaction of a store visit, a majority of consumers will continue to consummate their purchases there. And until some retailer cracks the code on grocery home delivery, supermarkets will remain consistent destinations. In any case, customers need stores as part of their path to purchase.” 1
How should retailers combat the erosion of the importance of “the store”? RSR has observed in study after study that consumers have high expectations of a consistent experience across all channels. They expect more relevant offerings for their lifestyle needs, and better service, especially in the store. We thus have recommended retailers “wrap” customer service around standardized and often commodity items as a way of enhancing the value of the in-store experience. Aside from the instant gratification that comes from taking a product home after a purchase, it’s the store employee that makes the difference to the in-store experience.
RSR has argued that retailers must optimize non-selling functions so that a greater percentage of the labor spend can be focused on selling activities – and that’s where workforce management disciplines and supporting technologies come into the picture.
The Focus Of Labor In an October 2011 benchmark study entitled The 21st Century Store Manager, we noted that:
“FMCG/GMA retailers [FMCG is fast moving consumer goods, GMA is general merchandise and apparel] are much more challenged than their fashion-oriented counterparts by their unskilled labor force... Recent data from the U.S. Bureau of Labor Statistics for the Grocery sub-vertical highlights the challenge (Figure 1). According to the government statistics, the store management team is a relatively small group of experienced operators in an otherwise mostly unskilled labor pool – and there are few customer facing sales persons. Searching for an explanation, it may be that while FMCG/GMA often have employee turnover averages 100 percent or more compared to
1 The 2012 Retail Store: In Transition, 2012 Benchmark Report, © RSR Research LLC, May 2012

2
the retail industry average of 59 percent, “good customer service” is defined by a good in-stock position and a fast checkout for ubiquitous products that are defined by consistent quality and a aggressive price…
Figure 1: Grocery – Lots Of Labor, L itt le Experience
Occupation % of all Employees
Total Sales and related occupations 41.8 First-line supervisors/managers of retail sales workers 4.9 Cashiers, except gaming 34.0 Retail salespersons 1.9
Source: U.S. Department of Labor Statistics, Career Guide to Industries, 2010-11 Edition
“On the other hand, Fashion retailers are often very Brand focused... For these retailers, providing a brand-centric experience is the key to success. The U.S. Department of Labor Statistics highlights that point of view (Figure 2). On a percentage-of-total basis, there are twice as many management people in Fashion as in Grocery, and 20 times more customer facing sales employees.”2
Figure 2: Fashion – Customer Engagement Is Key
Occupation % of all Employees
Total Sales and related occupations 64.2 First-line supervisors/managers of retail sales workers 8.4 Cashiers, except gaming 15.7 Retail salespersons 39.5
Source: U.S. Department of Labor Statistics, Career Guide to Industries, 2010-11 Edition
Aiming High In this study, the vast majority of retailers agreed that the role of the workforce in enabling customer service is more important than ever (Figure 3).
Figure 3: Employees in the Customer Age
Source: RSR Research, December 2012
2 The 21st Century Store Manager, Benchmark, © RSR Research LLC, October 2011
82%
20% 2%
Become more important to us Remained the same Become less important to us
Over the Past Three (3) Years the Role of our Workforce in Enabling Customer Service has...

3
When we look at the role the workforce plays in enabling customer service, we discover some important differences of opinion depending on the type of merchandise being offered. Fashion/short lifecycle and Hard goods retailers feel most strongly that a high-touch customer service strategy with skilled employees is essential (Figure 4), and the majority of them disagree with the statement that their employees don’t require special skills or training. On the other hand, while FMCG (perishable/food and replenishment) retailers agree that a high-touch strategy is important, they generally do not believe that much in the way of special skills or training is required to make execute that strategy.
Figure 4: High-Touch = High Ski l l s
Source: RSR Research, December 2012
But the goal of a high-touch selling environment may be more aspirational than real, at least as far as consumer perceptions are concerned. Despite what retailers tell us about their customer-centric strategies in the store, when a 2011 survey by Cisco Systems asked 1,000 U.S. consumers to rank their top influencers in the buying process, 63% said online reviews were one of their top three influencers, compared to only 13% indicating store associates –down from 21% in a similar survey taken in 2010.
Clearly, there’s a long way to go before consumers are satisfied – and the purpose of the store is validated. A strong argument for workforce management disciplines and technology- especially for those retailers who put a premium on a high-touch customer service strategy, is to:
0%
0%
9%
27%
64%
0%
14%
29%
43%
14%
8%
0%
0%
38%
54%
6%
0%
13%
19%
63%
0%
0%
0%
50%
50%
Our employees must fulfill ordersplaced from other stores or other
channels and ship them to customers
Our employees must fulfill ordersplaced from other stores or otherchannels and prepare them for in-
store pickup.
We offer a low-touch customerservice strategy where employees
play a supplemental role
Employees play an important role,but do not require special skills or
training
We offer a high-touch customerservice strategy and skilled
employees are critical
Top Two (2) Roles the Workforce Plays in Enabling Your Company’s Customer Service Strategy
Perishable / Food
Durable / Hard Goods
Replenishment Goods
Seasonal
Fashion / Short Lifecycle

4
1) Give retailers the visibility they need into store labor at a task level so that they can optimize non-selling processes (thus freeing up more of the labor spend to devote to customer service functions), and
2) Ensure that the more costly customer service functions are yielding the desired results. In our 2010 Workforce Management study, we found that Retail Winners most are clearly aware if they have unproductive work practices in place, store employees won’t have time to satisfy customer needs.
The objective of this study is to uncover if and how retailers are addressing the challenges and opportunities associated refocusing the store workforce in this time of unmet consumer expectations for high-touch service.
Defining Winners and Why They Win We’ve already seen that retailers across the board claim that the role of the workforce in enabling better customer service has risen in importance in the last three years. But such a “motherhood and apple pie” statement needs to be backed up by action, and as is usually the case, over-performers – those we call “Winners” - excel at following through when it comes to meeting customers’ expectations (Figure 5).
Figure 5: Walking the Talk
Source: RSR Research, December 2012
Although 3 out of 4 of all our survey respondents say that the workforce has become more important in enabling customer service, over 40% more Retail Winners than average performers indicate that skilled employees are critical in offering high-touch customer service, and 36% more Winners than laggards back that up with a greater allocation of sales associates (vs. cashiers and back office staff). The implication is clear: For Winners, the focus of workforce management processes is on building revenue, not only on keeping a lid on labor spend.
Methodology RSR uses its own model, called the “BOOT,” to analyze Retail Industry issues. We build this model with our survey instruments. Appendix A contains a full explanation of the methodology.
53%
53%
73%
62%
47%
85%
72%
66%
83%
We have more sales associates than cashiers orbackoffice/restocking personnel
We offer a high-touch customer service strategyand skilled employees are critical
In the last 3 years, our workforce has becomemore important in enabling customer service
Role Of The Workforce/Allocation Of Labor
Retail Winners Average Performers Laggards

5
In our surveys, we continue to find differences in the thought processes, actions, and decisions made by retailers who outperform their competitors and the industry at large – Retail Winners. The BOOT model helps us better understand the behavioral and technological differences that drive sustainable sales improvements and successful execution of brand vision.
Survey Respondent Characteristics RSR conducted an online survey from September-November 2012 and received answers from 88 qualified retail respondents. Respondent demographics are as follows:
• Job Title: Senior Management (CEO, CFO, COO) 15% Vice President 10% Director/Manager 53% Internal Consultant 10% Internal Staff & Other 12% 12%
• 2011 Revenue (US$ Equivalent):
Less than $50 Million 25% $51 - $999 Million 30% $1 - $5 Billion 28% Over $5 Billion
17%
• Products sold: Fashion / Short Lifecycle 29% Seasonal 9% Replenishment Goods 18% Durable / Hard Goods 21%
• Headquarters/Retail Presence:
USA 57% 65% Canada 12% 33% Latin America 8% 20% UK 5% 17% Europe 12% 23% Middle East 0% 12% Africa 0% 3% Asia/Pacific 7% 25%
• Year-Over-Year Comparable Store Sales Growth Rates (assume average growth of 3%): Worse than Average (Laggards) 20% Average 43% Better than (Retail Winners) 37%

6
Business Challenges
Conflicted Concerns Highlight Retailer Challenges Given the importance retailers place on their workforce, it’s not surprising to find close to 60% select “meeting consumer demands for better service” and “driving sales through a more enjoyable shopping experience” as top-three business challenges. Of course consistency in store execution is a lynchpin of that experience and service and almost half cite this as a top-three concern as well (Figure 6).
Figure 6: Satisfy ing Customers Confl ict wi th Satisfy ing Shareholders
Source: RSR Research, December 2012
But it is interesting to see that almost half cite pressure to reduce labor costs as a percent of sales as a top-three business challenge as well. This leaves retailers pulled in exactly opposite directions – make it better, which has traditionally involved adding customer-facing associates in stores – and make it more efficient by reducing head count.
However, as mentioned in the overview, there are significant perceptual differences between Retail Winners and their peers or lower-performing competitors.
Laggards Try to Reduce Costs, Average Performers Try to Improve Winners and laggards both recognize the importance of the in-store shopping experience, but laggards are far more concerned with getting costs down. Average performers are focused on consistency and consumer demands (Figure 7).
5%
16%
20%
38%
43%
47%
58%
58%
Improve compliance with labor laws
Increase organizational visibility and control ofstore operations
Reduce staff turnover
Improve management accountability for storereadiness and customer service
Reduce labor costs as a percent of sales
Improve consistency of store-execution ofcorporate strategy and directives
Improve top line performance by offering adifferent / more enjoyable shopping experience
Need to meet the demands of consumers forbetter customer service
Business Challenges

7
Figure 7: Di fferent Pr iori t ies at Var ious Leve ls of Performance
Source: RSR Research, December 2012
Execution is often the difference between being just “average” and being a “Winner”.
Towards that end, RSR believes that average performers, who emulate Winners and seek to unseat them as customer favorites are more willing to sacrifice labor cost ratios in favor of improving consistency in the store. The data bears this out. Far fewer (31%) are concerned about reducing labor costs than improving consistency in store execution (59%).
Even in an Uncertain Economy, Turnover Remains a Problem One would think that the uncertain global economic conditions over the past few years would cause in-store employees to “hunker down” and remain in their jobs, regardless of workload and pressure. However, there is little to no evidence that this is happening. In fact, while turnover appears to take the traditional bell-curve shape for most retailers, laggards are having a harder time than ever keeping their employees in the store (Figure 8).
63%
63%
63%
31%
53%
31%
63%
59%
62%
46%
50%
42%
Improve top line performance by offering adifferent & more enjoyable shopping experience
Reduce labor costs as a percent of sales
Need to meet the demands of consumers forbetter customer service
Improve consistency of store-execution ofcorporate strategy and directives
Top Three Concerns Vary Depending on Performance
Retail Winners Average Performers Laggards

8
Figure 8: Employee Turnover Remains a Sign if icant Issue
Source: RSR Research, December 2012
Reasons for continued turnover have been well documented:
• Students often take jobs in stores because they are easy to come by and require very little long-term commitment
• Most retailers offer little in the way of benefits to their mostly part-time in-store workforce. • Very rarely are career paths offered, even to high aptitude workers. Store managers
often don’t even have the time to identify them, let alone to nurture them as assets.
The philosophical question retailers will have to answer is “Are store employees assets? And if they are, is it time to look at policies and strategies in a new way?” RSR believes that without a fresh look at the store employee-retailer relationship, turnover will remain intractable and the in-store customer experience will continue to deteriorate.
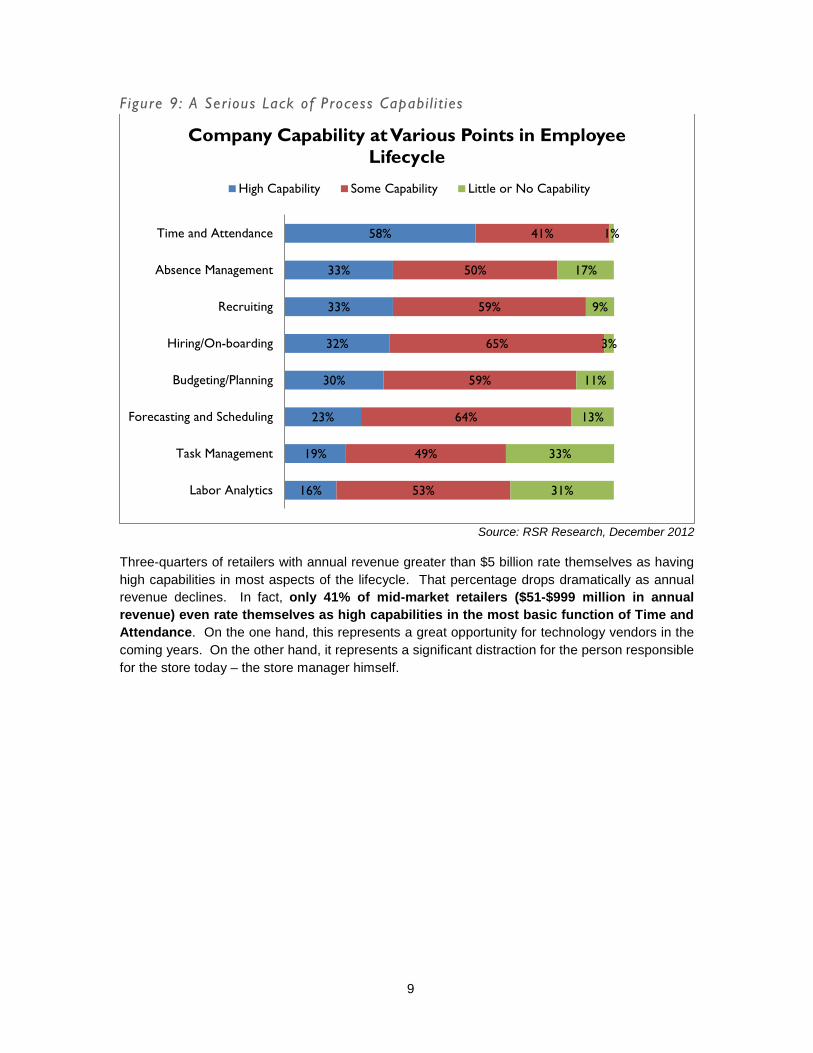
Capabilities to Manage the Employee Lifecycle Remains Weak Our retail respondents exhibit an almost shocking lack of ability to efficiently and effectively manage the employee lifecycle. With the exception of the largest retailers (those with more than $5 billion in annual revenue), who have, by necessity become efficient, they rate themselves as mostly mediocre in almost all areas (Figure 9).
31%
55%
14%
21%
50%
29%
40%
33%
27%
Increased Remained the same Decreased
Over the Past Three (3) Years our in-Store Employee Turnover has....
Retail Winners Average Performers Laggards
9
Figure 9: A Serious Lack of Process Capabi l i t ies
Source: RSR Research, December 2012
Three-quarters of retailers with annual revenue greater than $5 billion rate themselves as having high capabilities in most aspects of the lifecycle. That percentage drops dramatically as annual revenue declines. In fact, only 41% of mid-market retailers ($51-$999 million in annual revenue) even rate themselves as high capabilities in the most basic function of Time and Attendance. On the one hand, this represents a great opportunity for technology vendors in the coming years. On the other hand, it represents a significant distraction for the person responsible for the store today – the store manager himself.
16%
19%
23%
30%
32%
33%
33%
58%
53%
49%
64%
59%
65%
59%
50%
41%
31%
33%
13%
11%
3%
9%
17%
1%
Labor Analytics
Task Management
Forecasting and Scheduling
Budgeting/Planning
Hiring/On-boarding
Recruiting
Absence Management
Time and Attendance
Company Capability at Various Points in Employee Lifecycle
High Capability Some Capability Little or No Capability

10
Opportunities
Opportunities Correlate to Solving Business Challenges It turns out that perceived opportunities to overcome business challenges correlate quite well with improving the mediocre capabilities identified in Figure 9 (Figure 10).
Figure 10: Opportunit ies Focused on Improving Business Capabi l i t ies
Source: RSR Research, December 2012
We were gratified to see respondents recognize that processes need to be optimized and better measured, and how much they need to improve labor forecasting, scheduling and training tools. Most particularly, if turnover is going to remain intractable (and the lack of priority given to re-evaluating pay structure and incentives seems to indicate this will be the case) it’s particularly important to make those processes simple, efficient and very measureable.
The Most Valued Measurements are Not Always Used Given the clarity our respondents show in their assessment of opportunities, we were somewhat surprised to find a dramatic variance in the KPIs they perceive as very valuable in assessing Workforce Management technology investments vs. the ones they actually use (Figure 11).
7%
11%
13%
14%
16%
17%
19%
19%
21%
30%
37%
49%
49%
Deliver information to employee-owned devices
Re-evaluating our labor standards
Re-evaluating pay structure and incentives
Invest in mobile technologies for store managers
Deliver information to store-owned mobile devices
Improving our hiring or on-boarding process
Cross-training employees to improve flexibility
Better visibility into employee workloads
Better prioritization of actions or tasks by role
Better monitoring of employee performance
Improving our training tools and programs
Improved forecasting and scheduling
Optimizing store operational processes & metrics
Opportunities to Overcome Business Challenges

11
Figure 11: Measurements : High Understanding, Low Actual Usage
Source: RSR Research, December 2012
Cost improvements and revenue improvements are considered high value by almost 70% of respondents, yet are only used to measure success by less than one-half. Yet on the flip side, virtually the same number measure reduced overtime dollars, even as they don’t find it nearly as important.
We are rendered almost speechless at the gap between perceived importance in saving manager time (60%) vs. actually quantifying that time saving (25%). Perhaps most stunning is the disparity between Winners and laggards. While 42% of laggards identified this as “very valuable” (vs.68% of Retail Winners), only 9% of laggards actually use this measure to evaluate system efficacy, vs. 38% of Winners.
Laggards measure cost improvements above all, where they are on par with their peers. In almost every other area, they lag behind average performers and Winners. Without a shift in thought process, it is hard to see how they will ever catch up to their competitors.
33%
27%
43%
42%
18%
25%
38%
27%
25%
43%
50%
45%
36%
43%
47%
47%
57%
58%
58%
59%
60%
63%
67%
68%
Productivity improvements from engineered laborstandards
Improved visibility and flexibility from real-timetracking of actual labor spend against budget
Reduced overtime dollars
Total cost of ownership improvements from a singleplatform
Improved merchandising and marketing execution
Visibility improvements from integration betweenscheduling, time & attendance, and task management
Improved schedule accuracy
Reduced legal and compliance risk
Reduced manager time to create the schedule
Improved operational execution
Revenue improvements from a more optimizeddeployment of labor
Cost improvements from more optimized labordeployment
Value vs. Usage - Tech Investments
Very Valuable Measurements Actually Used

12
Organizational Inhibitors
Who Is Working The Sales Floor? In the last section of this report, we commented on the disparity between the perceived importance of saving the store manager’s time, and the actual investment in accomplishing that objective. In Figure 12, Retailer Winners underline the importance of the opportunity: for almost one-half of over-performers, the manager is spending too much time in the back room and away from where the customers are. And as we saw earlier as well, average performers who emulate Winners, are even more concerned about issue. And both Winners and average performers express a similar concern about the store employees generally – time away from the sales floor is the top internal challenge to improving customer service driving a focus on workforce management.
Figure 12: Trouble Gett ing Focused
Source: RSR Research, December 2012
Laggards on the other hand suffer from an unfocused angst; their top internal concern is that employees are being pulled in “too many different directions”. Given laggards’ sense that their overall business challenges revolve around the need to keep a lid on labor costs and still improve
20%
53%
33%
53%
20%
40%
47%
33%
38%
38%
47%
31%
34%
31%
25%
50%
22%
30%
30%
33%
41%
41%
41%
44%
“On-boarding” new employees to become good brand ambassadors is a time consuming task
Customers are better informed than ouremployees about products and services we offer
as well as competitive offerings
Poor process metrics/lack of visibility inhibit ourability to respond quickly to events on the selling
floor
Our employees are pulled in too many differentdirections
Keeping good employees is a challenge
“Good customer service” is defined by a good in-stock position and a fast checkout – we need to
execute better on those basics
Employees spend too much time on non-sellingactivities, not enough on helping customers
Store managers spend too much time in the backroom, not enough managing the sales floor
Internal Challenges Your Company Faces In Delivering A Good Store Experience To Consumers
Retail Winners Average Performers Laggards

13
customer service, getting a handle on just exactly what is pulling employees away from customer service activities should be a top priority. But the results of this study don’t support that assumption. Although laggards believe that optimizing processes & metrics and improving their forecasting & scheduling abilities would go a long way to overcoming the internal challenge of employees being pulled in too many directions, they rate the value of investments in technology that would facilitate those opportunities lower than either Winners or average performers. These problems won’t solve themselves; as we said earlier, without a shift in their thinking it is hard to see how laggards will ever catch up to their competitors.
Culture And Priorities In 2010 (the last time RSR did a study on workforce management), over 50% of survey respondents saw “hourly employee cultural and change management issues” as the top inhibitor to addressing the challenges and opportunities associated with workforce management capabilities. For the overall response group, that concern has receded sharply in the new study (Figure 13), and the aggregate top concern is “too many other priorities”.
Figure 13: Change Management or Technology?
Source: RSR Research, December 2012
7%
17%
25%
25%
32%
33%
35%
36%
41%
41%
11%
23%
29%
0%
51%
28%
42%
0%
43%
42%
Past project failures around workforcemanagement initiatives
Undefined project owners
Our current technology platform prevents usfrom moving forward
Compensation and retention strategies are out ofdate
Hourly employee cultural and change managementissues
Lack of an ROI for proposed solutions
Lack of budget for technologies that could help usmanage more effectively
No clear definition or guidance from corporatemanagement about what is expected in terms of…
Local management cultural and changemanagement issues
There are too many other priorities right now
Organizational Inhibitors Standing In The Way Of Improving Workforce Management Practices
2010 2012

14
Looking inside the numbers, we see a very different picture. The drop in importance of employee change management issues is difficult to explain in aggregate, but looking at responses by performance group we find that laggards are primarily responsible for the lowered concern. Only 8% of under-performers claim hourly employee change management is an inhibitor. But for 40% of Winners it remains the top inhibitor, equal in importance to “no clear definition or guidance from corporate management about what is expected in terms of the balance between selling and non-selling activities”. In other words, Winners are worried about organizational change management – and feel that it must start with the company finding a balance between non-differentiating activities needed to keep the stores going and differentiating ones that build revenue.
On the other hand, 77% more laggards rate “too many other priorities” as a top inhibitor than do Retail Winners (62% vs. 35%). That, along with “lack of ROI” and “lack of budget” (46% and 62% respectively), are the top inhibitors for laggards.
Seeing The Problem – Then Solving It Winners in particular are concerned about finding the balance between selling and non-selling activities and the organizational change management issues that would be the result of realigned customer service objectives. To help find that balance, both Winners and average performers look to “role based rules and analytics” – information - as a way to overcome organizational inhibitors (Figure 14).
Figure 14: Look Before You Leap
Source: RSR Research, December 2012
7%
29%
36%
29%
21%
7%
36%
71%
36%
23%
17%
20%
33%
23%
20%
40%
57%
57%
4%
16%
16%
24%
32%
32%
36%
52%
60%
External help building a business case
Out-of-the box engineered labor standards
A systems integrator to ease implementation
Changes in compensation and retention strategies
Services and advice from the technology provideron change management
A change management consultant to easeimplementation
Technology configurability
Technology ease of use
Role-based views and analytics
Top Three Opportunities To Help Overcome Organizational Inhibitors
Retail Winners Average Performers Laggards

15
Examining where the hours are really going – by role – is important because that helps retailers prioritize what operational processes need to be optimized and what technology investments are needed to enable those changes consistently across the enterprise.
Under-performers on the other hand look for the technology itself (rather than information about what’s actually happening at store level) as the way to overcome inhibitors like cultural resistance. Laggards seem to be looking for technology that is so easy to use that employees will be drawn to it and the ROI will become self-evident. Taken in tandem with their lack of concern about employee change management issues, a sadly familiar investment trap is exposed. It’s almost a truism in business that implementing technologies without having a parallel focus and investments in organizational change management and process optimization will fail to deliver the ROI companies hope for. If there is any one lesson that companies should have learned from the last 20 years of technology investments, it’s that technology is not the change, it is merely an enabler.
16
Technology Enablers
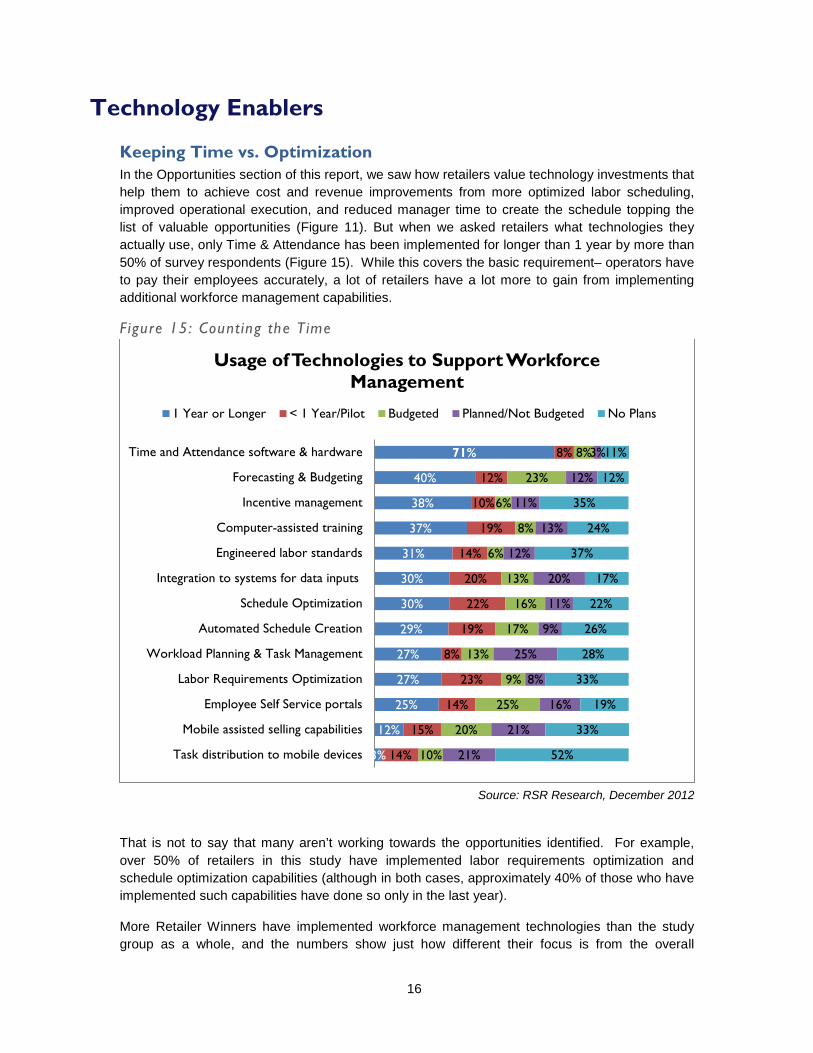
Keeping Time vs. Optimization In the Opportunities section of this report, we saw how retailers value technology investments that help them to achieve cost and revenue improvements from more optimized labor scheduling, improved operational execution, and reduced manager time to create the schedule topping the list of valuable opportunities (Figure 11). But when we asked retailers what technologies they actually use, only Time & Attendance has been implemented for longer than 1 year by more than 50% of survey respondents (Figure 15). While this covers the basic requirement– operators have to pay their employees accurately, a lot of retailers have a lot more to gain from implementing additional workforce management capabilities.
Figure 15: Counting the Time
Source: RSR Research, December 2012
That is not to say that many aren’t working towards the opportunities identified. For example, over 50% of retailers in this study have implemented labor requirements optimization and schedule optimization capabilities (although in both cases, approximately 40% of those who have implemented such capabilities have done so only in the last year).
More Retailer Winners have implemented workforce management technologies than the study group as a whole, and the numbers show just how different their focus is from the overall
3%
12%
25%
27%
27%
29%
30%
30%
31%
37%
38%
40%
71%
14%
15%
14%
23%
8%
19%
22%
20%
14%
19%
10%
12%
8%
10%
20%
25%
9%
13%
17%
16%
13%
6%
8%
6%
23%
8%
21%
21%
16%
8%
25%
9%
11%
20%
12%
13%
11%
12%
3%
52%
33%
19%
33%
28%
26%
22%
17%
37%
24%
35%
12%
11%
Task distribution to mobile devices
Mobile assisted selling capabilities
Employee Self Service portals
Labor Requirements Optimization
Workload Planning & Task Management
Automated Schedule Creation
Schedule Optimization
Integration to systems for data inputs
Engineered labor standards
Computer-assisted training
Incentive management
Forecasting & Budgeting
Time and Attendance software & hardware
Usage of Technologies to Support Workforce Management
1 Year or Longer < 1 Year/Pilot Budgeted Planned/Not Budgeted No Plans

17
response group (Figure 16). In addition to basic Time & Attendance, Winners’ top focus areas to-date have been schedule and labor requirements optimization, forecasting & budgeting, and automated schedule creation. All of these capabilities are enablers for a more balanced distribution of labor according to the retailer’s Brand requirements for a higher-profile service offering.
Figure 16: Winners Are Ahead On Optimizat ion
Source: RSR Research, December 2012
Spend vs. Value Looking at the same list of capabilities, we asked retailers to rate the value derived from workforce management technology investments ”so far” (Figure 17). Responses tell an interesting story. The overall group tracks fairly well between value expectations for the top 5 technologies and the extent to which they are either implemented of budgeted for implementation.
21%
24%
35%
44%
46%
48%
52%
58%
60%
64%
68%
72%
84%
Task distribution to mobile devices
Employee Self Service portals
Mobile assisted selling capabilities
Workload Planning & Task Management
Integration to systems for data inputs (POS,…
Computer-assisted training
Engineered labor standards
Incentive management
Labor Requirements Optimization
Forecasting & Budgeting
Automated Schedule Creation
Schedule Optimization
Time and Attendance software & hardware
Implemented Technologies For Managing Workforcce Requirements (Winners)
Retail Winners

18
Figure 17: Gett ing The ROI
Source: RSR Research, December 2012
Time & Attendance is considered table-stakes, a baseline to get to more interesting and valuable results from other technologies that follow. Hot-button technologies of the pre-mobile decade – computer-assisted training and employee self-service portals, have underperformed. But today’s “hot” technology, “mobile”, tracks closely between retailers’ expectations for value to the organization and current/budgeted implementations. Whatever concerns retailers may have had about difficult-to-achieve ROIs in the past, its apparent that they are working hard now to get out of technology investments what they hoped to get.
Different Approaches To Implementation The ways in which Winners approach the implementation technologies available to them is different, as evidenced by Figure 15. While retailers across all performance groups tend to agree that a unified suite encompassing all the capabilities of workforce management is very valuable, fewer agree that there should be a single instance of that portfolio running the whole enterprise (with Winners leading the way). As has been the case in the past, many retailers run different solutions across the enterprise, depending on line of business, (supply chain vs. store operations or administrative staff) or company divisions (different countries or brands). The results of this year’s survey differ by only a few points from our 2010 study on these options. However, a big change has occurred since 2010 as relates for how the capabilities should be delivered.
51%
27%
54%
59%
65%
63%
46%
86%
63%
47%
65%
67%
75%
27%
28%
34%
37%
39%
39%
46%
49%
56%
57%
58%
64%
64%
Engineered labor standards
Task distribution to mobile devices
Incentive management
Labor Requirements Optimization
Employee Self Service portals
Computer-assisted training
Mobile assisted selling capabilities
Time and Attendance software & hardware
Integration to systems for data inputs
Workload Planning & Task Management
Automated Schedule Creation
Schedule Optimization
Forecasting & Budgeting
What's Most Important vs. Where the Money Has Been Spent
Very Important Installed or Budgeted

19
Figure 18: Own or Rent?
Source: RSR Research, December 2012
As in 2010, less than 20% of Retail Winners view on-demand delivery of workforce management capabilities favorably. We’ve seen in most of our studies that Winners prefer to “own” the solution, and are willing to spend the capital to do that. But for laggards, it’s a different story. We saw in the Inhibitors section of this report that laggards have held back from investing in the technology because of lack of budget and difficult-to-prove ROIs. Perhaps for these reasons, 50% of laggards view an on-demand (or “pay as you go”) service delivery option favorably. That result is 2X the number of laggards that viewed the option favorably in 2010, a reflection of both the maturity of available offerings and the growing urgency with which the challenges and opportunities must be addressed.
Someone Tell Laggards: Homegrown Is Old-and-in-the-way Lastly, to drive home how much progress remains to be made, Figure 18 illustrates the anti-modern status of laggards’ implementations. Fully 62% of laggards are running “homegrown” or customized workforce management applications, and ½ of those have no plans to change.
50%
38%
57%
36%
36%
68%
15%
48%
63%
Software-as-a-services (SaaS) deployment optionsfor workforce management solutions
A single workforce management solution to meetlabor management needs across departments (for
example, stores and distribution centers)
A single workforce management suite (includingforecasting, budgeting, schedule creation and
optimization, labor standards, task management,and time and attendance)
Solution Delivery Options Rated 'Very Valuable'
Retail Winners Average Performers Laggards

20
Figure 16: Old And In The Way?
Source: RSR Research, December 2012
Winners have a very different view of the choices – 63% of over-performing retailers have a commercial package installed. This makes sense for several reasons: first, if the package is as delivered, the software vendor (not the retailer) supports the code; secondly, today’s available commercial solutions have a broad set of capabilities – and they generally work as advertised; finally the cost of new features and functions is spread across the install base – no one retailer has to pick up the whole cost.
RSR’s recommendation to retailers about technology generally is to implement packages wherever possible, especially for non-differentiating capabilities. Workforce management is a perfect case in point; retailers who don’t use workforce management capabilities are strategically impaired. And while it once was true that packages often couldn’t meet local and regional differences, different government regulations, and different union contracts, nowadays that’s not the case. Those retailers who insist of “rolling their own code” miss out on some of the real benefits of modern workforce management capabilities. While we don’t have a strong opinion about licensed or on-demand delivery options (that depends on retailers’ appetite for the risks associated with either choice), we’re unambiguous on the point of in-house development of workforce management applications: “just say no”.
8%
8%
8%
31%
23%
23%
16%
12%
8%
12%
8%
44%
4%
4%
7%
11%
22%
52%
Local deployment of a packaged suite, but wewant to move to centralized
Local deployment of a custom/homegrownapplication, but we want to move to a centralized
packaged suite
Local deployment of a custom/homegrownapplication, but we want to move to a locally
deployed packaged suite
Local deployment of a custom/homegrownapplication with no plans to change
Centralized, web-based deployment of acustom/homegrown application
Centralized, web-based deployment of a packagedsuite
Current State Of Workforce Management Solution(s)
Retail Winners Average Performers Laggards

21
BOOTstrap Recommendations
Change Management is About More than Just Technology More than a few technology implementations have been ruined by culture clashes. The role of the in-store workforce is changing, and retailers in this survey generally recognize that they need new technologies to support this change. We believe that these technologies will be accompanied by more specific roles and responsibilities that will vary depending on both the time of day and time of year. And so the steps to success follow:
• Create a team to spearhead the process and metrics changes to follow. Members of this team should include knowledgeable field personnel (both management and worker), IT staff and HR representatives.
• Document the current state (often called the “as is”). It may be tiresome, but it is likely to yield some fascinating results. We really don’t always know what people do.
• Document and review the planned process and metrics changes. This is often called to “to be”.
• Map the “to be” to the technology selected and insure there’s a match.
Expect to have more finely honed job descriptions when this process is complete, and take the opportunity to codify them. This will insure that labor scheduling is optimized to the capability constraints of employees.
Stop Rolling Your Own! Workforce Management isn’t a Differentiator We are somewhat stunned at the number of homegrown systems in use by our respondents. Surely there’s a better use of in-house IT payroll than updating legal and other scheduling requirements into a proprietary solution? We’re not naïve enough to tell cash-strapped laggards, “Of course you can find the money” but we are confident that SaaS and other providers can assist in finding a way to help defray upfront costs. On an ongoing basis, the revenue opportunities that can be generated by freed up IT payroll will make it well worth the change.
Measure What You Value; Value What You Measure Take a long hard look at your metrics for success. You may find that measuring more of the elements our respondents highlighted as “very important” will yield enough hard dollar savings to support additions to your existing workforce management technology portfolio.
Forecasting Isn’t Just for Supply Chain and Merchandising Anymore It has become clear in many of our other benchmarks that retailers have really come to appreciate the value of Demand Forecasting in helping optimize their operations. Specifically, we have seen Demand Forecasting become a lynchpin of Merchandise and Supply Chain planning. Yet when all is said and done, merchandise receipt and sales forecasts have direct implications to the in-store labor force. Both these forecasts should be direct inputs into labor scheduling.
Get Your Store Manager Mobile and Out of the Weeds We know that sometimes we can sound like a broken record when it comes to getting the store manager back onto the selling floor, but it remains both a truth, and a hallmark of Retail Winners. The store manager’s time is the most valuable of all, and his or her presence on the selling floor is critical to setting the right tone.

22
Freeing up the store manager from the mundane tasks of labor scheduling and juggling priorities can create a host of new opportunities:
• On-boarding new employees. This is more than just filling out required paperwork. It involves training and enculturation into the goals of the brand, and explicitly laying out work standards.
• Working with customers. The store manager likely knows more about the product and company than any other employee. Watching him or her interact with customers is an excellent learning tool, and having him or her to turn to on the selling floor in the event of a problem can allay a lot of stress.
• Managing exceptions. Until now, most store managers have faced the hard choice of keeping an eye on key metrics (think out-of-stocks and price overrides), or working on the selling floor. The value of mobile alerts delivered to smaller devices is it keeps the store manager educated and engaged at the same time
It is long past time for retailers to move forward with these initiatives. The employee has been viewed as an expense since the beginning of retail time. But an empowered customer demands much the same from the employees she engages with. Workforce Management may not be the tool that turns laggards into Winners, but it most definitely will eliminate one friction point that holds them back.
.

a
Appendix A: RSR’s Research Methodology
The “BOOT” methodology is designed to reveal and prioritize the following:
• Business Challenges – Retailers of all shapes and sizes face significant external challenges. These issues provide a business context for the subject being discussed and drive decision-making across the enterprise.
• Opportunities – Every challenge brings with it a set of opportunities, or ways to change and overcome that challenge. The ways retailers turn business challenges into opportunities often define the difference between Winners and “also-rans.” Within the BOOT, we can also identify opportunities missed – and describe leading edge models we believe drive success.
• Organizational Inhibitors – Even as enterprises find opportunities to overcome their external challenges, they may find internal organizational inhibitors that keep them from executing on their vision. Opportunities can be found to overcome these inhibitors as well. Winning Retailers understand their organizational inhibitors and find creative, effective ways to overcome them.
• Technology Enablers – If a company can overcome its organizational inhibitors it can use technology as an enabler to take advantage of the opportunities it identifies. Retail Winners are most adept at judiciously and effectively using these enablers, often far earlier than their peers.
A graphical depiction of the BOOT follows:

b
Appendix B: About Our Sponsors
Ceridian is a trusted business services company that provides transformative Human Capital Management (HCM) solutions that help organizations save time, minimize risk, improve productivity and enhance retail profitability. Our Dayforce HCM solution is a single SaaS application for end-to-end HCM and Workforce Management (WFM) that features self-service capabilities, embedded analytics, messaging, mobile access and integration with payroll cards. The flexible and modular solution includes:
• Workforce Management: Improve business productivity with our #1 ranked Dayforce workforce management solution by Nucleus Research.
• Human Resources and Benefits: Ensure workforce management processes connect to your corporate goals and objectives with an easy-to-use interface.
• Payroll: Choose from a variety of payroll solutions to ease the burden of payroll processing and tax filing.
• Employee Self-Service: Enhances communication and improves employee engagement through self-service schedules, timecards, availability, time away, and message center.
• Labor Analytics: View a complete, live, detailed picture of workforce performance throughout a company or division.
• Task Management: Integrates with workforce management and provides task performance consistency and real-time communication across the organization with closed loop feedback.
For more than 35 years, RedPrairie's best-of-breed supply chain, workforce, and all-channel retail solutions have put commerce in motion for the world's leading companies. Installed in over 60,000 customer sites across more than 50 countries, RedPrairie solutions adapt to help ensure visibility and collaboration between manufacturers, distributors, retailers, and consumers. RedPrairie is prepared to meet its customers' current and future demands with multiple delivery options, flexible architecture, and 24/7 technical and customer support. For a world in motion, RedPrairie is commerce in motion.
To learn more about how RedPrairie solutions can optimize your inventory, improve employee productivity, or increase sales, visit RedPrairie.com or email [email protected].

c
Appendix C: About RSR Research
Retail Systems Research (“RSR”) is the only research company run by retailers for the retail industry. RSR provides insight into business and technology challenges facing the extended retail industry, providing thought leadership and advice on navigating these challenges for specific companies and the industry at large. We do this by:
• Identifying information that helps retailers and their trading partners to build more efficient and profitable businesses;
• Identifying industry issues that solutions providers must address to be relevant in the extended retail industry;
• Providing insight and analysis about a broad spectrum of issues and trends in the Extended Retail Industry.
Copyright© 2012 by Retail Systems Research LLC • All rights reserved.
No part of the contents of this document may be reproduced or transmitted in any form or by any means without the permission of the publisher. Contact [email protected] for more information.