what’s happening to productivity growth? - brookings - …€¦ · · 2017-01-19what’s...
TRANSCRIPT

What’s Happening to Productivity Growth?
Key Macro Trends and Patterns
Karim Foda
January 13, 2017

Motivation
• GDP growth is slowing down around the world, driven in large part by weak productivity growth.
• Labor force participation rates for prime-working-age men have been falling.
• Many advanced and some emerging economies have aging populations.
Productivity is key to future growth
0
1
2
3
4
5
6
Advanced Emerging and Developing
per
cen
t
GDP per capita growth (annual average)
1990-1999 2000-2007 2008-2015

• There is a widespread slowdown in labor productivity growth across both advanced and emerging market economies.
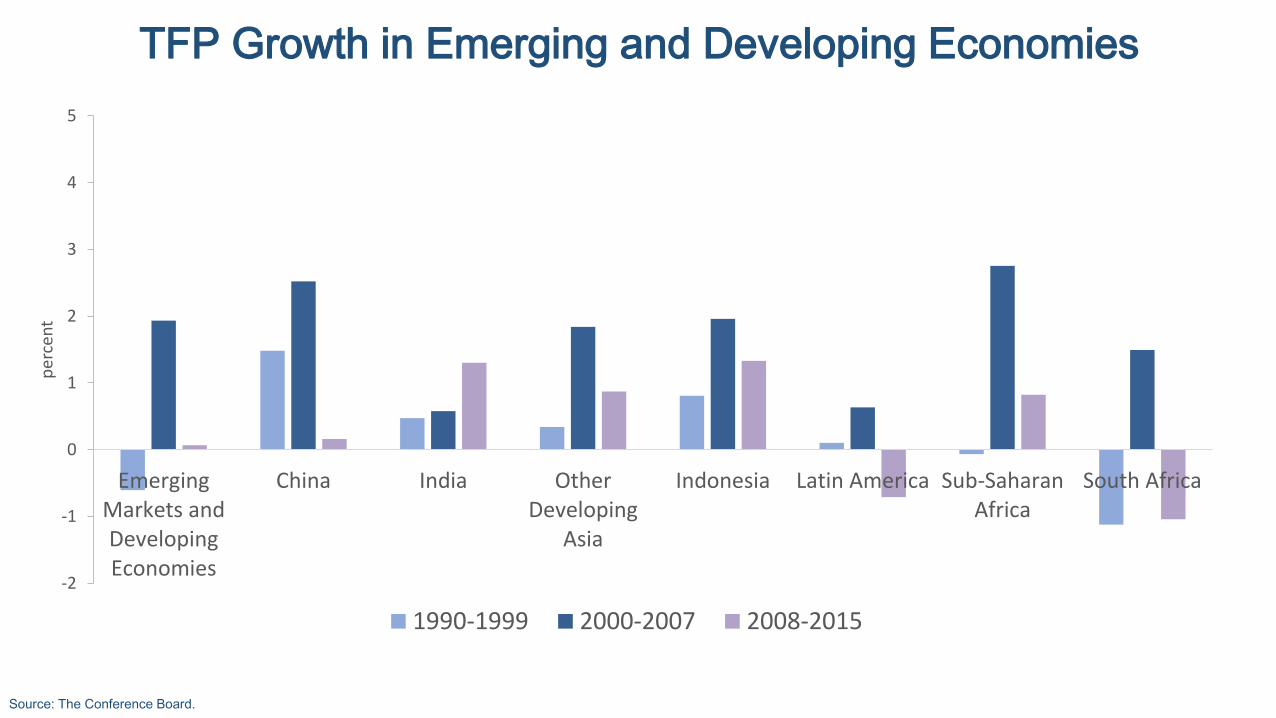
• It is primarily driven by slowing TFP growth, but capital deepening has played a more visible role in recent years.
• The slowdown is broad-based, spanning manufacturing and service industries.
• The slowdown predates the crisis in advanced economies, beginning in 2004 in the U.S. after the ICT boom and earlier in Europe and Japan.
The Bottom Line
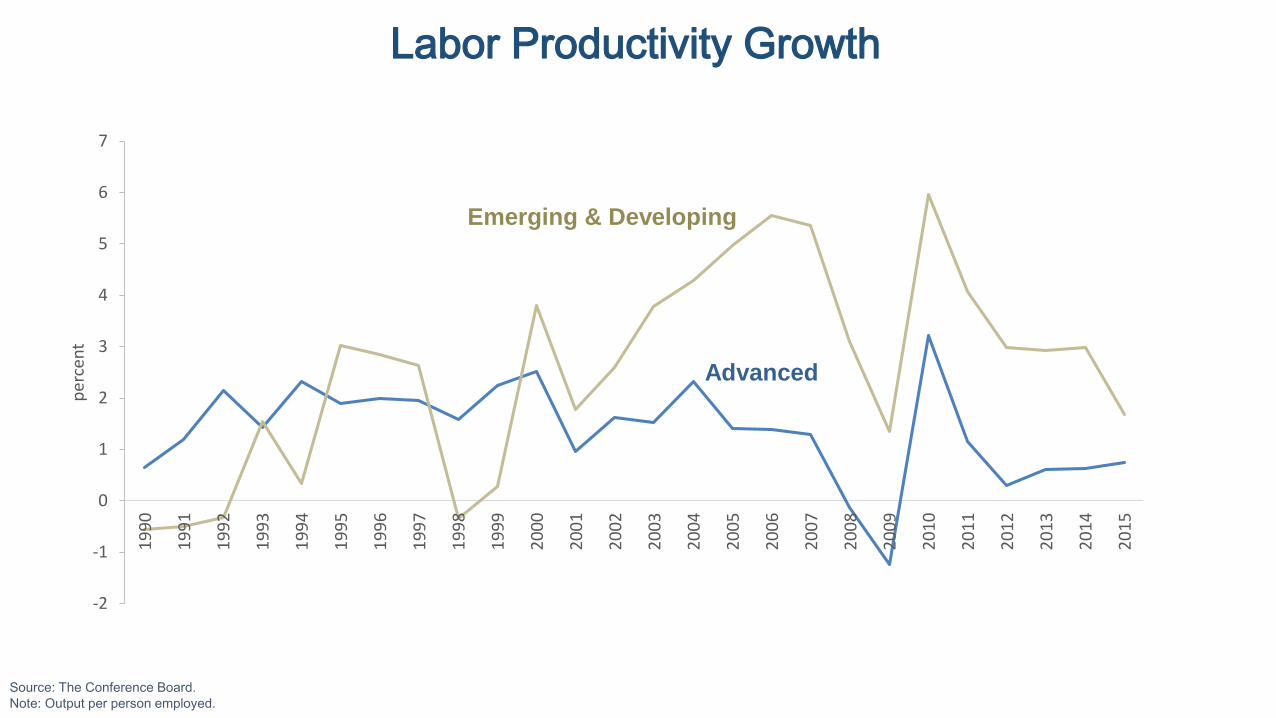
Source: The Conference Board.
Note: Output per person employed.
-2
-1
0
1
2
3
4
5
6
71
99
0
19
91
19
92
19
93
19
94
19
95
19
96
19
97
19
98
19
99
20
00
20
01
20
02
20
03
20
04
20
05
20
06
20
07
20
08
20
09
20
10
20
11
20
12
20
13
20
14
20
15
per
cen
t
Emerging & Developing
Advanced
Labor Productivity Growth

Data source: OECD Productivity Statistics.
Note: Output per hour worked.
-1
0
1
2
3
4
51
971
19
72
19
73
19
74
19
75
19
76
19
77
19
78
19
79
19
80
19
81
19
82
19
83
19
84
19
85
19
86
19
87
19
88
19
89
19
90
19
91
19
92
19
93
19
94
19
95
19
96
19
97
19
98
19
99
20
00
20
01
20
02
20
03
20
04
20
05
20
06
20
07
20
08
20
09
20
10
20
11
20
12
20
13
20
14
20
15
per
cen
t
Canada France Germany Italy Japan UK US
US
Trend Labor Productivity Growth in Advanced Economies
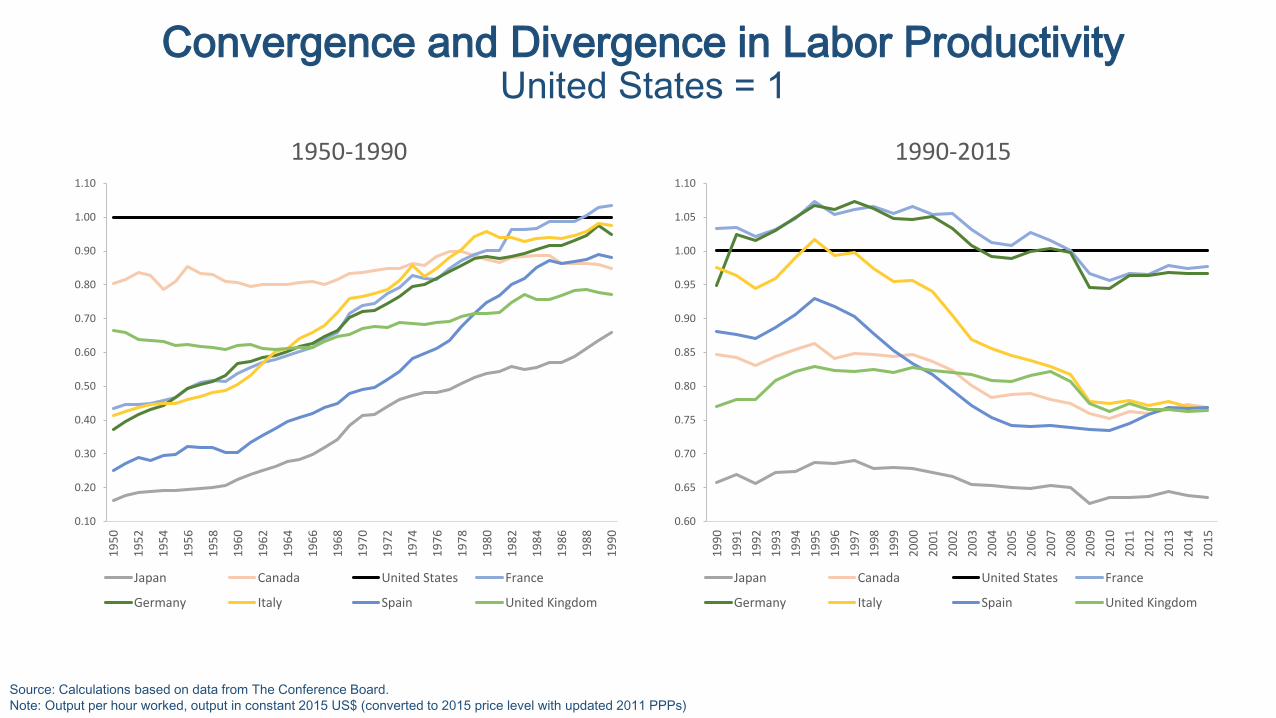
Convergence and Divergence in Labor ProductivityUnited States = 1
Source: Calculations based on data from The Conference Board.
Note: Output per hour worked, output in constant 2015 US$ (converted to 2015 price level with updated 2011 PPPs)
0.10
0.20
0.30
0.40
0.50
0.60
0.70
0.80
0.90
1.00
1.10
19
50
19
52
19
54
19
56
19
58
19
60
19
62
19
64
19
66
19
68
19
70
19
72
19
74
19
76
19
78
19
80
19
82
19
84
19
86
19
88
19
90
1950-1990
Japan Canada United States France
Germany Italy Spain United Kingdom
0.60
0.65
0.70
0.75
0.80
0.85
0.90
0.95
1.00
1.05
1.10
19
90
19
91
19
92
19
93
19
94
19
95
19
96
19
97
19
98
19
99
20
00
20
01
20
02
20
03
20
04
20
05
20
06
20
07
20
08
20
09
20
10
20
11
20
12
20
13
20
14
20
15
1990-2015
Japan Canada United States France
Germany Italy Spain United Kingdom

Source: Calculations based on data from The Conference Board.
Note: Output per hour worked. Groups aggregated using GDP-PPP weights. Other Advanced includes Australia, Canada, Hong Kong, Israel, New Zealand, Singapore, South Korea and Taiwan.
0.0
0.5
1.0
1.5
2.0
2.5
3.0
3.5
Advanced United States Europe Japan Other Advanced
per
cen
t
1990-1995 1996-2004 2005-2015
Labor Productivity Growth in Advanced Economies

0.0
0.5
1.0
1.5
2.0
2.5
3.0
3.5
UK Euro Area France Germany Italy Spain Sweden Australia Canada
per
cen
t
1990-1995 1996-2004 2005-2015
Labor Productivity Growth in Advanced Economies
Source: Calculations based on data from The Conference Board.
Note: Output per hour worked. Groups aggregated using GDP-PPP weights.

Decomposing Labor Productivity Growth: TFP and Capital DeepeningUnited States
Data source: OECD Productivity Database.
Note: Decomposition of growth in output per hour worked.
0.7
1.6
0.6
0.4
0.6
0.2
0.3
0.3
0.3
0.0
0.5
1.0
1.5
2.0
2.5
3.0
1990-1995 1996-2004 2005-2015
United States
pe
rce
nt
TFP
ICT capital deepening
Non-ICT capital deepening

Decomposing Labor Productivity Growth: TFP and Capital DeepeningUnited States
Data source: OECD Productivity Database.
Note: Decomposition of growth in output per hour worked.
0.7
1.6
0.6 0.7
0.3
0.4
0.6
0.20.3
0.1
0.3
0.3
0.3
0.4
-0.1
-0.5
0.0
0.5
1.0
1.5
2.0
2.5
3.0
1990-1995 1996-2004 2005-2015 2005-2011 2012-2015
United States
pe
rce
nt
TFP
ICT capital deepening
Non-ICT capitaldeepening

-0.5
0.0
0.5
1.0
1.5
2.0
2.5
3.0
19
90
-19
95
19
96
-20
04
20
05
-20
15
19
90
-19
95
19
96
-20
04
20
05
-20
15
19
90
-19
95
19
96
-20
04
20
05
-20
15
19
90
-19
95
19
96
-20
04
20
05
-20
15
19
90
-19
95
19
96
-20
04
20
05
-20
15
19
90
-19
95
19
96
-20
04
20
05
-20
15
Japan United Kingdom France Germany Italy Spain
TFP
ICT capital deepening
Non-ICT capital deepening
Decomposing Labor Productivity Growth: TFP and Capital DeepeningOther Advanced Economies
Data source: OECD Productivity Database.
Note: Decomposition of growth in output per hour worked.

A Broad-Based Rise and Fall in US TFP GrowthPercentage point change in average industry TFP growth
Source: Calculations based on data from Bureau of Labor Statistics Multifactor Productivity database.
Note: Industries ranked by change in average value-added TFP growth between both periods, based on Byrne, Fernald and Reinsdorf (2016). Striped bars denote manufacturing industries.
Industries with largest positive acceleration in recent period (right panel) are (i) funds and trusts, (ii) water transport and (iii) oil and gas extraction. Industries with largest negative deceleration in the same period are (i) apparel and leather
and applied products, (ii) petroleum and coal products and (iii) computer and electronic products.
-15
-10
-5
0
5
10
15
0 10 20 30 40 50 60Industry
-20
-15
-10
-5
0
5
10
15
20
25
0 10 20 30 40 50 60
Industry
Broad Rise1988-1995 to 1996-2004
Broad Fall1996-2004 to 2005-2014

Source: Calculations based on data from Bureau of Labor Statistics Multifactor Productivity database.
Note: Recreated from Baily and Montalbano (2016), but with changes in average value-added TFP growth between both periods, based on Byrne, Fernald and Reinsdorf (2016).
Manufacturing
Agriculture, Forestry and Fishery
Mining
Utilities
Construction
Wholesale Trade
Retail Trade Transportation
Information
Finance, Insurance and Real Estate
Services
-6
-4
-2
0
2
4
6
8
-8 -6 -4 -2 0 2 4 6
Faster growth1996-2004
Slower growth2005-2015
Rising and Falling TogetherAverage US industry TFP growth

Industry Contributions to the Rise and Fall in US TFP Growth
Source: Calculations based on data from Bureau of Labor Statistics Multifactor Productivity database.
Note: Domar weights used to aggregate industry contributions. Recreated from Baily and Montalbano (2016).
The Rise The Fall
1.08
-0.17
-0.08
-0.05
0.02
0.07
0.09
0.10
0.11
0.15
0.40
0.43
-0.4 -0.2 0.0 0.2 0.4 0.6 0.8 1.0 1.2
Aggregate TFP Growth
Utilities
Construction
Mining
Transportation
Retail Trade
Information
Agriculture
FIRE
Wholesale Trade
Manufacturing
Services
Contributions to TFP Growth 1996-2004 minus Contributions 1987-1995
-1.36
0.18
0.13
0.04
0.04
-0.07
-0.08
-0.09
-0.15
-0.30
-0.31
-0.74
-1.6 -1.4 -1.2 -1.0 -0.8 -0.6 -0.4 -0.2 0.0 0.2 0.4
Aggregate TFP Growth
FIRE
Mining
Utilities
Information
Transportation
Construction
Agriculture
Services
Wholesale Trade
Retail Trade
Manufacturing
Contributions to TFP Growth 2005-2014 minus Contributions 1996-2004

Holding Industry Weights FixedUnited States average TFP growth
Source: Byrne, Fernald and Reinsdorf (2016).
Note: Orange bars show actual average growth in business sector TFP. Blue bars show counterfactual where industry weights (shares in aggregate value added) are held constant at 1987 values.
0.0
0.5
1.0
1.5
2.0
1987-1995 1995-2004 2004-2013
per
cen
t
Counter-factual Actual
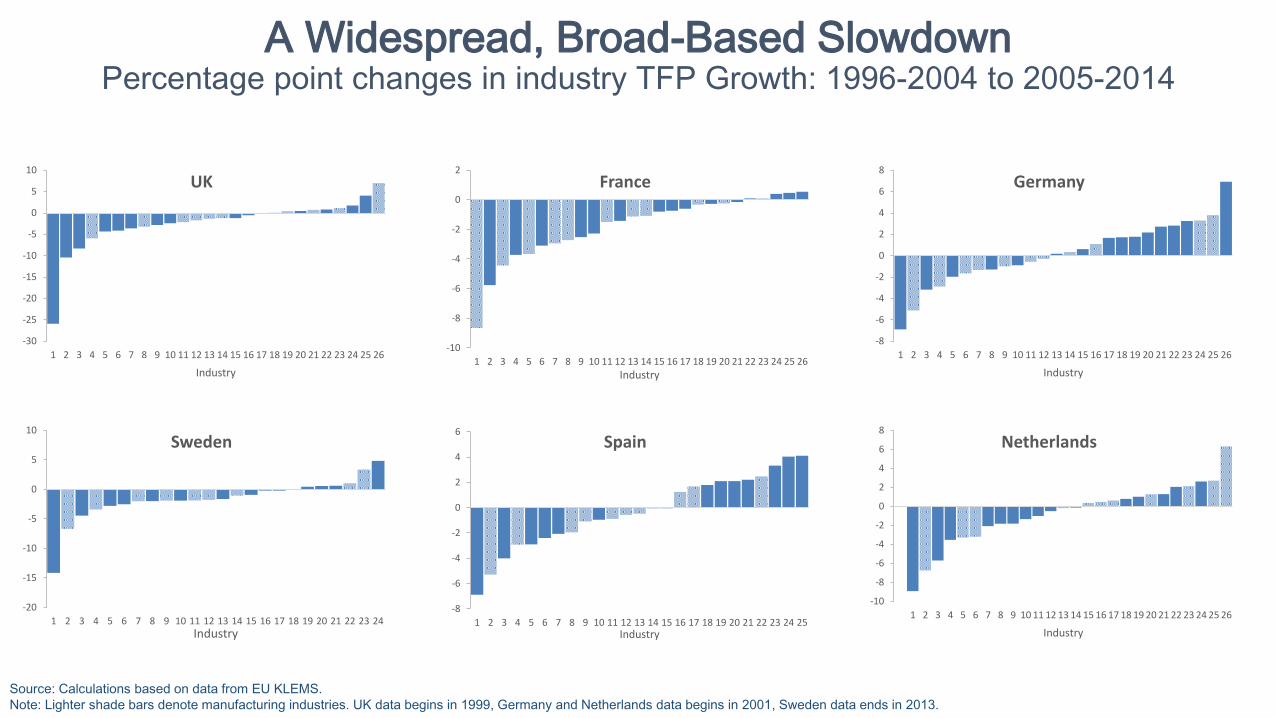
A Widespread, Broad-Based SlowdownPercentage point changes in industry TFP Growth: 1996-2004 to 2005-2014
Source: Calculations based on data from EU KLEMS.
Note: Lighter shade bars denote manufacturing industries. UK data begins in 1999, Germany and Netherlands data begins in 2001, Sweden data ends in 2013.
-10
-8
-6
-4
-2
0
2
1 2 3 4 5 6 7 8 9 10 11 12 13 14 15 16 17 18 19 20 21 22 23 24 25 26
Industry
France
-30
-25
-20
-15
-10
-5
0
5
10
1 2 3 4 5 6 7 8 9 10 11 12 13 14 15 16 17 18 19 20 21 22 23 24 25 26
Industry
UK
-8
-6
-4
-2
0
2
4
6
8
1 2 3 4 5 6 7 8 9 10 11 12 13 14 15 16 17 18 19 20 21 22 23 24 25 26
Industry
Germany
-8
-6
-4
-2
0
2
4
6
1 2 3 4 5 6 7 8 9 10 11 12 13 14 15 16 17 18 19 20 21 22 23 24 25Industry
Spain
-10
-8
-6
-4
-2
0
2
4
6
8
1 2 3 4 5 6 7 8 9 10 11 12 13 14 15 16 17 18 19 20 21 22 23 24 25 26
Industry
Netherlands
-20
-15
-10
-5
0
5
10
1 2 3 4 5 6 7 8 9 10 11 12 13 14 15 16 17 18 19 20 21 22 23 24Industry
Sweden

A Word on MeasurementAdjustments to growth in US output per hour
Source: Byrne, Fernald and Reinsdorf (2016).
Note: Other comprises Internet, free digital services, globalization and fracking.
-0.5
0.0
0.5
1.0
1.5
2.0
2.5
3.0
3.5
4.0
1978-1995 1995-2004 2004-2014
per
cen
tage
po
ints
Published
data
computers/communications
software, specialized equipment
intangibles
other

Source: The Conference Board.
Note: Output per person employed.
-2
-1
0
1
2
3
4
5
6
7
8
9
EmergingMarkets andDevelopingEconomies
China India OtherDeveloping
Asia
Indonesia Latin America Sub-SaharanAfrica
South Africa
per
cen
t
1990-1999 2000-2007 2008-2015
Labor Productivity Growth in Emerging and Developing Economies
Source: The Conference Board.
-2
-1
0
1
2
3
4
5
EmergingMarkets andDevelopingEconomies
China India OtherDeveloping
Asia
Indonesia Latin America Sub-SaharanAfrica
South Africa
per
cen
t
1990-1999 2000-2007 2008-2015
TFP Growth in Emerging and Developing Economies

Source: The Conference Board.
-3
-2
-1
0
1
2
31
99
0
19
91
19
92
19
93
19
94
19
95
19
96
19
97
19
98
19
99
20
00
20
01
20
02
20
03
20
04
20
05
20
06
20
07
20
08
20
09
20
10
20
11
20
12
20
13
20
14
20
15
per
cen
t
Emerging & Developing
Advanced
Total Factor Productivity Growth

Weak Investment in Advanced EconomiesSlowing Investment in Emerging and Developing
Sources: OECD Economic Outlook June 2015 for Real Gross Investment figure; IMF World Economic Outlook April 2015 for Investment-to-Capital ratios via Laeven and Valencia (2014).
Notes: For gross investment, “emerging” includes Brazil, China, India, Indonesia, Mexico, Russia, South Africa and Turkey. For investment-to-capital ratio, they include Brazil, China, India, Mexico,
Russia and Turkey.
6
8
10
12
14
16
18
20
01
20
02
20
03
20
04
20
05
20
06
20
07
20
08
20
09
20
10
20
11
20
12
20
13
20
14
per
cen
t
Emerging economies
Emerging economiesexcluding China
Real Gross Investment2007 Q4 = 100
Investment-to-Capital Ratio
40
60
80
100
120
140
160
180
20
00
20
01
20
02
20
03
20
04
20
05
20
06
20
07
20
08
20
09
20
10
20
11
20
12
20
13
20
14
20
07
Q4
= 1
00
OECD
Emerging economies
Emerging economiesexcluding China

Potential Output Growth in Advanced Economies(OECD)
Source: OECD Economic Outlook, June 2016.
Notes: Potential employment rate refers to potential employment as a share of the working-age population. Active population rate refers to the share of the population of working age in the total population.
-0.5
0.0
0.5
1.0
1.5
2.0
2.5
1998 1999 2000 2001 2002 2003 2004 2005 2006 2007 2008 2009 2010 2011 2012 2013 2014 2015
per
cen
t
Capital per worker
TFP
Potential employment rate
Active population rate
Potential per capita growth

• There is a widespread slowdown in labor productivity growth across both advanced and emerging market economies.
• It is primarily driven by slowing TFP growth, but capital deepening has played a more visible role in recent years.
• The slowdown is broad-based, spanning manufacturing and service industries.
• The slowdown predates the crisis in advanced economies, beginning in 2004 in the U.S. after the ICT boom and earlier in Europe and Japan.
The Bottom Line

• Slowdown in innovation or diffusion? Dispersion in firm-level TFP growth suggests that weak diffusion has played a role (OECD 2015).
• Declining business dynamism and increased market concentration. Impacts on productivity?
• Weak investment despite lower price of investment (investment paradox?).
• Skill-biased technological change, skills mismatches and constraints.
• Barriers to innovation, regulatory distortions, misallocation of inputs.
Possible Explanations to Explore