what's next: measurement in the design process
TRANSCRIPT

Powered by
MEASUREMENT IN THE DESIGN PROCESS

Hello!
Amanda Gagliardi VP, Experience Design
at Effective
Rob BlackieDigital Strategy
What’s the weather like in your city?
Tell us where you’re dialing in from!
Want this deck?
It will be available for download shortly after the webinar on: slideshare.net/socialogilvy
Ogilvy staff: It’s also on The Market!themarket.ogilvy.com
Are you on the go? You can join our webinars on mobile, too!Download the GoToWebinar app from the App Store or Google Play

Measurement in the Design Process

What to Expect
1 MEASUREMENT BASICS How and why we use measurement in the design of new materials, tools and products.
2 HELP GETTING TO CONSENSUS How measurement can make decision making easier.
3 PRACTICAL WAYS TO USE MEASUREMENT We’ll provide tips and tools that anyone can utilize to measure their initiatives.

At Effective, we use data to
inform decision making + measure
the impact of solutions

Why measure?
1 DEFINE SUCCESS Simplify complexity and articulate a clear definition of success.
2 INFORM DESIGN Ensure decisions are compelled by data vs. intuition.
3 ALIGN STAKEHOLDERS Increase confidence in and efficiency of stakeholder decision making.
4 MEASURE ROI Quantify impact of design and product investments on desired business outcomes.
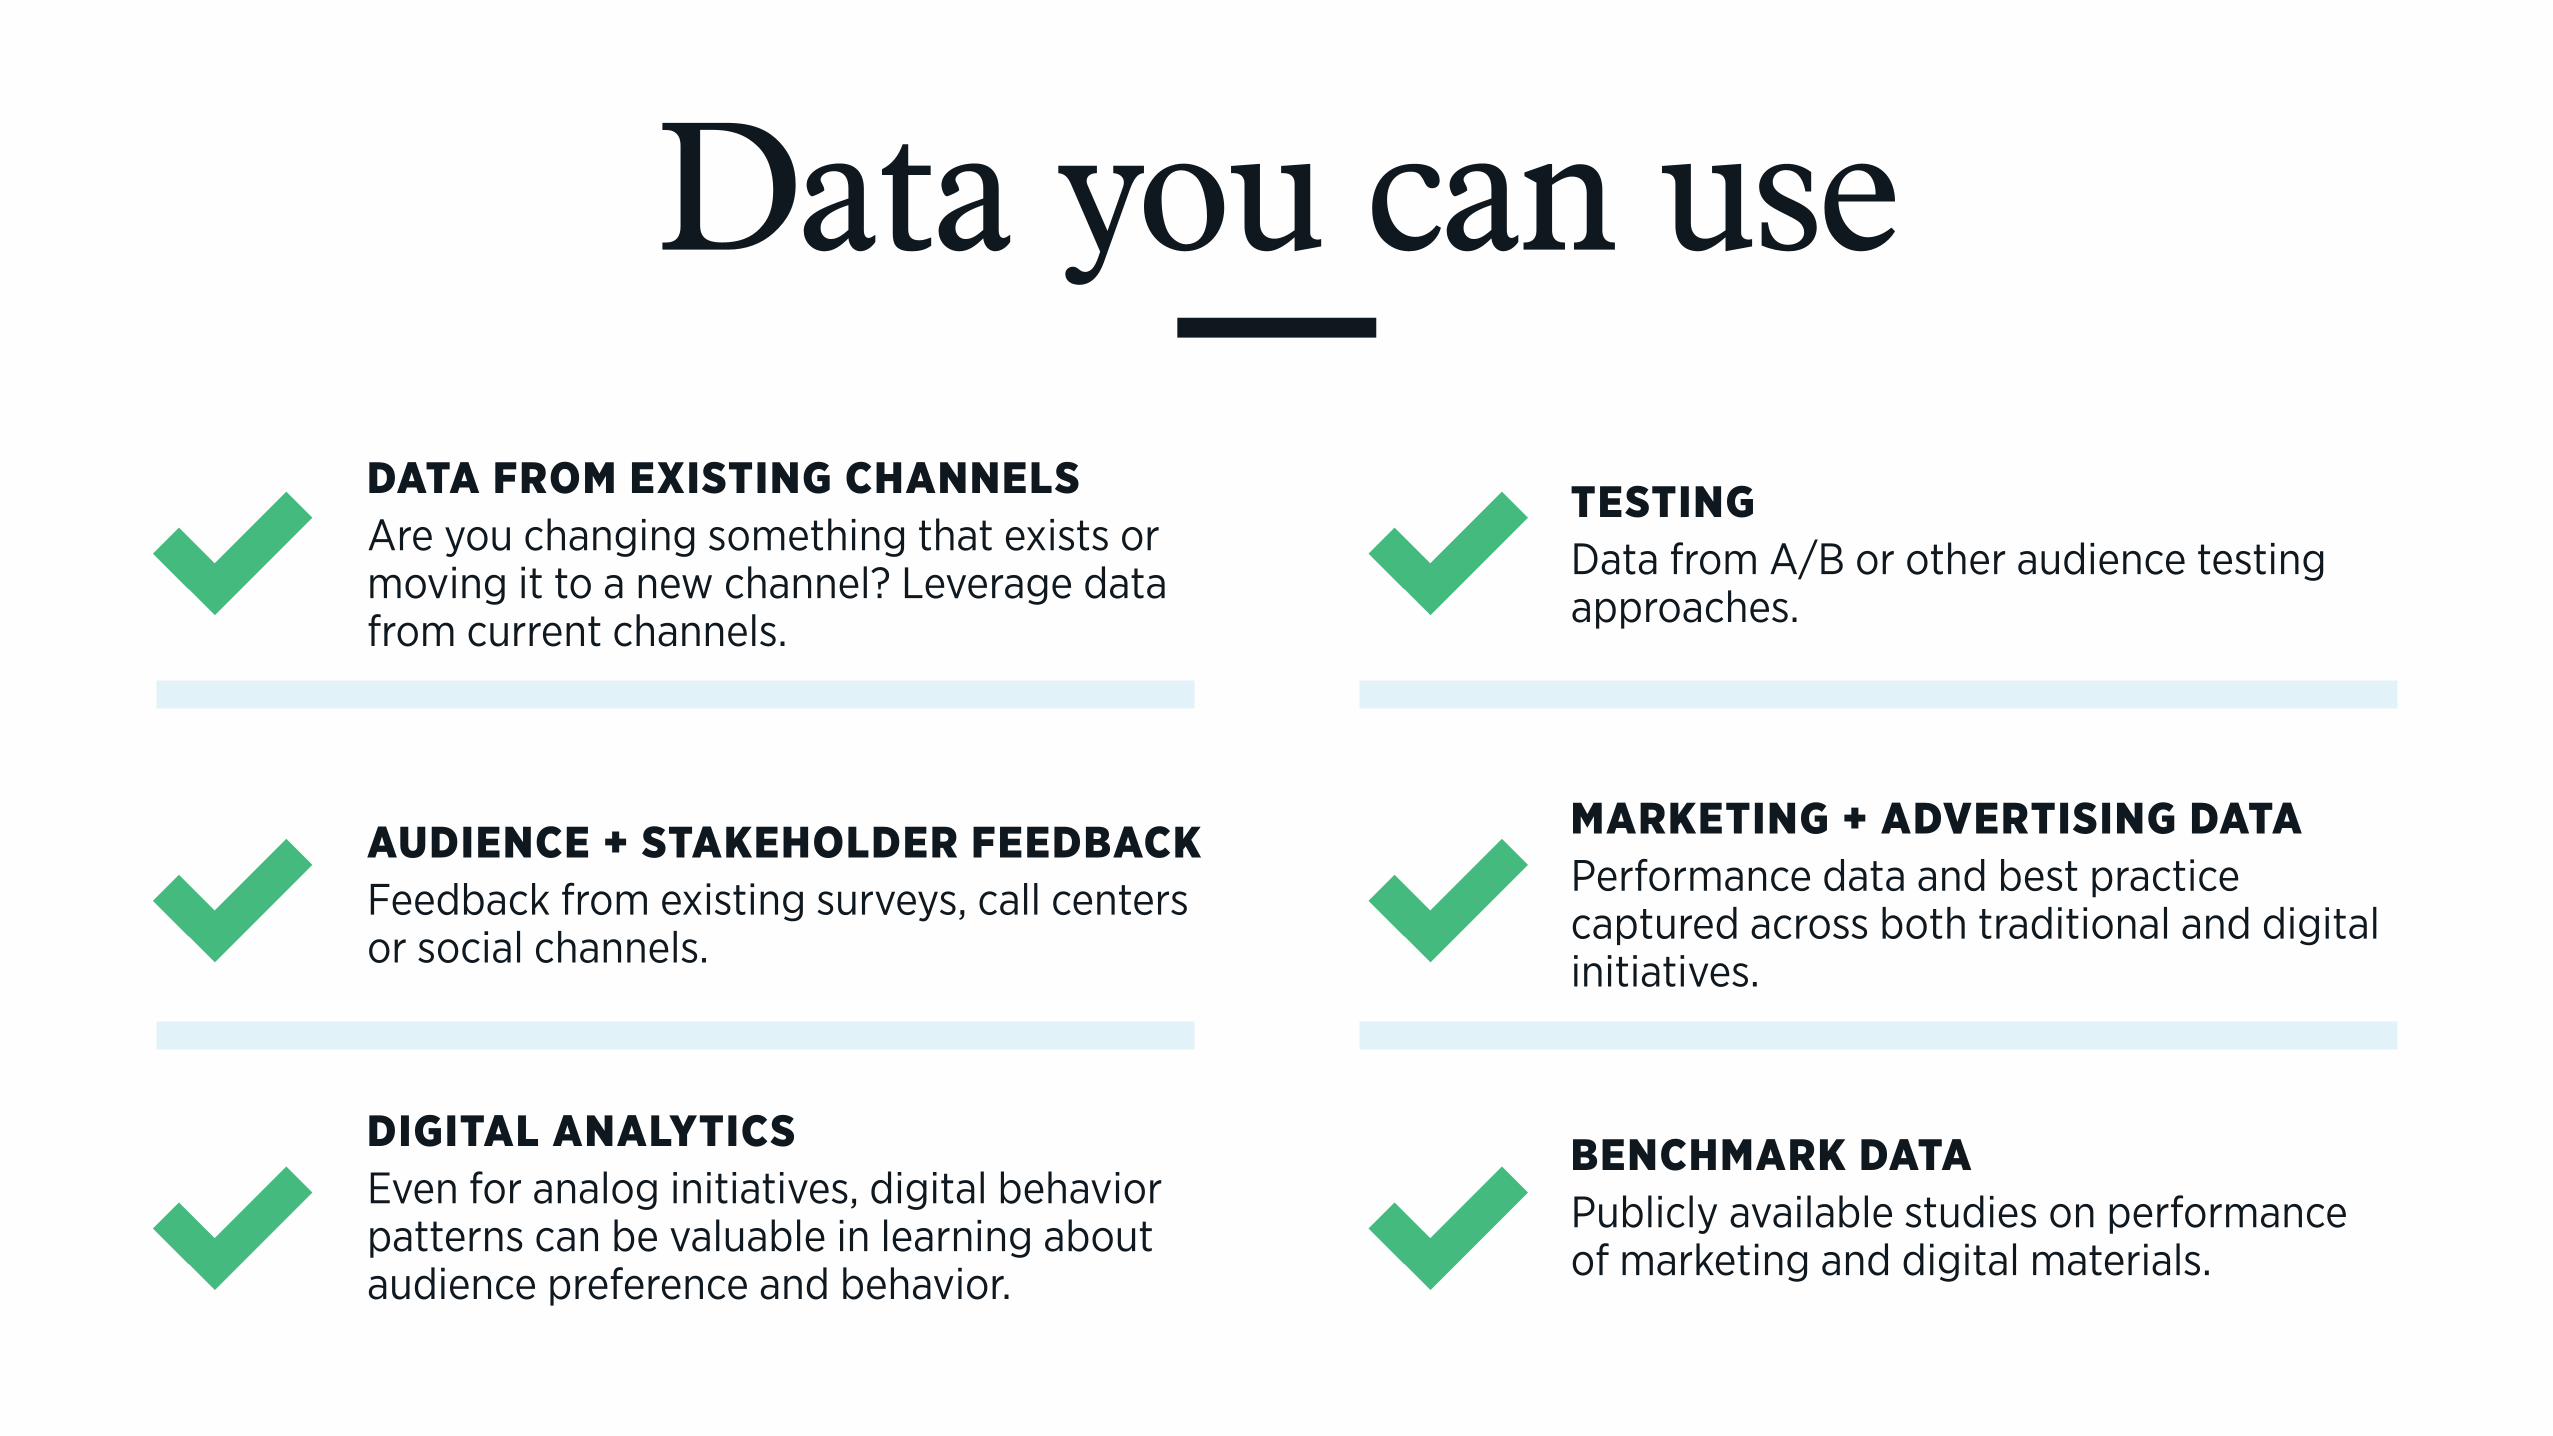
Data you can useDATA FROM EXISTING CHANNELS Are you changing something that exists or moving it to a new channel? Leverage data from current channels.
TESTING Data from A/B or other audience testing approaches.
AUDIENCE + STAKEHOLDER FEEDBACK Feedback from existing surveys, call centers or social channels.
MARKETING + ADVERTISING DATA Performance data and best practice captured across both traditional and digital initiatives.
DIGITAL ANALYTICS Even for analog initiatives, digital behavior patterns can be valuable in learning about audience preference and behavior.
BENCHMARK DATA Publicly available studies on performance of marketing and digital materials.

Make sure your initiative has clear business objectives.
Translate those into measurable design goals and key
performance indicators(KPIs).
No data? Here’s how to start
Form clear objectives
Tools like Google Analytics are easy to implement and free.
Codes can easily be added to print materials. Capture and store
all performance metrics!
Measure your outputs
When you can, produce multiple versions with slight differences
and test against your KPIs to determine what performs best.
Create multiple versions
1 2 3

Understanding of the target audience, business goals, and constraints.
Discovery
Creating concepts and design directions.
Definition
Testing and revising selected direction.
Iteration
Putting the final design into market.
Launch
Design Process

Understanding the target audience,
business goals + constraints.
DISCOVERY

Sound Familiar?
AUDIENCE BEHAVIORS ARE DISTRUSTED Teams often argue about the validity/frequency of audience pain points or problem statements.
INDIVIDUAL PRIORITIES TAKE CENTER STAGE Priorities of stakeholders with the loudest voices or most pull take priority over audience needs or business goals.
WHY ARE WE DOING THIS? Lack of clarity around why the project or initiative is happening or what problem it’s trying to solve.


Later that day Two weeks later One month later 3 hours laterThe next day
“I am so frustrated that I am left to pay this large amount of money with no help from my insurance
provider. I feel like they don’t care about me. I don’t know if I have the
money to pay this bill!”
“I don’t trust my current health insurance provider, I am excited
to enroll with a different provider. I hope they treat me better.”
TOUCHPOINTS
ACTIONS
PAIN POINTS
QUANT DATA
EMOTIONS
PERSONA
1 3 54
James, 32
Goal Reduce the number of calls to customer service during the online find care journey
30%45% Goal
Likelihood to recommend
insuranceprovider
*Based on the number of customers that have the ability to find care onlineRe-enroll rate
45%65% Goal
James injures his wrist skiing. He is not sure if he has broken any bones and needs to see a specialist. One of his friends refers him to Dr. Spencer.
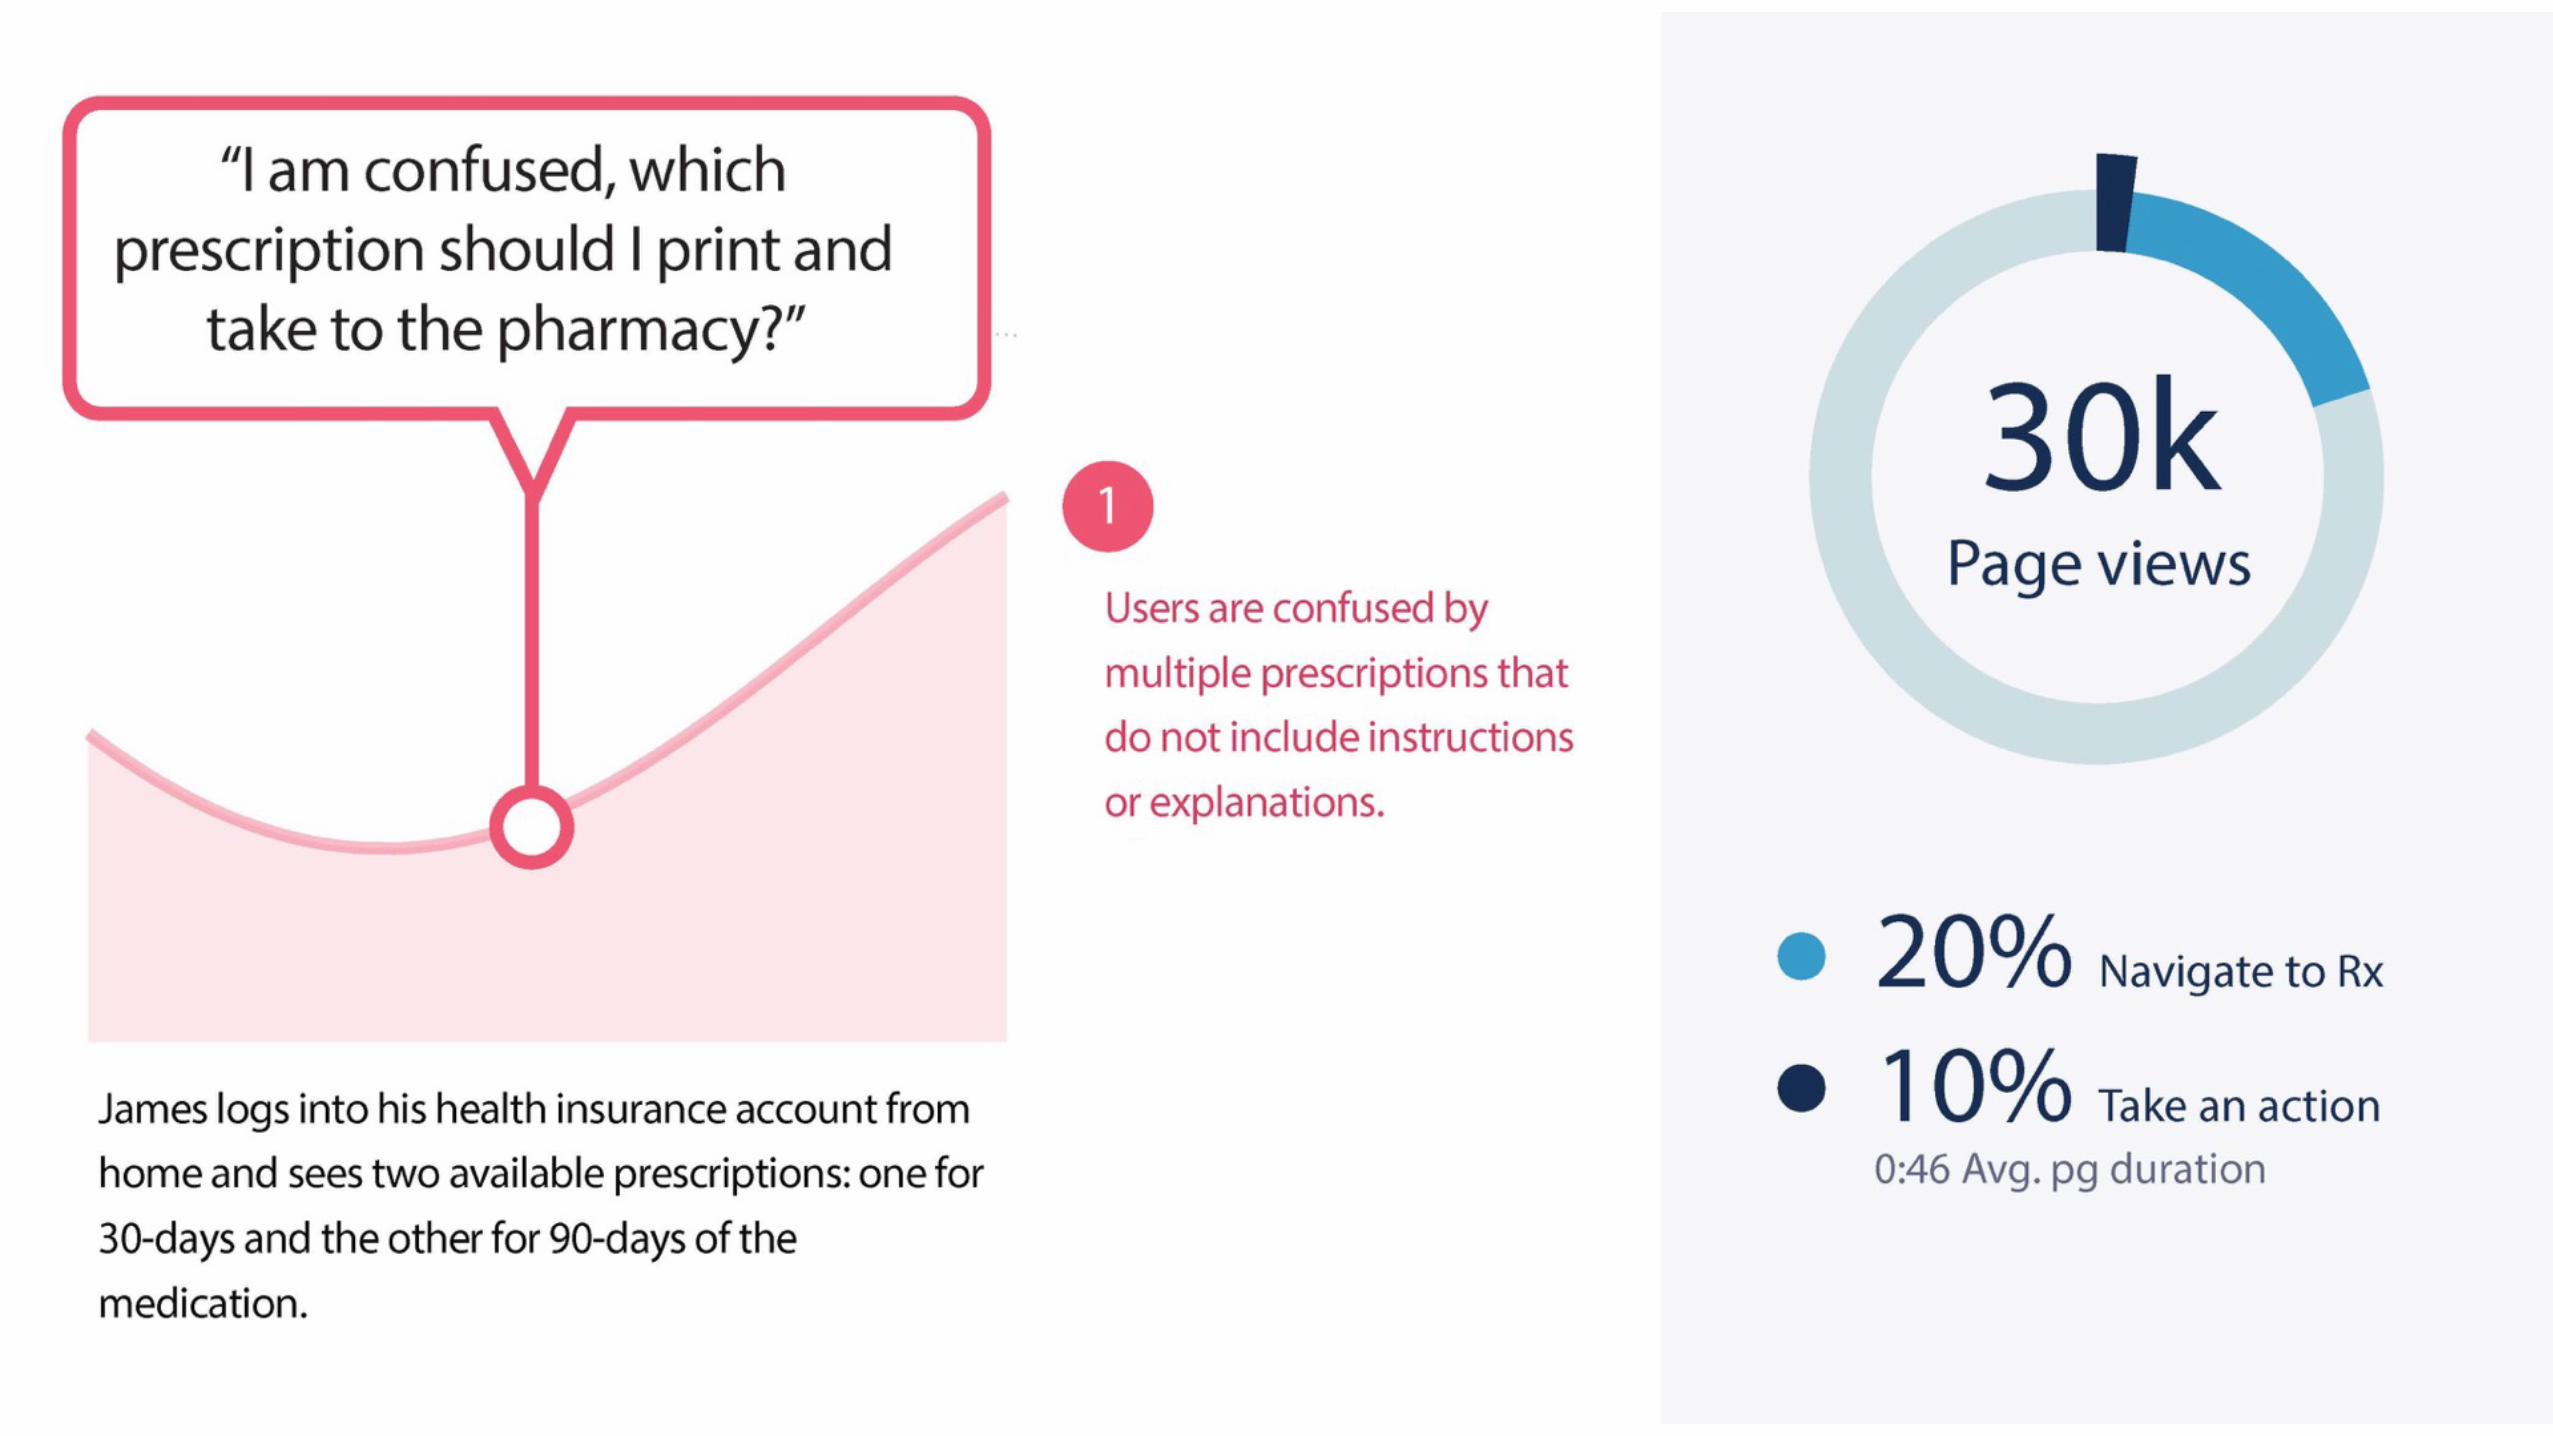
James logs into his health insurance account to check if Dr. Spencer is “on his insurance” and to see how much an office visit will cost. He is confused because he sees that Dr. Spencer is “in-network,” but an office visit will still cost him around $300.
Members are confused by insurance jargon and terminology.
2 It is difficult for members to find clear information on what a deductible is and how it affects their "out-of-pocket" costs.
Jame is frustrated with how long he waits for his appointment.
If members do not regularly check their email, they may easily miss important communication and documents.
Members are not notified or alerted of the increased costs when they are selecting care from an "out-of-network" provider.
6 There is no forgiveness or amnesty for members who make unintentional mistakes when finding and selecting care.
James calls his insurance provider’s customer service center and speaks with a representative who explains to him that under his current insurance plan, he has to meet ther $5000 deductible before his costs are covered.
James attends his appointment with Dr. Spencer, who writes an order for James to have his wrist x-rayed. Dr. Spencer provides a list of imaging facilities to James.
James has his wrist x-rayed at one of the facilities Dr. Spencer recommends to him.
James visits Dr. Spencer's office, where he hears that, his wrist is only sprained, not broken. James’ wrist is stabilized with a brace.
James' insurance provider sends him an email that includes the Explanation of Benefits of his wrist x-ray. It is sent to an email he rarely checks and James never sees or opens it.
James receives a bill in the mail from the imaging facility for $1500 for his wrist x-ray. He is angry and confused as to why he is being charged this much if he has health insurance.
He calls the insurance provider’s customer service center and speaks with a representative who tells him that the facility that conducted his x-rays was “out-of-network,” which is why he is responsible for paying most of the costs.
During the next year's open enrollment period, James intentionally selects a competitor's plan instead of his current provider.
+
–
30kPage views
59CSATindustry avg.
0:46 Avg. pg duration
20% Navigate to "Find Care"
10% Take an action
$78,300Kcost/mo
10K calls/mo
7:50mavg call time
$7.83avg call cost
19mavg wait in the US
Average satisfaction of health plan customers.
59 CSAT
89 Goal
$20,660K cost/mo
2Kcalls/mo
10:20mavg call time
$10.33avg call cost
The next day Six months laterA few days later
8%Open rate
55mavg wait time
55% Re-enrollment rate
45%Drop off rate
“Ouch! My wrist really hurts, I am bummed I won’t be able to ski
anymore this season.”
“ I am frustrated that I have to pay so much money, for an office visit”
“Why am I being charged so much money? I am shocked, frustrated
and confused.”
“At least my wrist isn’t broken. I am relieved to know it will heal in
a few weeks.”
45CSAT-15 below avg
30% bounce rate
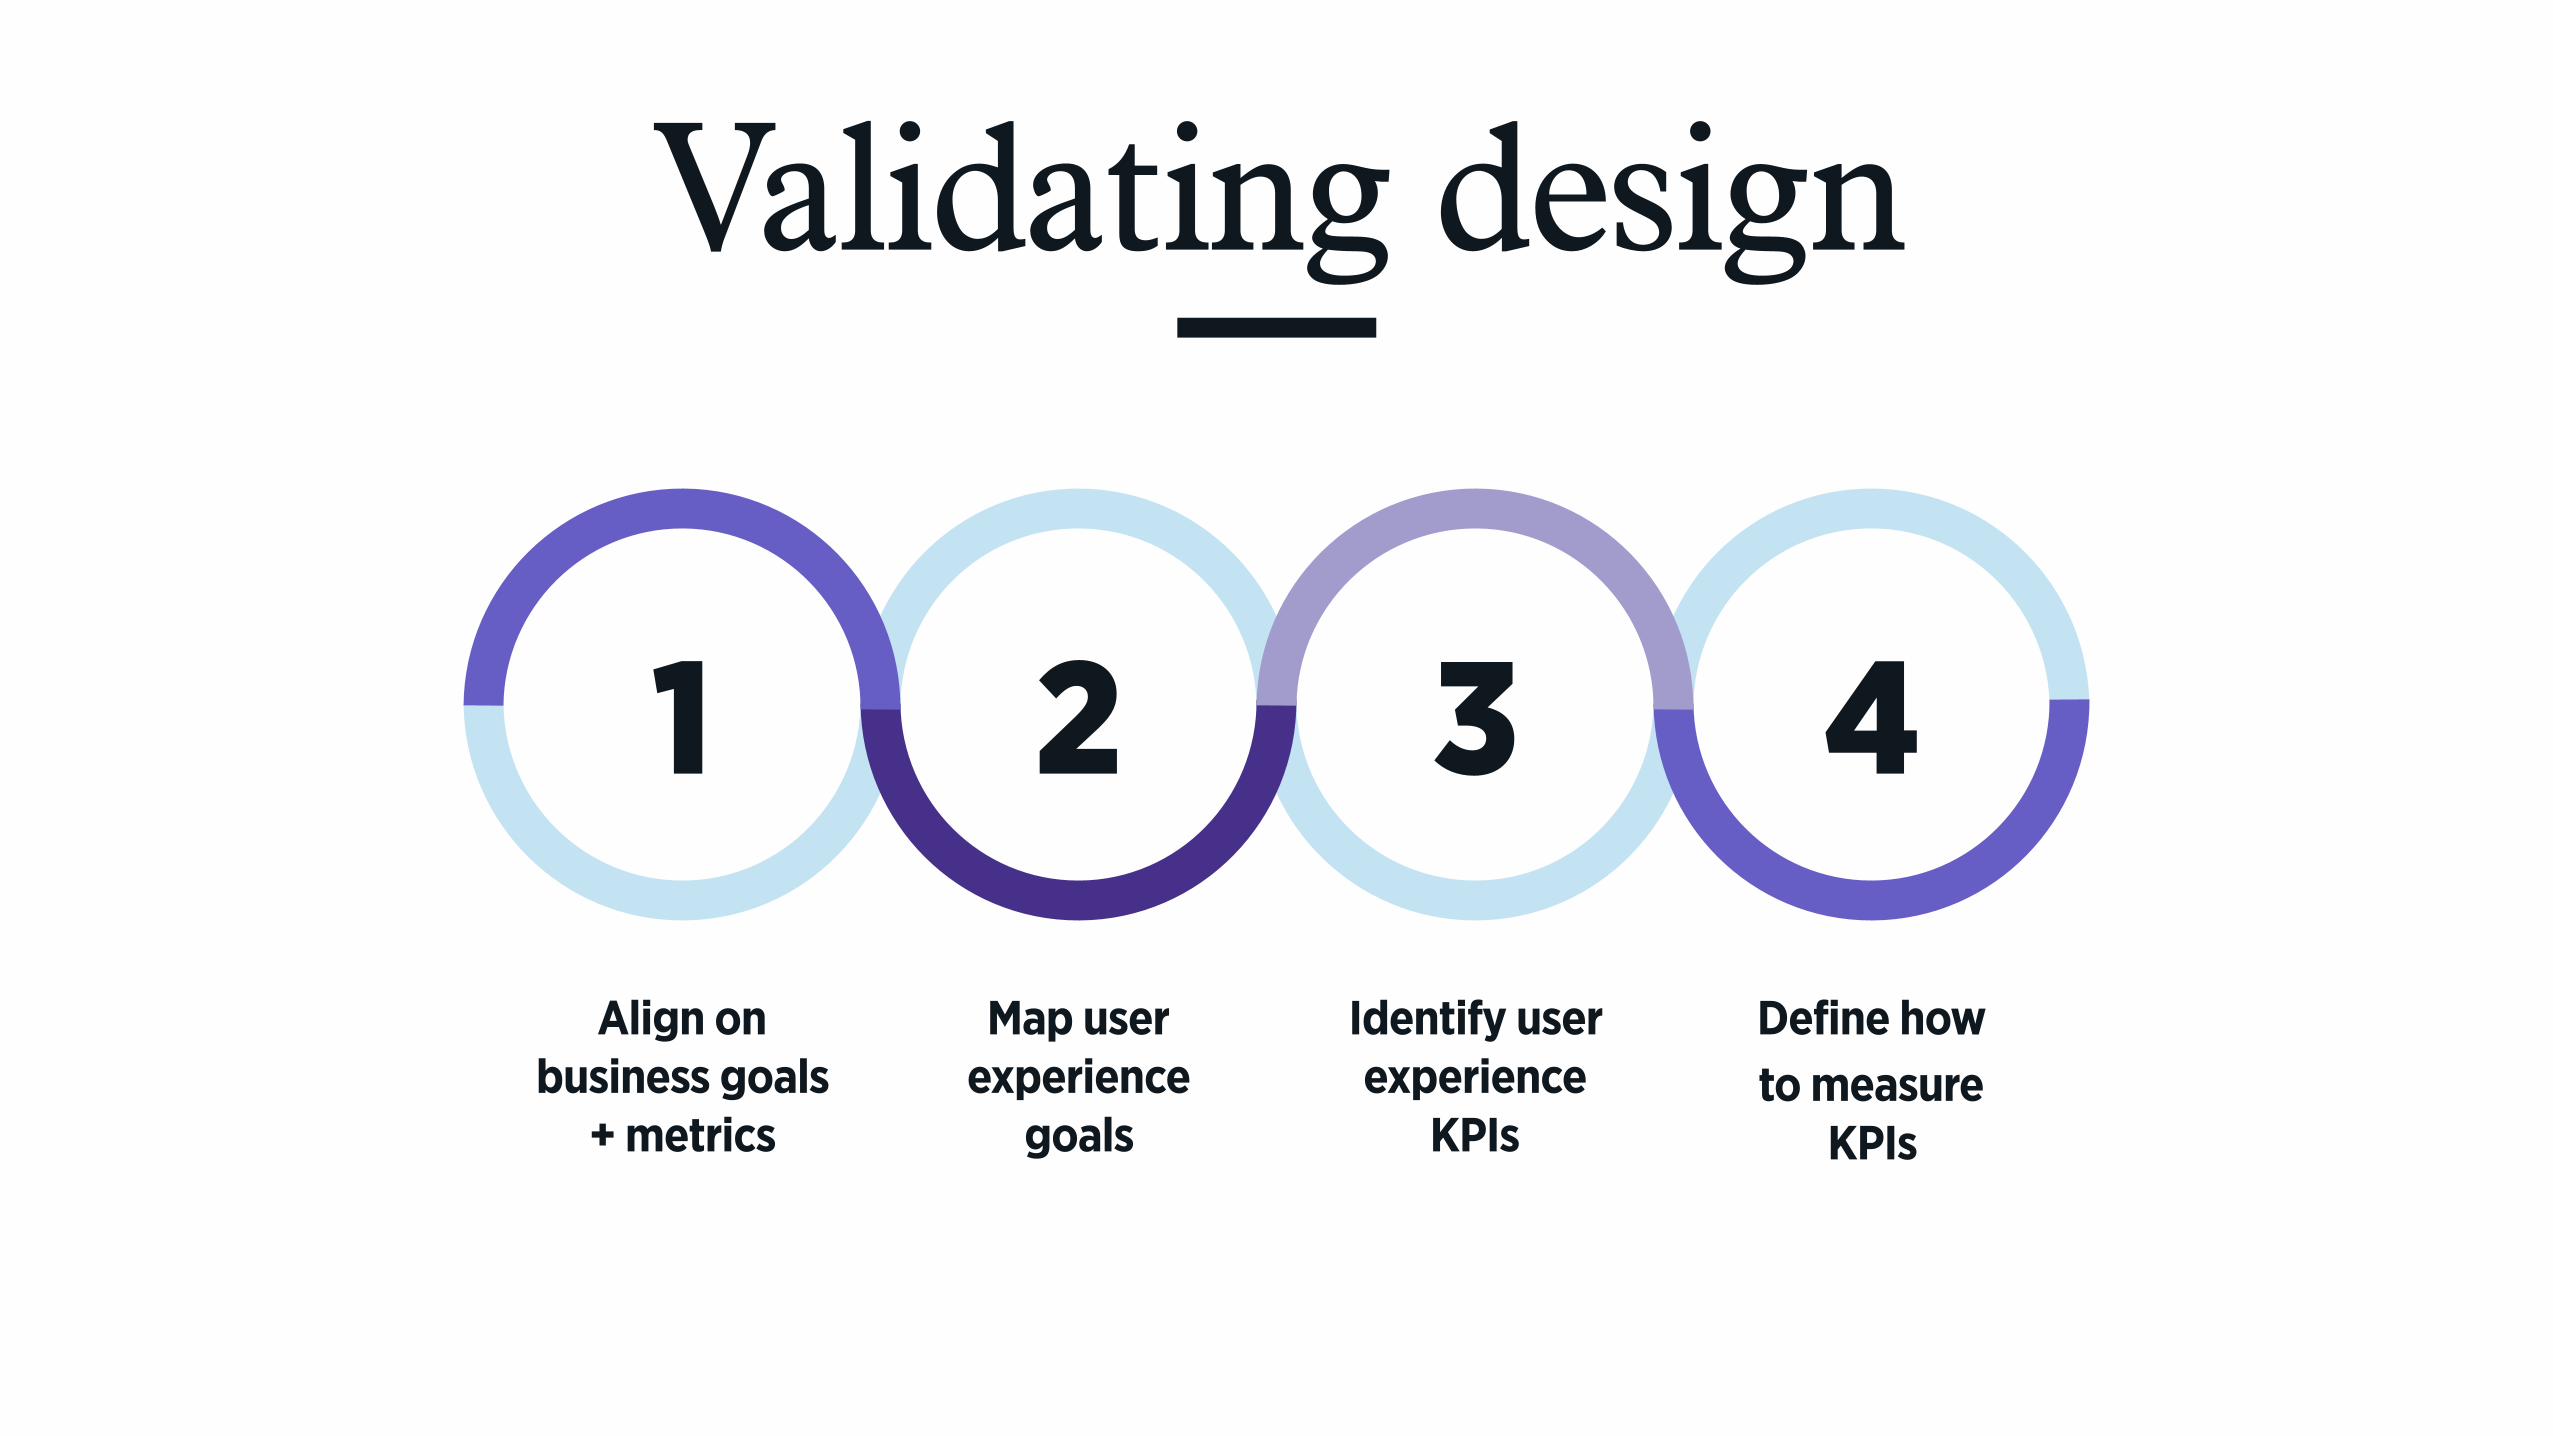
Validating design
1 2 3 4
Define how to measure
KPIs
Identify user experience
KPIs
Map user experience
goals
Align on business goals
+ metrics

Creating concepts + design directions.
DEFINITION

CHOOSING A CONCEPT
You and your team have been given choices but there is no clear winner.
How do you decide?

Choosing the right direction
BUSINESS GOALS EXISTING DATA LIGHT TESTING
It seems straightforward but often times we get swept away by something beautiful, new or flashy and forget about what our goals were in the first place.
Understand how the designs meet your business goals
If you have insights on words, placement, etc that have driven best performance in the past, choose a design that incorporates the same or similar elements.
Use lessons learned from the data you already have
Ask some test subjects a set of measured questions and use the KPIs you identified at kickoff to score each concept (more on this in the next section).
Perform lightweight tests with all the concepts
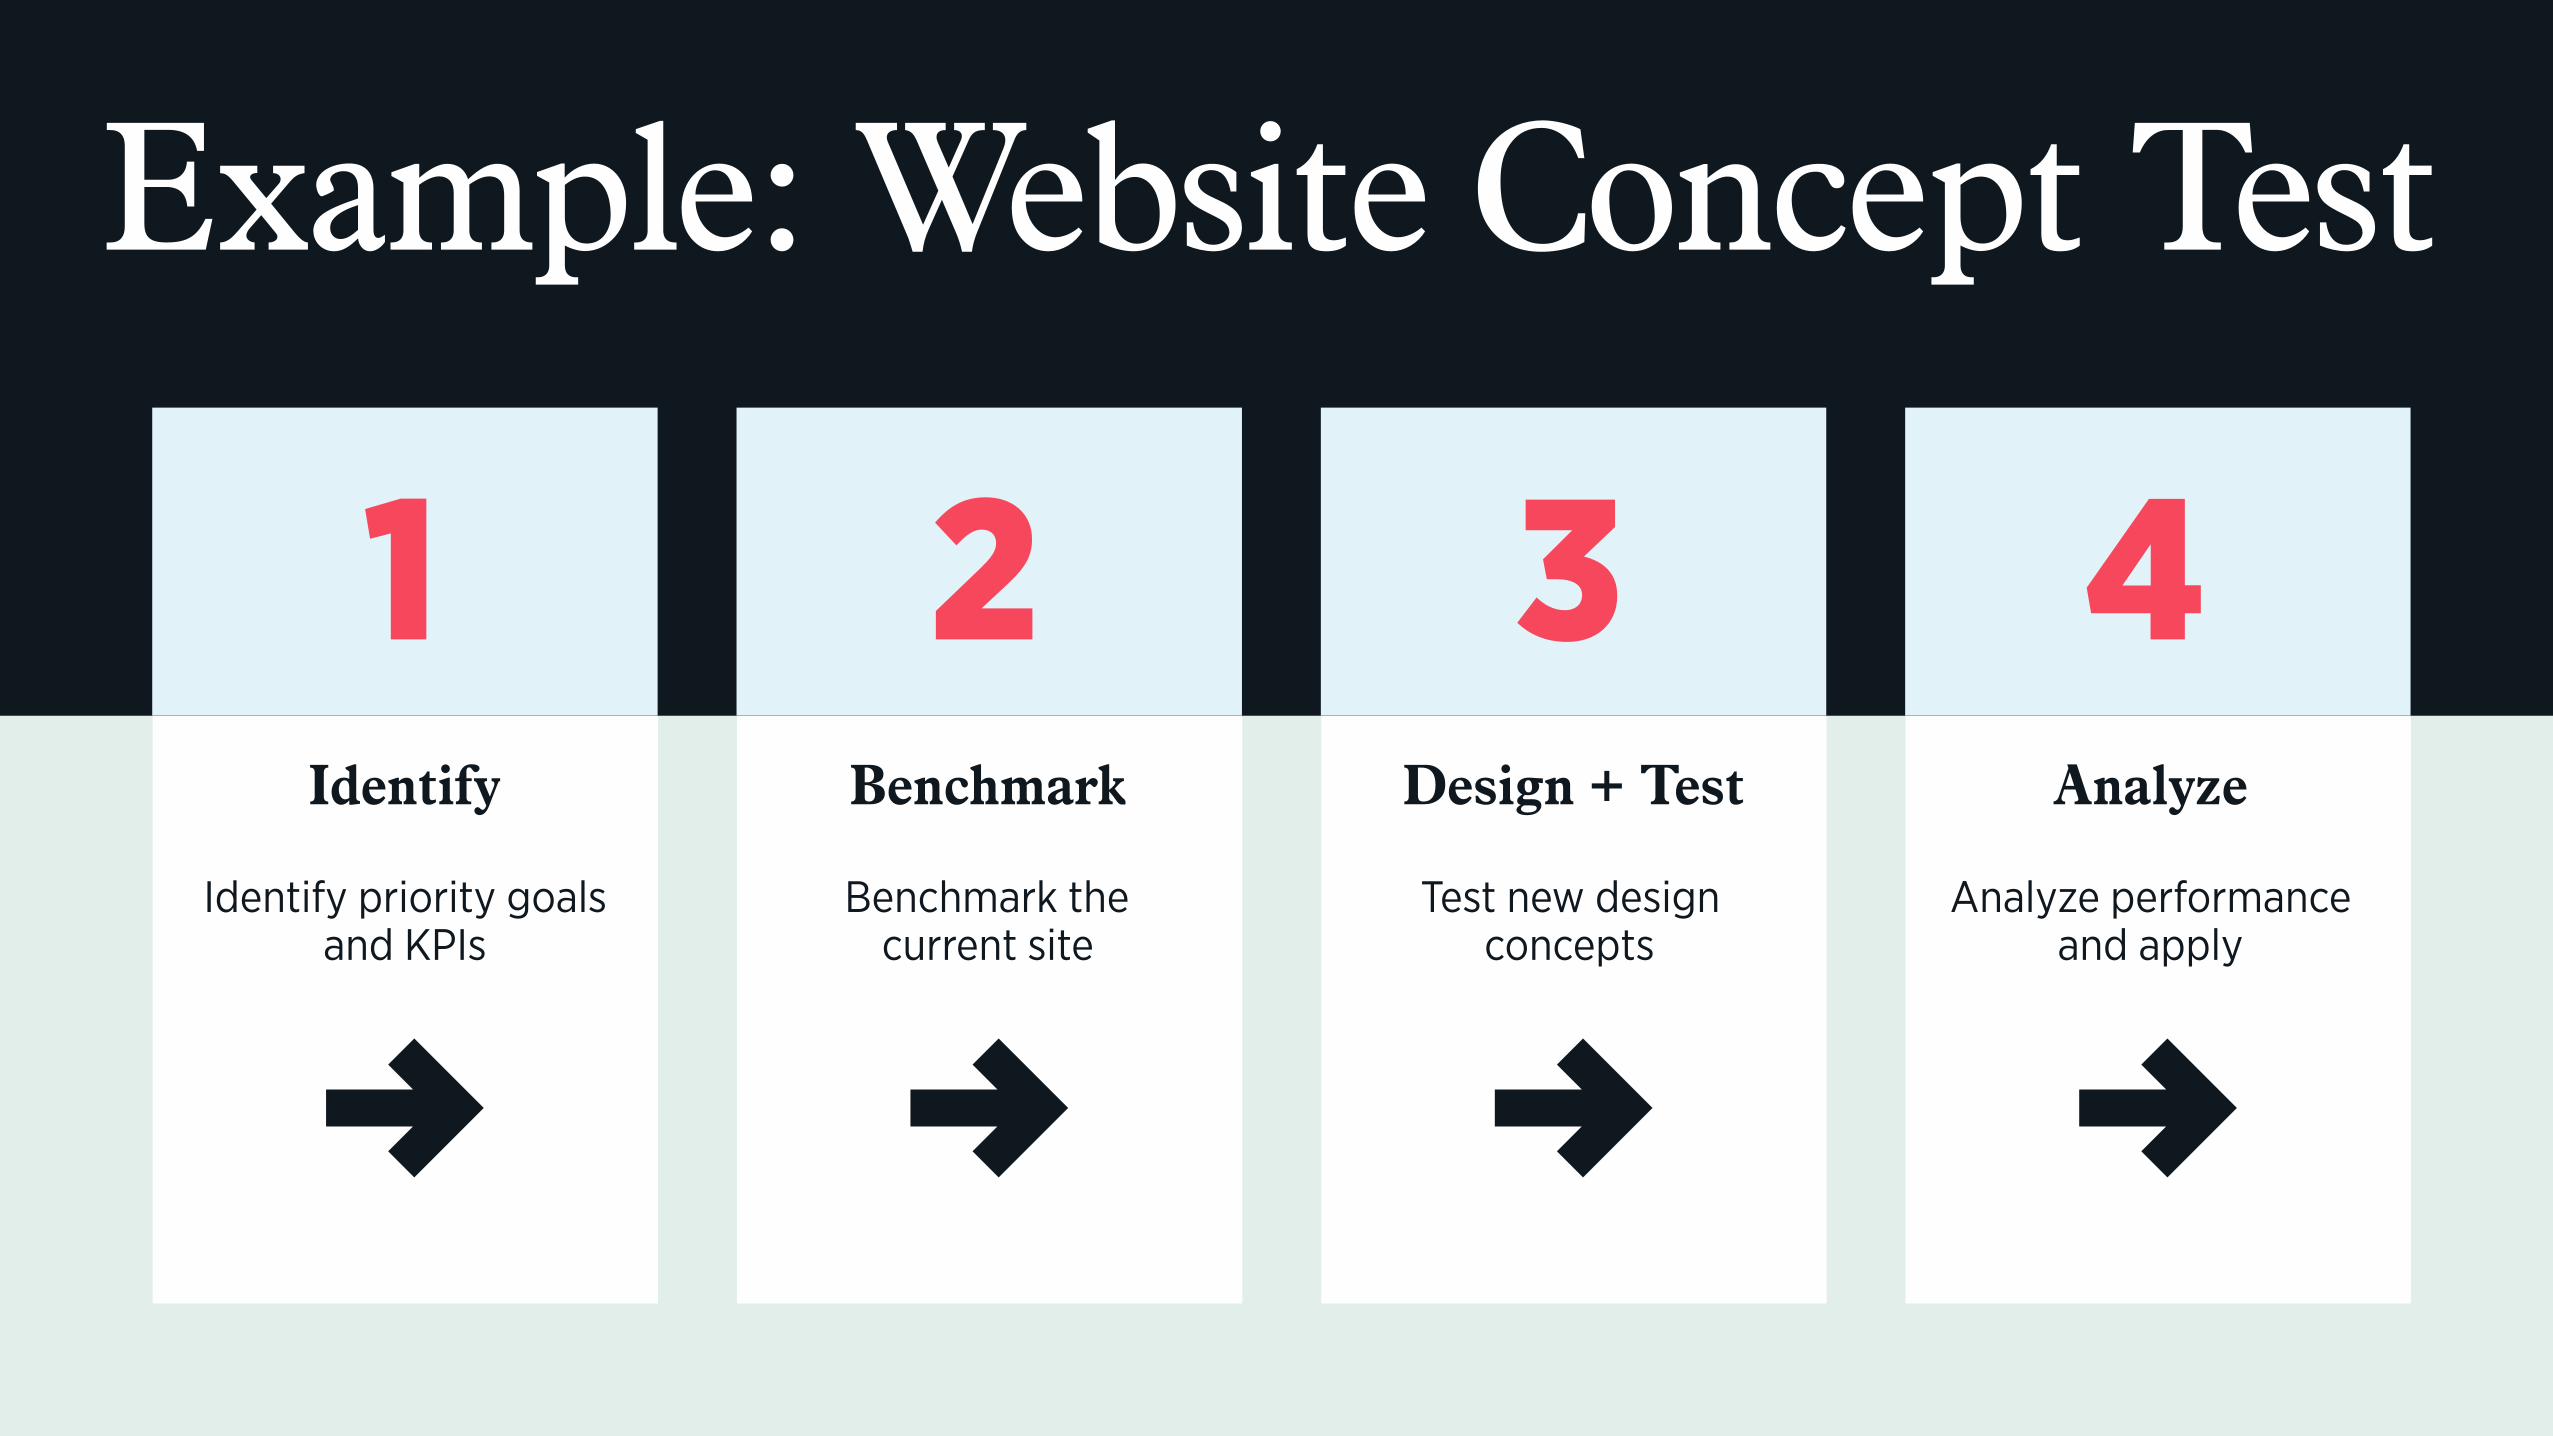
Identify Benchmark Design + Test
1 2 3
Example: Website Concept Test
4Analyze
Identify priority goals and KPIs
Benchmark the current site
Test new design concepts
Analyze performance and apply

1
WHAT’S DEFINED Monthly website sales as a business KPI
Task success rate as a UX KPI
IDENTIFY BUSINESS + UX GOALS
Increase online sales + Streamline website
purchase flow
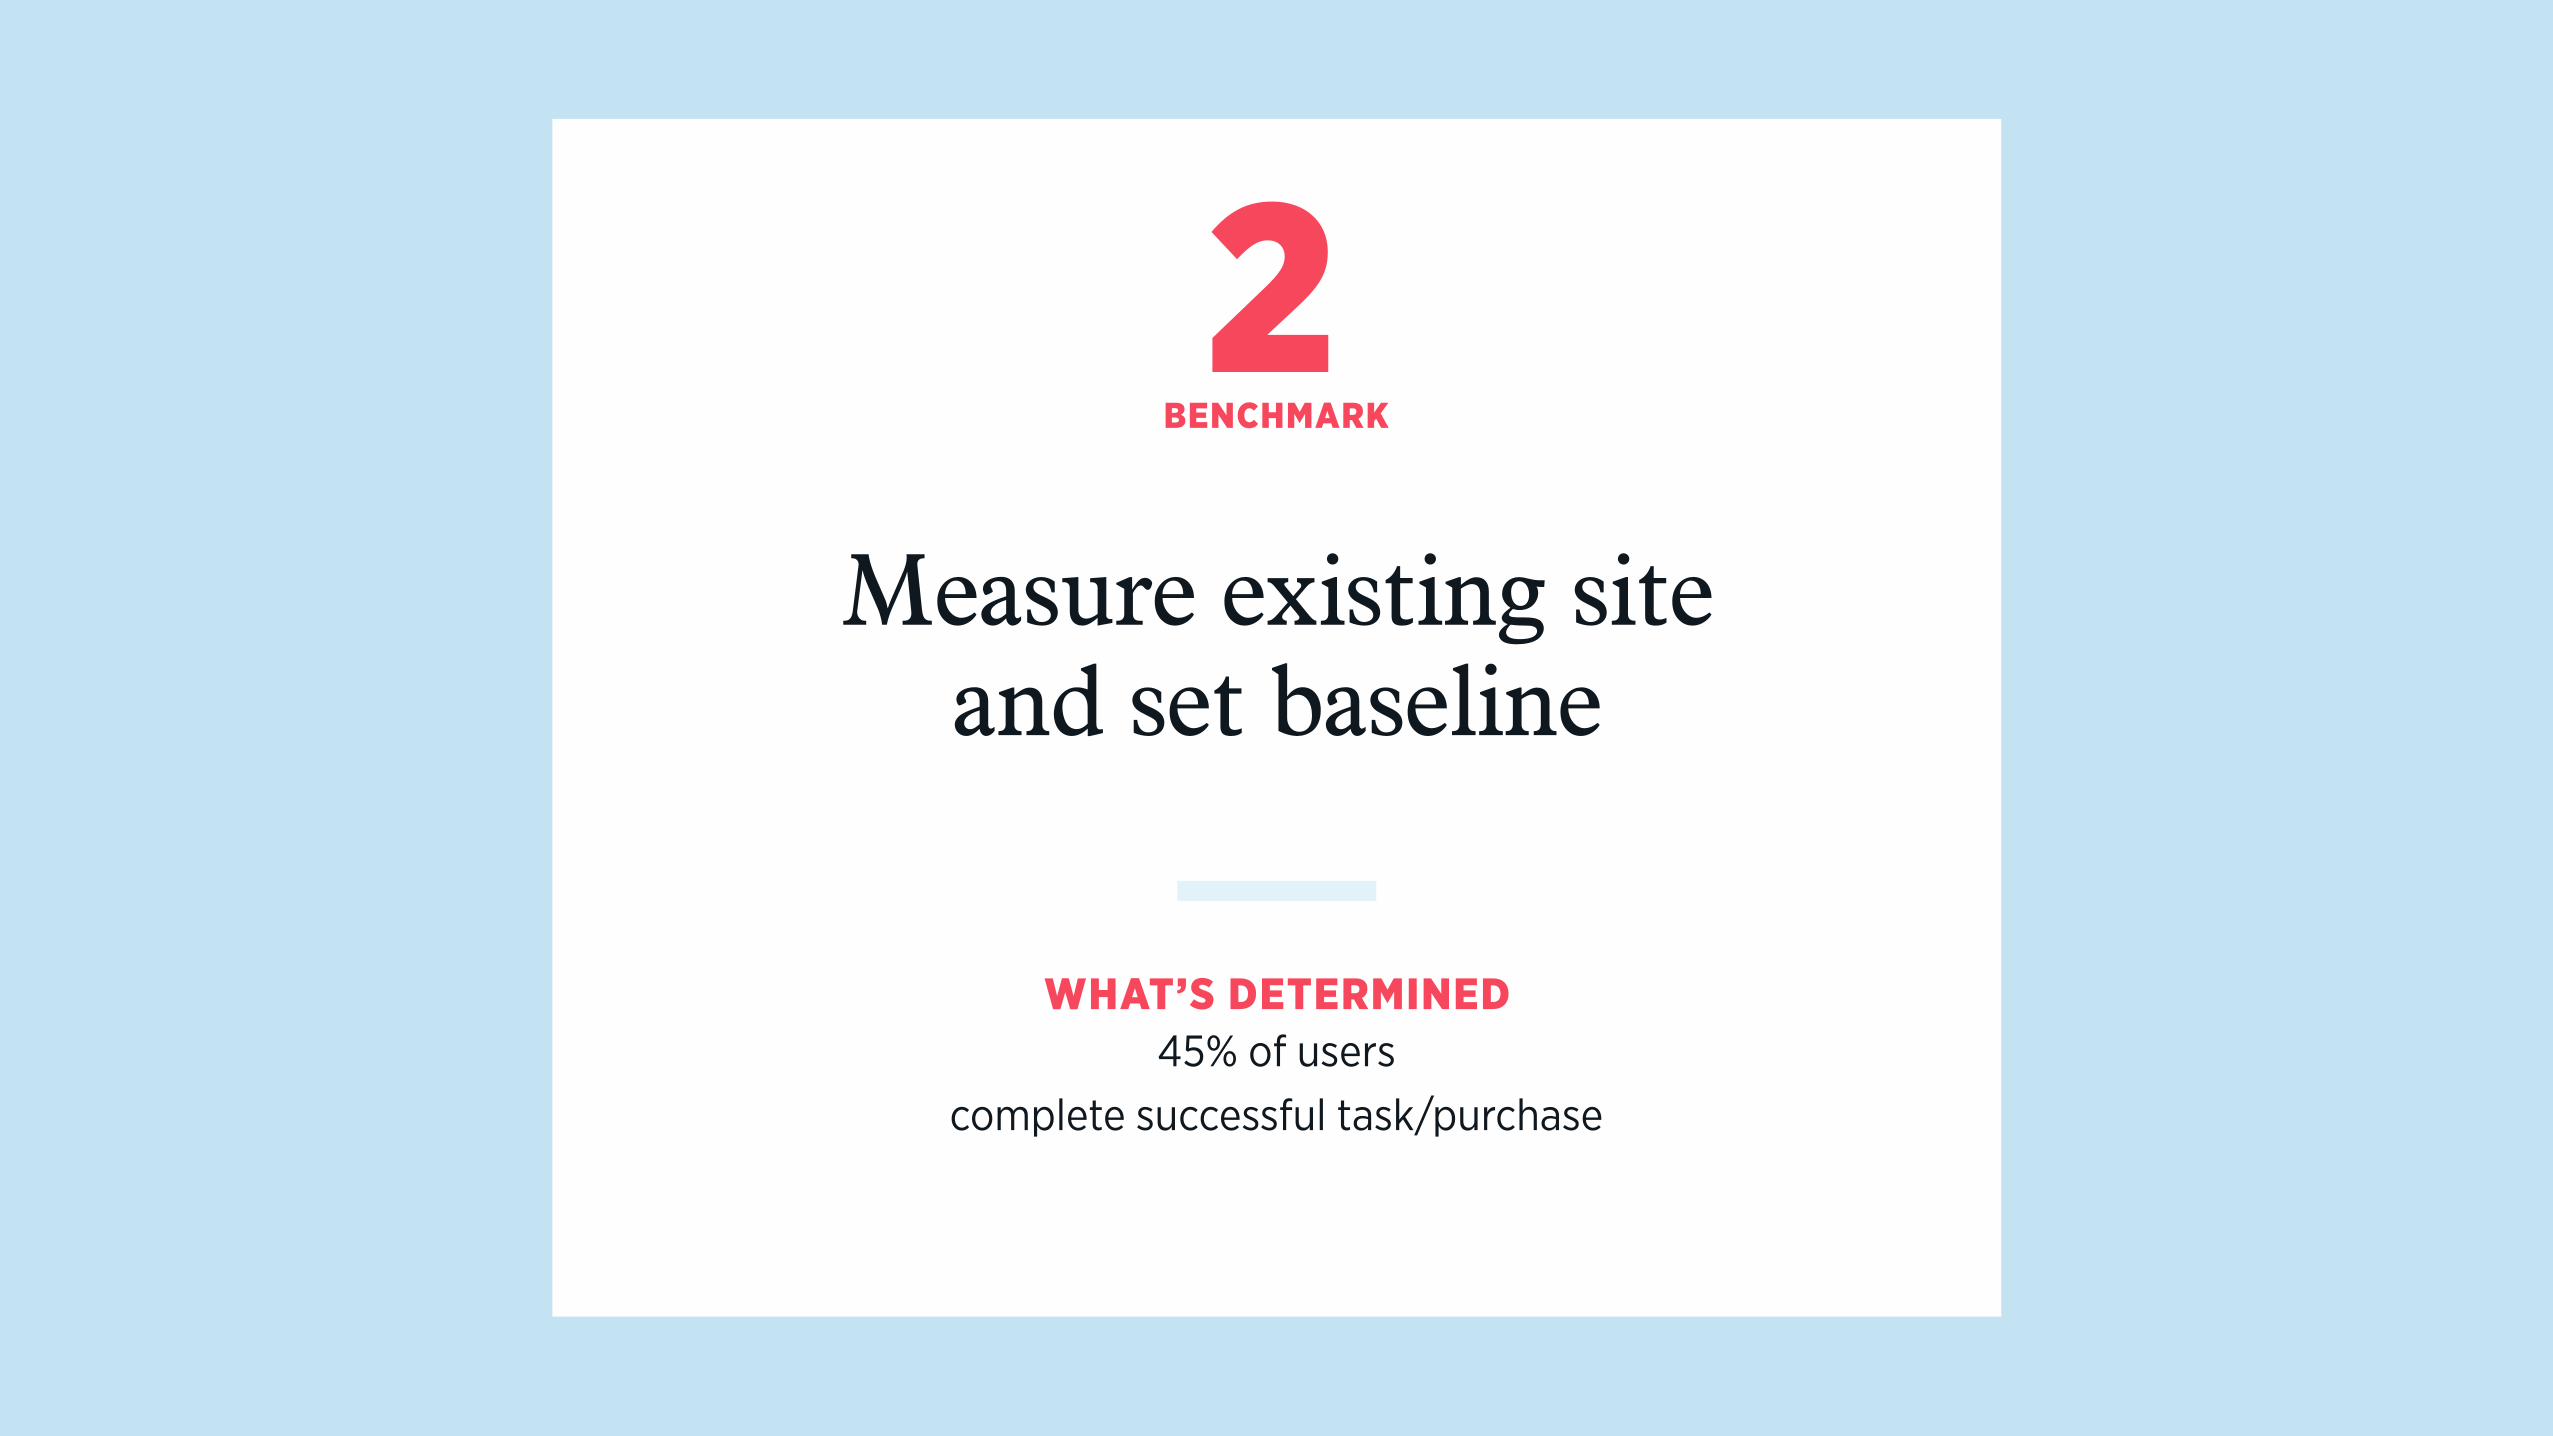
2
WHAT’S DETERMINED 45% of users
complete successful task/purchase
BENCHMARK
Measure existing site and set baseline

3DESIGN + MEASURE
Two design concepts are created and tested against
our defined UX KPIs
WHAT’S MEASURED
Concept One - 75% | Concept Two - 60%
of users complete successful task/purchase

4ANALYZE
A definitive top performer is determined
WHAT’S FOUND
Existing Site - 45% Concept One - 75% Concept Two - 60%
of users complete successful task/purchase

Quantify value + tie back
EXISTING SITE
Monthly Visits = 100K
Avg. Cart Size = $100
Task Success Rate = 45%
Revenue = $4.5 M
CONCEPT ONE
Monthly Visits = 100K
Avg. Cart Size = $100
Task Success Rate = 75%
Revenue = $7.5 M
All else equal, the improvement in task success rate translates into $3.0 million of incremental monthly
revenue

Revising selected direction.
ITERATION

“The concepts were so clean and simple, but by the time we got all the required items in, it seemed too complicated.

1 USE AN EXISTING METHODOLOGY Tests like the System Usability Scale are easy to administer and have benchmark data available.
2 …OR MAKE YOUR OWN Create a simple set of statements related to your KPIs. Ask your audience to rate their agreement on a Likert scale (strongly disagree to strongly agree) and convert ratings to 1-5 numbers.
3 ADMINISTER THE TEST Give the test to five or more audience members, allow them to provide context for their ratings so you can understand why the iterations is working (or not).
4
Test each iteration with your audience
TRACK CHANGE OVER ITERATIONS Average scores and track for each iteration.
GETTING IT RIGHT

Example: System Usability Scale

Putting the final design into market.
LAUNCH

We’re done, right?
SET IT AND FORGET IT Once an initiative is launched, everyone moves on to the next thing and hopes that it does what it’s supposed to.
IT DOESN’T PERFORM AS EXPECTED The initiative doesn’t drive the results that everyone had hoped but nobody knows why or what to do.
IT WORKS! The initiative performs great but there’s no way to quantify the value or repeat the success.
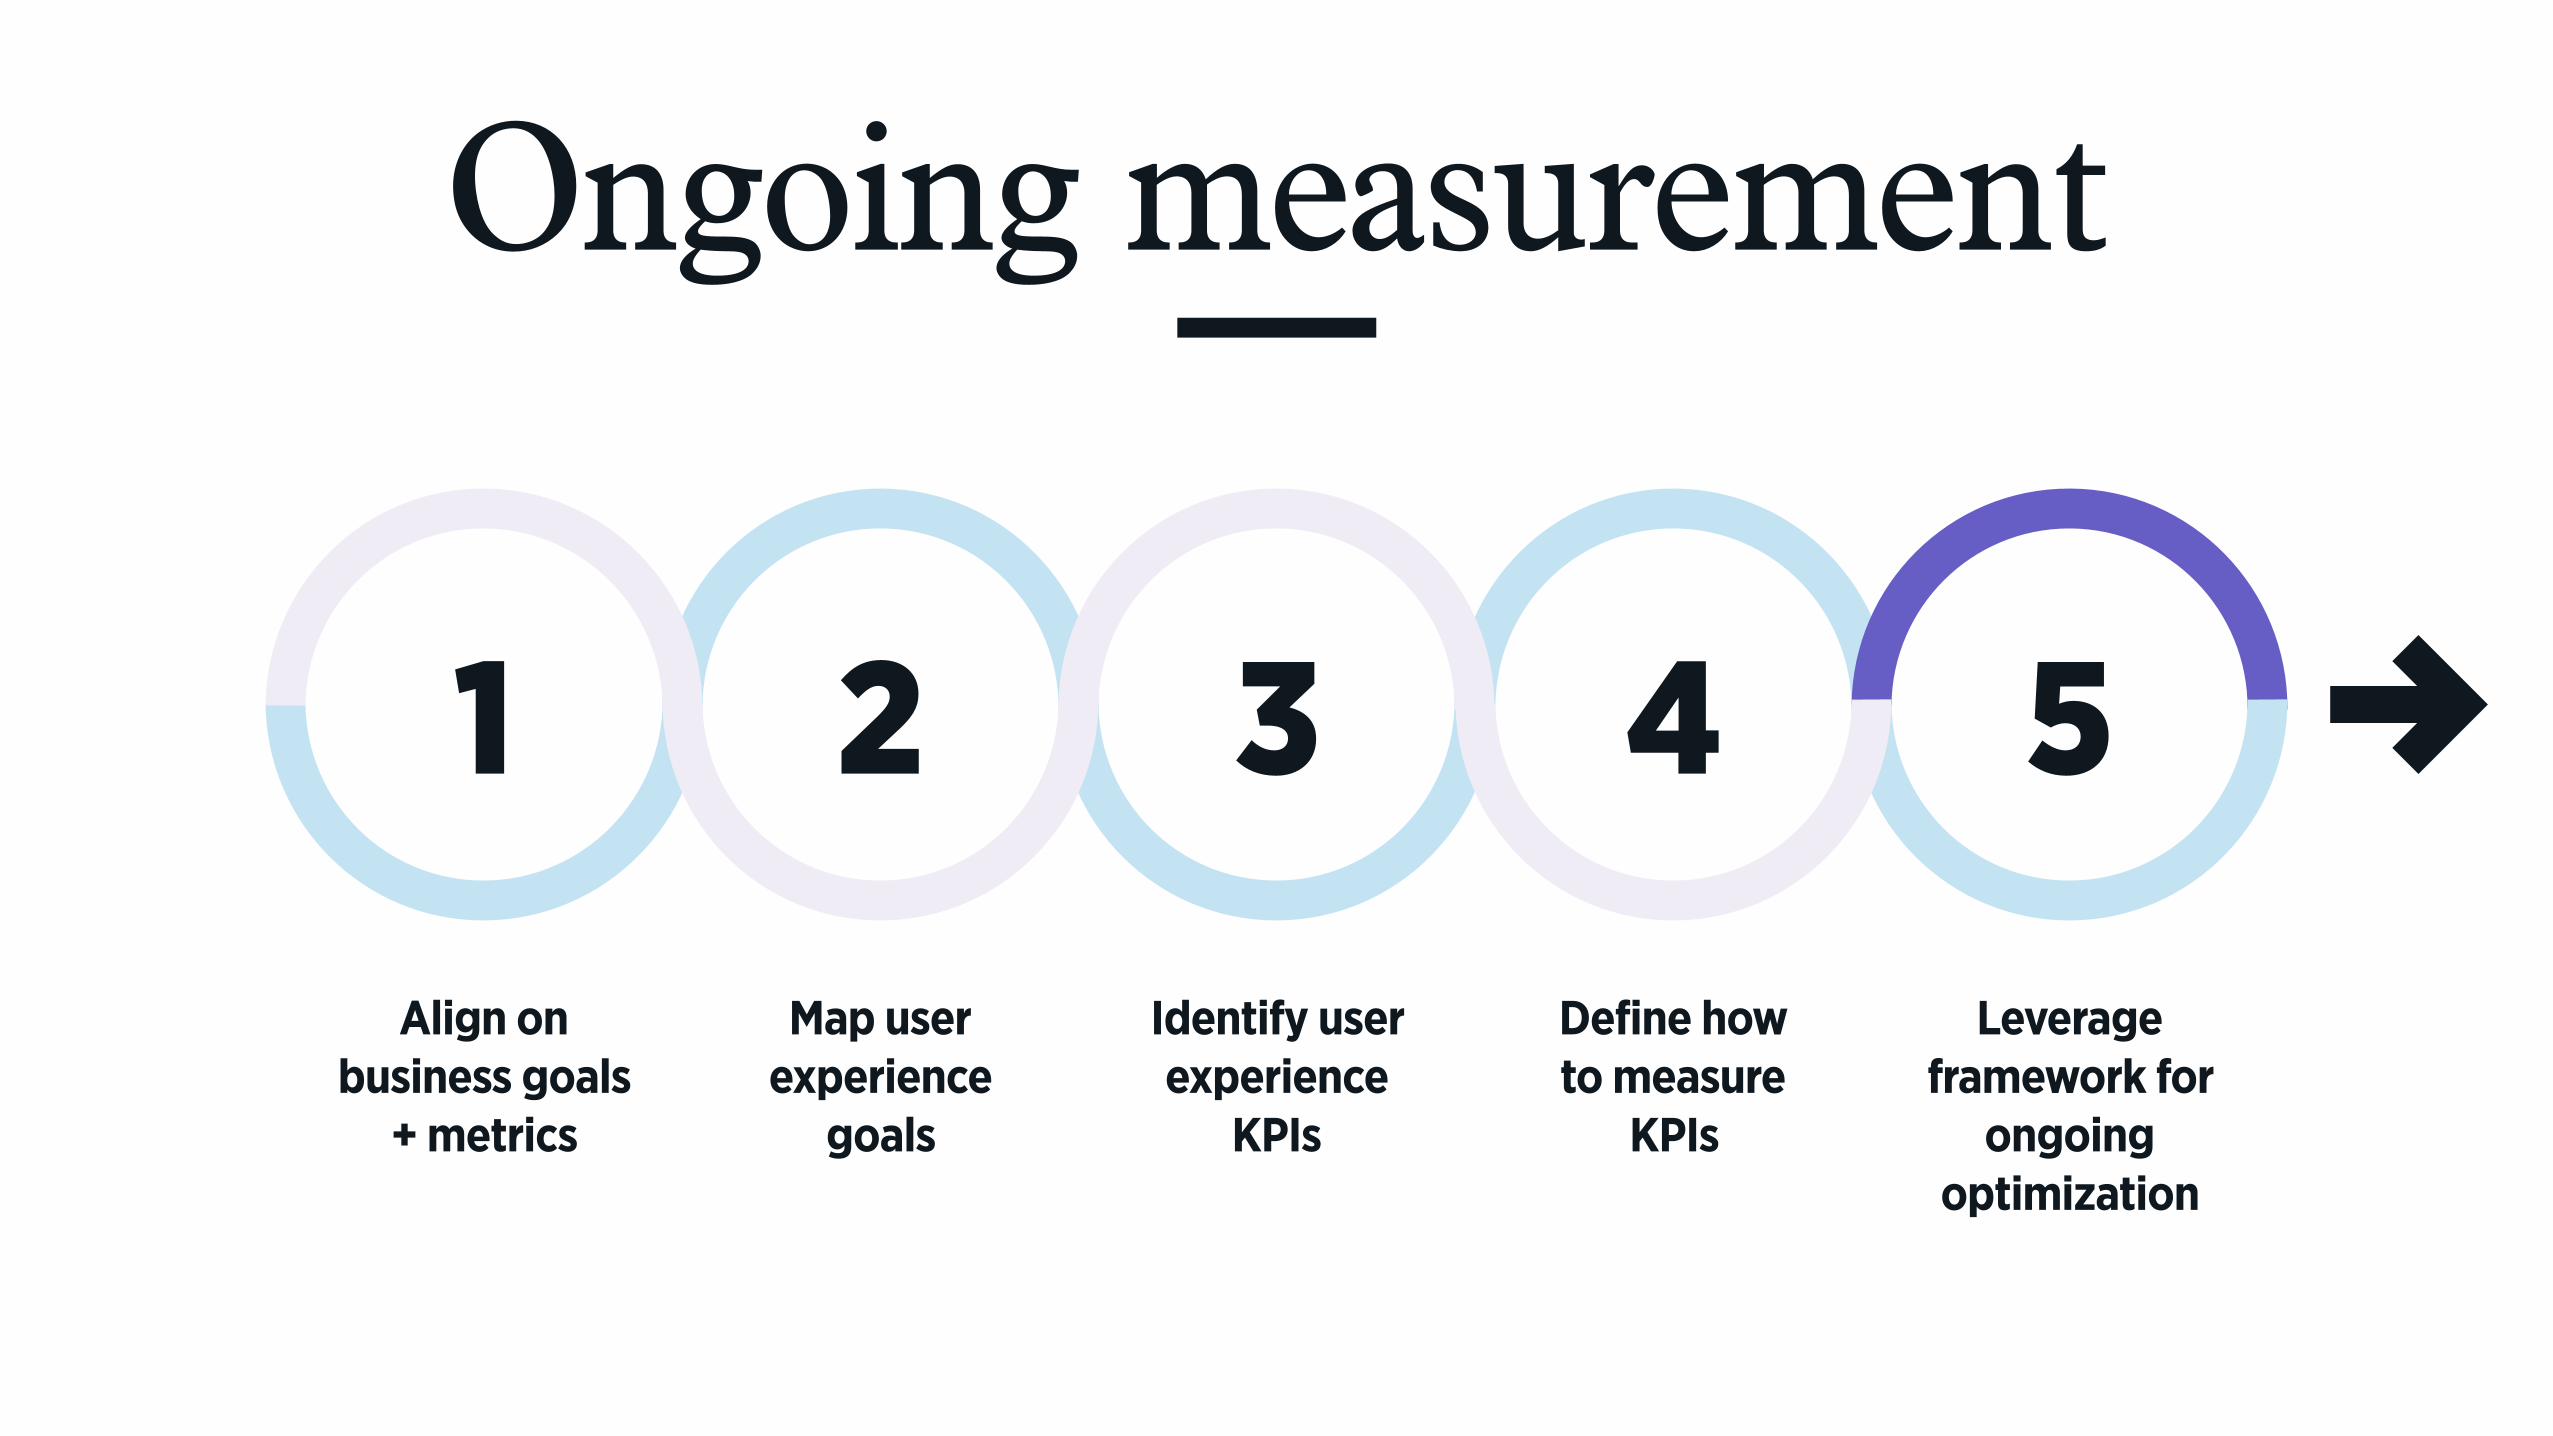
Ongoing measurement
51 2 3 4
Define howto measure
KPIs
Identify user experience
KPIs
Map user experience
goals
Align on business goals
+ metrics
Leverage framework for
ongoing optimization
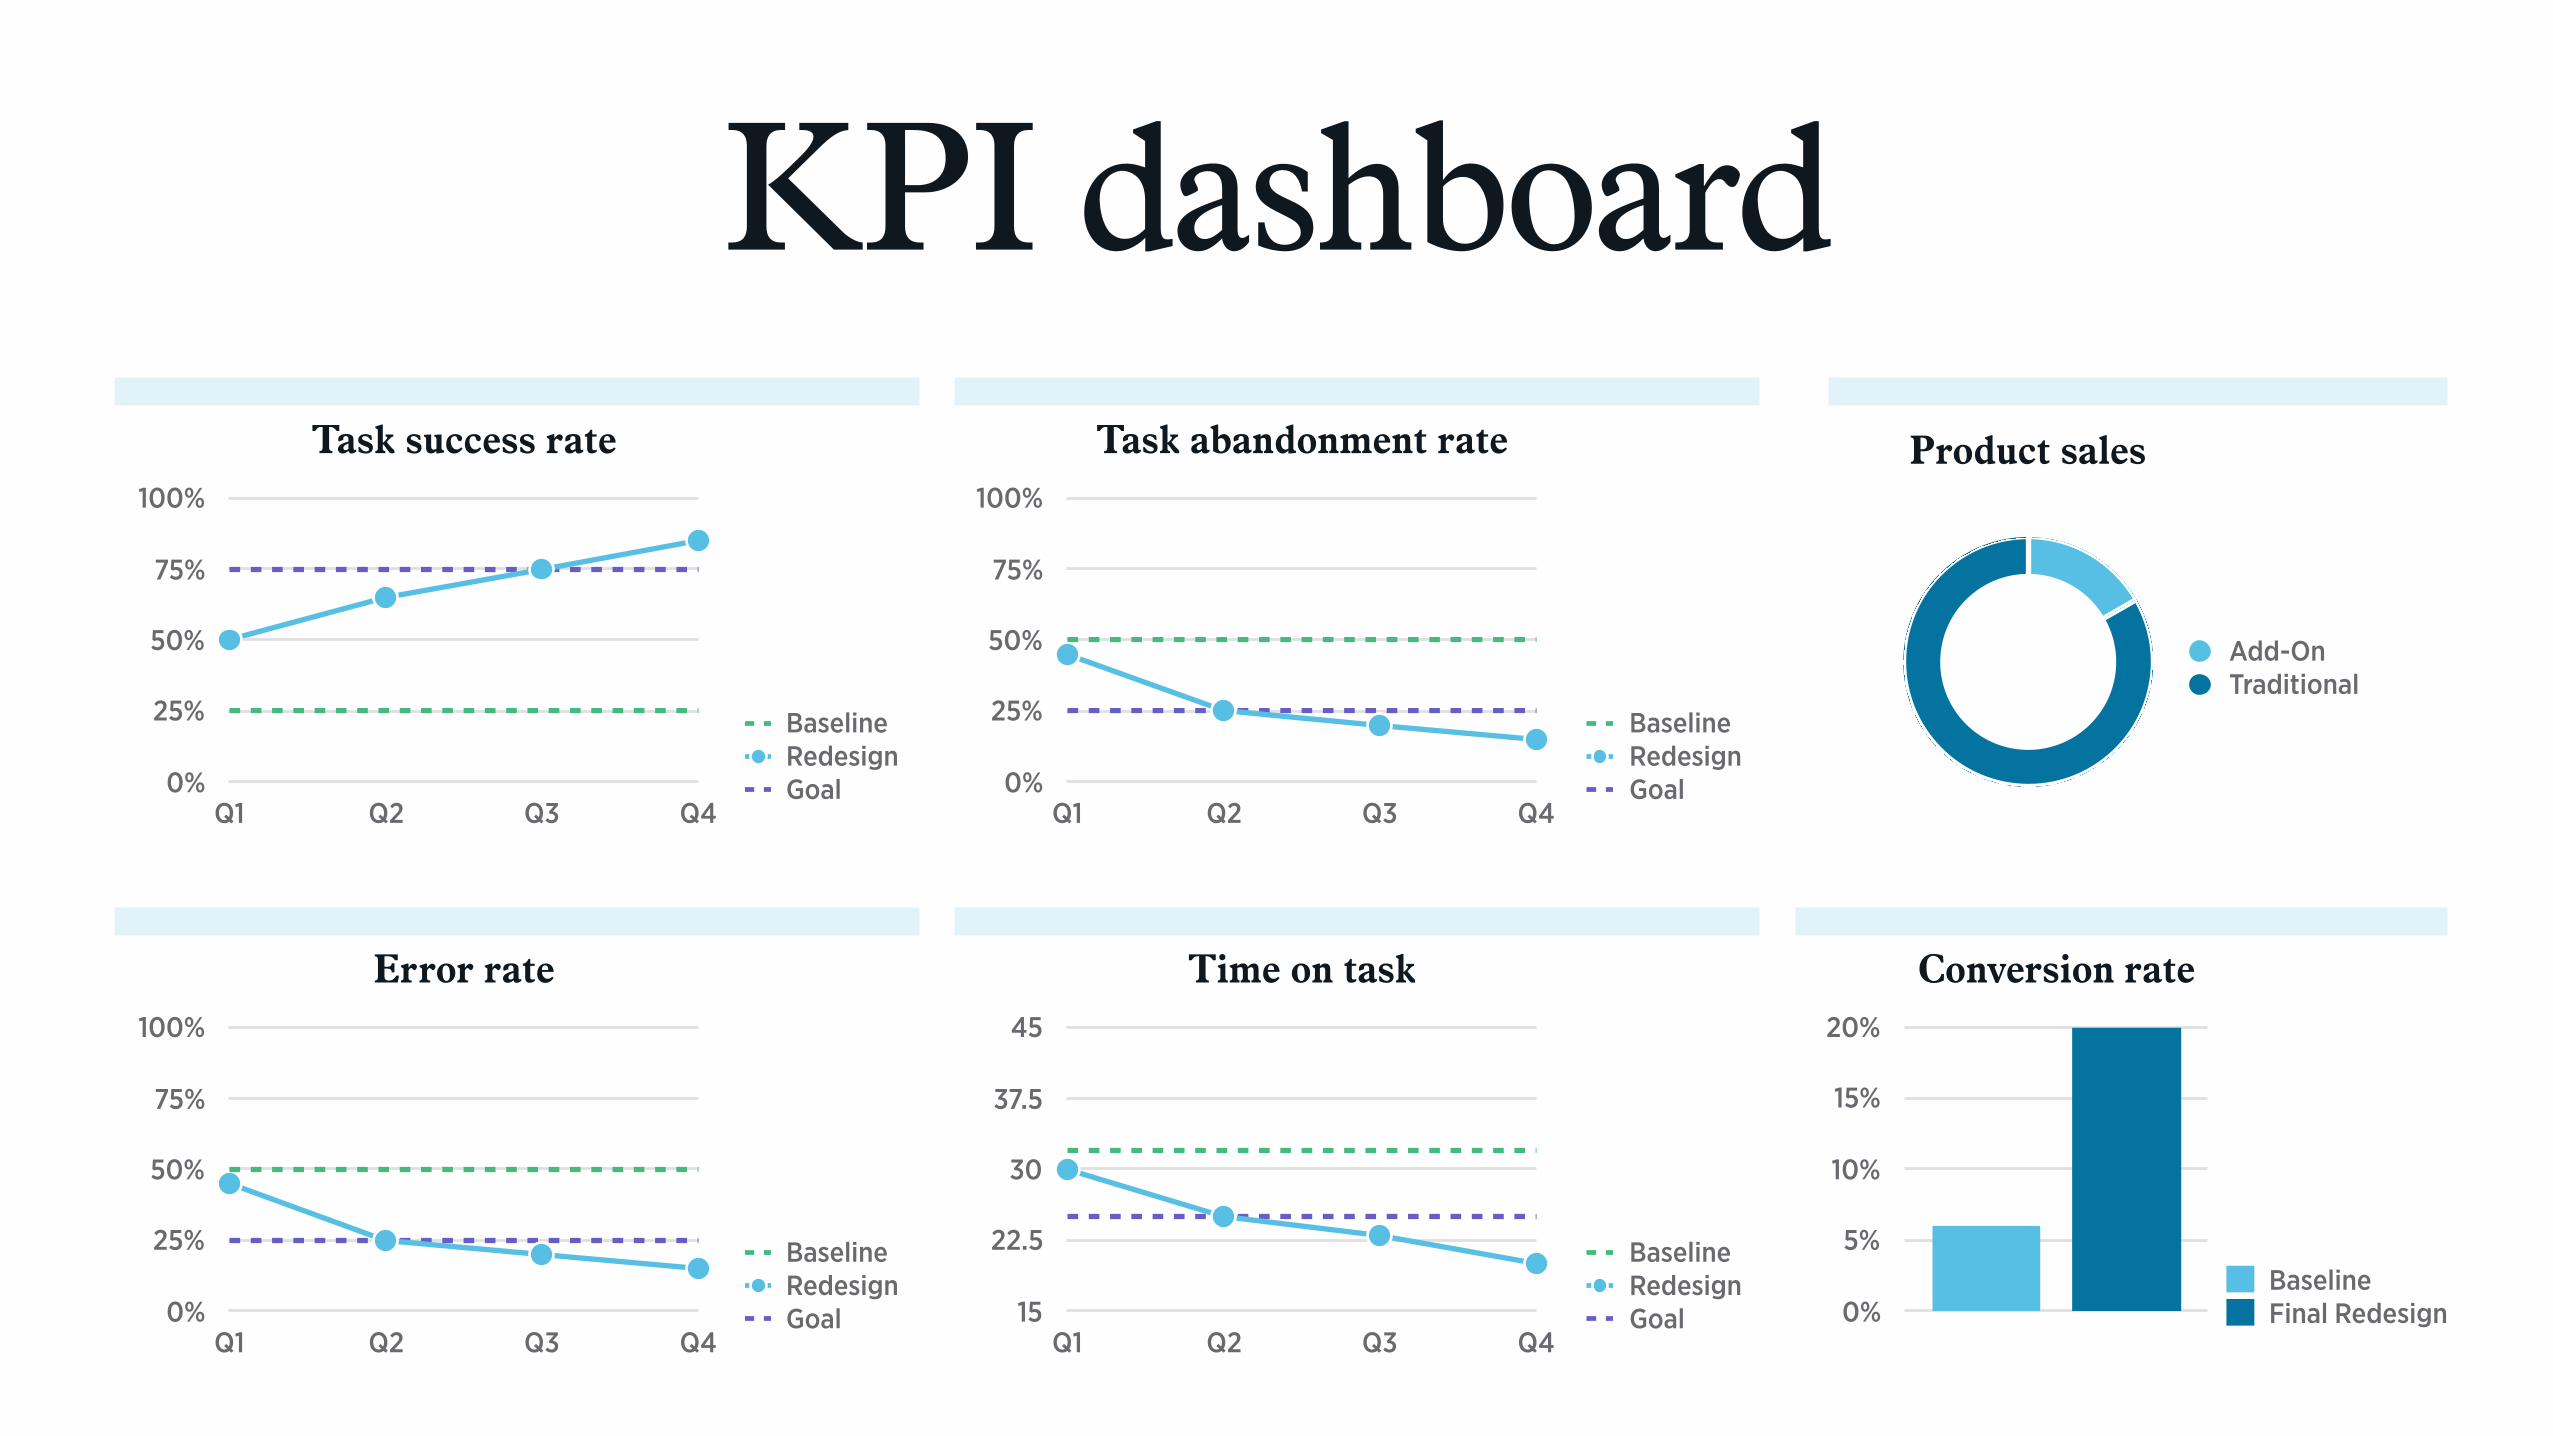
KPI dashboardTask success rate
0%
25%
50%
75%
100%
Q1 Q2 Q3 Q4
BaselineRedesignGoal
Task abandonment rate
0%
25%
50%
75%
100%
Q1 Q2 Q3 Q4
BaselineRedesignGoal
Error rate
0%
25%
50%
75%
100%
Q1 Q2 Q3 Q4
BaselineRedesignGoal
Time on task
15
22.5
30
37.5
45
Q1 Q2 Q3 Q4
BaselineRedesignGoal
Product sales
Add-OnTraditional
Conversion rate
0%
5%
10%
15%
20%
BaselineFinal Redesign

Use data to define clear customer and business KPIs that you can measure throughout the process.
Discovery
Use data from previous efforts to design to known successes and best practices. Test concepts against each other measuring your key KPIs.
Definition
Test each iteration to ensure that you are not degrading the design experience.
Iteration
Track performance once the product is in market and record learnings for improvement and future efforts.
Launch
Design Process
Questions?
Amanda Gagliardi VP, Experience Design
at Effective
Rob BlackieDigital Strategy

Want this deck?
It will be available for download shortly after the webinar on: slideshare.net/socialogilvy
Ogilvy staff: It’s also on The Market!themarket.ogilvy.com
Are you on the go? You can join our webinars on mobile, too!Download the GoToWebinar app from the App Store or Google Play