white paper alaskan natural gas - arlis. · pdf filewhite paper alaskan natural gas ... this...
TRANSCRIPT

REF ALASKA HD 9581 .A4 wss 1999
-----'
'\
o I
' '
' '
ecERA
. '
WHITE PAPER
ALASKAN NATURAL GAS ..
Prepared
' by
Cambridg~ Energy Research Associates
,
November 1999
.. '
,
. t
..
ecEAA
WHITE PAPER
ALASKAN NATURAL GAS
Prepared
by
Cambridge Energy Research Associates
For
BP EXPLORATION
Part of the BP Amoco Group

ecERA WHITE PAPER
ALASKAN NATURAL GAS
EXECUTIVE SUMMARY This White Paper has been prepared by Cambridge Energy Research Associates (CERA) at the
request of BP Amoco. The purpose is to review alternative marketing methods and their potential for marketing the gas reserves on Alaska's North Slope. At present, gas is being produced only in association with oil and is then mostly returned to the reservoir to enhance oil recovery. In due course, however, substantial volumes could be made available for sale without compromising ultimate oil recovery. The challenge is to find the most efficient method of marketing the gas that would also be financially attractive and meet the needs of all interested parties. The primary ways to capture value from Alaska's gas reserves are
• Liquefied natural gas (LNG). An Alaskan LNG project would involve building a large-diameter pipeline to Prince William Sound or the Cook Inlet on the southern coast, where the gas would be liquefied for shipment to world markets. Such a project (pipeline, liquefaction plant, port facilities, and tanker fleet) would cost $12-$14 billion and, if feasible, would provide major benefits to a wide range of interests in Alaska. The world's main consumption center for LNG is the Asia Pacific region, located relatively close to an Alaskan liquefaction plant.
• Pipeline exports to the lower-48. This project would require the building of a large diameter pipeline from or through Alaska into Canada connecting to the North American pipeline grid and allowing delivery to multiple US destinations. The pipeline would cost $5-$6 billion. North Slope reserves would then be connected to the largest gas market in the world but with the disadvantage of being the most distant from major consuming areas in that market.
• Gas-to-liquids (GTL) conversion. New technology is being developed to convert produced gas to high-quality liquids low in contaminants such as sulfur and nitrogen. These liquids can be blended in fuels to meet increasingly stringent environmental standards. After production on the North Slope, these liquids could be shipped to Valdez, utilizing unused capacity in the TAPS facility. Both the North Slope investment and the gas volumes required would be relatively small until the technology and economics were verified. Plant volumes could then be increased as desired. There is a substantial demand for liquids of this quality but the pricing premium would need to be established.
The investment involved in either an LNG or a pipeline export project requires large quantities of gas to spread the cost over as many units as possible. Each would likely require volumes of approximately 2 billion cubic feet (Bcf) per day. The magnitude of these sales volumes combined with the need for high capacity utilization makes marketing extremely difficult.
The three alternatives are not mutually exclusive despite the volumes involved. Although simultaneous implementation of both LNG and an export pipeline would require the discovery of additional reserves, staggered implementation allowing joint utilization of an Alaskan pipeline could allow volume reduction in one or both of the projects. Since a GTL project could be sized to fit available gas volumes, it could be implemented at any time without jeopardizing the pursuit of the other alternatives.
1
ecERA After analyzing the requirements of the primary methods to utilize North Slope gas and reviewing
the competitive nature of the global gas markets, our conclusions are
• A large-volume Alaskan LNG project-14 million tons per year-would be necessary to obtain financing under traditional terms and ownership structures. Such a project, which would have to sell this necessarily large volume of LNG into the competitive long-term market in the Asia Pacific region, is not yet economically competitive.
• Initiating a major export pipeline project would require confidence in the projected high growth rates in US gas demand and the prospect for reduced supply from the currently producing basins in North America. The potential for such conditions is too speculative today to support project initiation.
• A small-scale GTL demonstration project can be initiated as soon as technology warrants and could be in production within two to three years thereafter. Though the initial gas volumes utilized would be relatively small, major expansions could be made following verification of project economics.
Neither an LNG scheme nor a pipeline export alternative requiring large volumes could be in place until five to seven years after a commercially feasible plan is decided. Continued gas injection is both a fallback position and at least a requirement for many years.
Introduction The North Slope area of Alaska has over 30 trillion cubic feet (Tcf) of proven gas reserves and
the potential for discovering additional volumes. Currently, gas is being produced in association with oil and, after separation, is being reinjected into the reservoir. While some gas must be reinjected to maximize oil recovery, the lack of an economic outlet to market the gas means more is (or will be) reinjected than necessary for oil recovery alone.
Various parties, including owners of the reserves, wish to begin monetizing this large natural gas asset. The primary ways to capture value from the gas are through the development of an LNG project, construction of an export pipeline, or conversion of the gas to liquids for transport through existing facilities.
The purpose of this paper is to review each of these alternatives, determine the potential benefits and the obstacles to implementation, and assess their current economic viability.
Driving Forces Before discussing each project's benefits and obstacles, the forces driving the implementation of
a gas utilization scheme need to be recognized. These fall into two basic categories: physical and financial.
Physical The facilities used for reinjecting produced gas into the reservoir have reached capacity and
become a bottleneck, limiting oil production from the main Prudhoe Bay field and from satellites. As oil production continues, the gas/oil ratio in the reservoir will continue to rise. The state of Alaska shares a common interest with the North Slope producers in finding the best solution to this growing problem. ---
2
' '
l

ecERA As oil production continues to decline, capacity utilization in the Trans Alaska Pipeline System
(TAPS) will also decline. Reduced throughput on TAPS will increase the cost per barrel of liquids transported.
There is a desire for physical access to gas services in Alaskan localities not now being served.
Financial The natural gas reserves are potentially a major asset and their owners strongly desire to begin
earning a return on them. Marketing of the gas reserves will require major investments and the assumption of substantial risks. The anticipated return must provide adequate financial rewards. A major market outlet for gas would create additional tax revenues for the state and encourage additional exploration, development and general business focus on Alaska.
Construction of a major gas utilization project would also provide substantial benefits to the state, Alaskan business interests, and citizens.
Liquefied Natural Gas
Industry Overview The manufacturing and marketing of LNG is a global business that has grown substantially since
its beginning in the early 1960s. LNG currently accounts for 13 Bcf per day, or about 5 percent of the world's natural gas productive capacity of 267 Bcf per day (see Table 1).
The economical transport of natural gas in liquid form has permitted access to reserves previously stranded far from major markets. It has also allowed gas to be made available to countries having few indigenous energy resources.
The major physical components of an LNG system are
• Liquefaction plants. Liquefaction plants are where the gas is cooled to -260° Fahrenheit and converted into a liquid for shipping. The plants are located close to the sources of natural gas production in order to keep costs to a minimum (see Table 2). Several new plants or expansions of existing plants are under construction or being actively proposed. If all these new facilities become operational, the world liquefaction capability would more than double from 13 Bcf per day in 1999 to 31 Bcf per day in 2010.
• Cryogenic tankers. LNG ships are specially constructed to transport the super-cold liquid and are normally dedicated to a specific trade between a seller and a buyer or buyers. There are currently 112 LNG tankers in the world fleet, with the large majority having capacities in excess of 100,000 cubic meters. There are 22 LNG ships under construction. Most of these vessels are approximately 135,000 cubic meters in size, with costs ranging from $200-$225 million each. At present, a new order for tankers of this size, might be priced as low as $160 million each, due to currently depressed shipyard conditions.
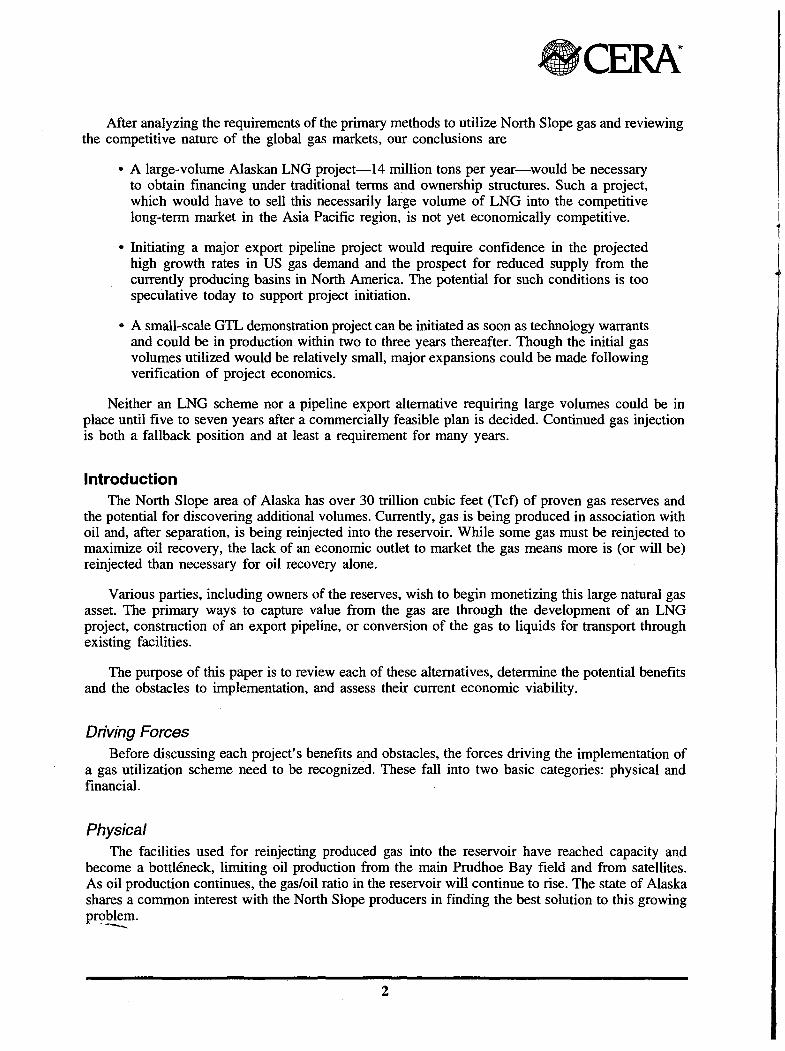
• Receiving terminals. When the LNG reaches its destination market, it is returned to the gaseous state for pipeline transfer. Receiving terminals are located close to the consumer-the main center of consumption being Japan (see Table 3). Additional terminals are either under construction, being reactivated or are in the active planning stage in at least four countries. The major components of the terminals are port and unloading facilities, LNG storage tanks, and regasification facilities.
3

ecERA Table 1
World LNG Outlook* (billion cubic feet per day)**
1990 1995 1996 1997 1998 1999 2000 2002 2005 2010 North America
United States Alaska 0.16 0.18 0.18 0.18 0.18 0.18 0.20 0.20 0.20 0.20
Latin America Trinidad*** 0.20 0.40 0.80 1.20 1.60 Venezuela 0.80 Total 0.20 0.40 0.80 1.20 2.40
Africa Algeria 1.90 1.90 2.00 2.20 2.90 3.00 3.28 3.28 3.28 3.28 Egypt 1.00 Libya 0.30 0.30 0.30 0.30 0.30 0.30 0.30 0.30 0.30 0.30 Nigeria*** 0.20 0.76 1.41 1.68 2.22 Total 2.20 2.20 2.30 2.50 3.20 3.50 4.34 4.99 5.26 6.80
Middle East Abu Dhabi 0.30 0.60 0.60 0.60 0.60 0.60 0.60 0.60 0.60 1.20 Oman*** 0.25 0.70 0.85 0.85 Qatar
Qatargas*** 0.30 0.70 0.70 0.77 1.03 1.03 1.03 Ras Laffan*** 0.25 0.65 1.28 1.58 1.58 Other (expansions) 1.30
Total 0.30 0.70 0.95 1.42 2.31 2.61 3.91 Yemen 0.60 0.60 Total 0.30 0.60 0.60 0.90 1.30 1.55 2.27 3.61 4.66 6.56
Far East Australia
North Rankin Area 0.50 0.86 0.96 0.96 0.96 0.96 0.96 0.96 1.20 1.92 Gorgon Trend 0.40 0.96 Timor Gap 0.39 Darwin 0.96 Total 0.50 0.86 0.96 0.96 0.96 0.96 0.96 0.96 1.60 4.23
Brunei 0.70 0.85 0.85 0.85 0.85 0.85 0.85 0.85 1.00 1.00
Indonesia A run 1.60 1.60 1.60 1.60 1.60 1.50 1.40 1.10 0.80 0.70 Bontang 1.70 2.00 2.00 2.00 2.30 2.30 2.30 2.65 3.00 3.54 Tangguh
(West Irian) 0.10 0.77 Total 3.30 3.60 3.60 3.60 3.90 3.80 3.70 3.75 3.90 5.01
Malaysia Bintulu (1,11) 0.80 1.20 1.60 2.06 2.06 2.06 2.06 2.06 2.06 2.80 Malaysia Ill (TIGA)*** 0.02 0.90 0.90 Total 0.80 1.20 1.60 2.06 2.06 2.06 2.06 2.08 2.96 3.70
Sakhalin II 0.80
Asia Total 5.30 6.51 7.01 7.47 7.77 7.67 7.57 7.64 9.46 14.74
Total World 7.96 9.49 10.09 11.05 12.45 13.10 14.78 17.24 20.78 30.70
Source: Cambridge Energy Research Associates. August 1999. · Note: The LNG gas 6utlook is included in the global gas outlook. *Includes LNG projects that are
1. Producing 3. Awaiting development with government approval 2. Under development or expansion 4. Not currently contemplated but likely to be producing by 2010
**Assumes conversion 1 mt per year= 47 Bet per year ***Grassroot project under development.
4

ecERA Table2
Liquefaction Infrastructure Liquefaction Capacity (mt) Trains Start-up
CountQl Project Operator Nameplate Present (total) Date Australia Northwest Shelf I, II NWS Joint Venture 7.50 N/A Brunei Lumut Brunei LNG 5.30 6.5 5 1972 Indonesia Arun Phase I PT Arun NGL 4.50 6.0 3 N/A Indonesia Arun Phase II PT Arun NGL 3.00 4.0 2 N/A Indonesia Arun Phase Ill PT Arun NGL 1.50 2.0 1 N/A Indonesia BontangA,B PTBadakNGL 3.20 5.2 2 1977 Indonesia Bontang C,D PTBadakNGL 3.20 5.2 2 1983 Indonesia Bontang E PT BadakNGL 2.30 2.6 1 Indonesia Bontang F PTBadakNGL 2.30 2.6 1 Indonesia Bontang G PTBadakNGL 2.70 2.7 1 Indonesia Bontang H PTBadakNGL 2.95 2.95 1 2000* Malaysia Bintulu MLNG1 MLNG1 7.40 8.1 3 1982 Malaysia Bintulu MLNG2 MLNG2 8.30 7.8 3 1995 Malaysia Bintulu MLNG3 MLNG3 6.80 6.8 2 2002* Abu Dhabi Das Island I ADGAS 5.30 2 1977 Abu Dhabi Das Island II ADGAS 2.30 1 1994 Algeria ArzewGL1Z Sonatrach 8.80 6 1978 Algeria ArzewGL2Z Sonatrach 8.80 6 1981 Algeria Arzew GL4Z (Camel) Sonatrach 1.10 1 1964 Algeria Skikda GLIK I Sonatrach 2.80 3 1972 Algeria Skikda GLIK II Sonatrach 3.00 3 1981 Libya Marsa El Brega NOC (Sirte Oil Co.) 2.60 4 1970 Oman Qalhat Oman LNG 6.60 2 2000* Qatar Qatargas Qatargas 4.00 2 1997 Qatar Ras Gas RasGas 6.60 2 2000* Trinidad Atlantic LNG Atlantic LNG 3.30 1 1999 USA Kenai Phillips Marathon 1.30 1 1969
Source: Cambridge Energy Research Associates. *Under construction and with sales contracts in place.
• Support facilities. These include gas gathering and/or transmission systems to move gas from the producing area to the liquefaction plant and provisioning facilities for the LNG vessels. In the case of an Alaskan LNG project, there is a particularly large transmission component, because of the need for an 800-mile pipeline to bring the gas from the North Slope fields to the liquefaction plant on the southern coast.
The major LNG markets are located in the Asia Pacific region, with Japan, Korea and Taiwan importing about 75 percent of the world's LNG. At present, Europe consumes essentially all of the remainder. The current economic conditions in Japan and Korea have created questions concerning the level of their future LNG growth rates. However, potential consumers in China could provide further opportunities.
The completion of the Bonny LNG facilities in Nigeria, the refurbishing of Algerian liquefaction facilities and the completion of the Atlantic LNG project in Trinidad has rejuvenated the LNG trade in Europe. Potential Brazilian markets are also being investigated. There are no LNG receiving facilities on the US West Coast, nor are there plans to install such facilities.
5
ecERA Table3
Existing LNG Receiving Terminal Infrastructure
Terminal Capacity Start-up Count(¥ Terminal Operator (Mcm 12er dal£} Date Japan Chita Toho Gas, Chubu EPC 24.0 1977 Japan Fukuoka Saibu Gas 1.2 1993
1 Japan Futtsu Tokyo EPC 38.3 1985 Japan Hatsukaichi Hiroshima Gas 0.4 1996 Japan Higashi Ohgishima Tokyo EPC 30.8 1984 Japan Himeji Osaka Gas, Kansai EPC 14.4 1979 Japan Himeji Joint Terminal Osaka Gas, Kansai EPC 13.0 1984
(Himeji II) Japan Kagoshima Nippon Gas 0.3 1996 Japan Kawagoe Chubu EPC 20.0 1997 Japan Negishi Tokyo Gas, Tokyo EPC 43.8 1969 Japan NewChita Chubu EPC, Toho Gas 32.0 1983 Japan Niigata Tohoku EPC, Nihonkai LNG 36.2 1984 Japan Ohita Kyushui EPC, Osaka Gas 12.0 1990 Japan Senboku I Osaka Gas 8.0 1972 Japan Senboku II Osaka Gas, Kansai Elec., 50.0 1977
Nippon Steel Japan Sendai New Port Sendai City Gas Bureau
Japan Shin Oita Kyushu Electric 11.4 1990 Japan Sodegaura Tokyo Gas, Tokyo EPC 103.6 1973 Japan Sodeshi/Shimizu Shizuoka Gas 1997 Japan Tobata-Kita Kyushu Kyushu EPC, Nippon Steel, et. al. 24.0 1977 Japan Yanai Chyugoku EPC 6.0 1990 Japan Yokkaichi Chubu EPC 29.4 1987 Japan Yokkaichi Works Toho Gas 2.4 1991 South Korea Inchon Korea Gas Corp. 25.0 1996 South Korea Pyeong Taek Korea Gas Corp. 41.0 1986 Taiwan Yung-An Chinese Petroleum Corp. 28.0 1990 India Dabhol Enron 2002* Belgium Zeebrugge Distrigaz 17.8 1987 France Fos-sur-Mer Gaz de France 22.0 1972 France Le Havre (closed) Gaz de France 1965 France Montoir Gaz de France 31.0 1980 Italy Panigaglia/La Spezia Snam 11.0 1969,
reopened 1995 Spain Barcelona Enagas 29.0 1970 Spain Cartagena Enagas 3.6 1989 Spain Heulva Enagas 10.8 1988 Turkey Marmara Ereglisi Botas 13.0 1994 UK Canvey lslanc~ (closed) British Gas 4.5 1964 USA Co~ve Point, MD (closed) Columbia LNG/PEPCO 28.0 1978 USA Elba Island, GA SONA T (EI Paso Energy) 15.0 1978
(filed to reopen) USA Everett, MA Distrigas Boston (Cabot Corp.) 13.0 1971 USA-__ Lake Charles, LA Trunkline LNG (CMS Energy) 20.0 1980/1989
Source: Cambridge Energy Research Associates. *Sales contracts and financing in place, some infrastructure, constructon contracts awarded.
6

ecEAA The major end-use market for LNG is in power generation. Japan, the largest LNG importer,
consumes about 70 percent of its LNG in this sector. However, once an anchor power generation market begins receiving LNG, the industrial and residential/commercial sectors begin to take advantage of the new energy source. Korea is an example of this process and now consumes about 50 percent of its imported LNG in the residential/commercial sector. This market sector expansion provides both growth and stability in the LNG market.
The contract terms for LNG have also been changing. Historically, LNG projects utilized rigid delivery schedules, long-term take-or-pay contracts with prices indexed to crude oil, and a minimum floor price for the product. Recent contracts, however, have begun a migration toward a shorter term, elimination of floor prices, and the use of multiple pricing indices. Delivery schedules are also becoming more relaxed and an LNG spot market is beginning to grow. These changes have created a stronger negotiating position for LNG buyers than for sellers, and for existing sellers than for new projects. The current Asian financial situation, combined with the numerous proposed LNG projects and expansions of existing facilities is having a similar impact.
Additional competition between sellers will be created over the next few years as many of the older, large-volume contracts reach the end of their primary term and are renegotiated. Since many of these older facilities will be essentially depreciated, the revised terms will put yet more pressure on new projects in comparison with existing facilities.
The environmental benefits of using gas are being increasingly recognized. In addition to improved air quality as a result of reduced nitrogen, sulfur, and particulate emissions during combustion, gas emits about 40 percent less carbon dioxide than an equivalent amount of coal (in terms of the heat produced) and 20-30 percent less than oil. Since carbon dioxide is the major greenhouse gas associated with global warming, this is an important advantage.
Despite these benefits, the competition confronting LNG is becoming increasingly strong. The primary competitors are
• Alternative fuels. Since the primary end-use market for LNG is power generation, . LNG must compete with low-cost coal burned in facilities using advanced, clean-coal
technology. It must also compete with light liquid hydrocarbons that can be burned to power the same combined-cycle turbines used by gas. Also, the growth in distributed power generation has seen increased use of diesel or low-sulfur fuel oil, which does not require construction of gas delivery systems.
• Alternative delivery systems. LNG also faces growing competition from natural gas delivered by pipeline. Improved materials, equipment, and techniques have allowed pipelines to be constructed in areas and under conditions previously considered economically prohibitive. The Sakhalin I project (in the Russian Far East) is looking to move gas by pipeline to both Japan and China. Eastern Siberian gas in the Irkutsk area is being investigated for transport by pipeline to China and potentially on to Korea.
• Geographic factors. The cost of LNG transportation makes distance between the liquefaction plant and the receiving terminal a significant competitive factor between LNG projects. In addition, and very relevant to Alaska, the distance and the terrain features between the gas-producing areas and the liquefaction plant are also major factors because they affect the inlet gas price. Other significant geographic factors are the local construction costs, infrastructure availability, and terrain conditions at the proposed liquefaction and port facility sites.
7

8CERA The Benefits of Utilizing LNG Delivery Systems
• Flexibility. LNG has a more flexible delivery system than a pipeline. Although there is a dedicated fleet of LNG tankers for each trade route, adjustments can be made as new markets develop. Since the ships operate on the high seas subject to established international maritime law, they are not subject to the issues faced by pipelines traversing multiple sovereign nations.
• Energy security. There is a growing desire in energy-consuming countries to diversify both the forms and the sources of their imports of primary energy. Since a single LNG project can supply multiple receiving terminals serving different markets, it can help satisfy this desire for diversity.
Major impediments must also be faced by LNG projects. They require the presence of both a major gas reserve and major markets capable of consuming large quantities of delivered LNG on a steady basis. Since global gas supply is readily available, the size, location, and capacity of markets become critical. Because both new and expansion LNG projects target the same markets, the following factors help to distinguish between potentially successful and unsuccessful ventures.
• Financing. The foundation for all financing is the LNG purchase and sales agreement. The ability of both the buyers and sellers to perform under the contract in case of adverse conditions is a critical factor. The recent trend is toward requiring the producers and project developers to absorb a greater part of this performance risk. On the other hand, individual project components such as gas supply, liquefaction, and shipping often have different owners. This allows separate financing and the ability to access different sources of funding.
• Project costs. Because future LNG contract prices will be market-based rather than cost-based, each individual cost component is significant. Since ownership generally varies between segments, each cost component must provide an adequate return. The different cost components include the initial capital costs of all LNG facilities and the pipeline to deliver gas to· the liquefaction plant, the cost of gas at the wellhead, and the operating cost of all components.
An Alaskan LNG Project An understanding of the background and current status of the global LNG trade allows a critical
review of the potential for an Alaskan project. Such a review includes the specific facilities required, the advantages enjoyed, and the obstacles to implementation that must be overcome.
The significant project components are
• An 800-mile, large-diameter pipeline from the North Slope to the southern coast of Alaska capable of delivering about 2 Bcf per day.
• Liquefaction facilities with a capacity of some 14 million tons per year of LNG together with necessary storage facilities.
• Port facilities for docking, provisioning, and loading cryogenic tankers. "'
• A dedicated fleet of 14 LNG tankers to move the product to multiple Asia Pacific markets.
8
l

ecERA The major project benefits are
• An LNG project incorporating a competitive cost structure, an acceptable wellhead gas price, and capable of being financed is one avenue to provide North Slope gas to the world market. Because of its capital-intensive structure, this alternative has long had the support of many Alaskans.
• In the future, as reinjection becomes less efficient at enhancing oil recovery, a major portion of the excess gas being reinjected could be sold, thereby unlocking assets at the time when the project comes onstream.
• Investment opportunities in major construction projects would be available and jobs would be created.
• Areas adjacent to the pipeline would have access to gas.
• The tax base would be enlarged and both state and federal governments would benefit through income taxes, royalties, and improved balance of payments.
Primary Obstacles to Implementation Because of the unique conditions in Alaska, it has long been recognized that project volumes
would need to be very large to cover the fixed costs involved. These volumes create marketing issues that must be evaluated. These two factors-project cost and marketing issues-are the major impediments to an Alaskan LNG project.
Project Cost There are certain fixed costs that are largely independent of project volumes, such as pipeline
rights of way, port facilities, site acquisitions, and various infrastructure requirements. However, most vary according to volume.
An 800-mile pipeline capable of supplying 2 Bcf per day of North Slope gas to the liquefaction plant would have a cost in the range of $4 billion. Permafrost conditions, terrain features, and other factors combine to more than double the cost per mile to build this line as compared with other North American projects.
Gas gathering and transmission costs of this magnitude are not present in other world LNG projects. To be competitive, the impact of this $4 billion must be offset by reductions elsewhere. The traditional areas investigated are in the wellhead cost of gas, innovative financing methods, and by increasing volumes to spread costs.
An innovative financing approach, albeit on a small scale, was recently proposed in Oregon to build a gas pipeline to a coastal region not currently being served. To finance a 65-mile pipeline, the state requested authorization to issue $20 million in bonds to be matched by a local bond issue in Coos County. A gas distribution company in the state agreed to commit $10 million. The pipeline would be owned by Coos County and operated by Northwest Pipeline. This approach apparently created favorable project economics by reducing income taxes and return requirements for the project. Variations of this concept may have application in Alaska. Regardless of the structure, lenders and bondholders will look closely at the reliability, credibility, and financial capacity of the owners, developers, and suppliers.
9

ecERA To cover pipeline costs by increasing volumes would require an Alaskan liquefaction plant
producing some 14 million tons per year. This would require the installation of five LNG units or trains and would be the largest liquefaction plant ever built at one time. Based on comparative world data, a plant of this size combined with storage, port facilities and a dedicated tanker fleet serving Asia Pacific markets would cost $8-$10 billion.
Utilizing these estimated component costs and assuming no tax breaks plus a wellhead cost of $1.00 per million Btu (MMBtu),* Alaskan LNG would require a delivered price in the range of $4.25-$4.50 per MMBtu-which corresponds to a competitive oil price of around $25 per barrel on world markets.
Marketing Issues The logical destination for Alaskan LNG is in the established consuming countries of Japan,
Korea, and Taiwan plus potential future consumers in China. However, their growth rates are subject to question owing to Asian economic conditions. The US West Coast is closer but it is unlikely that LNG receiving terminals could be sited along the US West Coast, because of long-standing public opposition.
Competition is very strong for LNG sales to Asia, both between LNG projects and with alternate fuels. Excluding volumes from a North Slope-sourced LNG project, CERA expects global LNG capacity capable of competing in the Asia Pacific market (LNG originating in Alaska's Cook Inlet, the Middle East, or Asia) to increase from 9.4 Bcf per day in 1999 to 21.5 Bcf per day in 2010, or 132 percent (see Table 1). Some of this supply increase will come from relatively low-cost expansions of existing facilities.
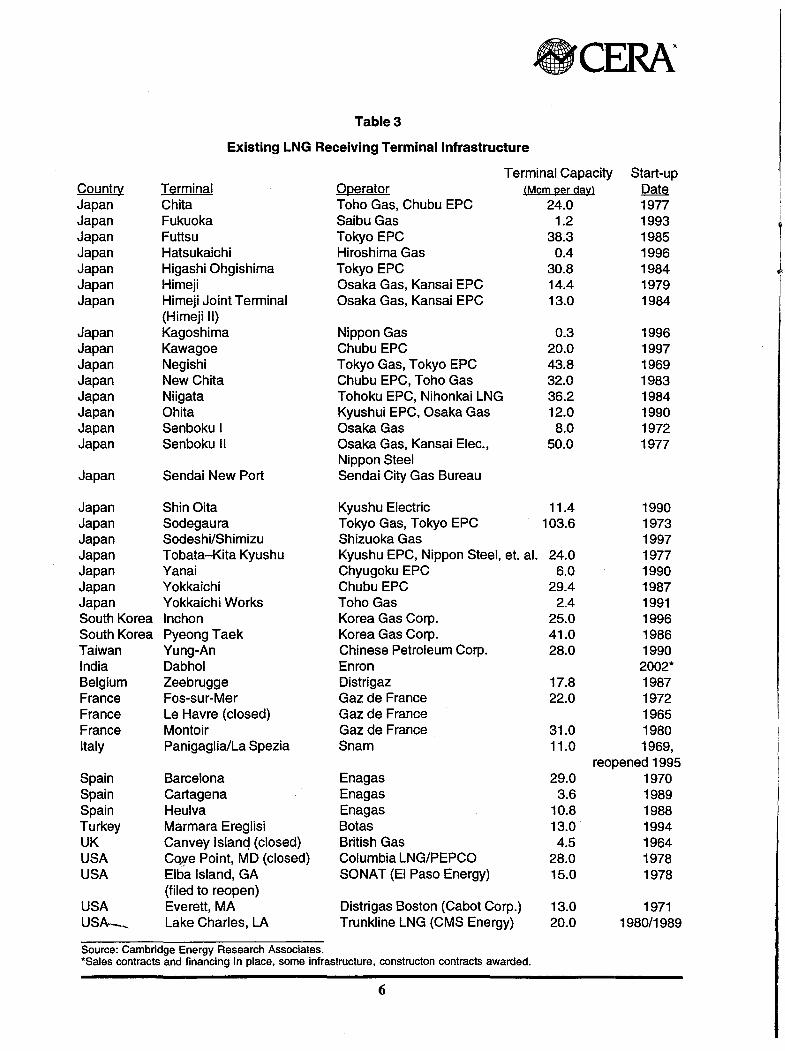
Historically, LNG sales prices have been tied to crude oil creating pricing volatility. Average Japanese prices have exceeded $4.00 per MMBtu for only 6 of the last 66 months, with landed prices in Japan ranging from $2.46 to $3.05 per MMBtu in May 1999 (Figure 1). These prices are well below the requirement of $4.25-$4.50 for a new North Slope LNG project.
New contracts are moving toward the utilization of a market basket of pricing indices including coal, oil, electricity, and pipeline gas plus other factors. Although this may dampen some of the volatility caused by oil price fluctuation, it may also reduce the average price.
A desire by importing countries to diversify supply sources might favor an Alaskan project, since LNG from the Cook Inlet supplies less than 3 percent of the Japanese market. However, a 14 million ton per year project (equivalent to 1.8 Bcf per day) is required to offset the impact on the project's cost of the North Slope pipeline. 14 million tons per year would provide more supply than the total growth of demand in Japan, Korea and Taiwan over many years. It is unlikely that nearby competition would allow Alaska to capture so much of this growth.
If a commercially feasible plan were decided today, it would be at least five to seven years before the product of an Alaskan LNG scheme would enter the world market. The reliance on future market conditions will be critical in securing the necessary financial commitments to such a plan.
'To compare the economics of the three options for monetizing Alaska's gas reserves (LNG, an export pipeline, and GTL), CERA has assu~the same wellhead gas price of $1.00 per MMBtu in each case. This figure represents a typical target for the gas producers' netback value. Higher (or lower) gas costs at the wellhead would result in correspondingly higher (or lower) competitive thresholds for each of the different options.
10
'~
l
us
7.00
6.00
5.00
Dollars 4.00
MM~:~ 3.00
2.00
1.00
Figure 1
The Japanese LNG Market: Stability and Growth
Delivered Price
-Indonesia - • Alaska - • Malaysia - Australia - Qatar -- Brunei 0.00 ..._ ______________ _
Million Tons
'89 '90 '91 '92 '93 '94 '95 '96 '97 '98
5
4
3
1
Monthly Import Volumes
'90 '91 '92 '93 '94 '95 '96 '97 '98
Source: Cambridge Energy Research Associates. 90623-6
Export Pipeline Project
Industry Overview
ecERA
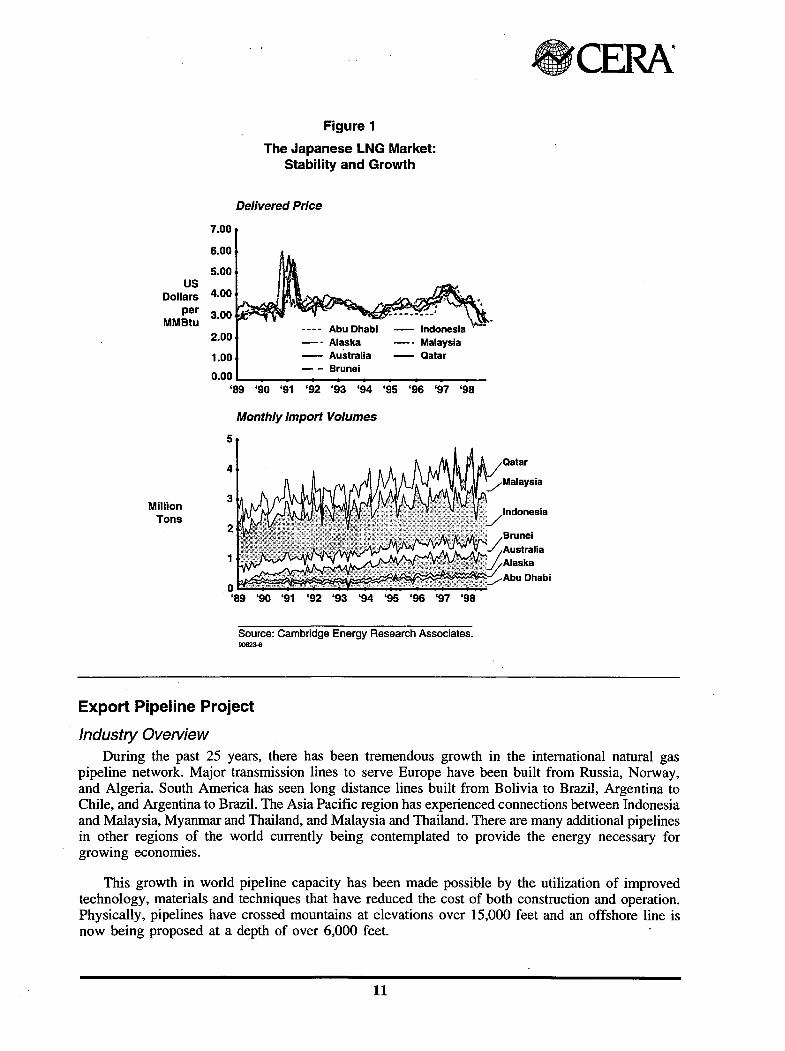
During the past 25 years, there has been tremendous growth in the international natural gas pipeline network. Major transmission lines to serve Europe have been built from Russia, Norway, and Algeria. South America has seen long distance lines built from Bolivia to Brazil, Argentina to Chile, and Argentina to Brazil. The Asia Pacific region has experienced connections between Indonesia and Malaysia, Myanmar and Thailand, and Malaysia and Thailand. There are many additional pipelines in other regions of the world currently being contemplated to provide the energy necessary for growing economies.
This growth in world pipeline capacity has been made possible by the utilization of improved technology, materials and techniques that have reduced the cost of both construction and operation. Physically, pipelines have crossed mountains at elevations over 15,000 feet and an offshore line is now being proposed at a depth of over 6,000 feet.
11

ecEAA Although the worldwide expansion of gas pipelines tends to showcase the growing capability of
moving and marketing natural gas, the progress in North America is of more direct interest to Alaskans. Not only is North America the largest gas market in the world, it is physically possible to connect Alaskan reserves to this market by pipeline.
The choice between moving gas to the lower-48 by pipeline across Canada, as compared with an Alaskan pipeline to tidewater combined with an LNG project, was hotly debated during the late 1970s. The Alcan pipeline to Canada was selected but was never built, owing to its high construction cost combined with the decline in US gas prices beginning in the early 1980s.
Substantial changes have occurred since that time in the US natural gas supply and demand situation and in the pipeline architecture of North America. Deregulation of natural gas and passage of the Canada-United States Free Trade Agreement and the North American Free Trade Agreement (NAFTA) removed many of the issues associated with importing Canadian gas into the United States and moving gas across the borders of the United States, Canada, and Mexico. The Canadian native claims that previously affected pipeline construction have also been resolved. All of these changes suggest a review of the future US gas market and the role played by pipelines would be beneficial in evaluating the alternatives for Alaskan gas.
US Natural Gas Supply and Demand US consumption of natural gas totaled 21.5 trillion cubic feet (Tcf) in 1998 (equivalent to 59 Bcf
per day) and is projected to grow to 30 Tcf in the 2010-15 period. This growth rate has focused attention on the potential sources of supply necessary to meet this demand. The expected near-term decline in Gulf of Mexico production will be largely offset by increased Canadian imports. This is possible because of almost 3.0 Bcf per day of new pipeline capacity expected to be in service by the end of 2000. The critical questions beyond 2000 are the new sources of supply and the availability of transmission capacity to serve this rate of growth. These sources would be in addition to increased activity in currently producing basins.
The deepwater area of the Gulf of Mexico will be a premier potential supply source because of its high volume and proximity to existing pipeline capacity. However, renewed interest will also be kindled in exploration off the coast of eastern Canada due to the market connection provided by the soon-to-be-completed Sable Island pipeline.
Another area of emerging interest is the Northwest Territories in Canada, where significant gas discoveries have recently been made. The anticipated expansion of the pipeline grid to connect these new supplies would also place the 12 Tcf of proven reserves in the Mackenzie Delta closer to a market outlet. These developments have strengthened the claims of an alternative route to the Alcan pipeline. On this approach, the proven reserves in both the North Slope area and the Arctic Islands would connect to the expanding pipeline grid via an offshore link to the Mackenzie Delta (see Figure 2).
Key Markets The primary driver of increased US gas demand is the power generation sector. The Department
of Energy, in its 1998-2007 power plant inventory forecast, projects that 88 percent of new utility generators will be fired by· natural gas. Increasingly stringent air quality standards make gas the preferred fuel for 'both new generation and the replacement of existing coal-fired plants. The residential, commercial, and industrial sectors will also grow but not at the rate of power generation.
12

Figure2
Alaskan Gas Pipeline Alternatives
Source: Cambridge Energy Research Associates. 90709-2
Pipeline Transportation Costs
ecERA
Both the capital and operating costs of major gas transmission systems have declined in real terms since the late 1970s, when Alaska initially considered transporting gas to the lower-48. The Gas Research Institute projects transmission costs will decline an additional 9 percent and distribution costs by 32 percent by 2015.
Recent pipeline construction has also shown improved competitive cost features. The Alliance Pipeline currently under construction from Northeast British Columbia to Chicago has a projected total capital cost of $3 billion. This cost includes 476 miles of lateral lines in addition to the 1,858 miles of large diameter transmission line. The system will transport 1.325 Bcf per day at a toll near $1.00 per MMBtu.
13

8CERA Contract Terms
Regulatory authorities have both introduced and allowed change in the relationship between pipeline owners, operators, and shippers. Pipelines are open access and provide transportation on a first-come, first-served basis. Transportation contracts are of shorter duration and have greater flexibility than the 20-25 year commitments of the past.
A very strong gas market combined with regulatory action has shifted more of the risk of building new pipelines toward the owners and producers utilizing the system. This has not prejudiced project financing of new pipelines as witnessed by the 80 percent nonrecourse debt financing of the Alliance Pipeline.
Competition Gas delivered by pipeline in North America faces strong competition from alternative fuels and
between sources of supply accessed by individual pipeline projects. LNG imports currently provide less than 1 percent of total US consumption but are expected to grow with the planned reopening of the Elba Island terminal on the US East Coast and the expansion by Cabot in Boston.*
Coal is the primary fuel competitor for gas because of its dominant position in power generation. Gas is challenging this dominance through the efficiency of combined-cycle gas turbine technology and the stringent emission standards affecting coal-burning installations. Packaged gas turbine units are also available in much smaller sizes than coal-fired plants.
The growth in the North American pipeline infrastructure and its expanding capacity has narrowed the basis differential between sources of supply in major producing basins (Figure 3). The projected demand growth for gas of about 40 percent over the next 10-15 years will require new supply sources, new transmission capacity and a competitive basis differential for all major supply sources.
Benefits of Transporting Gas by Pipeline In North America, there are several major benefits captured by moving gas by pipeline. Chief
among these are
• Large volumes can be moved by pipeline. They are also readily expandable at a relatively low cost by adding compression or looping sections of the line.
• New pipelines provide access to lower cost energy to consumers along the pipeline route. This encourages the development of new markets and increases pipeline volume and load factors.
• North American pipelines feed into and become a part of the total network. This network or grid of over 1 million miles of pipe provides access to many regional markets, allowing the addition of incremental supply without dependence on the creation of specific new markets.
• Pipelines have long lives. Many sections of the North American system have been in operation over 50 years without significant reduction in capability.
'"
*Seabom.!ransportation costs of the LNG from the liquefaction plant to the receiving terminal are a significant component of the overall cost of LNG delivered to customers. Because of the distance between a liquefaction plant in Alaska and receiving terminal on the US East Coast, such terminals are unlikely to be a logical destination for ANS gas.
14
(I
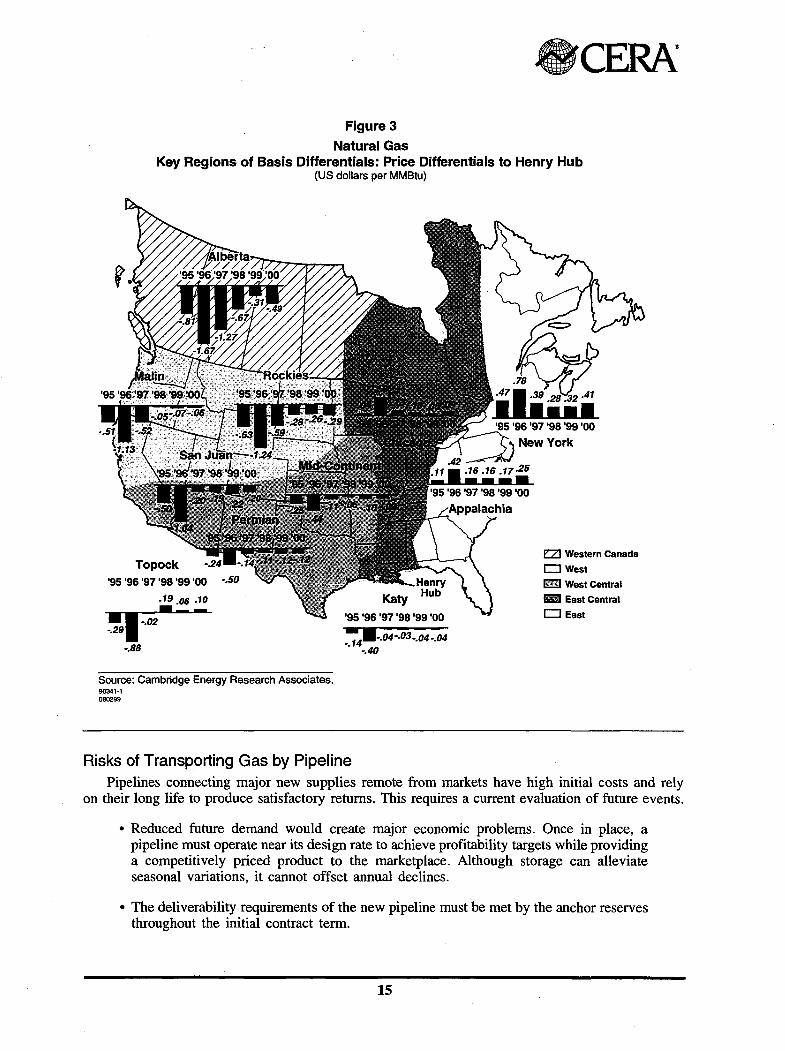
Figure 3
Natural Gas
•cERA
Key Regions of Basis Differentials: Price Differentials to Henry Hub (US dollars per MMBtu)
Topock '95 '96 '97 '98 '99 '00
.19.06 .10 ----~-.02 -.29
-.88
Source: Cambridge Energy Research Associates. 90341-1 080299
'95'96'97'98'99'00
::"4•-.04-.03 -.04 -.04 -.40
Risks of Transporting Gas by Pipeline
EZ1 Western Canada DWest rml West Central 11!11!1 East Central DEast
Pipelines connecting major new supplies remote from markets have high initial costs and rely on their long life to produce satisfactory returns. This requires a current evaluation of future events.
• Reduced future demand would create major economic problems. Once in place, a pipeline must operate near its design rate to achieve profitability targets while providing a competitively priced product to the marketplace. Although storage can alleviate seasonal variations, it cannot offset annual declines.
• The deliverability requirements of the new pipeline must be met by the anchor reserves throughout the initial contract term.
15

ecEAA • Both the gas purchasers and sellers must be able to survive price volatility.
• The opposition to the building of new pipelines for environmental and other reasons is increasing. Although more restrictive requirements can generally be accommodated, the process requires time for resolution and incurs additional cost.
Alaskan Export Pipeline Project Project components for a pipeline that was built along the original Alcan highway route to supply
gas to the expanding US market would include:
• 730 miles of large-diameter pipeline in Alaska
• 513 miles in the Yukon
• 440 miles in British Columbia to reach the Alberta border
By the time the new pipeline reached the Alberta border, it would have connected with or be in close proximity to major transmission lines owned by Westcoast, Foothills, the TransCanada-Nova system and the new Alliance pipeline. At that point, the Alaskan line would be connected to the North American grid.
There is a shorter total distance to be covered for such a connection via the Mackenzie Delta (about 1,100 miles compared with over 1,600), but the Alaskan portion consists of only 220 miles, offshore the North Slope.
On either route, the project would also require the necessary compression and chillers to move the gas and protect the permafrost environment. Permits and a right-of-way would need to be acquired-unlike the route from Prudhoe Bay to Valdez (to deliver gas for an LNG project) where Yukon Pacific has already obtained many of the necessary permits for a gas pipeline and a right-ofway exists.
The estimated cost of either export pipeline lies in the range of $5-$6 billion. This excludes the cost of downstream expansion, which would also be required unless Canadian supply proved insufficient to fill existing capacity for both the domestic and export markets. However, pipeline expansion would be less costly than new project capacity.
Project Benefits • A large portion of the gas currently being reinjected would be sold, removing the need
for additional injection facilities and monetizing stranded assets, with substantial additions to the tax base
• Connection to the largest gas market in the world with demand projected to grow by 40 percent over the next 10-15 years
• The large volume outlet could encourage additional exploration and development in Alaska " ·
• If the Alcan route were the more economic, major pipeline construction in Alaska and access to gas service by Alaskans along the pipeline route ---
16
ecERA Obstacles to Implementation
Impediments to implementing a pipeline export project fall in the general categories of market risk and financing issues. There is also an internal obstacle in the form of strong support in Alaska for the pursuit of an LNG project.
Market risk-Competition from Other Suppliers Despite connection to the North American grid, the Alaskan reserve would be the most distant
from end-users. CERA estimates that it would cost about $1.50 per MMBtu to move North Slope gas to Alberta by the Alcan route, but perhaps only $0.80-$1.00 via the Mackenzie Delta. The cost of transport from Alberta to the Chicago market is $0.90-$1.00. Assuming an average price differential of $0.10 between Chicago and the basic US gas pricing point at Henry Hub, Louisiana, and a wellhead price for gas on Alaska's North Slope of $1.00 per MMBtu, these data imply that the project could be competitive with gas prices of around $3.00 (or even below) at the Henry Hub. CERA projects an average Henry Hub price of $2.53 per MMBtu in 2000.
Canadian and US producers would likely oppose such a project because of their reluctance to share the growing gas market.
It would take five to seven years to complete the project after a commercially feasible plan was decided. The volatility of the gas market makes such a long gestation period an area of major risk.
Financial Risk-Burden Shifted to Pipeline Developers and Producers Federal Energy Regulatory Commission (FERC) regulation has shifted more of the financial risk
to pipeline developers and producers.
• Contracts covering pipeline capacity are moving toward shorter terms and negotiated rates.
• Lenders will be looking for assurances from developers, producers, and the state.
• Environmental opposition to the building of a new pipeline in both Alaska and Canada could require rerouting and construction delays and result in higher costs.
Gas-to-liquids Project
Industry Overview The past few years have seen strong global interest in the technology for converting natural gas
into high-quality liquids. This interest has been driven by the presence of large volumes of available natural gas located far from markets, the worldwide pressure to eliminate natural gas flaring, and the tightening of liquid fuel specifications to reduce emissions and improve air quality.
One commercial-size GTL plant is operated by Shell in Malaysia. It produces 12,500 barrels per day (bd) of middle distillates plus some very high-quality wax products from a feedstock of l 00 MMcf per day of natural gas. (Sale of the wax by-products has greatly improved the project economics of that plant.) Two other commercial-size GTL projects have also been built, both in response to unique economic incentives. In South Africa, government backing helped build three 7,500 bd plants in response to energy security issues that resulted from limitations on crude oil imports. In New Zealand, the remote location combined with availability of natural gas and dependence on refined products imports provided a particular economic incentive to build a 11,500 bd GTL plant to produce gasoline.
17

ecERA Progress continues in the development of the technology and many of the largest energy companies
are actively involved in the research and development (R&D) process. For example, ARCO has just completed a GTL pilot plant at their Cherry Point, Washington, refinery to be used for testing a new design and high performance process.
Although several large GTL plants have been proposed over the past few years, progress has been slowed owing to the recent low oil prices and the lack of major technological advancements to improve the economic viability of the process. However, research is continuing on many fronts because of the significant profit potential in monetizing stranded gas.
Products of Conversion The naphtha, kerosene, and distillate fractions produced by a GTL plant are very low in
contaminants such as sulfur and nitrogen, making them highly desirable blending components. Diesel fuel enhanced with GTL distillates could provide major improvements in emissions in the battle for cleaner air.
Cost of Conversion The economics of a GTL project are defined by the cost of feedstock gas and the world price
for oil. Using current technology, CERA believes a project with a $1.00 per MMBtu inlet gas cost could achieve a 15 percent rate of return,* assuming a world oil price equivalent to $25 per barrel WTI equivalent and assuming no liquids production with the gas (a GTL plant on the North Slope would require a world oil price $2-$3 higher for the same return, because of pipeline costs between the Slope and Valdez). Although such economics might support a demonstration project, they must be improved before large GTL plants can be financed in a world of volatile oil prices. A target of achieving acceptable financial returns in a world oil price environment of $12-$15 per barrel WTI equivalent has been cited by several companies.
Key Markets The GTL products are readily saleable throughout the world-including places like the US West
Coast, where emissions and air quality standards are very stringent. Densely populated areas in the Asia Pacific region with heavy vehicular traffic and poor air quality would also be high-quality markets._
Competition GTI... competition is expected to come from two primary sources. A traditional, external competitor
would be the existing petroleum refining sector. Upgrading in the form of more intense refinery processing (including hydrocracking and high-pressure hydrotreating) would help meet tighter diesel specifications. However, this approach is becoming increasingly complex and expensive.
Another competitor is internal to the GTI... industry and is reflected in the specific location of GTL plants in relation to markets and the type of natural gas available. Utilization of associated gas produced with oil and currently being flared or reinjected could provide more favorable economics than using nonassociated gas. Associated gas is usually cheaper because the cost of finding, developing, and producing is,; shared with oil.
The products of the GTL process will be in demand in the marketplace. The cost of producing and delivering these products to market will be the criteria defining project succe~s or failure.
*In many cases, oil and gas companies seek higher rates of return on their investments than 15 pecent.
18

ecERA Benefits of the GTL Process
• The existence of a world market for the GTL products.
• The utilization of producing facilities already in place when associated gas is the feedstock.
• Since the primary products can be moved through oil pipelines, the need for a costly gas pipeline is eliminated.
• Shipping the product to market does not require the expensive dedicated vessels required for LNG. For that reason, distance from markets is not as critical as with pipeline gas or LNG.
Impediments to the GTL Process • The technology is currently in the pilot or demonstration phase. Although several
companies have announced plans for large commercial projects, construction has not yet begun. Project economics must be proven on larger scale plants before financing will become readily available.
• The shelf life of any competitive advantage created by a particular technological breakthrough may be relatively short because of the extent and intensity of the research in progress.
• The volatility of world oil prices will continue placing GTL project economics under stress.
An Alaskan GTL Project
Benefits • Unlike the pipeline or LNG alternatives, a GTL project can be developed in stages
reducing technological and financial risks.
• Products can be shipped on a batch basis through the existing TAPS line that will continue to have available capacity. This will extend the economic life of the pipeline, reduce the cost of transporting all liquids and enhance the value of this pipeline asset. This may require the construction of additional storage.
• GTL may also be blended with ANS crude, although this would not allow producers to capture the full value of the GTL components.
• A GTL project could provide the earliest method for monetizing gas reserves for the benefit of all stakeholders, with minimum exposure of capital.
• Alaska is geographically close to consumers in the US West Coast and in the Asia Pacific region.
• Environmental opposition would be significantly less than for a pipeline or LNG alternative.
• Because of the gas volumes involved and the flexibility in expansion, the pursuit and later development of either a major LNG or pipeline project is not compromised.
• Significant facilities would need to be constructed on the North Slope.
19

ecERA· Obstacles
• The cost of building a demonstration plant on the North Slope to verify the technology and economics would likely cost 25-30 percent more than construction in more accessible and less environmentally challenging areas.
• A North Slope GTL plant with a $1.00 per MMBtu inlet gas cost would require a $27-$28 per barrel equivalent WTI to achieve a 15 percent rate of return. This $2-$3 per barrel higher world oil price is required because of the pipeline charge between the producing area and Valdez.
• The desire for gas service that would be made possible by the building of a gas pipeline would not be realized.
• Initially only a small volume of gas would be used.
Status of GTL in Alaska BP Amoco has announced plans to build a $70 million demonstration plant on the North Slope,
with a planned start-up date in late 2001. Depending on the success of this plant, BP Amoco is contemplating that construction of the first phase of a commercial-scale plant (e.g., 30,000 bd) could begin some time in 2005, with completion in 2007 or 2008, though timing and feasibility remain uncertain.
Conclusions The primary obstacle to monetizing North Slope gas is the distance it must be moved to enter
the market whether in the gaseous or liquid state. To be competitive, each of the gas utilization alternatives must find ways to offset the cost of transportation from the North Slope to Valdez or to Canada.
A large volume Alaskan LNG project utilizing traditional financing and ownership methods and attempting to sell in the long-term competitive market in the Asia Pacific region is not yet economically competitive. The LNG volumes required to spread the costs involved would overwhelm the prospective markets. The average LNG market price in Japan over the last five years has been less than the cost of producing and delivering Alaskan LNG at the volumes analyzed. However, there have been financing innovations involving government-backed bond issues on a small pipeline project in Oregon that might be worthy of investigation.
Initiating a major export pipeline project would require confidence in projected high growth rates in gas demand and the prospect for reduced supply from the currently producing basins in North America. The expected price of gas in constant dollars would also need to be close to $3.00 per MMBtu at Henry Hub in order to achieve an acceptable wellhead price. The potential for such conditions is too speculative today to support project initiation.
A small-scale GTL demonstration plant is the only gas alternative that could be operational within two to three years. Although the initial gas volumes would be relatively small, major expansions could be made following verification of project economics. The cost of converting gas and moving it as a liquid to Valdez is far less than the cost of transporting gas due to available capacity in the TAPS facility. A GTL proj'ect would not jeopardize either the pursuit or the implementation of the other two alternatives.
Under the most favorable of circumstances, neither the LNG nor the pipeline export alternative involving large volumes could be in place for five to seven years after a commercially feasible plan is deemed. Continued gas injection is both a fallback position and a requirement for many years.
20
r