whitepaper using bibliometrics - clarivateips.clarivate.com/m/pdfs/325133_thomson.pdf ·...
TRANSCRIPT
A guide to evAluAting reseArch performAnce with citAtion dAtA
scientific
WHITEPAPERusing BiBliometrics:
. . . . . . . . . . . . . . . . . . . . . . . . . . . . . . . . . . . . . . . . . . . . . . . . . . . . . . . . . . . . . . . . . . . . . . . . . . . . . . . . . . . . . . . . . . . . . . . . . . . . . . . . . . . . . . . . . . . . . . .USING BIBLIOMETRICS
“A liBrAry fAced with collection
decisions, A foundAtion
mAking funding choices,
or A government office
weighing nAtionAl reseArch
needs must rely on expert
AnAlysis of scientific
reseArch performAnce.”
. . . . . . . . . . . . . . . . . . . . . . . . . . . . . . . . . . . . . . . . . . . . . . . . . . . . . . . . . . . . . . . . . . . . . . . . . . . . . . . . . . . . . . . . . . . . . . . . . . . . . . . . . . . . . . . . . . . . . . .USING BIBLIOMETRICS
why evAluAte reseArch performAnce?counting, measuring, comparing quantities, analyzing measurements: quantitative analysis is perhaps the main tool of science. scientific research itself, and recording and communicating research results through publications, has become enormous and complex. it is so complex and specialized that personal knowledge and experience are no longer sufficient tools for understanding trends or for making decisions. yet the need to be selective, to highlight significant or promising areas of research, and to manage better investments in science is only increasing.
those in universities, government offices and labs, and boardrooms must decide what research should be supported and what should not, or which research projects and researchers should receive more support than others. until relatively recently, peer review was the main route by which science policymakers and research funders made policy decisions about science.
A library faced with collection decisions, a foundation making funding choices, or a government office weighing national research needs must rely on expert analysis of scientific research performance. increasingly, universities everywhere must demonstrate their special capabilities to a variety of constituencies. for example, in some countries universities that were once run by the government are in the process of becoming private operations. for the first time, these universities must identify a mission, develop a strategy for meeting it, and market themselves to students and supporters—as do all private institutions.
in other countries, both public and private universities that seek research funding from government agencies and foundations must provide evidence of their accomplishments and capacities. And in many countries, universities, whether public or private, must account for their performance as part of national or professional accountability protocols. indeed, every university must have a clear, evidence-based understanding of the institution’s performance towards its goals and mission. this understanding is achieved and maintained through ongoing evaluation of all of the institution’s functions.
Because research is a central function, the university must evaluate its performance. data on research performance helps to inform strategic decisions about what areas of research to support or build. it also helps the university leaders understand the institution’s position relative to global and domestic standards of research production: how much research is conducted? what is its impact? how many of the faculty members’ articles are published in first-class journals? is that number of publications increasing or decreasing?
with solid, objective information about production and impact, the university has a strong basis for setting goals, charting progress, making budgetary and hiring decisions, investing in facilities, and working with external agencies.
how cAn reseArch Be evAluAted?BIBlIomETRIcsBibliometrics (sometimes called scientometrics) turns the main tool of science, quantitative analysis, on itself. there are various definitions used for “bibliometrics.” essentially, bibliometrics is the application of quantitative analysis and statistics to publications such as journal articles and their accompanying citation counts. Quantitative evaluation of publication and citation data is now used in almost all nations around the globe with a sizeable science enterprise. Bibliometrics is used in research performance evaluation, especially in university and government labs, and also by policymakers, research directors and administrators, information specialists and librarians, and researchers themselves.
Bibliometrics and peer Judgment: A two-pronged Approachthe two together—peer review and quantitative analysis of research—better inform evaluation. Quantitative analysis offers certain advantages in gathering the objective information necessary for decision-making:
Quantitative analysis of research is global in •perspective, offering a “top-down” review that puts the work in context, complementing the local perspective of peer review. Quantitative research analysis provides data on all activity in an area, summaries of these data, and a comprehensive perspective on activity and achievements. weighted quantitative measures, such as papers •per researcher or citations per paper, remove characteristics, such as the place of production or past reputation, that color human perceptions of quality.
for example, when we think of “the best,” it is hard not to think automatically of the biggest producers, such as individuals, labs, and universities; but those locations might not be the source of the most important work. likewise, quantitative analysis indicates current top performers, thus balancing human perceptions of reputation.
the global and cross-sectoral indicators of citation analysis can, for example, pinpoint a paper as being in the top one percent in the world or reveal that the organization is within the top 50 in a specific area. citation data serve as an objective and quantitative indicator for evaluating research performance, and provide additional information for assessments. while bibliometrics is a valid form of assessment, it is important that data and method of analysis selected is
using BiBliometrics:A guide to evAluAting reseArch performAnce with citAtion dAtA
. . . . . . . . . . . . . . . . . . . . . . . . . . . . . . . . . . . . . . . . . . . . . . . . . . . . . . . . . . . . . . . . . . . . . . . . . . . . . . . . . . . . . . . . . . . . . . . . . . . . . . . . . . . . . . . . . . . . . . .USING BIBLIOMETRICS
appropriate to the purpose of the evaluation (please see the thomson reuters document “using Bibliometrics in evaluating research” for additional guidance on proper use of bibliometric indicators, at http://www.isiwebofknowledge.com/media/pdf/10reasons.pdf).
THE GRoWInG UsE of BIBlIomETRIcsfor these reasons and others, nations with significant science enterprises have embraced bibliometrics. today, bibliometrics programs with large teams of analysts are firmly established in many nations, and these groups issue bibliometric reports, often called science indicators studies, at regular intervals. A few such groups are the national science foundation (united states); the european commission; france’s l’observatoire des sciences et des techniques (ost); and Japan’s national institute for informatics (nii), national institute for science and technology policy (nistep), and ministry of economy, trade and industry (meti). other nations with active bibliometrics groups include Argentina, Australia, Belgium, Brazil, chile, china, finland, france, germany, israel, italy, the netherlands, new Zealand, norway, portugal, south Africa, south korea, spain, sweden, switzerland, and taiwan. in almost all cases, the publication and citation data of thomson reuters form the basis of their bibliometric analyses.
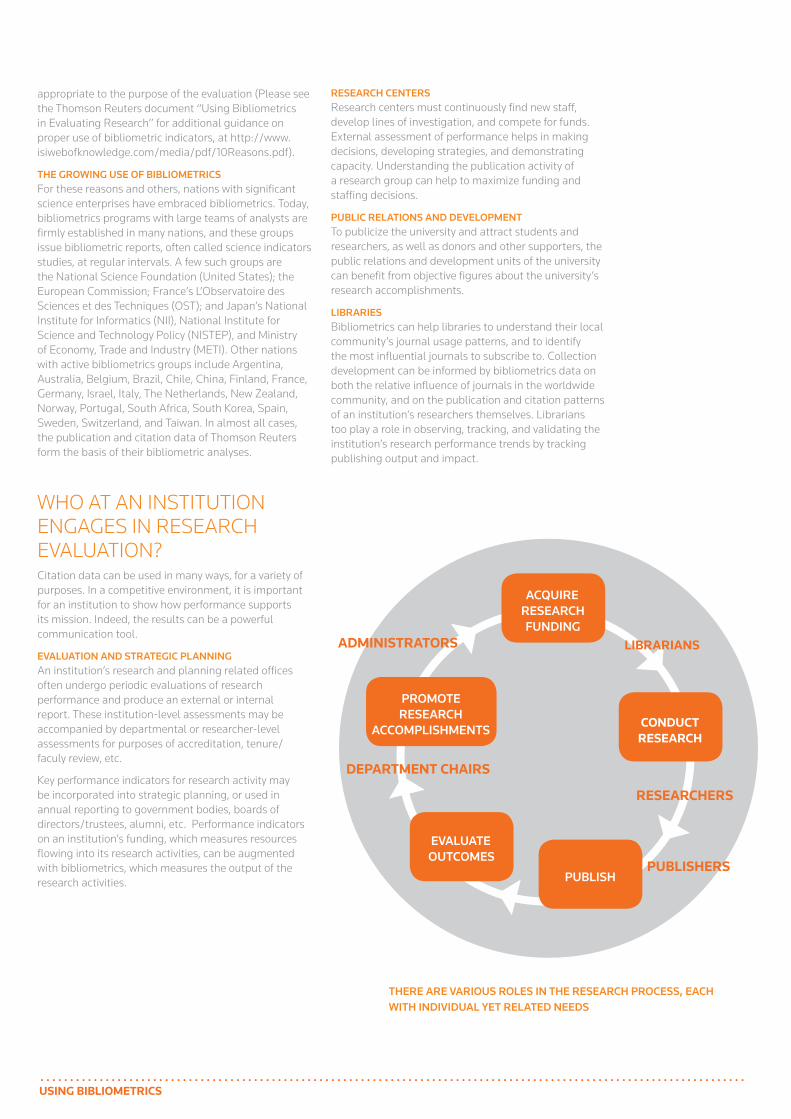
who At An institution engAges in reseArch evAluAtion?citation data can be used in many ways, for a variety of purposes. in a competitive environment, it is important for an institution to show how performance supports its mission. indeed, the results can be a powerful communication tool.
EvAlUATIon And sTRATEGIc PlAnnInGAn institution’s research and planning related offices often undergo periodic evaluations of research performance and produce an external or internal report. these institution-level assessments may be accompanied by departmental or researcher-level assessments for purposes of accreditation, tenure/ faculy review, etc.
key performance indicators for research activity may be incorporated into strategic planning, or used in annual reporting to government bodies, boards of directors/trustees, alumni, etc. performance indicators on an institution’s funding, which measures resources flowing into its research activities, can be augmented with bibliometrics, which measures the output of the research activities.
REsEARcH cEnTERsresearch centers must continuously find new staff, develop lines of investigation, and compete for funds. external assessment of performance helps in making decisions, developing strategies, and demonstrating capacity. understanding the publication activity of a research group can help to maximize funding and staffing decisions.
PUBlIc RElATIons And dEvEloPmEnTto publicize the university and attract students and researchers, as well as donors and other supporters, the public relations and development units of the university can benefit from objective figures about the university’s research accomplishments.
lIBRARIEsBibliometrics can help libraries to understand their local community’s journal usage patterns, and to identify the most influential journals to subscribe to. collection development can be informed by bibliometrics data on both the relative influence of journals in the worldwide community, and on the publication and citation patterns of an institution’s researchers themselves. librarians too play a role in observing, tracking, and validating the institution’s research performance trends by tracking publishing output and impact.
THERE ARE vARIoUs RolEs In THE REsEARcH PRocEss, EAcH WITH IndIvIdUAl YET RElATEd nEEds
AcQUIRE
REsEARcH fUndInG
EvAlUATE oUTcomEs
PUBlIsH
PRomoTE REsEARcH
AccomPlIsHmEnTs
RESEARCHERS
PUBLISHERS
CONDUCT RESEARCH
DEPARTMENT CHAIRS
ADMINISTRATORS LIBRARIANS
. . . . . . . . . . . . . . . . . . . . . . . . . . . . . . . . . . . . . . . . . . . . . . . . . . . . . . . . . . . . . . . . . . . . . . . . . . . . . . . . . . . . . . . . . . . . . . . . . . . . . . . . . . . . . . . . . . . . . . .USING BIBLIOMETRICS
. . . . . . . . . . . . . . . . . . . . . . . . . . . . . . . . . . . . . . . . . . . . . . . . . . . . . . . . . . . . . . . . . . . . . . . . . . . . . . . . . . . . . . . . . . . . . . . . . . . . . . . . . . . . . . . . . . . . . . .USING BIBLIOMETRICS
whAt types of dAtA Are used in BiBliometrics?the results that citation analysis yields are statistically significant because of massive and systematic data collection. this is the reason that thomson reuters’ citation index, accessible via Web of Science®, is used as the worldwide standard for bibliometrics.
for over 50 years, thomson reuters has comprehensively collected data across academic fields, from natural sciences to social sciences and humanities. highly reliable statistical analysis of the data is possible because of thomson reuters’ consistent policy on indexing and storing data. A citation index for science was first described in 1955 by eugene garfield, the founder and chairman emeritus of what was then isi, in the journal Science. he realized his vision a few years later with the production of the 1961 Science Citation Index®. the operating principle of a citation index is this: if a researcher knows of a publication important to his or her work, a citation index would allow the researcher to identify journal articles published subsequent to that work which have cited it.
it did not escape garfield’s notice that such a database could serve other purposes as well, such as monitoring and analyzing the structure and growth of science. the combination of an ever-growing corpus of publication and citation data compiled by isi over the 1960s and 1970s and the simultaneous increase in computing power and software applications, especially those developed in the 1980s and 1990s, has made bibliometrics a practical and even cost-effective pursuit.
Web of Science now includes not only the Science Citation Index, but also the Social Science Citation Index®, the Arts and Humanities Citation Index®, Index Chemicus®, and Current Chemical Reactions®, resulting in a truly multidisciplinary citation resource. Web of Science, which now covers nearly 9,300 high-quality, core journals from every field, is used by over 3,400 organizations and universities in more than 90 countries around the world. in addition, statistical values based on the collected information serve as significant indicators for science and technology in many government organizations.
covERInG coRE joURnAlsA relatively small core of research literature is frequently cited, while the remainder is not cited at all: 10 percent of research literature accounts for as much as 90 percent of citations. in addition, important research that earns a large number of citations in one field is also frequently cited in other fields. Because a collection of core literature in any one field may provide researchers in other fields with necessary literature, thomson reuters’ multidisciplinary citation index was created.
covERInG All TYPEs of ITEmsin order to maintain statistical integrity, thomson reuters’ citation index includes all items published in the selected journals. this includes the primary vehicles of disseminating research results, such as articles and reviews, but also includes editorials, letters, book reviews, etc. one can limit a bibliometric analysis to only articles and reviews, or choose to include the more marginal document types.
covERInG All AUTHoRs And THEIR oRGAnIzATIonsWeb of Science consistently includes the authors’ names and the names of the organizations the authors are affiliated with, and does so according to uniform protocols.
whAt does BiBliometrics meAsure?THE dEvEloPmEnT of PUBlIcATIon And cITATIon AnAlYsIsthere are many activities and outcomes of research that can be counted. perhaps the most basic and common is the number of scholarly journal publications, which may be used as a measure of output. citations are the references researchers append to their papers to explicitly show earlier work on which they have depended to conduct their own investigations. tracking citations and understanding their trends in context is a key to evaluating the impact and influence of research.
As described in eugene garfield’s reasons for citing a paper, the citations in academic papers create a record of influence. motivations for citing a prior work can include:
paying homage to pioneers.•giving credit for related work (homage to peers).•identifying methodology, equipment, and the like.•providing background reading.•correcting one’s own work.•correcting the work of others.•criticizing previous work.•substantiating claims.•Alerting researchers to forthcoming work.• providing leads to poorly disseminated, poorly •indexed, or uncited work. Authenticating data and classes of fact (such as •physical constants).identifying original publications in which an idea or •concept was discussed. identifying the original publications describing an •eponymic concept or terms. Arguing against the work or ideas of others.• disputing the claims of others to have been first with •their work.
not only can the influence of an individual research paper be traced through its citations in other papers, but the influence of a body of research in a specific domain can be determined. As garfield explains, “the papers marked with frequent citations are regarded as useful by a comparatively large number of researchers and experiments.” regarding the quality that citation counts measure, garfield explains, “people talk about citation counts being a measure of the ‘importance,’ or ‘impact’ of scientific work, but those who are knowledgeable about the subject use these words in a very pragmatic sense: what they really are talking about is utility.”
using citation analysis—bibliometrics—in this way, a university can assess the performance of its research units, gauge its contribution to the creation of knowledge and technology, and make decisions based on objective, quantitative data.
. . . . . . . . . . . . . . . . . . . . . . . . . . . . . . . . . . . . . . . . . . . . . . . . . . . . . . . . . . . . . . . . . . . . . . . . . . . . . . . . . . . . . . . . . . . . . . . . . . . . . . . . . . . . . . . . . . . . . . .USING BIBLIOMETRICS
citAtion metrics: whAt types of dAtA Are Best for which purposes? there are no all-purpose indicators. it is important to start by identifying the question the results will help to answer and then collecting data accordingly. the results are only as good as the questions that prompt the assessment. the university decision-maker must first clearly define the purpose of the evaluation, the kinds of information they need, and how they will use the analyses. this extra effort is necessary and worthwhile. this clarity of purpose determines what, of the vast amount of data available from the citation index, should be used, and the kind of analysis that will be performed.
the chart below lists a number of different purposes a university might have for evaluating its research performance. each purpose calls for particular kinds of information. the discussion following the chart describes the relationship between purpose and data in greater detail.
Metric type Metric Levels
productivity counts of papers Author, group, inst.
total recognition/ counts of citations Author, group, inst. influence h-index Author, group, inst.
indirect recognition/ second-generation citation Author, group, inst. influence counts
efficiency Average citations per paper Author, group, inst.
percent cited/uncited papers - Absolute Author, group, inst.
Journal impact factor Journal
relative impact/ percent cited/uncited papers Author, group, inst. benchmarking - relative
field baselines and relative impact Author, group, inst.
expected citation rate and “crown indicator” Author, group, inst.
percentile indicators: Author, group, inst. paper percentiles, average percentiles, relative percentile thresholds indicators (example of a distribution-based indicator)
specialization collaboration indicators Author, group, inst.
disciplinarity index Author, group, inst.
research fronts group
trend analysis time series Author, group, inst.
these citation metrics can help to answer important questions, including:
what is the university’s research performance?•how competitive is our research compared to •our peers?how can the university forecast growth?•what are the university’s centers of excellence?•what is our citation ranking?•how can we demonstrate the influence of •our research?
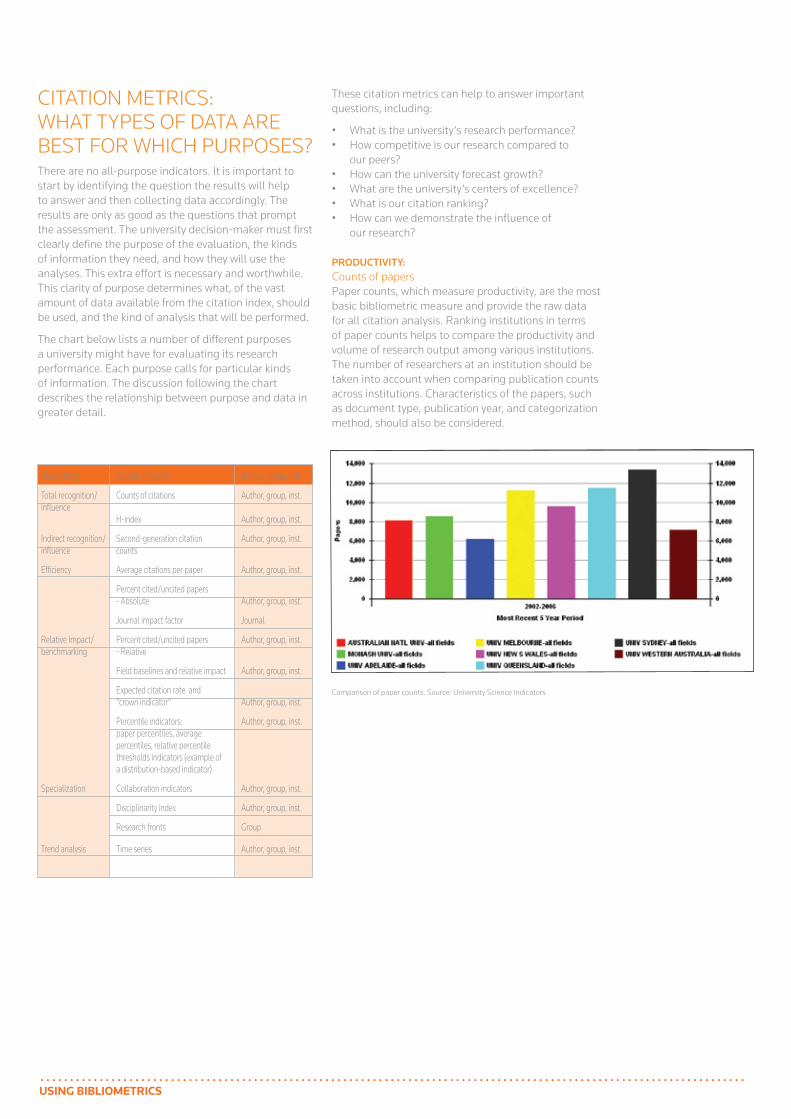
PRodUcTIvITY: counts of papers paper counts, which measure productivity, are the most basic bibliometric measure and provide the raw data for all citation analysis. ranking institutions in terms of paper counts helps to compare the productivity and volume of research output among various institutions. the number of researchers at an institution should be taken into account when comparing publication counts across institutions. characteristics of the papers, such as document type, publication year, and categorization method, should also be considered.
comparison of paper counts. source: university science indicators
. . . . . . . . . . . . . . . . . . . . . . . . . . . . . . . . . . . . . . . . . . . . . . . . . . . . . . . . . . . . . . . . . . . . . . . . . . . . . . . . . . . . . . . . . . . . . . . . . . . . . . . . . . . . . . . . . . . . . . .USING BIBLIOMETRICS
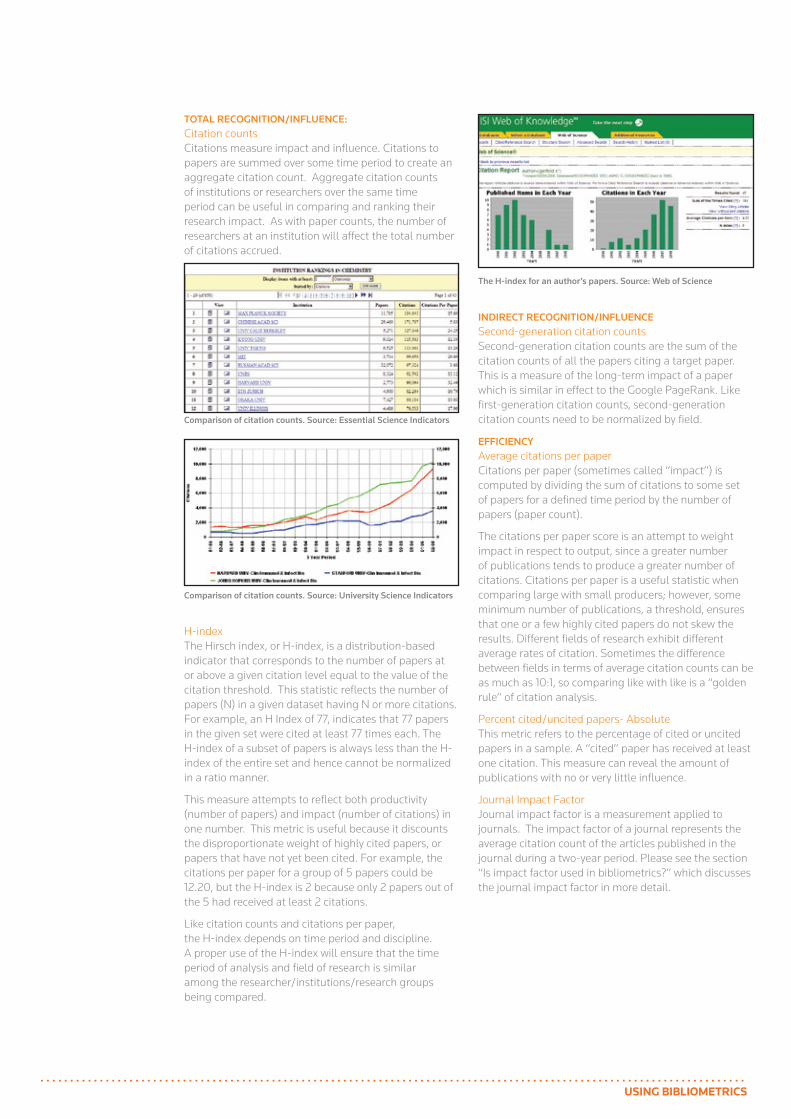
ToTAl REcoGnITIon/InflUEncE: citation countscitations measure impact and influence. citations to papers are summed over some time period to create an aggregate citation count. Aggregate citation counts of institutions or researchers over the same time period can be useful in comparing and ranking their research impact. As with paper counts, the number of researchers at an institution will affect the total number of citations accrued.
comparison of citation counts. source: Essential science Indicators
comparison of citation counts. source: University science Indicators
h-indexthe hirsch index, or h-index, is a distribution-based indicator that corresponds to the number of papers at or above a given citation level equal to the value of the citation threshold. this statistic reflects the number of papers (n) in a given dataset having n or more citations. for example, an h index of 77, indicates that 77 papers in the given set were cited at least 77 times each. the h-index of a subset of papers is always less than the h-index of the entire set and hence cannot be normalized in a ratio manner.
this measure attempts to reflect both productivity (number of papers) and impact (number of citations) in one number. this metric is useful because it discounts the disproportionate weight of highly cited papers, or papers that have not yet been cited. for example, the citations per paper for a group of 5 papers could be 12.20, but the h-index is 2 because only 2 papers out of the 5 had received at least 2 citations.
like citation counts and citations per paper, the h-index depends on time period and discipline. A proper use of the h-index will ensure that the time period of analysis and field of research is similar among the researcher/institutions/research groups being compared.
The H-index for an author’s papers. source: Web of science
IndIREcT REcoGnITIon/InflUEncEsecond-generation citation countssecond-generation citation counts are the sum of the citation counts of all the papers citing a target paper. this is a measure of the long-term impact of a paper which is similar in effect to the google pagerank. like first-generation citation counts, second-generation citation counts need to be normalized by field.
EffIcIEncYAverage citations per paper citations per paper (sometimes called “impact”) is computed by dividing the sum of citations to some set of papers for a defined time period by the number of papers (paper count).
the citations per paper score is an attempt to weight impact in respect to output, since a greater number of publications tends to produce a greater number of citations. citations per paper is a useful statistic when comparing large with small producers; however, some minimum number of publications, a threshold, ensures that one or a few highly cited papers do not skew the results. different fields of research exhibit different average rates of citation. sometimes the difference between fields in terms of average citation counts can be as much as 10:1, so comparing like with like is a “golden rule” of citation analysis.
percent cited/uncited papers- Absolutethis metric refers to the percentage of cited or uncited papers in a sample. A “cited” paper has received at least one citation. this measure can reveal the amount of publications with no or very little influence.
Journal impact factorJournal impact factor is a measurement applied to journals. the impact factor of a journal represents the average citation count of the articles published in the journal during a two-year period. please see the section “is impact factor used in bibliometrics?” which discusses the journal impact factor in more detail.
. . . . . . . . . . . . . . . . . . . . . . . . . . . . . . . . . . . . . . . . . . . . . . . . . . . . . . . . . . . . . . . . . . . . . . . . . . . . . . . . . . . . . . . . . . . . . . . . . . . . . . . . . . . . . . . . . . . . . . .USING BIBLIOMETRICS
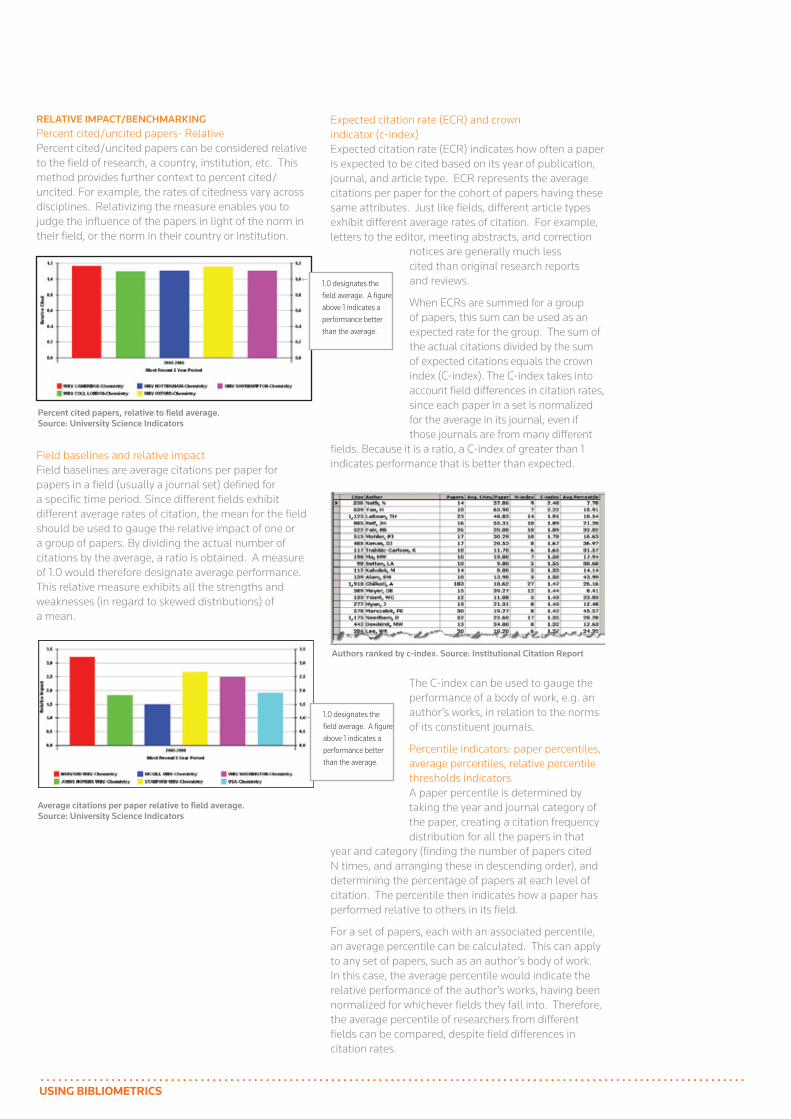
RElATIvE ImPAcT/BEncHmARkInGpercent cited/uncited papers- relativepercent cited/uncited papers can be considered relative to the field of research, a country, institution, etc. this method provides further context to percent cited/uncited. for example, the rates of citedness vary across disciplines. relativizing the measure enables you to judge the influence of the papers in light of the norm in their field, or the norm in their country or institution.
field baselines and relative impactfield baselines are average citations per paper for papers in a field (usually a journal set) defined for a specific time period. since different fields exhibit different average rates of citation, the mean for the field should be used to gauge the relative impact of one or a group of papers. By dividing the actual number of citations by the average, a ratio is obtained. A measure of 1.0 would therefore designate average performance. this relative measure exhibits all the strengths and weaknesses (in regard to skewed distributions) of a mean.
expected citation rate (ecr) and crown indicator (c-index)expected citation rate (ecr) indicates how often a paper is expected to be cited based on its year of publication, journal, and article type. ecr represents the average citations per paper for the cohort of papers having these same attributes. Just like fields, different article types exhibit different average rates of citation. for example, letters to the editor, meeting abstracts, and correction
notices are generally much less cited than original research reports and reviews.
when ecrs are summed for a group of papers, this sum can be used as an expected rate for the group. the sum of the actual citations divided by the sum of expected citations equals the crown index (c-index). the c-index takes into account field differences in citation rates, since each paper in a set is normalized for the average in its journal, even if those journals are from many different
fields. Because it is a ratio, a c-index of greater than 1 indicates performance that is better than expected.
the c-index can be used to gauge the performance of a body of work, e.g. an author’s works, in relation to the norms of its constituent journals.
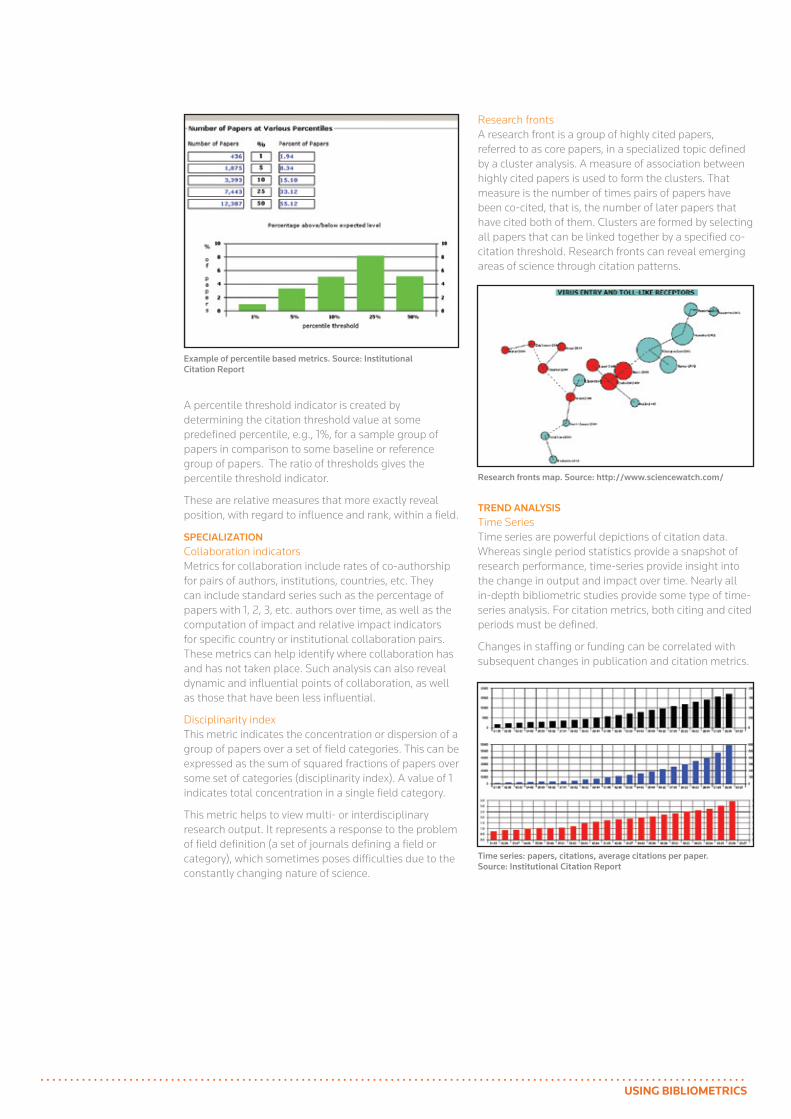
percentile indicators: paper percentiles, average percentiles, relative percentile thresholds indicators A paper percentile is determined by taking the year and journal category of the paper, creating a citation frequency distribution for all the papers in that
year and category (finding the number of papers cited n times, and arranging these in descending order), and determining the percentage of papers at each level of citation. the percentile then indicates how a paper has performed relative to others in its field.
for a set of papers, each with an associated percentile, an average percentile can be calculated. this can apply to any set of papers, such as an author’s body of work. in this case, the average percentile would indicate the relative performance of the author’s works, having been normalized for whichever fields they fall into. therefore, the average percentile of researchers from different fields can be compared, despite field differences in citation rates.
Percent cited papers, relative to field average. source: University science Indicators
1.0 designates the field average. A figure above 1 indicates a performance better than the average.
Average citations per paper relative to field average. source: University science Indicators
1.0 designates the field average. A figure above 1 indicates a performance better than the average.
Authors ranked by c-index. source: Institutional citation Report
. . . . . . . . . . . . . . . . . . . . . . . . . . . . . . . . . . . . . . . . . . . . . . . . . . . . . . . . . . . . . . . . . . . . . . . . . . . . . . . . . . . . . . . . . . . . . . . . . . . . . . . . . . . . . . . . . . . . . . .USING BIBLIOMETRICS
A percentile threshold indicator is created by determining the citation threshold value at some predefined percentile, e.g., 1%, for a sample group of papers in comparison to some baseline or reference group of papers. the ratio of thresholds gives the percentile threshold indicator.
these are relative measures that more exactly reveal position, with regard to influence and rank, within a field.
sPEcIAlIzATIon collaboration indicatorsmetrics for collaboration include rates of co-authorship for pairs of authors, institutions, countries, etc. they can include standard series such as the percentage of papers with 1, 2, 3, etc. authors over time, as well as the computation of impact and relative impact indicators for specific country or institutional collaboration pairs. these metrics can help identify where collaboration has and has not taken place. such analysis can also reveal dynamic and influential points of collaboration, as well as those that have been less influential.
disciplinarity indexthis metric indicates the concentration or dispersion of a group of papers over a set of field categories. this can be expressed as the sum of squared fractions of papers over some set of categories (disciplinarity index). A value of 1 indicates total concentration in a single field category.
this metric helps to view multi- or interdisciplinary research output. it represents a response to the problem of field definition (a set of journals defining a field or category), which sometimes poses difficulties due to the constantly changing nature of science.
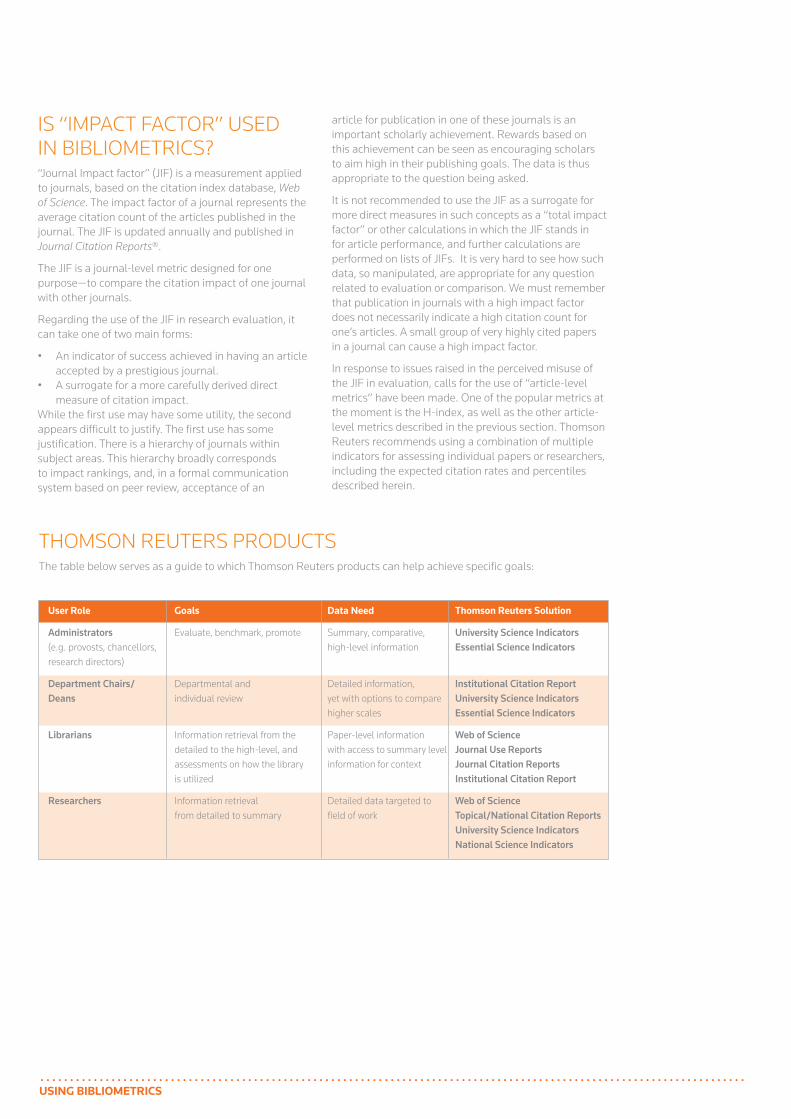
research frontsA research front is a group of highly cited papers, referred to as core papers, in a specialized topic defined by a cluster analysis. A measure of association between highly cited papers is used to form the clusters. that measure is the number of times pairs of papers have been co-cited, that is, the number of later papers that have cited both of them. clusters are formed by selecting all papers that can be linked together by a specified co-citation threshold. research fronts can reveal emerging areas of science through citation patterns.
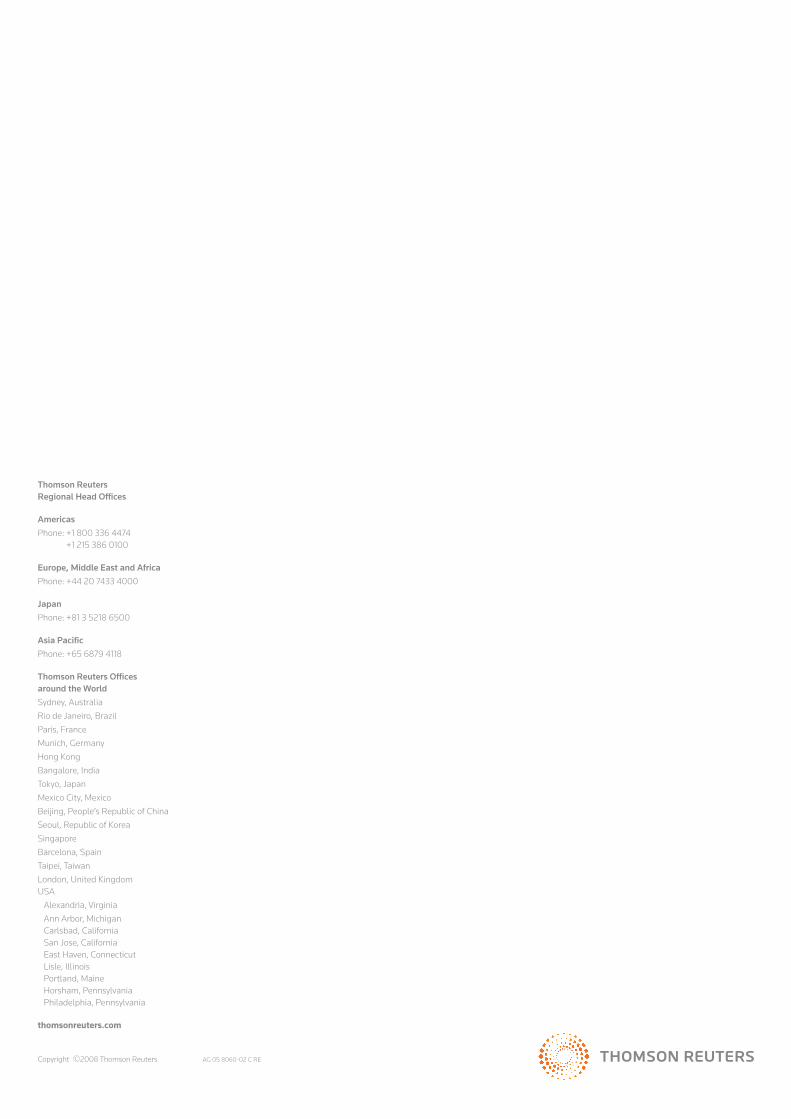
TREnd AnAlYsIstime seriestime series are powerful depictions of citation data. whereas single period statistics provide a snapshot of research performance, time-series provide insight into the change in output and impact over time. nearly all in-depth bibliometric studies provide some type of time-series analysis. for citation metrics, both citing and cited periods must be defined.
changes in staffing or funding can be correlated with subsequent changes in publication and citation metrics.
Example of percentile based metrics. source: Institutional citation Report
Research fronts map. source: http://www.sciencewatch.com/
Time series: papers, citations, average citations per paper. source: Institutional citation Report
. . . . . . . . . . . . . . . . . . . . . . . . . . . . . . . . . . . . . . . . . . . . . . . . . . . . . . . . . . . . . . . . . . . . . . . . . . . . . . . . . . . . . . . . . . . . . . . . . . . . . . . . . . . . . . . . . . . . . . .USING BIBLIOMETRICS
thomson reuters productsthe table below serves as a guide to which thomson reuters products can help achieve specific goals:
User Role Goals Data Need Thomson Reuters Solution
Administrators evaluate, benchmark, promote summary, comparative, University science Indicators (e.g. provosts, chancellors, high-level information Essential science Indicators research directors)
department chairs/ departmental and detailed information, Institutional citation Report deans individual review yet with options to compare University science Indicators higher scales Essential science Indicators
librarians information retrieval from the paper-level information Web of science detailed to the high-level, and with access to summary level journal Use Reports assessments on how the library information for context journal citation Reports is utilized Institutional citation Report
Researchers information retrieval detailed data targeted to Web of science from detailed to summary field of work Topical/national citation Reports University science Indicators national science Indicators
is “impAct fActor” used in BiBliometrics?“Journal impact factor” (Jif) is a measurement applied to journals, based on the citation index database, Web of Science. the impact factor of a journal represents the average citation count of the articles published in the journal. the Jif is updated annually and published in Journal Citation Reports®.
the Jif is a journal-level metric designed for one purpose—to compare the citation impact of one journal with other journals.
regarding the use of the Jif in research evaluation, it can take one of two main forms:
An indicator of success achieved in having an article •accepted by a prestigious journal.A surrogate for a more carefully derived direct •measure of citation impact.
while the first use may have some utility, the second appears difficult to justify. the first use has some justification. there is a hierarchy of journals within subject areas. this hierarchy broadly corresponds to impact rankings, and, in a formal communication system based on peer review, acceptance of an
article for publication in one of these journals is an important scholarly achievement. rewards based on this achievement can be seen as encouraging scholars to aim high in their publishing goals. the data is thus appropriate to the question being asked.
it is not recommended to use the Jif as a surrogate for more direct measures in such concepts as a “total impact factor” or other calculations in which the Jif stands in for article performance, and further calculations are performed on lists of Jifs. it is very hard to see how such data, so manipulated, are appropriate for any question related to evaluation or comparison. we must remember that publication in journals with a high impact factor does not necessarily indicate a high citation count for one’s articles. A small group of very highly cited papers in a journal can cause a high impact factor.
in response to issues raised in the perceived misuse of the Jif in evaluation, calls for the use of “article-level metrics” have been made. one of the popular metrics at the moment is the h-index, as well as the other article-level metrics described in the previous section. thomson reuters recommends using a combination of multiple indicators for assessing individual papers or researchers, including the expected citation rates and percentiles described herein.

Thomson Reuters Regional Head offices
Americasphone: +1 800 336 4474
+1 215 386 0100
Europe, middle East and Africaphone: +44 20 7433 4000
japanphone: +81 3 5218 6500
Asia Pacificphone: +65 6879 4118
Thomson Reuters offices around the World sydney, Australiario de Janeiro, Brazilparis, francemunich, germanyhong kongBangalore, indiatokyo, Japanmexico city, mexicoBeijing, people’s republic of chinaseoul, republic of koreasingaporeBarcelona, spaintaipei, taiwanlondon, united kingdom usA Alexandria, virginia Ann Arbor, michigan
carlsbad, california san Jose, california east haven, connecticut lisle, illinois portland, maine horsham, pennsylvania philadelphia, pennsylvania
thomsonreuters.com
copyright ©2008 thomson reuters Ag 05 8060-02 c re