who pays what for urban transport? - codatu · florence saint paul (cete du sud ouest) for...
TRANSCRIPT
Who pays whatfor urban transport?
Handbook of good practices
HAND
BOOK
COD
ATU


Who pays whatfor urban transport?
Handbook of good practices

Hanbook of good practices in funding urban transport
This guide was compiled by the “Agence Française de Développement” (AFD) and the French Ministry of Ecology, Energy, Sustainable Development and the Sea (MEEDDM).
A steering committee composed of Xavier HOANG from the AFD, along with Gilles DAVID and Alexandre STRAUSS from the Ministry supervised the work in progress.
The publication of this guide was assigned to CODATU. Written by Françoise METEYER ZELDINE (Consultant) in close collaboration with Laurence LAFON and Xavier GODARD, with technical proofreading by Thierry GOUIN and Patricia VARNAISON REVOLLE from the CERTU.
The six case studies and the subject-based analyses to which the guide refers were performed by: Stephane COHEN, Aurelie JEHANNO and Hubert METGE (SYSTRA) for the subject-based analyses and San Francisco, Peter ALOUCHE (PA Connection Engenheria e Tecnologia LTDA) for Curitiba, Xavier GODARD (CODATU) for Tshwane, Florence SAINT PAUL (CETE du Sud Ouest) for Chongqing, Caroline FABIANSKI (Independent Consultant) for Istanbul David MARGONSTERN, (Independent Consultant) for Ho Chi Minh City
This guide is designed as a work tool which does not necessarily reflect the opinions of the AFD or MEEDDM.
It is accompanied by a CD in French which includes the current report in PDF format as well as the aforementioned subject-based analyses and case studies.You may download it from the CODATU website: www.codatu.org
Designers: pHilippe Quérel & Françoise Hyvert
Printer: Imprimerie France-Quercy - 46000 Cahors Printed in November 2009

3
Avant propos
Foreword
Across the world, urban sprawl and traffic congestion in cities have generated an ever growing need for urban transportation which, in turn, creates demand for collective transportation systems that are both energy-saving and low in greenhouse gas emissions, while being widely accessible and occupying little space.
The financing of these systems (operating and investment costs) cannot be covered by the income from fares and subsidies alone. Other sources are necessary, sources that cities and countries endeavour to find and implement as best they can, often with success but always with difficulty.
In a wide range of local and national contexts, many original mechanisms have been developed: taxes on employers and business activities, betterment taxes to capture land value increases in areas served by public transport systems, and road infrastructure and parking charges. Depending on the context, these mechanisms associate different levels of public institutions, sometimes the urban transport authorities, but also private actors, especially in the context of public-private partnerships. Their goal remains the same: the continual and efficient development of urban transportation and its sustainable adaptation to the city’s growth.
This Handbook of Good Practices in Funding Urban Transport is the product of a joint initiative between the French Ministry of Ecology, Energy, Sustainable Development and the Sea (MEEDDM) and the French Development Agency (AFD). It was written by the association “Cooperation for urban mobility in the developing world” (CODATU), and draws from subject-based analyses and case studies, with input by the Center for studies on urban planning, transportation and public facilities (CERTU).
The guide is by no means exhaustive but aims to highlight key examples of funding solutions which can be mobilised in the public transport sector. The idea is to present a frame of reference for decision-makers, in both the North and South, who

Who pays what for urban transport? - Hanbook of good practices
4
would be brought to think about the organisation and financial structure of the urban transportation system which offer the best fit with their city’s requirements and particularities.
Within the framework of their respective areas of expertise, the MEEDDM and the ADF are available to discuss funding possibilities with these decision-makers.
Jean-Michel DEBRAT, Raymond COINTEAssistant General Manager Head of European and International of the AFD Affairs at MEEDDM

5
Sommaire
Contents
Introduction / Who can pay for urban modes of transport? ........................................ 9 0/1 Constraints and challenges of urban mobility ......................................................... 10 0/2 How much does a transport system cost? .................................................................. 13 0/3 Sources of funding for public transport ....................................................................... 15
Chapter 1 / Public funding ................................................................................................................ 19 1/1 Public funding of investments ........................................................................................... 19 1/2 Public funding of operations .............................................................................................. 21 1/3 The growing role of local authorities ............................................................................ 22 1/4 The region - a player or simply a partner? ................................................................ 23 1/5 Central government retains a key role .......................................................................... 23 1/6 The role of transit authorities ........................................................................................... 25 1/7 Who funds the public budget for urban transport? .............................................. 28 Chapter 2 / Funding by users ........................................................................................................... 35 2/1 Public transport users ............................................................................................................. 35 2/2 Private vehicle users ................................................................................................................ 42 Chapter 3 / Road infrastructure and parking charges ................................................... 45 3/1 Congestion charging and public transport ................................................................. 45 3/2 Paid parking and public transport ................................................................................... 52
Chapter 4 / Taxes on employers and business activities ............................................ 59 4/1 Voluntary involvement of companies ............................................................................ 59 4/2 Mandatory financing of the transport system by companies and business activities .......................................................................... 61
Chapter 5 / Land value capture in areas served by public transport ................ 67 5/1 Anticipated purchase of land ............................................................................................. 68 5/2 Development of business and residential activities ............................................. 71 5/3 Introduction of a betterment tax .................................................................................... 74 5/4 PPP for a development project .......................................................................................... 76
Chapter 6 / Public-Private Partnerships (PPP) ................................................................... 79 6/1 Why opt for PPP? ........................................................................................................................ 79 6/2 Determining factors in choosing a PPP ....................................................................... 81 6/3 Examples of PPP around the world ................................................................................. 85

Who pays what for urban transport? - Hanbook of good practices
6
Chapter 7 / Additional mechanisms ............................................................................................ 91 7/1 CDM: Clean Development Mechanism ............................................................................ 91 7/2 Decentralised cooperation .................................................................................................... 99
Conclusions / Conclusions: keys to choosing the most appropriate funding framework ................................................................................. 105 Cost reductions .......................................................................................................................... 108 Optimised revenues ................................................................................................................ 108 Additional revenues ................................................................................................................ 108
References ................................................................................................................................................... 110
Illustrations 1. Relationship between income and mobility .................................................................... 11 2. Average investment costs based on transport modes and GDP per capita .. 13 3. Operating costs with amortization based on GDP ....................................................... 14 4. Diagram of funding for public transport ........................................................................... 28 5. Use of modes of transport and distribution of revenues ........................................ 39 6. Types of congestion charging ................................................................................................... 48 7. Traffic in London’s central zone .............................................................................................. 51 8. Breakdown of parking revenues in San Francisco ........................................................ 55 9. Growth rate of transport tax revenues since 2000 ..................................................... 62 10. Percentage of journeys made using the “Vale-Transporte” scheme ................. 63 11. The Principle of Joint Development ..................................................................................... 77 12. Number and type of contract, by system size in France ......................................... 85 13. Structure and financial flow of São Paulo’s metro line 4 ........................................ 87 14. Diagram of a CDM project cycle .............................................................................................. 92 15. Who pays what for investments? ........................................................................................ 106 16. Who pays what for operations? ............................................................................................ 107
Tables 1. Examples of additional VAT in the San Francisco Bay Area ................................... 29 2. Capital flow from parking in Montpellier .......................................................................... 54 3. Global annual revenues for paid street parking ............................................................ 55 4. Different types of PPP contracts ............................................................................................ 82 5. Approved CDM projects in the field of transport ......................................................... 94 6. CDM projects in the field of transport pending validation .................................... 95

7
Tables
Abbreviations AFD • Agence Française de Développement (French Development Agency) BRT • Bus Rapid Transit Caltrans • California Department of Transportation CBTU • Brazilian Urban Trains Company CDM • Clean Development Mechanism CERTU • Center for studies on urban planning, transportation and public facilities CODATU • Cooperation for urban mobility in the developing world CMP • Company Mobility Plan EIB • European Investment Bank GHG • GreenHouse Gas IBRD • International Bank for Reconstruction and Development JBIC • Japan Bank for International Cooperation MEEDDAT • Ministère de l’Ecologie, de l’Energie, du Développement Durable et de l’Aménagement du Territoire (Ministry of Ecology, Energy, Sustainable Development and Town and Country Planning) MEEDDM • MEEDDAT has been turned into MEEDDM since June 2009 : Ministère de l’Ecologie, de l’Energie, du Développement Durable et de la Mer (Ministry of Ecology, Energy, Sustainable Development and the Sea) ODA • Official Development Assistance OECD • Organisation for Economic Co-operation and Development PPP • Public Private Partnership STIF • Transit authority for Ile-de-France STM SP • São Paulo State Secretariat for Metropolitan Transportation SYTRAL • Transit authority for Lyon and Rhone TDM • Transit Demand Management TfL • Transport for London TIDF • Transit Impact Development fee UNFCCC • United Nations Framework Convention of Climate Change VAT • Value added Tax

Hanbook of good practices in funding urban transport

9
Introduction
Introduction:Who can pay for
urban modes of transport?
According to the United Nations, the proportion of urban dwellers among the world’s total population hit the 50% mark in 2008 and is currently estimated at 3.36 billion inhabitants, two thirds of whom live in the developing world. This population is expected to see a massive increase over the next few decades, rising from today’s 50% to 60% by around 2030. Developing countries will see the biggest changes as 95% of the 1.6 billion new urban dwellers will be living in cities in the developing world, thereby imposing a high demand for mobility 1. Transit within urban areas is provided by a combination of modes of transport which can vary greatly. These modes of transport constitute a system and it is this system as a whole which has to be considered when defining effective mobility policies.Within the systems, the international community is giving greater emphasis to sustainable solutions in which public forms of transport and non-motorised transport are set to play a major role while the car plays a complementary role. Findings in various parts of the world show that there has not been a sufficient amount of attention or effort given to these public modes of transport and other soft modes to sufficiently meet mobility needs. Public officials are therefore faced with three challenges in the years to come:
the challenge posed by current qualitative and quantitative shortcomings of public transport in its various forms;
the challenge of urban growth which creates new needs that have to be met due to the increase in the size of the population and longer travelling distan-ces;
the challenge posed by environmental issues (energy and climate change) which requires finding a new balance between private and public modes of transport both in the developed and the developing world.
These three challenges imply that public and non-motorised forms of transport have to be strengthened through the mobilisation of significant amounts of funding both for operating and upgrading current systems and for the necessary investment in mass transport to meet future needs.
1. Demographia World Urban Areas: 2025 & 2030 Population Projections (DEMOGRAPHIA August 2008) http://www.demographia.com/db-worldua2015.pdf

Who pays what for urban transport? - Hanbook of good practices
10
The decision makers and funding agencies must know who can pay and who must pay for urban transport: users, public bodies, employers, businesses? How should the various sources of financing be distributed and allocated to the various modes of transport? What funding sources are the most favourable for the sector’s sustainable development? How should they be mobilised?The purpose of this document is to provide insight into potential solutions to meet funding needs. The focus is therefore on the funding of public transport, drawing on the innovative experience of emerging and developed countries. Developing countries will be able to benefit from the lessons contained in this handbook. However, implementing some of the measures put forward may be difficult or even impossible in the current context of certain countries.Throughout the handbook, reference will be made to various experiences in different socio-economic, institutional and geographic contexts. The reader must therefore be aware that the solutions are never transposable “as-is” but we can see that major innovations are possible, given a sound understanding and appropriate adjustment of other experiences.The handbook is organised around the six sources of funding which have been identified and analysed with examples taken throughout the world so as to understand the conditions in which they are implemented and to draw lessons for potential adaptations: 1. Public funding;2. Funding by users;3. Road and parking tolls;4. Employer contributions;5. Land value capture in areas served by public transport;6. Public-private partnerships.
0/1 Constraints and challengesof the urban mobility
Strong urban growth
Cities with between one and two million inhabitants will experience the highest demographic growth over the next 20 years. This trend is already apparent with the drop in the rates of growth seen in the world’s megalopolises and the expansion of cities with almost one million inhabitants. However, these cities in developing countries often have the worst urban public transport systems and are those which will need a high level of funding.

11
Introduction / Who can pay for urban modes of transport?
There is a strong link between mobility and income. The creation of wealth requires that earners be able to move about quickly and easily. The relationship between the number of trips made per day and per capita income is very significant: despite a number of counterexamples which are informative but in a minority 2, those countries with the greatest mobility also have the highest levels of GDP per capita.
Figure 1: Relationship between income and mobility
Source: Urban Transport & Economic Growth. Seminar on urban transport: BID/CODATU.Santiago, Chile – 8 October 2007 (Wendell Cox).
Nevertheless, despite the strong relationship between mobility and development, it does not imply an endless extension of modes of transport and especially not individual modes of transport, which is the basis of growth in developed countries. The development model which generates urban sprawl, spatial specialisation and the inevitable increase in travel time, results in additional costs and “diseconomies” (congestion, pollution-related health problems, stress, major environmental impact) whose effects translate into a financial, social or human cost which somebody ends up paying: citizens, companies, employees or the local authority. This situation means that we must come up with a different sustainable city model which involves a change in urban choices favouring the predominant use of public transport.
2. Some low income cities (for example, Ouagadougou in Africa and Ho Chi Minh City and Hanoi in Asia) have high rates of mobility which exceed two trips per day per person, which is attributable to the ease with which people can get about on a bicycle or motorbike.
United States
CanadaWestern Europe
Eastern Europe
Latin America
Japan
Africa
Australia
High-income Asia
Middle-income Asia
Low-income Asia
40 000
35 000
30 000
25 000
20 000
15 000
10 000
5 000
0 000
0,0 0,5 1,0 1,5 2,0 2,5 3,0 3,5 4,0
Daily trips using motorised transportation
Income per capita US$ 1995

Who pays what for urban transport? - Hanbook of good practices
12
It is in high growth emerging countries where such choices are going to have a significant impact and where investment needs will be highest. The failure to invest in urban transport today will have medium- and long-term consequences on the creation of wealth in the cities concerned and could undermine policies to reduce poverty. The poorest of people have no alternative but public transport to access jobs, healthcare, education and culture. Mobility plays an important role in social inclusion; a lack of transport can worsen social exclusion.
What forms of transport?
In a large majority of cities in the developing world there has been a constant rise - even a very rapid rise - in the use of private cars; this is also the case in cities that have a relatively well developed transport system and which continue to invest in improvements. This global phenomenon is caused by a number of factors: the fall in vehicle prices, trade deregulation, a rise in earnings and people’s aspiration to have their own car in order to avoid uncomfortable collective modes of transport. They affect transport policy choices, forcing a decision between:
the development of road networks to respond to the growth in road traffic and particularly the demands of new car drivers while trying to remedy growing congestion which finally leads to an increased use of private vehicles, conges-tion and pollution;
the need to reduce dysfunctions and the cost to the local community and to develop economic activity by promoting sustainable, non-polluting collective modes of transport which consume less energy, as well as soft forms of trans-port (cycling, walking).
These two occasionally contradictory aims mean that the authorities have to consider a transport system which combines all modes of transport and all uses of public areas: car traffic, public modes of transport, pedestrians and cyclists, parking and deliveries. The sharing of public areas and an understanding of road safety conditions, particularly for pedestrians and cyclists, will constitute one of the challenges faced by urban policy makers over the next 20 years. Will public authorities be able to respond to this challenge? This question is particularly relevant when considering the institutional organisations of different cities and metropolitan areas in which a single body is rarely responsible for transport and in which institutional coordination is not always effective. The fragmentation of authority in matters of transport does not favour a rational use of funds nor the seamless organisation of the various modes of transport. However, all institutional changes require time and the chance to mature; successive steps will certainly allow a better form of organisation to take shape. Nevertheless, in developing cities which are experiencing high growth, much has to be done in a very short period of time.Furthermore, to reach and maintain a satisfactory quality of collective transport operations and equipment, continuous funding sources are necessary. In public transport, operating costs constitute a heavy financial burden which has to be

13
Introduction / Who can pay for urban modes of transport?
taken into consideration to ensure the long-term survival of the system. There is often a noticeable drop in the quality of public transport services over the years through a failure to upgrade equipment because of a lack of funding. This results in a drop in the number of users, or a rise in the number of owner-driver transport systems, or people travel less. Such a situation undermines economic development efforts and leads system operators to request assistance from the public authorities to keep the service running.
0/2 How much does a transport system cost?
The cost depends on the modes of transport chosen. However, regardless of the choices made, the key is to establish long-term funding conditions both for investments (infrastructure and rolling stock) and the operating of the various modes of transport (operating, maintenance and replacement). It is therefore all of these costs over the long term which have to be considered in the strategic choices. For public modes of transport, some comparative elements serve to highlight the various parameters which enter into the selection criteria.
Figure 2: Average investment costs based on transport modes and GDP per capita
©Systra. Source: Stratégie de mobilité durable dans les villes des pays en développement. (Sustainable mobility strategy in cities in developing countries.) MEEDDAT. CERTU. (2008)
0 10 000 20 000 30 000 40 000 50 000GDP / capita €
100
90
80
70
60
50
40
30
20
10
0
M€ / km
MRT BRT Tramway

Who pays what for urban transport? - Hanbook of good practices
14
Figure 3: Operating costs with amortization based on GDP(in euros, per kilometre)
©Systra. Source: Stratégie de mobilité durable dans les villes des pays en développement. (Sustainable mobility strategy in cities in developing countries.) MEEDDAT. CERTU. (2008)
On the basis of international comparisons of cities in developing countries, the funding of a metropolitan area’s urban modes of transport requires between 1% and 2% of its GDP to cover spending on urban road investments, public transport investments and operating needs. Example:
Teheran’s transport plan (2005/2006) recommends 1.2% of the municipality’s GDP to be invested in public transport between 2005 and 2016.
In Greater Cairo, the Master Plan for Transport puts forward a public transport investment of 1.7% of GDP for the period between 2002 and 2022.
In Belgrade, public transport investment stood at around 1.04% of the metropolitan area’s GDP for 1997 to 2001.
Source: MEEDDAT. CERTU. Stratégie de mobilité durable dans les villes des pays en développement. (Sustainable mobility strategy in cities in developing countries.) Systra (2008).
However, other needs such as healthcare, education, access to water and sanitation, communication, culture, etc. also have to be met. The usual forms of finance (ticket revenues and public subsidies) may not mobilise the funds required. It is therefore important to consider new forms of funding and the inclusion of new players.
5 000 10 000 15 000 20 000 25 000 30 000Capacity (people / hour / way)
0,06
0,05
0,04
0,03
0,02
0,01
0
€ / place.km
BRT in developed country
MRT in developed country
BRT in developing country
MRT in developing country

15
Introduction / Who can pay for urban modes of transport?
0/3 Source of funding for public transport
One of the particularities of the urban transport sector is that it depends on funding from several sources and involves various partners, both public and private, individual and collective. In each city, we find a funding framework in which the players generally belong to three large categories; the role of these players varies and they participate in a specific manner.
Public authorities
Public authorities are one of the main players involved in the funding of urban modes of transport whether in the area of infrastructure (most commonly), or often but not systematically, in the operating of the system through the payment of subsidies or in the direct running of systems by municipal corporations. The types of roles vary and are closely linked to the institutional history of the cities and countries. The sources of public funding for transport budgets we find are diverse and sometimes very specific:
general budget funded through taxation; taxes on fuel, vehicle ownership, etc. which are allocated to transport when
permitted by legislation; parking, toll revenues; taxes on the payroll of private and public employers; loans from banks, funding agencies; grants from international funding agencies or bilateral aid.
Different levels of public authority (central, regional and local) may play a role in the field of urban transport, ranging from regulations and planning to funding. Very often, all institutional levels intervene simultaneously in a given territorial area, whether in a coordinated manner or not. In the six cities analysed in this study, rail is still managed at a central level while buses are managed by municipalities. This means that funding may be channelled more to targeted modes of transport rather than to a transport system to provide mobility in a territorial area; this is due to a lack of coordination between the various public authorities. When a transit authority exists, public funds can be channelled to a transport system which has been designed as a comprehensive whole.

Who pays what for urban transport? - Hanbook of good practices
16
Direct beneficiaries
This term refers to the users who benefit directly from the multimodal system of transport:
public transport users who contribute to the system’s funding by purchasing a ticket;
users of individual motorised vehicles who may be subject to tolls for the use of infrastructure such as bridges or urban motorways, congestion charging to access areas such as a city centre, parking charges, taxes on fuels, fines, etc.
users of soft modes of transport, such as bicycles, who may pay rental charges when using self service systems or secure lock-ups.
In the case of public transport, the revenue collected goes directly to operating the mode of transport, even when the revenue is redistributed by a body responsible for equalizing the revenue. In the case of revenue from tolls and taxes levied on private vehicle users, allocation is direct only if the revenue has been earmarked as such, which is not always the case, given that the legislation of many countries does not permit the pre-allocation of resources. It is therefore more difficult to accurately establish whether the funds are allocated to urban modes of transport or not and to which form of transport.
Indirect beneficiaries
This term refers to those people or bodies which will benefit from the presence of a transport system and the accessibility that it provides without necessarily being direct users:
for example, companies whose employees make use of the system without there being any cost to the companies, which therefore benefit financially from the presence of a transport system. In certain countries and particularly in the case of France, these firms contribute to the funding of the investment and the system’s operation through a tax on payroll. Elsewhere, contributions take the form of direct assistance to the employee when a firm covers a share of his daily transport costs;
business activities, whether the transportation of customers to city centres and shopping centres or the transportation of a firm’s products, also benefit indirectly from infrastructure and the transport systems;
local residents and traders see the value of their land, homes and business assets increase with the arrival of a transport system. Recovering a share of the capital gains to fund mobility can be an innovative method which has already been used in a number of cities.
In some circumstances, the opposite may happen. A property located on the route of a public mode of transport without being close to a station may lose value due to the nuisances that the route brings with it (particularly noise). Furthermore, proximity to a station can also present new nuisances for local people due to the increase in the number of people passing by (congestion, pollution, noise, etc.).

17
Introduction / Who can pay for urban modes of transport?
In each city, these three categories of players may play a distinct role, and to varying degrees, depending on the institutions and the social and political conditions. However, the underlying funding scheme remains the same. The system is finally balanced but the share of each player differs from one city to another and the burden placed on public resources varies according to the mobilisation of other contributors. Certain categories, such as indirect beneficiaries, are often hardly involved. Others, such as users, may be the focus of specific policies so as to increase their contribution to the transport system as a whole. A balance is eventually found, in the sense that the costs are always borne by certain parties.To mobilise all categories of players and to implement each source of funding, specific conditions are required. The seven chapters contained in this handbook aim to provide the key elements of these conditions.

Hanbook of good practices in funding urban transport
19
Chapter 1
Public Funding
Across each continent, public authorities are one of the main contributors to the funding of urban modes of transport in terms of investment and, often, operations. In providing modes of transport, as part of a public service obligation, public funding is perfectly justified. Nevertheless, the players and the forms of funding have changed significantly with, in particular, the emergence of decentralisation policies which have given rise to new players at a regional and a local level. Up until the 1980s, the state, including countries with a federal system, was often the main and sometimes even the only public body to fund urban modes of transport. In many countries, the power to organise and fund urban modes of transport was gradually transferred to local authorities. However, this did not always go hand in hand with financial resources, which meant that the cities and metropolitan areas concerned had to introduce new means and partnerships to fulfil the role which they had been given. It is worth distinguishing between the funding of investments and the funding of routine operations as these involve different mechanisms.
1/1 Public funding of investments
This form of funding generally concerns infrastructure which is funded on a collective level: road infrastructure, transit lanes for public transport, etc. The ways in which the public authorities intervene vary significantly depending on whether a transit authority exists at a city level or at the level of the metropolitan area and depending on the powers entrusted to the transit authority. When a transit authority has the task of defining mobility policy, managing the modes of transport and planning investments, public funding will form part of a global and planned project which may turn to other partners, particularly those in the private sector. In such a situation, the various levels of public players can contribute in a coordinated manner and fulfil their roles but as part of a joint project. The risk of seeing the various modes of transport overlapping, contradicting one another or even competing with one another is thereby reduced.

Who pays what for urban transport? - Hanbook of good practices
20
When no authority has the task of managing urban modes of transport at the level of a metropolitan area, which is most often the case, public funding tends to specialise in types of investment and/or modes of transport:
road infrastructure and public transport systems for towns. If each town ma-nages its own territory this can lead to a lack of continuity in the system, insufficient capacity and a high cost for users, as is the case in many Latin American cities;
“Metropolitan” infrastructures, i.e. involving several towns in the same me-tropolitan area. Such infrastructures often consist of bus rapid transit (BRT) systems, tram, train and metro lines which are funded by the regions, federal states or central government.
Institutional organisation in Tshwane: South Africa
The city of Tshwane was established in 2000 and comprises the former city of Pretoria and several townships which appeared during the time of apartheid. The city touches the metropolises of Johannesburg and Ekurhuleni with which it forms an extended urban network, which is often referred to as the city-region of the province of Gauteng due to its economic and spatial cohesion. There is no transit authority and the three political and administrative bodies participate in the organisation, regulation and funding of the transport system:
the central government owns and regulates the railways in the suburbs and grants subsidies to a single operator (Metrorail) as well as to the bus operators;
the province of Gauteng manages the bus companies’ operating agreements and distributes the central government’s subsidies. It also awards operating licences to minibus taxis;
the municipality of Tshwane registers carriers and has the task of creating transport routes. It also owns the bus company, Tshwane buses.
The authorities, aware of the lack of coherency in the institutional system, want to create a transit authority. However, there is a clash between the municipality’s desire to establish its own authority which was approved in a vote in 2004 and the Province’s decision, at the start of 2006, to establish a higher authority for transport management (Gauteng Transport Management Authority) which is justified through the Province’s city-region status. A new law, the National Transport Bill, drafted in 2008-2009, should clarify the issue of transit authorities.
21
Chapter 1 / Public funding
1/2 Public funding of operations
Even though an operating balance (operation and replacement) is reached in significant cases, it is more common for transport system operators, whether public or private, to find themselves in financial difficulties and resort to the public authorities to cover their losses. We tend to think that developed countries fund the operating of their public modes of transport more than developing countries. However, international comparisons are difficult to make as the same components are not always considered when calculating revenues and expenditure and, furthermore, the very different levels of service between continents make comparisons even more complex. In addition, certain lines may break even or make a profit. However, they must always be considered in relation to cross-subsidisation within a transport system.Experience shows that fares are a compromise between the need to fund public transport and the users’ capacity to pay. It is often noted that fares are kept low to meet the needs of those on low incomes. Fares are set by the public authorities and do not always reflect the real costs, which vary greatly, based on the quality of the service provided.
The public authorities may make their contribution in several ways: compensation for the allocation of special fares to certain user categories; compensation of losses at the end of the year, as in the case of Istanbul where
it is estimated that 54% of spending by bus companies is covered by the go-vernment. In this traditional subsidy practice, companies have no incentive to improve their level of profitability or their service;
payment of an amount per trip (or per kilometre travelled) based on the operating costs declared by the companies or estimated by the public autho-rities. When the operating cost is set or negotiated by the public authorities, the carriers may be encouraged to improve their levels of performance and cut their operating costs through preventive maintenance and staff training measures (particularly drivers), etc 3.
In some cases, public authorities may also tie the payment of compensation or subsidies to obligations in terms of productivity, the fight against fraud and improvements in the quality of service by introducing a bonus/penalty type systems. In all cases and regardless of the method chosen, it is in the interest of the authorities to introduce a service agreement which lays down the rights and obligations of operators whether they are public or private.
3. See the types of contract contained in table 4, chapter 6 on public-private partnerships.

Who pays what for urban transport? - Hanbook of good practices
22
1/3 The growing role of local authorities
Over the past 20 years, decentralisation has been a global trend which has allowed towns to become key players in the transport sector to different degrees depending on the country: from the management of traffic to the definition and implementation of a genuine urban transport policy.
In Chongqing and Ho Chi Minh City, the local authorities are responsible for managing traffic and organising public transport. They also play an active role in putting forward new projects despite their lack of financial capacity to implement these projects. It is the central government that decides on the investment projects of the various cities in these countries. However, it is the towns that fund the carriers’ losses.
Since 2004, Istanbul Metropolitan Municipality (IBB) has been responsible for managing and controlling traffic, investing and managing public modes of transport - including several public corporations - as well as road maintenance. In the past, these responsibilities belonged to provincial bodies which were directly attached to the ministry of transport. However, IBB does not yet manage the railways, metro, suburban trains, urban motorways or bridges over the Bosphorus which are still managed at a national level.
In Curitiba, San Francisco and towns and certain urban communities in France, the transport authorities manage all urban forms of travel and provide funding through their own resources and also through funding agreements with other local municipalities and the state.
The transfer of responsibility rarely comes with a sufficient level of financial support. It is therefore up to the towns to find new forms of finance, such as local taxes which are generally based on real estate or economic activity, but which do not allow the towns to cover all public service needs. The use of loans, betterment taxation and the allocation of revenue from parking fines are examples of measures which could be implemented. However, they require guarantees and regulations of a national nature. It is therefore essential that discussions take place within a comprehensive project.

23
Chapter 1 / Public funding
1/4 The region - a player or simply a partner?
The intermediate level between a state and a town: a region, province or federal state, depending on the administrative and political forms of organisation, is often characterised by a duty to develop the territory and thereby organise and fund urban modes of transport, particularly at a metropolitan level. The region can be a simple financial partner of a transit authority in a global project as is the case in the State of California for the city of San Francisco and which is also the case of French regions with the Urban Transit Authorities. The region can also act as a transit authority itself by organising transport in a given territory, particularly in large metropolitan areas. Thus:
federal states organise inter-municipal transport in Brazil’s large metropolises; Gauteng Province grants line operating rights and manages the subsidies
awarded by the central government to Tshwane’s public and private municipal bus companies.
As there is no transit authority which manages the entire system and so as to ensure coherency in the general organisation of the transport system, it is important to establish channels of consultation between these intermediate levels, the central body and the towns responsible for urban transport.
1/5 Central government retains a key role
States, regardless of the political and administrative organisation of the country, remain key players which act directly or through financial institutions with which they are involved. They channel funds into the budgets of local authorities in various ways: global allocations, equipment subsidies, channelling of proceeds from certain taxes such as the federal tax on oil products in the United States, etc.They participate directly in the funding of certain projects in partnership with other public players, towns or regions either in a specific project or in a global urban transport project when a transit authority is responsible for managing the project. They may also create ties with private players under a public-private partnership. Funding may be made on a case-by-case basis or it may form part of special programmes aimed at developing urban modes of transport which constitute funding streams that are managed by ministries or financial institutions.
Who pays what for urban transport? - Hanbook of good practices
24
In Brazil, the Ministry for Cities funds urban transport through three specific programmes:
the “Urban Mobility Programme” supplements funding from municipalities and the federal states. The programme receives government funding and aims to promote the coordination of transport, traffic and accessibility policies. It prioritises public transport systems, non-motorised forms of transport and accessibility;
Pró-Transporte with funds from the “workers retirement fund” (around €340 million in 2008) is particularly targeted at cities situated in the country’s poorest regions. It funds engineering studies, public transport investments and developments for pedestrians and cyclists in cities which have established or are in the process of establishing a transport master plan;
PRÓ-MOB (Programme for the funding of infrastructure for urban mobility), which is managed by the national bank for economic and social development, is open to municipalities and promotes work which favours the introduction of transport projects to depressed urban areas.
State intervention always takes the form of an annual budget, the value of which depends on the demands made by the various ministries. In some countries like Vietnam where there are no large sector-based programmes, the choice is made in the Ministry of Finance on the basis of the projects presented by the Ministry of Transport which has already pre-selected the projects presented by the cities. Direct intervention by the state through public corporations is still predominant in the area of urban railways. In four of the six cities studied with one or more rail-based modes of transport, central government is the promoter and direct manager of this mode of transport. The same also applies to cities in Europe, the US and Japan (Tokyo’s metro, for example). Curitiba’s forthcoming metro, despite being designed by the transit authority responsible for metropolitan transport will be built by the central government through CBTU (Brazilian company for urban trains), which is a federal body.The significant presence of governments in the railway segment is based on a past need for highly qualified personnel to implement large-scale investments and to run the network; in general, towns did not have such personnel. Governments very often retain a degree of authority over their main cities either because of their special status, such as the federal districts, or because they are at the heart of the country’s economic activity and are often megalopolises; they thereby require particularly large investments.
For the direct funding of projects and also the introduction of new sources of funding which may require changes to regulations or the passing of new laws, the government therefore remains a key player. Governments also play an important role in obtaining loans, particularly from international funding agencies as their underwriting of the loan is an essential requirement and because they manage external debt.
25
Chapter 1 / Public funding
1/6 The role of transit authorities
Mobility implies local management which corresponds insofar as possible to the needs of the population and the economic and social activity of the area. Nevertheless, organising this mobility requires significant investments on the part of public and private players. Such investments must respond to a range of needs and therefore provide various technical solutions while taking the quality of urban life into account. These challenges have often resulted in a large number of actions by public and private bodies without there being any real coherency in their work. In light of this, the most common response has been to make the towns responsible for organising public transport. The decentralisation of such powers has not however always been matched with the resources to fulfil such a responsibility. Furthermore, governments have sometimes retained responsibility for certain modes of transport (particularly rail), which does not favour coherency.
The creation of a transit authority ensures greater coherency since the contributions of all players can be coordinated. When there are several operators and/or the system comprises several modes of transport, the transit authority coordinates the various players and ensures that there is financial equalization so as to implement an integrated ticketing system.The territory concerned by the movement of people and goods often covers an area which encompasses several municipalities. It is important to determine the correct scope of intervention on the basis of origin/destination surveys of people and also flows associated with the area’s economic activity. The scope of intervention may change over time.
Regardless of the transit authority’s legal status, to fulfil its role completely, it must possess recognised and stable powers of organisation, planning and control. However, the political conditions are not always present for a transit authority to assume all of these functions; a gradual approach is therefore necessary as institutional changes need to mature over time. It is sometimes necessary to move forward through stages before finding a form of organisation which best suits the history and institutional culture of each country and each city.
Who pays what for urban transport? - Hanbook of good practices
26
VARIABlE gEOMETRy ORgANISATIONS
Naples: integration of the six operators 4
To resolve the city’s poor interconnections, the six operators of the metropolitan area established a consortium, “Napolipass”, whose role was to incorporate the six tickets into one. Napolipass manages the production of tickets and transfers revenues to its six members based on the routes recorded. Ticket sales have soared since the six tickets were turned into one (27 million in 1995 compared to 39.5 million in 1999).
French urban transit authoritiesArticle 27 of the framework law on domestic transport, of 30 December 1982 (LOTI), distinguishes two types of urban transit authority:
the town or public entity responsible for organising public transport (community of towns, urban community, association, etc.);
adjacent towns which have decided to organise public transport for their area.Their task is to establish the public transport offer and make it available, set the fares and choose the operating methods. In a very small number of cases, they are responsible for traffic and road maintenance.
lAMATA, the lagos Transit Authority 5
Lagos Metropolitan Area Transport Authority (LAMATA) is a semi-autonomous agency established on 13 January 2002 as part of the Lagos Urban Transport Project (LUTP) with the technical and financial support of the World Bank. Its shareholders are the Nigerian government, the World Bank and the Transport Fund. Its very wide remit covers urban modes of transport in their entirety, including both public transport and the road network:
planning, development, coordination of transport policies; building and maintenance of the road network; development of road junctions; design and organisation of bus routes and location of bus shelters; collection of taxes paid by road users; recommendations on public transport policies.
LAMATA also operates BRT (Bus Rapid Transit) in Lagos, inaugurated in March 2008, and manages the Lagos Urban Transport Project (LUTP) as well as the rail-based transport project.
4. Based on two articles by Floridea di Ciommo mentioned in “Urban Transport in the Medi-terranean Region: Guidance and Recommendations” AFD - CODATU - The World Bank - Med-cités - MEEDDAT.5. Based on information supplied by Mr Yssoufou Cisse, Responsible for studies at the African Association of Public Transport.

27
Chapter 1 / Public funding
With regard to funding, the existence of a transit authority implies a rational use of the resources available, long-term forecasts on funding needs and fairer participation by the various players.
A form of organisation which is balanced between the various modes of transport and designed to favour connectivity and avoid any overlapping, and even competition between the modes of transport, results in a more rational use of financial resources. As the various forms of transport complement one another those lines which make a profit can fund other lines which are making a loss.
Medium- and long-term forecasts of transit needs allow the future resource requirements to be assessed and all of the financial backers to be involved in a global project. For example, if the government can only fund railway projects or an international financial backer only wants to get involved in bus lines, as the transit authority has an overview of forthcoming projects it will be able to use the various sources of funding for its entire project.
In a metropolitan area, the central town is the most attractive because it centralises numerous services which can be used by people who live outside of the town. It must therefore organise sufficient modes of transport for the benefit of external users or firms which pay their taxes in other towns. To share costs and make all of the towns contribute to the funding of the public modes of transport, an inter-municipal transport authority must be established.
If additional resources were to be allocated to the urban transport sector from, for example, betterment taxation or the allocation of toll or parking revenue to public transport, the existence of a transit authority would mean these resources would be used directly on urban transport. Without a transit authority, there is a risk that these new resources could go into the general budget.

Who pays what for urban transport? - Hanbook of good practices
28
1/7 Who funds the public budgetfor urban transport?
As public budgets are finite and as they have to respond to numerous public service needs, it is worth identifying their various sources which allow the urban transport sector to be funded.
Figure 4 : Diagram of funding for public transport
Direct and indirect taxes
The first source of funding is the general budget of the local authorities and the state which is funded by taxpayers through direct and indirect taxes. No resources are directly destined for urban transport; it is a political and budgetary choice which decides on the amounts to be granted.Nevertheless, some countries like the United States have introduced indirect taxes which are specifically allocated to the transport sector. In the State of California, counties can introduce temporary or permanent additional VAT (excluding food) which is strictly reserved for urban transport projects. These additional taxes must be approved by referendum and linked to specific and clearly identified policies or projects.
Authorities
Direct and indirect Tax Taxpayers
Petroleum Products Tax, Vehicle Usage Tax
Individual Transport Users
Wage-Bill Tax Companies
Land appreciation Tax Residents
Loans-Grants Banks and funding agencies

29
Chapter 1 / Public funding
Table 1 : Examples of additional VAT in the San Francisco Bay Area
County VAT rate
Year of implementation End date Annual
revenues*
San Francisco 0,5 % 2004 2034 66
Sonoma (rural county) 0,25 % 2005 2025 23
BART (Alameda, Contra Costa and San Francisco) 0,5 % 1970 permanent 238
* In millions of dollars (2005-2006).
Taxes on the use of private vehiclesThese taxes primarily concern private vehicle users who have to pay various taxes: taxes at the time of purchasing the vehicle, taxes on vehicle usage, atmospheric pollution, the recycling of the vehicle and fuel, in particular (taxes can account for as much as 75% of the price).When these taxes are pre-allocated for the transport sector in general and the urban transport sector in particular, as is the case in the US, Australia and Canada, they constitute a lasting source of funding. However, this revenue often goes directly back to the general budget, which makes it difficult to correctly analyse their actual contribution to the funding of the sector.In some cases, legislation does not permit the pre-allocation of a tax to an expenditure item. In other cases, the pre-allocation initially foreseen when the tax was created is deviated from its original goal. This is the case of Brazil where the CIDE tax on fuels, 25% of which was to be used to invest in urban transport, has since seen its end use changed 6.
Taxes borne by indirect beneficiariesA lot less widespread than taxes on private vehicles, these taxes already exist in some countries and represent a notable financial contribution. Those companies which benefit from the public transport system used by their employees to get to their place of work therefore contribute through the payment of payroll-based taxes. In France, a transport tax created in 1971 known as the Versement Transport is a tax of between 0.5% and 2.6% of the payroll of private and public employers with more than nine employees. It goes to the urban transit authorities and makes up a large share of the authorities’ budget. (It accounted for 37% of the 2008 budget of Lyon’s Transit Authority, Sytral) 7.
6. This subject is dealt with in more detail in chapter 2.7. The example of Versement Transport will be developed in chapter 4.

Who pays what for urban transport? - Hanbook of good practices
30
Another tax source which is not yet widespread but which is of great interest: betterment taxation, in light of the capital gains benefiting those living near a new line of urban transport 8. This could be, for example, a tax on existing buildings or buildings which are to be erected and which benefit from being close to the transport system. In Dublin, those inhabitants who benefit from the new tram line have to pay an additional tax because the real estate value of their property increased.
Loans and grants
Borrowing is one of the most common forms of investment funding used by local authorities and governments. The lender, whether public or private, national or international, will require guarantees that can be provided by public institutions (central government, public banks, etc.) or mechanisms such as the allocation of a share of fare revenues to a guarantee fund.Financial partners, bankers and international funding agencies have not always held public forms of transport in high esteem. This is because they considered this activity not to be “profitable” and that it required too many subsidies to make it break even. The activity was judged from a purely business perspective, while its role in the local economy was not considered. This meant that the funds allocated by international funding agencies for urban modes of transport were negligible compared to investments made in the transport sector in general.It appears that this attitude is changing; urban transport projects are now studied by development banks in relation to their impact on economic development, urban quality of life and the fight against climate change.
The actions of international funding agencies
Multilateral banks and bilateral public aid help to fund investments in transport systems but not in the operating of the systems. Their actions can take several forms:
Soft loans, namely, loans with conditions which are more favourable than bank loans in terms of:
duration: very long-term loans of 15, 20 and even 30 years; interest rates: bonus rates which are smaller than those on the banking
market; grace periods given before the first instalment.
The conditions of these loans vary in line with the situation in the country, the most favourable treatment is given to the least developed countries.
Tied and untied loans. As part of Bilateral Official Development Assistance, an agreement was reached by donor states to stop this aid from causing distortions in competition between countries. The loans and grants may be accompanied by terms and conditions regarding the use of the funds.
8. This subject is dealt with in more detail in chapter 5.

31
Chapter 1 / Public funding
Untied public development aid” refers to loans or grants which are freely and fully available to finance procurement from substantially all aid recipient countries and OECD countries. “Partially untied public development aid” refers to loans or grants which are in effect tied to the procurement of goods and services from the donor country and from a restricted number of countries which must include substantially all developing countries. “Tied public development aid” is defined as loans or grants which are either in effect tied to procurements of goods and services from the donor country or which are subject to procurement modalities implying limited geographic procurement eligibility other than those described above under Partially Untied.9
Grants which are very often aimed at studies or to support institutions to improve the design and management of transport systems. (Study of a master plan, creation of an organising authority, training of operators, etc.)
In addition to direct financial aid, the involvement of a funding agency gives credibility to a project and can thereby attract other financial backers, particularly banks, and facilitate the collection of funds.The allocation of equity capital alongside other institutions such as a national development bank, the state or a region is another advantage which can lead to a project in the form of a public-private partnership which may attract private capital into the process which has been made safe and given credibility by the presence of a funding agency. This is a role played by the European Investment Bank in Europe. It is also the procedure that governed the funding of metro line 4 in São Paulo with the presence of the World Bank and the Japanese Bank for International Cooperation.
Guarantees
All lenders require guarantees and a minimum level of legal protection.
Funding agencies demand guarantees from central governments to lend to cities which do not enjoy complete autonomy in these decisions. A notable exception is the French Development Agency (AFD) which is prepared to deal with cities directly without any state guarantees.
National development banks may act as guarantors for loans from financial institutions.
Financing packages can be structured to set aside a share of sales revenue to create a guarantee fund.
9. DAC Chair Report on Development Cooperation Appendix 2. Guiding principles on the tying of aid and recommendations on the untying of aid. 1987 www.oecd.org/dataoecd/24/36/31745168.pdf

Who pays what for urban transport? - Hanbook of good practices
32
French Development Agency (AFD) loans to local authorities 10
AFD works in more than 60 countries and French overseas territories. In 2008, AFD had over €3.4 billion in financial commitments. Sub-Saharan Africa is the continent which benefits the most from AFD support receiving 46% of AFD’s aid, followed by Mediterranean and Middle Eastern countries (24%) and Asia (around 23%).AFD decided to opt for decentralisation and to work, when the conditions allowed it, directly with municipalities by granting non-sovereign loans together with grants for institutional support. This policy, started in 2006 with Istanbul for the implementation of the municipal public transport programme, has been extended to other cities and continents. Local authorities accounted for 18% of beneficiaries in 2007, compared to 10% in 1997. This pro-active approach forms part of the Agency’s strategic policy for 2007-2011.
Loans: successful negotiation strategies
As borrowing can prove very costly, it must be managed as closely as possible and renegotiated insofar as possible in line with interest rate changes. Large savings can be made on the amounts in question. However, some local authorities who borrow money do not bear this in mind and lack the qualified staff to deal with it.
Active management of debt: the example of Sytral 11
To actively manage debt, a municipality must know how to adapt and alter its borrowing to minimise, at all times, its financial costs. This is mainly based on a detailed analysis of the financial market so as to draw up various strategies to cut costs and risks, particularly interest rate and exchange risks. Active management revolves around three main points:
Analysing the structure of the current debt: - list the main indicators (weighted average rate, duration, average lifetime, etc.); - monitor the indicators for debt and structured products; - identify potential room for manoeuvre.
Making use of opportunities on the current debt: - be responsive to market opportunities to make relevant decisions; - assess the benefits of renegotiation options: simulate penalty fees, clearing
rates, prepayment penalties, rollover rates.
10. From the brochure “AFD et la coopération décentralisée” (AFD and decentralised coo-peration) http://www.afd.fr/jahia/webdav/site/afd/users/administrateur/public/plaquettes/AFD_cooperation_decentralisee.pdf11. Information provided by Raymond Deschamps, Deputy Director of SYTRAL.

33
Chapter 1 / Public funding
Minimising future debt: - choose between intermediated or dis-intermediated funding; - define the selection criteria and prepare the consultation process; - compare bank offers on the basis of the discounting principle; - understand structured products.
Real-time information is essential to track the continuous changes in markets, bank offers, the financial situation of your organisation and legal and regulatory changes.Despite the age of its debt, SYTRAL’s active management allowed it to obtain an average interest rate which was below that of the market (4% instead of 4.39%). In 2008, all debt active management operations involving decisions taken during the financial year and those taken over previous years meant SYTRAL benefited from a cumulative gain of over six million euros, which represented more than 10% of its financial costs. This approach also contributed to a reduction in its level of debt
Summary
Public funding is an essential part in the development of urban transport systems. Participation in such funding is becoming multifaceted with the involvement of an increasing number of local authorities and national development banks. Such a wide range of sources may increase the amount of funds allocated to transport but it can also constitute a risk to the coherency and effectiveness of the investment. The creation of a transit authority means all resources can be channelled towards medium- and long-term goals. By offering the guarantee of a stable structure, it is also a way to access bank loans and funding from international agencies.
As public budgets are annual in nature and urban transport projects are long-term, only tax revenues which are allocated to urban transport can ensure the long-term funding which is needed for its development.

Hanbook of good practices in funding urban transport

35
Chapter 2
Fundingby users
Through the fare paid to the carrier, users are the primary source of funding for public transport on an operational level. Depending on the modes of transport and the manner in which these modes of transport are organised, the fare may or may not cover all of the operating costs (operating and amortization for the replacement of equipment). However, it does not cover new investment spending which is generally borne by the municipality.
Private vehicle owners, who are also users of public urban roadways – often at no charge – pay for using shared urban areas through taxes and may under certain conditions also contribute to the funding of public transport.
2/1 Public transport users
Ticket pricing policies are guided by the need to fund public transport at a cost which is socially acceptable to the municipality and users and which does not penalise the most underprivileged segment of the population. The role of public transport in the economic development of a metropolitan area, and even a region, means that the price of fares must not chase away users.
Various studies undertaken by the World Bank show that if spending on transport is more than 15% of a household’s income, public transport loses its appeal. An acceptable fare can then be examined on the basis of indices of what the poorest groups of people can pay by comparing the cost of a daily return trip with the minimum household income.
It is therefore important, for a strategic approach to funding, to consider the elasticity of demand in an economic and sociological context 12. The use of public transport by the middle classes is generally less affected by a rise or fall in the fare than use by lower social classes. A high fare could therefore constitute a factor of social exclusion as it would not allow the poorest in society to easily
12. The elasticity of demand in relation to a fare is the ratio between the variation in demand and the variation in the fare: if a 10% fare rise leads to a 5% drop in use, there would be a negative elasticity of 0.5 in demand in relation to the fare. The distinction is occasionally made between short- and medium-term elasticities, which may be different.

Who pays what for urban transport? - Hanbook of good practices
36
access the job market or public services which are usually located in city centres, while those with the least financial resources tend to live on the outskirts where accommodation is cheaper.
Fares and real costsShould public transport be subsidised or should users bear the actual cost of this service? This question, which is sometimes raised as an issue of principle, must be placed in the context of a transport system as a whole and in light of both public financial capacities and the quality of the service provided.
Diverse situations
In France, contributions from users only cover 25% of the operating costs of the public transport systems. The contribution rate varies according to the size of the systems: from 21% in systems with fewer than 100,000 inhabitants to 33% in those with over 300,000 inhabitants 13.
In Istanbul the coverage rate for the bus system operated by the firm IETT is 64% 14. This falls to only 41% when amortization and provisions for equipment replacement are included. ULASIM AS, a metro and tram line operator, covers 124% of its operating costs through its revenues.
In Ho Chi Minh City, public subsidies cover around 45% of the system’s operating costs (all public, private and cooperative bus companies).
In Tshwane, public minibuses/taxis (32% of motorised travel) do not receive any operating subsidies. The rail company and bus companies (15% of motorised travel) receive subsidies which cover more than 50% of their operating costs.
What costs should be considered and what ratios should be established?
It is customary to establish a ratio between business revenue (fare and complementary revenue such as advertising revenue, rent, etc.) and operational expenditure (staff, fuel and electricity costs, day-to-day maintenance and administration costs) and to analyse the coverage rate; a ratio of at least one would be ideal: this would mean that operating costs are covered.
13. CERTU Mobilités et transports. Fiche n° 10 Une décennie de transports collectifs urbains – janvier 2009 (Mobility and transport. Issue no. 10 A decade of public urban transport – January 2009).14. Istanbul - a case study by Caroline Fabianski. Figures estimated by the author on the basis of data from IETT and ULASIM AS, 2007 business reports.
37
Chapter 2 / Funding by users
However, to provide sustainable modes of transport, investment amortization has to be considered (by differentiating between rolling stock and infrastructure) and therefore provisions for replacing equipment. Another ratio shows to what extent the total operating costs are covered by fares (and other business revenues).
Lessons from international comparisons These lessons are to be considered with care due to the lack of information on the elements entering into the cost calculations. Furthermore, entire systems - and not simply modes or lines - are being compared. It is very clear that a central line that is fed by feeder lines will have a higher revenue/expenditure coverage rate and may even make a profit, as is the case with the metro lines in São Paulo, Santiago and Istanbul and tram line 1 in Montpellier. However, without the feeder lines, ridership would be lower and the ratio not as good.
CURITIBA: a multimodal management of public transportation, without public subsidies
In Curitiba, fares cover all of the operating and maintenance costs of the Integrated Transport Network (Rede Integrada de Transporte, RIT), which comprises both classic and rapid buses (BRT), uses 28 private operators and runs in 13 of the 26 towns that constitute the Metropolitan Region of Curitiba. Their activity is coordinated by a transit authority (URBS 15), which is owned by Curitiba municipality.This authority approves lines, collects the revenue and redistributes it among the operators according to the type of vehicle and the number of kilometres covered, as opposed to the number of passengers transported, this makes management easier and prevents rivalry between operators. The discount or concessionary fares given to the elderly and students are not borne by public funding. The cost of these concessionary fares is spread over all of the users who pay the full fare which, according to the Curitiba Association of Transport Enterprises, increases the cost of a single, full-price fare by 16%. However, the cost of the fare remains average to low compared with fares in Brazilian cities (2.20 reais i.e. €0.80).Approximately 38% of journeys are made on the transport system that benefits from Vale Transporte 16 , a form of financial assistance paid by employers to their employees when the cost of transportation exceeds 6% of their salary. However, this financial assistance only concerns employees in the formal sector. Furthermore, to enable all inhabitants to use public transport for leisure purposes or shopping, URBS has implemented a reduced fare (almost 50%) for everyone on Sundays, when the shops are open.
15. In the 1980s the 26 towns that make up the Metropolitan Region of Curitiba and Parana State (3.1 million inhabitants according to the 2007 data provided by the Brazilian Insti-tute of Geography and Statistics) delegated all transport administration to Urbanização de Curitiba, an urban planning agency created in 1973 by Curitiba Council to address urban planning in conjunction with a public transportation system.16. Vale Transporte is covered in detail in Chapter 4.
Who pays what for urban transport? - Hanbook of good practices
38
What kind of fare policy?A fare policy is an important instrument of transport policy and social policy. It is based on several mechanisms:
A range of fares for different target groups
Through different kinds of weekly and monthly passes, a discount is often given to frequent users compared to those users who purchase a single ticket. Such passes build the loyalty of users and increase occupancy rates. However, they can also lead to a drop in revenues as the unit price of the trip drops. Special pass fares are very often targeted at certain customer groups: pupils, students, the unemployed, senior citizens, etc. for whom there is a political will not to make them bear the cost of transport. There may also be commercial policies aimed at students, for example. One must then ask who bears the cost of these benefits which correspond to a social approach to public service: other passengers who pay the normal fare, as in Curitiba? The municipal authorities who pay financial compensation, as in Chongqing? Or the transit authority, as in France? 17 A comparative analysis of 137 French systems shows that only 38% of trips are paid for at the normal rate and represent 61% of revenue. Operational losses stand at 32% due to concessionary fares and at 7% due to no-fee fares 18. In some systems, though pass holders tend to represent the majority of customers, their contribution to revenues is small and compensated to a large extent by occasional users who pay a full fare. However, the paradox resides in the fact that many of these full fare users do not have the means to buy a pass: the poorest people therefore pay the most. Financial compensation is often included in the subsidy paid by municipalities and regions to the systems. This makes it difficult to ascertain the true cost of these special fares and their effect on the break-even point. The political desire to help certain population categories access the transport service often results in the entire system being subsidised. However, should the poorest people be helped by subsidising the fare or by helping the user, as is the case in Brazil where employers have to pay a transport bonus to employees with the lowest wages 19.This is a recurrent political debate which shows that there is a wide range of possible goals and social groups considered in a public transport development policy as demonstrated in the diagram below.
17. The Department of Education could also, in theory, be approached for pupil passes. However, there are hardly any known examples of such a practice.18. UTP in cooperation with GART. Annuaire de la tarification au 1er janvier 2008 (Directory of fares, 1 January 2008)19. The Brazilian system, Vale-Transporte, is presented in chapter 4.

39
Chapter 2 / Funding by users
Figure 5: Use of modes of transport and distribution of revenues
Source: Mitric in Inrets, Le transport artisanal dans les villes méditerranéennes, (Owner-driver transportation in Mediterranean cities). Actes Inrets N° 114, March 2008.
The diagram indicates that public transport can concern several social groups, the extremes of which may be targeted by different offers and fares:
potential private vehicle users who want a high quality of service and are prepared to pay a high fare;
poor people who do not have the resources to use public transport regularly and for whom the offer must be adapted at an affordable price.
This is an issue of policy, the terms of which vary from one city to another.
Methods to calculate the various fares
A flat fare, that is to say, a fare which is the same throughout the area covered by the modes of urban transport regardless of the distance travelled is appealing and catches the attention of users who travel long distances; it also facilitates the management of the fare system. It may be offered for only a given time. However, it tends to be unfavourable to operators with regard to revenue levels and it favours urban sprawl in particular: it penalises short trips and favours longer trips. A kilometre-based fare, that is to say, a fare based on the distance travelled could dissuade inhabitants on the outskirts of cities; these inhabitants are often the poorest people and rely heavily on public transport.
Poor
Population %
Level of income
Middle class Rich
No access to collective
modes of transport
Use of collective transport
Potential use of
private car
Use of private cars
Use of collective transport
threatened

Who pays what for urban transport? - Hanbook of good practices
40
A progressive fare is often a compromise between operating needs and urban policy choices. It is based on two kinds of approaches to geographic zones:
concentric rings: based on the distance of the zones travelled from the central zone (generally for extensive metropolitan areas);
zone-to-zone pricing according to the number of zones crossed (generally for polycentric metropolitan areas).
The degree of integration between networks
Several modes of transport often cohabit within the same metropolitan area; there may even be several networks managed by different operators. It is essential to have an integrated ticketing system allowing passengers to easily use all these modes of transport and networks and in a complementary manner, at no excessive cost so that the entire transport system is coherent and so that connectivity (namely, the ease with which several modes of transport are used on the same trip) can be developed.
The underlying principle behind fare integration is that one ticket provides access to all modes of transport even when managed by different companies. In general, the fare is less than the sum total of the fares of each system, which is favourable to users but unfavourable for constant traffic revenues. Nevertheless, the integration of fares makes the offer more appealing and can lead to higher traffic volumes which may partially compensate for the rate reductions made.
However, fare integration requires the use of high performance electronic fare system and management tools, formal agreements and the development of revenue distribution methods among the various operators. The system adopted must also be scalable and allow operators to enter and leave the system.
In developing cities where there are many owner-drivers, the issue at hand concerns their integration into the system. Here, the example of Bogota is worth considering. As part of the Transmilenio system, a trust fund which has the task of distributing revenue among the operators channels up to 20% of revenue to operators which feed users to the Transmilenio system. Payment depends on the number of passengers carried.

41
Chapter 2 / Funding by users
The metropolitan area of São Paulo - an example
In this megalopolis of 20 million inhabitants the transit authority which is responsible for interurban transport within the metropolitan area is STM (São Paulo State Secretariat for Metropolitan Transportation). The networks (metro, rail lines and rapid buses) are managed under the aegis of STM. The city of São Paulo and the neighbouring towns have established a transit authority for all of the urban modes of transport on their territory (generally buses). Each system had its own fares and its own ticketing; the sum of the separate costs discouraged users from taking several modes of transport. In May 2004, STM decided to integrate fares among its three operators and negotiated with SPTrans (the transit authority for the city of São Paulo) a “single fare” which gives users access to the various modes of transport at one fare. The success of this operation was so apparent in terms of traffic volume increases that the neighbouring towns applied to join. They have been gradually incorporated, when possible, given the chosen system.
How can new customers be won?Healthy management of public transport systems consists of reducing operating costs per km and increasing revenues per km. First of all, this involves avoiding commercial losses: the fight against fraud (which can sometimes concern a significant share of users) is essential to optimise revenue. Another line of action consists of seeking to increase the occupancy rate of vehicles for the sectors where they are under-occupied: this requires attracting new customers (while offering the same level of service):
by improving the quality of service, facilitating information in real time on frequencies and connections with other networks. In Toronto, Viva operators (a BRT system) ran a large scale information campaign to target a new customer base, which generally used private forms of transport, and to encourage users aged between 15 and 45, who account for 46% of the region’s population, to try Viva: routes travelled 15% to 20% faster than with a car, high frequency rates, real time information and connections with all of Greater Toronto’s networks. This campaign was a success: “Ride Viva Now”. The Viva BRT line recorded seven million trips in 2006 and eight million in 2007.
by offering adapted services and attractive fares: park-and-ride facilities, bicycle lock-ups. In Grenoble a return ticket on public transport costs €2.80. At a price of €1.60, the parking+tram system lets users leave a car in a secure car park, make a return tram trip (valid for four people) and also use the bus connections.
by modulating fares according to ridership times. To avoid additional investments being channelled into the modes of transport to deal with peak times, travellers who do not have any time constraints can be encouraged to plan their journey for an off-peak time.

Who pays what for urban transport? - Hanbook of good practices
42
Variable fares
In Santiago, Chile, there is an off-peak fare on Saturday and Sunday which also includes a 10% discount for the metro. A survey showed that a modal transfer of 4% had been achieved.
In Curitiba, a special fare has been introduced on Sundays at one real (€0.38) instead of 2.2 reais on work days to encourage leisure travel the poorest groups who do not receive any assistance from employers on Sundays.
In Rennes, Ganéo is a system which favours occasional travellers who decide to use the service at off-peak times: it gives a 10% reduction during the week and 20% on Sundays and official holidays.
In Washington, D.C. there are off-peak fares on Metrorail (between $1.35 (€0.95) and $2.35 (€1.66) depending on the distance travelled). Metrobus gives reductions to those with SmarTrip cards. These cards let users obtain an additional discount if they use both systems as there is no fare integration. Because the reduction system is quite complex it encourages users to buy a SmarTrip card.
2/2 Private vehicle users
As the main users of urban roads, private vehicle users pay a price to use the roads, which varies from one country to another, and are additionally taxed in several ways: fuel prices are taxed in some countries and heavily subsidised in others. These users therefore only rarely pay for the nuisances and side effects that they create: atmospheric pollution, congestion, accidents. The relatively low cost of private vehicle usage affects public transport fares. Fares cannot be too high otherwise they would make passengers return to their cars. How can the use of cars contribute to the funding of public transport? Through the allocation of all or part of the taxes paid by car users.
Taxes on vehicle ownership and usageThe purchase of a vehicle often gives rise to the payment of taxes to register the vehicle, depending on its horsepower or the number of axles for heavy vehicles. These taxes are paid by each new owner of the vehicle. For example, in Ottawa, these taxes represented 9% of the transport company’s (STO) operating budget in 2003. In some countries, import taxes may also be added, which can prove very expensive, as is the case in Vietnam. Nevertheless, this is increasingly rare as most countries are committed to global free trade.

43
Chapter 2 / Funding by users
There is a wide range of vehicle license taxes: annual license tax in Japan; right-to-drive certificates valid for a specific period (“certificates of entitle-
ment”) which are sold at auction in Singapore; purchase of an annual motorway pass in Switzerland to drive on all of the
country’s motorways. These taxes most often go directly to the national budget and only fund public transport indirectly.
Fuel taxesDepending on the country, fuel taxes vary to a great extent. Fuel sources can also be heavily subsidised as is the case in Venezuela, Iran and Algeria. High taxation is sometimes used to encourage a modal shift towards public transport. However, in developed countries, it is primarily a source of finance and sometimes a tool to fund public transport.
the State of California allocates 70% of fuel and heavy vehicle tax revenue ($4.3 billion in 2006) to the transport sector, 10.4% of which goes to public transport; most of these funds go to road and motorway maintenance 20;
in Colombia, the additional tax on fuel provided 20% of the investment for the first three Transmilenio system lines;
in Germany, the Länder (provinces) receive funds collected through federal fuel taxes. Bavaria uses these funds to subsidise the losses made by suburban rail services (40% of operating costs).
EcotaxesEcotaxes, which are still in their infancy, are part of the “polluter pays” principle and are designed to offset the costs borne by a municipality to scrap vehicles and the nuisances caused by pollution. Since 2005 in Japan there has been a recycling tax which is levied when the vehicle is purchased and paid to the “Japanese centre for the promotion of car recycling.” Japan, which has an 80% vehicle recycling rate, has a target of 95% by 2015. In Europe, where similar systems exist for the recycling of other products, particularly packaging and electronic goods, no tax of this kind currently exists. In 2007 in France, a bonus-malus system was introduced to discourage the purchase of polluting vehicles. However, this system, which was supposed to fund itself, has been such a success that it had to be funded through the state’s budget. The system was meant to encourage the purchase of clean cars and not to create a new means of financing the purchase.
20. AFD, MEEDDAT, CODATU. Who pays what in the field of urban transport, Subject-based analyses. SYSTRA (2009) CD Rom included in “Handbook of Good Practices in Funding Urban Transport”.

Who pays what for urban transport? - Hanbook of good practices
44
There is currently no tax directly linked to pollution whose revenue could be allocated to the promotion of non-polluting modes of transport. However, discussions are in progress, particularly within the European Commission. Furthermore, it is easy to imagine that other sectors would also advocate these taxes, such as the healthcare sector, which is directly affected, or certain local authorities which have to deal with problems posed by pollution.
Summary
The optimisation of business revenue to reduce operational subsidies while maintaining a socially acceptable fare is an ongoing challenge faced by the authorities and urban transport companies. Highly complementary systems and integrated ticketing can contribute to attaining this goal; the loss of revenue resulting from fare integration is likely to be offset by higher user volumes. It is also possible to attract new customers by offering a high quality service and attractive fares at off-peak times.
Targeting private vehicle users is also a worthwhile line of action. However, they are quite heavily taxed and the tax revenue is rarely directly allocated to the development of public transport since these taxes, particularly on oil products, are a very significant source of finance for national budgets.
45
Chapter 3
Road infrastructuresand parking charges
Urban road infrastructure and parking charges may be introduced for several reasons:
to finance road infrastructures; to regulate traffic and limit congestion; to encourage a modal shift towards public transport.
Funds raised can potentially be used to finance the public transport sector. This additional means of charging private transport users is sometimes difficult to implement as it is not fully accepted by society.
3/1 Congestion charging and public transport
Tolls for road infrastructuresCharges are levied on urban road infrastructures primarily to generate funds for extending and improving current networks. In some instances, the money is used for building a new road or bridge designed to reduce traffic on existing roads. Only users who are prepared to pay for a gain in time and/or convenience are charged. In other instances, the user has no choice other than to pay the toll, such as in San Francisco, where all eight bridges allowing passengers to travel within the Bay Area are subject to tolls.Once loan repayments have been met and operating and maintenance costs of the infrastructure have been covered, any surplus net revenues can be invested in public transport, providing certain conditions are met:
the infrastructure is operated by a transit authority which can transfer the net revenues directly to the public transport sector;
the infrastructure is operated by an independent public entity which must transfer its operating profits to a transit authority;

Who pays what for urban transport? - Hanbook of good practices
46
the infrastructure is operated by a Public Private Partnership. In this instance, a portion of the funds are used to pay the operator and the remainder is trans-ferred to the public transport sector in accordance with the terms specified in the contract;
the infrastructure is operated by a fully privatised subcontractor. In this ins-tance, net profit cannot be used to finance public transport unless it is spe-cifically stated in the conditions of the concession agreement, which can be dissuasive to potential subcontractors.
A substantial initial capital investment is required for civil engineering works, and net profit is absorbed in meeting loan repayments for many years after the infrastructure is put into service. Profits can only be transferred to the public transport sector once the cost of the infrastructure has been almost fully amortized.
San Francisco’s experience
The Metropolitan Transportation Commission (MTC) is responsible for planning and financing public transport for the nine counties of the San Francisco Bay Area. Its missions are to plan, select projects for financing and, since 1998, to levy taxes on 7 of the 8 bridges in the Bay Area through BATA (Bay Area Toll Authority), an authority under its supervision. The Ministry of Transport in California (Caltrans) owns the bridges, and the BATA is responsible for collecting a US$4 toll in one direction, and transferring the funds collected as follows:
$2 is allocated to the MTC for financing bridge maintenance and public transport. In 2007, out of the $75.2 million collected, $44.8 million was transferred to Caltrans for maintenance and repair work, and $30.4 million was used for operating public transport;
$2 is allocated to Caltrans to finance bridge improvements and to strengthen and reinforce bridge structures against potential earthquakes.
Congestion charging
Types of congestion charging
Congestion charging is designed to reduce the number of vehicles travelling in urban zones by charging users to enter the designated zones. It can be used to:
Reduce congestion in city centres: by encouraging a modal shift towards public transport; by discouraging motorists from using their vehicles at certain times, or from
taking certain routes.
Cities such as Singapore, London and Stockholm have chosen to implement en-trance charges to certain zones primarily to control the number of drivers entering city centres and to free up roads for public transport and professional use.

47
Chapter 3 / Road infrastructures and parking charges
Reduce pollution (which is exacerbated by congestion) and to improve the quality of city life by passing onto individual private transport users part of the environmental damage costs incurred.
Milan introduces the “eco-pass”
Milan’s congestion charge was introduced in January 2008 to tackle pollution by charging drivers of the worst offending vehicles a variable toll adjusted to reflect how polluting their vehicle is. The daily congestion charge applied between 7 a.m. and 6 p.m. costs between €2 and €10 depending on how polluting a vehicle is and at what time of day the vehicle enters the zone. Monthly passes are charged according to the level of pollution a vehicle emits, costing between €50 and €250. Vehicles are divided into five categories determined by the Euro emission standards. Two months after the tax was introduced, the number of commercial vehicles entering the zone dropped by 30% and traffic composition was significantly altered. Gross revenues are estimated to be approximately €5 million per month.
Raise new funds for investing in road infrastructures or public transport. In Oslo, a toll was introduced in 1990 for a limited period of time in order to raise funds for building new bypasses and tunnels which would relieve traffic congestion in the city centre. The moderate charge was introduced solely to raise funds, not as a measure for reducing traffic.
Depending on the main objective, be it to deal with congestion in a particular area, to raise funds, or to tackle congestion at certain times of the day, different systems can be implemented. We can typically identify cordon charging, area charging and toll roads.
Cordon charging: users are charged each time they enter the designated zone. The boundary, or cordon, often surrounds the heart of the city centre.
Area charging: a one-off charge is imposed on all users for travelling within the zone for a specific period of time (such as a day). It can, however, be varied according to the overall length of the journey (distance-based charging) and/or the time spent within the zone (time charging).
Toll roads: this toll applies to high speed roads running directly into central urban areas, and aims to provide clear roads to paying traffic, and to alleviate congestion on the toll-free roads.

Who pays what for urban transport? - Hanbook of good practices
48
Figure 6 : Types of congestion charging
Results of Singapore’s experience
Singapore was the pioneer in introducing congestion charging back in 1975, when it implemented an urban congestion charge designed primarily to tackle traffic congestion in the business district by levying a tax on vehicles with less than 4 passengers that travelled in the business district during peak hours. From the 1990’s, a very restrictive policy on the use of personal cars was introduced. It included measures such as the obligation to buy a licence when purchasing a new vehicle, an annual tax for road repairs and maintenance, and an urban road toll on city-bound high speed roads at peak hours. Motorists were required to display a tax disc on the windscreen of their vehicles.In 1995, the Land Transport Authority was created. It was responsible for streamlining all transport policies. In 1998 it implemented urban cordon charging. Thanks to technological developments, the system includes cameras that automatically detect vehicles, on-board equipment and pre-paid cards.Each time users enter the zone, they pay a variable price depending on the time of day. This has given rise to a reduction in traffic during peak hours, and motorists have learned to better organise their journeys.
Cordon charging Area charging Toll roads
Designated zone
Designated time
Standardized fares
Norway (Trondheim, Oslo, Bergen)
Stockholm Project
London, Singapore
(before 1998)
Variable rate fares
Singapore (since 1998)
Hot Lanes (San Diego, SR 91)
Highway 407
Users are charged
each time they enter the designated zone.
No charges are imposed for journeys
within the zone.
Users are charged each time they enter the designated zone and may be charged for internal journeys
within it.
The motorist pays for the privilege
of using the road; generally
a free-of-charge alternative exists.

49
Chapter 3 / Road infrastructures and parking charges
By 2003, the aim of reducing traffic congestion in the city centre had been fully accomplished:
there was a marked decrease in traffic in the business district; average cruising speed doubled during paying periods; between 1975 and 1991, traffic decreased by 45% within the zone, and then
by a further 10 - 15% after the new system was introduced 21; car-pooling became increasingly popular.
Congestion charging has been particularly well received by Singapore’s citizens. They are aware that they are more exposed to the inherent dangers of traffic congestion, given the high population density on the island, and so they consider urban tolls to be a direct tax on congestion. (A survey revealed that 70% of the citizens believed it was fair to tax vehicles according to how polluting they were).
In 2003, gross revenues amounted to €133 million. 10% was used to cover operating costs. By 1998, the €93 million capital invested had been fully amortized, and since then, the LTA has received €120 million in funds which have been transferred to Singapore’s central government. It is therefore difficult to assess how much capital has been invested in public transport.
Results of London’s experience
Congestion charging was introduced in London by the city’s transit authority, Transport for London (TfL), to manage policies covering the entire transport spectrum, from road traffic to public transport. Congestion charging was introduced in two successive stages: in 2003, the zone covered 22 square km, and in 2007 it was extended to 40 square km. Cameras record the vehicle number plates, and they are then checked against the list of users who have paid the daily charge of £8 (around €9) to travel within the zone. Payment is compulsory from Monday to Friday between 7 a.m. and 6 p.m. and can be made by text message, on the internet, at points of sale, over the telephone, by post etc. The zone’s residents are entitled to a 90% reduction if they buy a monthly or annual pass. Emergency vehicles, vehicles for disabled persons, vehicles with more than 9 seats, motorcycles, taxis and buses are exempt from congestion charging.
The goals of the congestion charging policy set for 2010, are: a 15% decrease in road traffic (excluding motorcycles) within the zone; a 20-30% decrease in traffic congestion within the congestion charging
zone; by 2020, a modal shift of 20,000 passengers towards public transport during
charging times.
21. Péage urbain : principes pour une loi. (Congestion charging: principles for drafting a law). Olivier Paul Dubois-Taine, President – Rapports et documents – Centre d’analyse straté-gique. September 2008. http://www.stratégie.gouv.fr
Who pays what for urban transport? - Hanbook of good practices
50
In 2004, research carried out by TfL show that these goals have largely been accomplished.
traffic (excluding motorcycles) has decreased by 15%; congestion has decreased by 35% in the zone, which has resulted in a 3km/h
increase in traffic speed, from 14 km/h to 17 km/h; 14,000 users have switched to public transport.
The introduction of congestion charging wasn’t met with a strong opposition. This may be attributed to the fact that the scheme was introduced in a limi-ted zone, where less than 15% of passengers travelled in personal cars even before the trials began 22. Congestion charging appears to have been better accepted by Londoners than by the rest of the country. In 2003, over 60% of Londoners considered congestion charging to be a good thing, compared to 43% of people outside the capital.
Visibly, the introduction of congestion charging has had a positive impact on the property market, as six months after the zone was extended, the cost of rented office space rose more sharply within the zone than in equivalent areas that did not have congestion charging 23.
Congestion charging in london and the public transport funding scheme
One of the objectives of London’s congestion charging scheme was to generate net cash flow for public transport by imposing mandatory charging for at least the next 10 years. The objective was to generate €180 million per year. This objective was not reached for two key reasons:
the cost of operating the scheme turned out to be very high, at 50% of gross revenues;
the scheme was a victim of its own success - the modal shift resulted in less congestion charges being collected, even though the expansion of the zone in 2007 increased daily income from €106,000 to €167,000 despite the fact that 40,000 more residents were eligible for a 90% discount 24.
The financial results, however, are worth noting. For the financial year 2007-2008, gross revenues amounted to approximately €300 million and operating costs totalled €146 million 25. The €154 million additional net revenues that TfL recorded were allocated to improvements of Greater London buses.
22. Péage urbain : principes pour une loi. (Congestion charging: principles for drafting a law). Olivier Paul Dubois-Taine, President – Rapports et documents – Centre d’analyse straté-gique. September 2008. http://www.stratégie.gouv.fr.23. Transport for London. Impact monitoring. Sixth Annual Report. July 2008.24. Ibid.25. Ibid.

51
Chapter 3 / Road infrastructures and parking charges
Figure 7 : Traffic in London’s central zone subject to congestion charging during peak hours (7 a.m. to 6 p.m.) from 2002 to 2007
Source : Transport for London. Impacts monitoring. Sixth Annual Report. July 2008.
Conditions for implementing congestion charging
The public transport network must be capable of absorbing the higher volume of new users, and of a high enough quality for the modal shift not to be percei-ved as an act of discrimination. If this is not the case, congestion charging could curb travel within the zone and potentially cause a drop in economic activity, or it could prompt users to travel to other zones where journey costs are less prohibitive.
Social acceptance is essential, and is only gained by explaining to users that congestion carries both social and environmental costs. Congestion charging can be described as a “pay-to-pollute” licence. As in London’s case, the scheme is often better accepted once it is up and running and the residents have had time to appreciate the positive impact it has had on their quality of life. If it is presented in a careless manner, it can provoke a strong public backlash.
In Manchester, 80% of residents voted against a plan to introduce a congestion charge of £5.78 (€6) during peak hours in a vast 128 square km zone.The transit authority in Edinburgh planned to introduce congestion charging to finance line 3 of the tramway, valued at €380 million for a 15 km track. However when it was put to a referendum, the proposal was decisively rejected. This experience shows that it is not sufficient to allocate financial resources to a good cause, but that the project must also be presented in a favourable light and fully explained in order to positively influence public opinion.
200 000
180 000
160 000
140 000
120 000
100 000
80 000
60 000
40 000
20 000
0Cars and minicabs
Vans Lorries and others
Taxis Buses and coaches
Powered two-wheelers
Pedal cycles
Charging hours flow
Spring 2002 Automn 2002 January 2003 Feb/Mar 2003 Spring 2003 Automn 2003 Spring 2004 Automn 2004
March 2005 Spring 2005 Automn 2005 November 2005 Spring 2006 Automn 2006 Spring 2007 Automn 2007

Who pays what for urban transport? - Hanbook of good practices
52
Traffic policies and public transport policies must be aligned. either by a transit authority, responsible for managing all transport policies
and means of urban transport, and covering every aspect from traffic flow through to public transport. This is the case in London, Singapore and Milan, whose authorities are Transport for London, Land Transport Authority and Azienda Transporti Milanesi respectively;
or transport entities must work in close collaboration, such as in Stockholm, where the Swedish Road Administration has developed and manages conges-tion charging, and Stockholm’s Road Transport Department is responsible for extending public transport services and the park and ride scheme.
3/2 Paid parking and public transport
Authorities can use parking in city centres to control mobility, but if it is to be effective, the parking policy must be streamlined with all other transport policies. Paid parking must be viewed as a means of charging motorists for occupying space on urban roads, but can also be used as a method to encourage a modal shift, and as a source of income. Introducing policies is often a balancing act between the desire to satisfy the needs of users by making public parking available, and the necessity to control the space available and to minimise pollution.
If supply is to meet demand for parking spaces, the number of available spaces must be increased, parking spaces must be built within new constructions, such as office complexes, and an increase in traffic volume must be accepted. This common situation has caused traffic to slow down, and urban space to be used in a disorganised manner, with conflicts arising between different road users over sharing parking spaces. It threatens security in cities and has a negative impact on the quality of life in urban settings.
Limiting the supply of parking spaces and regulating the supply according to several criteria (e.g. based on parking time, such as is done in Barcelona 26) is a way of controlling the demand for using personal vehicles in city centres. However, to implement such a policy, several conditions need to be met:
alternative or combined transport means should be available, such as park and ride facilities at the edge of city centres;
traffic must be reduced in order to make travelling and parking for professio-nal reasons easier (such as for urban freight transport);
26. See Codatu “Urban Transport in the Mediterranean Region: Guidance and Recommenda-tions” 2008, p. 65.

53
Chapter 3 / Road infrastructures and parking charges
a certain number of parking spaces must be planned in order to ensure eco-nomic vitality in city centres and to generate funds for covering the cost of operating and improving the roads.
Parking, like congestion charging, is a means of encouraging modal shift, but in certain cases, it can also be used to generate revenues which can be invested in urban public transport.
Parking in MontpellierThe Transports de l’Agglomération de Montpellier (TaM) in Montpellier is a semi-public company that implements transport policies. It has been commissioned to do so by Montpellier’s transit authority, the Communauté d’Agglomération de Montpellier (CAM). The TaM is responsible for:
operating and extending a bus and tram network within Montpellier’s urban community;
developing sustainable transport, for example cycle hire and cycle routes; actively managing 40% of parking in city centres.
In its Urban Transport Plan, Montpellier described parking as a lever of action, and recommends creating more residential parking at lower parking rates, and in parallel reducing parking in areas of work close to tram stops, and implementing park-and-ride facilities at the edge of Montpellier’s city centre. The idea is to encourage individuals to leave their car at home or in a park-and-ride site, and to use public transport to enter the city centre.
TaM is responsible for implementing these directives by managing: seven park-and-ride car parks at tram stops (three already exist and four are
under construction) offering 3,000 parking spaces at very attractive rates: free for TaM pass holders; €3 for a park-and-ride return ticket for the city’s civil servants, and €4 for the general public;
seven public car parks in the city centre with a total of 3,300 spaces. Parking rates are set by the municipality;
close to 15,000 parking spaces on roads with pay-and-display meters, accoun-ting for 3/4 of city centre parking. The rate is set by the municipality.
TaM aims to strike a balance between offering rates that are high enough to prompt people to use public transport, but low enough to be acceptable to shops and local residents, so as not to drive all business and residential activity out of the city, but to cover costs for construction and maintenance of works. A specific price scale was chosen for residents, and a parking zone system based on parking time (short-stay, medium-stay and long-stay) for non-residents.This policy has helped to solve the problem of a shortage of parking spaces in city centres and has reduced congestion caused by motorists looking for a place to park. It also represents healthy financial management.

Who pays what for urban transport? - Hanbook of good practices
54
Table 2 : Capital flow from parking in Montpellier (in thousands of €)
Revenues
Pass holder permits (regular and residential use):Fees from occasional use:
Other income:Subsidies from local authorities:
3,0765,173
1118
Total : 8,378
Expenditure
Staff costs:External purchases:
Fixed costs:Taxes:
Provisions and depreciation:Taxes paid to local authorities (annual fixed charge):
TaM gross Profits:
2,109710678402
2,1341,951
394
Total 8,378
With a gross profit from parking activities of close to €400,000 in 2007, a margin remained - albeit it smaller than other sources of funds - for investing in improvements to the public transport service, for which TaM is equally responsible 27.
Order magnitude In San Francisco: $197 million, or a third of SFMTA’s budget
The San Francisco Municipal Transportation Agency (SFMTA) comprises MUNI (the municipal transit agency responsible for operating public transport) and the traffic and parking management authorities. It manages all municipal urban transport policies, including 40 city-owned paying car parks and all street parking.Revenues from parking are composed of user parking permits, resident permits, parking fines and half the 25% tax on private parking income.
27. Total transport system charges amounted to €65 million in 2007.

55
Chapter 3 / Road infrastructures and parking charges
Figure 8 : Breakdown of parking revenues in San Francisco
In France
Table 3 : Global annual revenues for paid street parkingin city centres based on the size of urban area 28
Core of an urban unitAnnual revenues in thousands of euros
Average Minimum Maximum
Less than 50,000 inhabitants 322 65 1,113
From 50,000 to 100,000 inhabitants
600 267 1,600
From 100,000 to 300,000 inhabitants
2,411 689 5,000
From 300,000 to 1 million inhabitants
2,226 1,400 6,100
Over 1 million inhabitants 5,504 3,202 6,400
Source : CERTU Rapports d’études. Le stationnement en France en 2005 (Parking in France in 2005).
The operating cost of one parking space is estimated at between €350 and €450 per year 29.
28. Sample of 83 city centres.29. “Stationnement, sortir de l’égarement” (Parking : which way out?) - FNMS May 2005 from PUCA 2000 study.
46 %
Parking permits
29 %
Residents permits
11 %
Tax on private parking
for the SFMTA
11 %
Tax on private parking
for the city and the county
Fines
3 %

Who pays what for urban transport? - Hanbook of good practices
56
In Nantes
7,000 parking spaces generate a net profit of approximately €1,000 per space per year.Cost: €2 million per year. Income approximately €7–9 million per year 30.
Conditions for implementing paid parkingThe primary condition is to have enough on-street or off-street parking, which
is not always the case in developing cities, where on-street parking is often insufficiently controlled. One of the first measures to be taken is to build a certain number of car parks in the city centre, and to implement paid on-street parking in order to create more space so that traffic can move freely. However this policy needs to be followed by measures to limit road traffic through the use of parking restrictions.
In order to have an effective lever for its mobility policy, the public authorities must either have direct control of car parks, or exercise indirect control by imposing regulations, such as the authorisation to open private car parks, and setting rates. They must also budget for a decrease in part of their income.
The public transport service must be in a position to complement the parking policy by offering a high quality service.
A transit authority makes it easier to integrate paid parking into the overall urban mobility policy.
Net revenues from parking should be allocated to the urban transport policy, which is more likely if a transit authority manages all transport policies.
An idea for the future: transferring management of parking finesA number of towns wish to decriminalise parking fines so that they can self-manage them and reap the financial rewards. In most countries, the tax authorities are responsible for the financial management of parking fines, and appeals are dealt with through the courts as parking fines are considered an infringement of the law.In France, the State allocates part of revenues from parking fines to all local authorities and urban communities, to the Ile-de-France region (Paris area) and to the Ile-de-France Transit Authority. The example of San Francisco serves to highlight the importance of these budgets. 46% of parking revenues come from fine payments 31. By decriminalising parking fines, power to manage them would be transferred to local authorities who could then allocate the revenues to improving urban public transport.
30. Study: SARECO - www.sareco.fr31. See figure 8 p. 55.

57
Chapter 3 / Road infrastructures and parking charges
Britain’s experience of decriminalising parking fines 32
In 1991, the Road Traffic Act 1991 transferred power to the local councils to manage and collect parking fines. Outside London, councils were not under the obligation to introduce the civil system, but since 2000, many have chosen to adopt it. In 2006, 157 councils plus London had adopted the system, accounting for 40% of all borough councils in England and Wales. They had to establish a “civil system”, including implementation of Special Parking Areas (SPAs). The councils or their delegates employ civil enforcement officers who issue parking fines. Parking fines are paid to the local councils and the profits must be invested in public transport projects. And since the Traffic Management Act of 2004, profits can also be allocated to environmental projects.In London the system has worked well; it has resulted in more motorists using car parks, less congestion caused by motorists looking for parking spaces, and it has been widely accepted by the capital’s population. However, this is not the case in all towns. The civil system is sometimes seen as a money-spinner because it has been poorly publicised, lacks transparency and makes it difficult to appeal against unfair parking tickets. Moreover, research shows that residents are not against the system per se, but they wish for more transparency, especially regarding the use of net profits, which the majority would like to see allocated to urban public transport. New decrees are being drafted to streamline all aspects of the civil system.
Summary
Net profits generated by congestion charging and parking can be invested in public transport under certain conditions:
Congestion charging and parking management must be perfectly harmonised in order to:
provide a public transport service of sufficiently high quality to absorb the in-creased number of users caused by the introduction of congestion charging or paid parking. Users should not feel that they have been discriminated against by being forced to use public transport;
develop a sustainable transport network; allocate net profits to public transport improvement projects.
32. CERTU. CETE Méditerranée. Dépénaliser et décentraliser le stationnement pour confier le contrôle et la sanction aux collectivités locales. L’expérience britannique et ses enseigne-ments pour la France. (Decriminalizing and decentralizing parking. The British experience and testimony for France) Ed. CERTU research reports.
58
Who pays what for urban transport? - Hanbook of good practices
Users have to be prepared through targeted information campaigns before introducing the system in order to gain their acceptance. Positive impacts, such as reduced congestion and less pollution, need to be emphasized.
The system can be a victim of its own success: less traffic means less income. This element needs to be taken into account when performing financial assessments.
59
Chapter 4
Taxes on employersand business activities
Urban public transport is vital to economic activity within a region. It plays a key role in encouraging business development by providing employees with daily access to their workplace, giving clients access to sales outlets, and facilitating the delivery of goods. Viewed in this light, it is only natural that companies and business activities should contribute to funding public transport.
4/1 Voluntary involvement of companies
Organising their own networksEmployers may have to organise their employees’ transport:
when the public transport service is insufficient or irregular; when company premises are situated far from transport corridors, as is often
the case at the periphery of towns and/or in business parks; when the company’s employees work outside normal public transport opera-
ting hours or during reduced operating hours.
This type of service, which is common in countries such as Algeria, Morocco and India, stems from the company’s own initiative, and it thus improves access to the site and reduces car dependency. Employers can either organise the transport themselves, or outsource the task to a private coach company. As the cost can be significant, companies tend to group together to provide the service.
Allobus
Allobus is an “on-demand” bus system for the employees of Roissy Charles de Gaulle airport. It is therefore mainly financed by Aéroports de Paris, with participation from STIF (the transit authority for Ile-de-France) and the regional authorities where the majority of employees live.

Who pays what for urban transport? - Hanbook of good practices
60
Once the urban public transport service becomes satisfactory, companies often tend to abandon their own transport arrangements for employees, as they can become quite burdensome. However, the very existence of employer-managed transport can be counterproductive: because the transport needs of employees are already met, building transport corridors becomes less of a priority, and the extension of the public transport network in these areas is sometimes postponed.
Encouraging use of the public transportation systemTransit authorities are keen to involve employers in organising the mobility of their employees, and more generally, the accessibility of their site. The details and the state of progress of the projects vary widely by country, but all these initiatives share a common aim:
to encourage employers to think about and take responsibility for access to their workplace, and possibly to improve access via certain developments;
to reduce traffic congestion and its impact on the environment by encou-raging car-pooling and car-sharing, and by promoting sustainable means of transport (such as public transport, bicycles, walking) and intermodality.
Since 1 July 2004, Belgian companies with over 200 employees in the region of Brussels are required to set up a Company Mobility Plan. In France, company mobility plans (and public administration mobility plans) are not compulsory, but transit authorities actively encourage them. Similar initiatives, known as Travel Plans, have been implemented in the United States, England, New Zealand and Canada as part of their Transport Demand Management (TDM) policies. For certain development projects, a travel plan is mandatory.As part of TDM, some American states have adopted a “parking cash-out” programme – a scheme in which the employer pays cash compensation to employees who choose to give up their free parking spaces, with compensation amounting to the equivalent sum paid for a space. This money can thus be used by employees for public transport or for car-pooling.
Results of a seven-year Company Mobility Plan in the region of grenoble 33
In 2001, the Urban Transport Consortium of Grenoble (SMTC) assigned the public-private entity Sémitag (responsible for Transport in the region of Grenoble) with the task of implementing a Company Mobility Plan (CMP) within its overall Urban Mobility Plan. Sémitag has developed methods for raising awareness on CMP in companies, including information days, a dedicated CMP internet service and hotline, route planners and eco-route planners. In cooperation with the Chambers of Commerce and Industry, and with the support of the Ademe (French Environment and Energy Management Agency), it implements customised CMP for interested companies.
33. TAG brochure: Transportons-nous vers demain. Abonnement PDE (Transport for tomorrow - CMP).

61
Chapter 4 / Taxes on employers and business activities
Moreover, Sémitag also offers an attractive price scale: for employee commutes; for business trips; price reductions for renting a fleet of company bicycles and vehicles for car-sharing.
In 2008, the results were positive: over 53% of employees (approx. 60,000 people) in the metropolitan area of
Grenoble benefited from a Company Mobility Plan; 7,500 employees were Company Mobility Plan pass holders (approximately 20%
are new pass holders); 2,140 cars less in daily traffic. 50% of trips were made on public transport.
Objective for 2020: 56%.
4/2 Mandatory financing of the transport system by companies and business activities
Businesses contribute to financing public transport through general taxes, although in some countries a direct tax is imposed on companies since the authorities consider them to be indirect beneficiaries of the public transport system. These mandatory taxes are applied in two ways: (1) a tax is charged on a company’s total payroll costs and directly attributed to the public transport sector; (2) subsidies are granted to salaried employees who use public transport.
Transport tax in FranceThe most widely known and applied transport tax is the French “Versement Transport,” or VT. It was introduced in 1971 for public and private companies with more than nine salaried employees in the Ile-de-France region. Its purpose was to provide the necessary funding to extend and improve public transport services in the Paris area, which at the time was experiencing rapid economic growth. It was then gradually extended to all metropolitan areas with a transit authority.VT, which is calculated as a percentage of a company’s total payroll costs, is collected by Social Security and transferred to the transit authority. The percentage rate applicable is determined by the individual local authorities, although a ceiling is imposed by the State:
Paris and its suburbs: in Paris and the neighbouring Hauts-de-Seine county (where La Défense business district is located), the percentage rate is capped at 2.6%. This ceiling rate is reduced to 1.7% for the other inner ring suburbs, and 1.4% for the outer suburbs;
the rest of France: the percentage rate is capped at 1.75% for towns that have dedicated public transport corridors; 1% for towns with more than 100,000 inhabitants; and 0.55% for towns with fewer than 100,000 inhabitants.

Who pays what for urban transport? - Hanbook of good practices
62
Figure 9 : Growth rate of transport tax revenues since 2000 (in M€)
Source : GART - Urban transport in 2007.
Revenues from VT are evenly divided between Ile-de-France and the rest of France, although there has been a slight increase in revenues from towns outside the capital who have invested in diverse public transport projects using funds obtained from the VT tax. Since its inception, VT has provided a sustainable source of financing and has significantly contributed to improving the public transport system. Funds collected from VT have strengthened the transit authorities’ budget, and so can be used to cover both operating and investment costs.
A comparison€5.57 billion collected in 2007.In Ile-de-France, VT accounts for 1/3 of funds allocated to public transport.In Lyon in 2008, VT (which amounted to €246 million) represented nearly 37% of the annual budget for Sytral, the local transit authority.
Direct financial support for employeesDirect financial support for employees is an indirect financial aid for the public transport service. The funds are aimed at increasing demand by inciting employees to use public transport, rather than increasing supply. This method offers greater transparency concerning the cost of transport, as the ticket price is paid in full. It is a good incentive to use public transport.A variety of methods have been employed in different countries, with certain methods based on voluntary participation, like in Chicago, where companies can take advantage of tax exemptions on the amount they allocate to employees to buy a transit pass. The most effective methods, however, are those in which the company is legally bound to comply. The most successful examples that can be evaluated are Brazil and France.
2,402
2,040
2,315
1,978
2,477
2,179
2,551
2,264
2,684
2,362
2,713
2,472
2,704
2,612
2,820
2,749
Ile de France France
2000 2001 2002 2003 2004 2005 2006 2007
6,000
5,000
4,000
3,000
2,000
1,000
0

63
Chapter 4 / Taxes on employers and business activities
The Vale Transporte system in Brazil 34
The Vale Transporte system, which was introduced in 1987, is an employer-subsidised public transport scheme. Employers are under obligation to cover the extra cost of an employee’s transport if it exceeds 6% of the salary. The employer buys public transport vouchers from the transit authority and tops-up the employee’s electronic transit pass. It is a legal obligation that is applicable in all city centres.
Figure 10 : Percentage of journeys made using the “Vale-Transporte” scheme
Source: National Association of Urban Transport Enterprises - NTU.
Transport vouchers can be used for urban and interurban public transport services subject to a fare policy decided upon by the transit authority. Private transport is excluded, including small-scale transport operators, which are very common in large Brazilian cities.Vale Transporte is an essential resource for financing the cost of transport services, and it offers a number of advantages:
it is used for 4 out of 10 journeys made on the country’s public transport system;
employees do not feel the pinch of rate increases, as the cost to them is capped at 6% of their salary. The employer covers the extra cost;
it represents a means of social justice, in that only the poorest are entitled to it, at least for workers in the formal sector of the economy. The Vale Transporte system is most widely used in Brasilia, with 68% of users. This is largely due to the dominant share of public-sector employment.
34. Literal meaning: Worth Transport.
2000 2001 2002 2003 2004 2005 2006 2007
60,00 %
50,00 %
40,00 %
30,00 %
20,00 %
10,00 %
60,00 %
Including São Paulo Excluding São Paul

Who pays what for urban transport? - Hanbook of good practices
64
However, as the system has developed, it has on occasion been misused: Vale Transporte has become a parallel money traded on the black market, especially for using small-scale transport. Introducing electronic cards has helped to significantly reduce this illegal traffic.Another drawback is that Vale Transporte is only available to formal economy workers. Despite progress in the employment market, formal employment only represents 48% of the total workforce in the country’s six largest metropolises. Therefore, a large number of users are excluded from the system.Transit authorities and operating companies voted overwhelmingly in favour of this system because it guarantees user loyalty, and creates an incentive to use public transport.
Who benefits from Vale Transporte?
In Brazil, a transport ticket costs on average €0.86 (2.4 reais). Employees thus spend an average of €38 per month on travel costs, i.e. one return ticket for 22 days, if they only use one means of transport (many cities do not offer ticket integration).Without transport vouchers, this cost represents 22% of the income of an employee earning minimum wage, which is €166. Thanks to the system, all employees earning less than €626 per month are entitled to transport subsidies. This accounts for a large percentage of the population, since the average monthly salary in Brazil is €350 35.
Reimbursement of part of the cost of transit passes in France
Introduced in the 1980s, reimbursement of 40% of the cost of transit passes was at first only intended for users in the Paris region. Employers were obliged to pay transport subsidies along with salaries, and this held true for all employees, regardless of their status or salary, from the CEO to the caretaker.The aim was to provide employees with an incentive to use public transport, and the fact that the scheme was limited to the Paris region was justified because commutes in this region were longer, and therefore more costly, than commutes in other towns and cities in France. Since 1 January 2009, this compulsory scheme has been extended to all town and city centres with a public transport service, and 50% of the cost of a monthly transit pass is reimbursed. It is paid at the end of each month, and appears as a separate entry on the payslip when the employee has provided proof of purchase of the transit pass.
35. Source: IBGE Brazilian Institute of Geography and Statistics.

65
Chapter 4 / Taxes on employers and business activities
Since 1 January 2009, employers can also opt to pay for their employees’ private transport costs if the use of a personal vehicle is made absolutely necessary, due to a lack of public transport, or shift work. The employer must offer to meet commuting costs for all employees, must take into account the distance commuted, and must be the sole decision-maker in the scheme. The rate cannot be standard for all employees: it must be based on the distance between home and the workplace, and entitles full-time employees to an exemption of social security contributions up to €200 per year 36.
Summary
By implementing compulsory contributions from companies and business activities, such as the VT tax and public transport subsidies for employees, sustainable forms of financing are created which contribute to covering both investment and operating costs.
VT is used for topping up transit authorities’ budgets and contributing to the system as a whole. Subsidies for employees are designed to encourage use of public transport, and to play a social role in the case of Brazil’s Vale Transporte scheme.
However, certain prerequisites are necessary in order to implement such schemes: a political consensus, due to the need for a regulatory or legal mechanism; acceptance by employers, or at least a majority of employers. In order for
them to fully participate, they must reap the benefits: improved transport conditions for their employees, more reliable schedules, a service extended to cover their place of work, etc.;
the presence of a transit authority to manage capital flow and allocate funds to projects.
36. This measure concerns residents of the periurban areas that are not served by public transport. It aims to improve their mobility in the same manner as those who have access to a public transport network.

Hanbook of good practices in funding urban transport

67
Chapter 5
Land value capture in areas served
by public transport
The development of transport infrastructure generally gives rise to an increase in the value of the land and buildings served. The value is estimated at between 5% to 10% for residential properties, and between 10% and 30% for commercial properties, according to various case studies. For example, when the metro was built in Helsinki, the price increase of apartments was inversely proportional to the distance from the metro station within a radius of 750 metres, with a particularly high level between 250 and 500 metres. The value uplift of the 81,000 buildings less than a kilometre away was estimated at between US$550 and US$670 million 37.Conversely, it can have a negative impact: pollution, noise, an increase in traffic, a loss of prestige in local areas, or a drop in value in areas that are not served by public transport. Again in Helsinki, areas that are not served by public transport have dropped in value. This loss in value has been estimated at between US$90 to US$150 million for the whole of the metropolitan area.Proximity to a public transport corridor generally participates in increasing business for local shops and services, and increasing productivity whilst reducing costs for consumers, business activities and public administrations. Moreover, land near the transport corridors is put to better use, with increased land value giving rise to new urban developments, or new ways to use the land.
An independent study commissioned by Transport for London on the extension of the Jubilee Line estimated that between 1992 and 2002, the value of the land surrounding two of its 11 new stations (Southwark and Canary Wharf) had increased by €3.6 billion, while the cost of building the line amounted to €4.5 billion 38. The British government could have built the extension of the Jubilee line at no cost to the exchequer if it had chosen to capture barely a third of the land value increase generated by the project.
37. Laakso, S. Public transport investment and residential property values in Helsinki, Scan-dinavian Housing & Planning Research, 9, 217-229. (1992).38. University of Westminster, The Jubilee Line Extension study, 2004.

Who pays what for urban transport? - Hanbook of good practices
68
The challenge facing developers of a new line (whether public or private) is knowing how to capture the value generated, so that the capital can be used for investing in new infrastructures, or for covering operating costs of existing infrastructures. A number of methods have already been tested, and they can be divided into three distinct categories: 1. anticipated purchase of land in order to sell it at a profit, or to develop busi-
ness activities on it;2. introducing a betterment tax to capture land value gains;3. establishing a Public Private Partnership. None of these options are self-contained. In fact, a Public Private Partnership with a property development company can be established prior to introducing a tax to capture land value gains. In general, financing that involves capturing property value gains should not be limited to just one mechanism, instead it should be viewed as a part of a range of complementary methods.The choice of mechanism depends on the objectives of the public policy and must be coherent with the city’s socio-economic, financial and urban policies. Mechanisms for capturing land value gains must be clearly understood by developers and the community at large and must be easy to implement without creating an additional economic expense which would hinder employment and economic growth.
5/1 Anticipated purchase of land
This method involves public authorities buying land before announcing that an infrastructure will be built, or where the route will run. In this way, the purchase can be made at market price without the infrastructure. The strategy then consists in:
directly selling the land to private developers including the estimated added value in the sale price, such as was done in Aguas Claras on the periphery of Brasilia, or in Copenhagen;
developing the area as part of an urban renewal project and then selling it at market price, as was done in Copenhagen or in Japan, where rail companies were the first to use this method to finance their operations 39.
Aguas Claras - A case studyAguas Claras, located 20 kilometres outside Brasilia’s city centre, was largely unused until the beginning of the 1990s. It was purchased by the Federal District Authorities before building the Brasilia – Samambaia underground line, linking the pilot plan area to satellite cities that have developed around Brasilia. The land acquired was developed and sold off as individual plots to property developers,
39. See box p. 71.

69
Chapter 5 / Land value capture in areas served by public transport
in order to capture the significant land value gains generated by the investment. Today close to 75,000 residents live in this new city, and the figure is forecast to double by 2020. This project – the first of its kind in Brazil – was a complete success, as demand for property in the region is very high. Out of the US$770 million cost to build the underground infrastructure, 85% (or US$680 million) was generated by selling off plots of land. The cost of developing the land in preparation for selling the plots was valued at US$50 million.
Aguas Claras StationInitial state of development Current state of development
Source : Metrô DF.
Copenhagen - a case studyBorn from a necessity to find sources of funding to finance its underground line, Copenhagen’s project combined the development of transport infrastructure with the development of a new local neighbourhood, but it took a big risk on property, because when the project was launched at the beginning of the 1990s, the global economy was in recession. Erstel, situated 2km outside the centre, was jointly owned by the State (45%) and the city of Copenhagen (55%) and had little value because it was largely inaccessible. The underground transport company established a comprehensive development project. Plots of land were sold at a time when the market was booming, and the risk paid off. The total cost of the project amounted to €1.7 billion. 50% was paid for through land sales, and the rest was made up through property taxes and the sale of transport tickets to users 40.New residents to the neighbourhood tended to use the underground railway more than residents in other areas of the city served by the same system, which would suggest that the presence of transport infrastructure strongly influenced their decision to move to the area. The underground railway company thus generated funds for its infrastructure, and also secured stable and sustainable revenues from new residents and users.
40. Centre d’Analyse Stratégique. Strategic Newswatch n° 129 – March 2009.

Who pays what for urban transport? - Hanbook of good practices
70
Copenhagen’s authorities decided to continue extending the underground network by supporting another land selling project. This time, however, the risk wouldn’t be taken by the underground railway company. An independent company would take charge of the project, as the current state of the property market caused the authorities to act with care.
Reasons for successBoth of the above-mentioned examples respected a certain number of conditions.
The land was located in a low-value area because of a lack of mobility infrastructures. Building an underground railway didn’t just create accessibility, but high-quality accessibility.
Public Authorities were in a position to buy the land, or already owned the land. In certain countries, such as in France, public real estate entities can acquire land and retain ownership until completion of the project. This discourages speculation.
The property market was prospering. In Brasilia, as building is subject to strict regulations in the Pilot Plan, the urban transport system was extended to satellite cities. In Copenhagen, the risk taken on property was successful because the market picked up at the right time. Conversely, the Docklands Light Railway in London, running from the Docklands to Beckton, was supposed to be funded by selling land, but the contract was signed in 1989, and the property market remained sluggish for another 10 years 41. The land was sold and the private sector captured the land value gains, while the public authorities financed the line.
Building the underground line and developing and re-selling surrounding land is a jointly managed project. Even though this situation allows for immediate retrocession of the funds collected, it can nevertheless force underground railway companies to shoulder a financial risk by assigning them with the task of land developer, which is not their field of expertise. The land development project around the extension of Copenhagen’s underground railway will be run by an independent company to avoid these disadvantages.
Underground railway companies benefit financially both in terms of investment and operation. Because the area boasts high accessibility, the residents of the new area rely heavily on the service, thus contributing to its operating balance.
41. Nicola Cox, Transport for London. EMTA Conference. Urban mobility in European metropo-les – sustainable mobility and the financial challenge. 27 November 2008.

71
Chapter 5 / Land value capture in areas served by public transport
land consolidation in Japan using taxes and anticipated acquisitions
Traditionally, Japanese railway companies have used land holdings to finance their own development. Tokyo was largely constructed in this manner, with intermediary companies running new area urbanisation projects from conception to completion, and pre-financing public transport infrastructure before selling off the developed land to recoup their investment (and profits).But as land to develop became scarcer, land consolidation emerged as the most popular method of financing for public and private developers. The principle consists in entirely remodelling parcels of land in specific areas and developing facilities and public infrastructure on site, without the land changing owners.The land owners participate in financing the developments through a “property tax” of 30 to 50% of the surface of their land within the defined area. The parcels of land are grouped to create a land reserve, to be sold to individuals, private property developers or social services to cover the majority of the cost of construction of the new transport infrastructure, as well as the new roads and public land which have been granted public subsidies.
5/2 Development of business and residential activities
In densely populated areas, where it is impossible to manage land at reasonable cost, bus, underground and train stations offer a further means of generating cash flow through commercial activities.
Japan’s experienceDue to a scarcity of land, and the exorbitant price of land for sale, transport infrastructure developers have had to come up with original solutions for developing business activities within train stations and surrounding areas. Traditionally, railway companies have captured the value of land and commercial activities to guarantee part of their operating revenues, and it is imperative that they maintain, or even increase this income, as the aging population will directly result in decreased revenues from ticket sales. In 2006, land value capture made up for between 5% and 42% of operating income depending on the company, whereas it is only between 2% and 8% in the rest of the world 42. Rail transport has driven Japan’s urbanisation. Stations and their surrounding areas are obligatory transit points for consumers and thus harbour significant business potential. In Japanese stations, you can go shopping, handle administrative formalities, ... and catch a train or an underground metro.
42. Mission Economique de Tokyo, Overview of JR companies. Annual report. Quoted by the Centre d’Analyse Stratégique, Newswatch N° 129 (March 2009).

Who pays what for urban transport? - Hanbook of good practices
72
The “Tokyo-Station-City” project 43
The company JR East, which serves the East of Honshu island (including Tokyo), launched the “Vision 2020 i do mu” challenge. Its goal is to develop new business activities and services reflecting the most recent societal developments, and to increase operating revenues other than transport by 10%, thus reaching 40% of all operating revenues. The “Tokyo-Station-City” project aims to revitalise Tokyo City station’s neighbourhood, which is frequented by around 380,000 people daily. The revenues generated by these passengers come to an average of ¥260 million per day, or approximately €2 million. The development project has three major components:
the construction of twin towers at the Yaesu exit. This development plan is a joint effort with both land owners and leaseholders in the vicinity of the Yaesu exit. Individually owned premises will be combined to build two towers which will be used for offices, shops and administrative services;
the development of Sapia Tower, a high-rise building at the Nihonbashi exit which will house a research and education centre;
preservation and restoration of the Marunouchi station building. Upon restoration, the building will accommodate station facilities, a hotel and an art gallery.
The area development plan aims to make Tokyo the world’s most modern station, more than just a transit point, it will offer various new cultural attractions inspired by its users.
Istanbul’s experienceIn 2006, IBB, the Istanbul Metropolitan Municipality opted to use commercial developments to finance the construction of a repair centre for its underground train carriages. The project involved demolishing the old centre and building a 68,000 square metres, three-storey building to accommodate the repair centre for 338 carriages, a 3000-space car park, offices and a shopping centre.The project was easily organised because the land on which the old repair centre was located belonged to the public authorities. Ownership was transferred to TOKI, the housing and urban development administration of Turkey, responsible for selling the land to private developers and using the funds to finance the entire €320 million construction project. Today, land sales already total €230 million.The area development plan has increased the value of the land. Private property developers have built luxury residences and there are plans to build a stadium on land belonging to the Public Treasury.The authorities have apparently also opted for this method to finance the Kadiköy-Kartal underground line. 46,000 square metres of land belonging to the IETT, the public bus company, have been attributed following a call for tender
43. Based on an article published in Transports Urbains N° 114: “The project ‘Tokyo Station City’ and the programme ‘Station Renaissance’ by JR East: The examplary commercial develo-pment of train stations by the rail operator”. Naoya Koide (November 2008).

73
Chapter 5 / Land value capture in areas served by public transport
for €600 million to a property developer who will build two 300-metre towers for a commercial complex and offices. The funds raised will be attributed to the construction of the line, even though the project is not directly linked with its construction.
The Anglo-Saxon experience
Impact fees in the United States
As part of a residential, commercial or industrial area development project, the developer is responsible for carrying out studies to measure the impact the project will have on local authority spending in terms of infrastructure and public services, and the developer will pay a sum for financing the investments or improvements linked to the development project. A well-known example is the Transit Impact Development Fee (TIDF) implemented by the city of San Francisco in April 1981. The tax was imposed on new office buildings in the city centre in order to finance:
public transport investments; additional operating costs generated by the project. The Supreme Court of
California confirmed the lawfulness of the latter objective.Since 2004, the TIDF has been extended to the whole of the city for all types of non-residential development (excluding Mission Bay neighbourhood which is undergoing urban restoration and developments linked to public service or government structures). All development projects larger than 280 square metres are levied. The level of taxation applied per square metre depends on the business activity. Payment of the TIDF is a pre-requisite for obtaining a declaration of conformity for a new building.
Type of activityTIDF per square metre developed (in dollars)
Cultural/Institutional/Educational (excl. government)
107,70
Management/Media/Specialist services
107,70
Medical services 107,70
Industrial production/Logistics/Repairs 86,10
Retail/Leisure 107,70
Tourism 86,10

Who pays what for urban transport? - Hanbook of good practices
74
Increasing revenues through value capture
This concept is common in Australia (known as “Value Increment Financing” or VIF) and in the United States (known as “Tax Increment Financing” or TIF). Optimal use of the urban space near transport infrastructures is promoted to capitalise on the tax income generated from the land. The State lends landowners the equivalent of the estimated land value gain created by the new infrastructure, at a low interest rate and for over 10 years.New constructions generate new tax revenues which are attributed to transport, and the higher population density leads to more users of the public transport infrastructure. This model is socially acceptable because it isn’t viewed as an additional tax. This method is used in US cities such as St. Louis, San Francisco, San Diego and Denver, and is often called Transit-Oriented-Development (TOD). It has succeeded in increasing population density in the vicinity of large underground stations and railway stations by attracting residential, commercial and service-oriented investments, and has thus decreased car use without having to ban it.
5/3 Introduction of a betterment tax
A betterment tax is not the same as a property tax, because the increase in value of property is not due to the action of the owner (such as would be the case with renovations and improvements) but from a community action, thus justifying the public authorities to impose such a tax. However, it is not easy to implement, which no doubt explains why this financing mechanism is still underused. This tax must be levied on all areas that benefit from the new transport infrastructure. The land is valued each year based on an optimal use of each site, without taking into account the existing facilities. A tax based on the value of the land is then levied in order to generate funds for the public sector. Thus, if the value of the land increases, the tax collected also increases.This means that a vacant plot of land in the city centre which has been earmarked for building a residential and commercial complex will pay the same tax as an identical site which has already been developed in a similar manner. Unlike

75
Chapter 5 / Land value capture in areas served by public transport
construction taxes, no tax reduction is available to landowners who leave the site empty. Likewise, taxes are not increased if the site is built upon. Landowners will therefore to seek to capitalise on the use of their land.However, it is difficult to implement because it is difficult to realistically assess land value gains.
Valuation is based on the notoriously unpredictable property market. Value can increase even before the project is carried out, and may be over- or under-estimated depending on market ups and downs. Infrastructure projects can also cause land to lose value. Should compensation be paid?
A periodic valuation can be made based on the market value of the land, and tax based on this value. Although this method offers transparency, it is likely to force landowners to sell their land because improvements to their estate will not generate new income and the new tax may place them in financial difficulty. The risk that middle and working classes will be pushed out of areas that have increased in value due to new infrastructure can be overcome by setting tax levels based on income.
Another option would be to introduce a tax on the sale price, but this method fails to recognise that property may increase in value for reasons other than the new infrastructure. It also runs the risk of freezing the market as owners are increasingly reluctant to sell their property. Besides, it would be unfair to tax only the sellers.
Introducing a new tax is always an unpopular measure, especially for locals who do not use transport infrastructure. Difficulty in gaining social acceptance often deters politicians from voting for such measures which require a consensus.
Dublin’s metro experience
The metro in Dublin, opened in 2004, was partially financed by a Development Contribution Scheme. In Ireland, the law requires property developers to pay a standard financial contribution to help fund utilities in the area in which the project is being developed. They must also pay an additional contribution on top of the standard financial contribution based on the increase in land value in the vicinity of the new infrastructure.Two recent articles in the “Irish Planning and Development Act, 2000” allowed planning authorities to issue authorisations to develop nearby stations on condition that the private developers contribute financially to the work necessary to complete new transport infrastructure. The tax is directly proportional to the land value increment generated by the public transport project. In the Dublin metro example:
in residential areas, contributions totalled €250,000 per hectare; in commercial areas, contributions totalled €570,000 per hectare.

Who pays what for urban transport? - Hanbook of good practices
76
This scheme helped to finance part of the capital invested and created new areas for urbanisation, thus offering new opportunities to developers willing to pay the supplementary contribution. Moreover, urban development around stations has generated a new clientele and increased income from fares. This win-win situation for both the transit authority and property developers is likely to be repeated for linking the airport to the city centre.
5/4 PPP for a development project
Public-Private Partnerships are a joint cooperation between a public authority and private companies, created to carry out a specific project. They can take on a number of forms, and can be a useful method of capturing property value gains generated by transport infrastructure 44.In a PPP for a new transport infrastructure development project, the public authority creates a secure environment for the private sector to carry out the project, and the private partner offers its industry know-how, provides funding and shares in the project’s risk. The most common form of PPP is a “Joint Development” with the most successful example in Hong Kong.
A Joint Development between public authorities and private property developers enables:the public partner:
to directly capture money invested by the “developers” to partially finance the construction of transport lines;
to benefit from increased use of public transport brought about by urban development, thus increasing operating capital;
to promote controlled urban development with private land developers.the private partners:
to develop an array of activities, such as residential, commercial and leisure activities, on land which they own;
to command higher rent and enjoy a higher level of occupancy in their buil-dings thanks to improved accessibility from the transport services.
44. PPP is covered in more detail in chapter 6.

77
Chapter 5 / Land value capture in areas served by public transport
Figure 11 : The Principle of Joint Development
MTR in Hong Kong, an ongoing success story
The MTR (Mass Transit Railway) system in Hong Kong was planned in close collaboration with large-scale development programmes. The MTR network was financed by funds raised in advance from private developers and long-term rent of the land on which the stations were to be built. Developments on the land led to an increase in its value, and part of this “added value” was transferred to MTR to manage. MTR recovered its investment capital from the land value gains.New cities such as Tsuen Wan built at the beginning of the 1980s in the New Territories are also a direct result of a collaboration between MTR and private developers.The proper integration of a public transportation system within urban development made MTR the first rapid transit system to record an operating profit, and it is now listed on the Hong Kong Stock Exchange. All players involved benefited from integrating urban development with transport planning: public authorities, developers, passengers of the MTR, occupants of the buildings developed as part of the MTR station project as well as their clients.The success of the project was in part due to the scarcity of land available in Hong Kong and the high density of its population.
Private investors (developers, banks...)
Public Authority
Private capital
Public capital
Joint Development
Development, enhancement
Design, construction
Operation, maintenance
Capture of land value
gains
Surrounding land
Transport infrastructure
Increase in number of users and revenues
Beneficiaries
Renters Users

Who pays what for urban transport? - Hanbook of good practices
78
Summary
Implementing a direct tax on property value gains for built-up areas can be a sensitive issue: it is not socially accepted, it is difficult to calculate and it requires a legal framework. There are, nonetheless, numerous and promising examples of taxation on new urban developments. Taxing newly urbanised areas to finance the capital invested helps tackle the problem of urban sprawl. Likewise, an increase in population density along public transport lines generates more users and higher operating revenues.
Cities in developing countries are well-suited to implementing this kind of project because population density is low outside the heart of the city centre, and therefore land value is also low. However such procedures require keeping a complete land registry, establishing a property tax and having a land management system, as well as development projects which include apportioning land for social housing in order to avoid the impression that low income families are victims of the increase in value of the area. These are pre-requisites if a project of this nature is to be successful.
Methods differ by country because of institutional and regulatory practices, but regardless of the method, public authorities should have control over the entire project, from construction of the infrastructure to supervision of urban development, so that they can assure that the funds generated are transferred to the transport sector and do not disappear into the general budget.

79
Chapter 6
Public-PrivatePartnerships
(PPP)
The aim of PPP, which may take many different forms, is to involve the private sector in the initial investment and/or operation of a project by transferring a share of the risk to the private partners, while guaranteeing a sufficiently profitable set-up (by means of public sector subsidies if need be) to attract investors.PPP are not, strictly speaking, a source of funding but rather a mechanism to raise funds for a project, in the same way as a loan, but which commits the lender (the private sector) and makes him responsible for the proper implementation of the project. In the long run, the real financing comes from the users and/or the public sector via ticket sales and the remuneration of the private partner responsible for repaying the loans.
6/1 Why opt for PPP?
The objectives of the public and private sector partners appear to be quite different: put simply, the public sector aims to best serve the interests of taxpayers. The aim is not to use public money to obtain a return on capital investments. The private sector, on the other hand, aims to ensure a return on investment for its shareholders and to be as profitable as possible. And yet these two contrasting goals can function perfectly well together in the framework of a PPP.
Motives of the public partner
Reduce the recourse to public investment. By asking the private sector to make capital investments or undertake loans, the public authorities can avoid allocating large sums to urban transport infrastructures, thereby ensuring that funds will be available for other equally important uses in the public interest (health, education, culture...) in a context of limited public resources.

Who pays what for urban transport? - Hanbook of good practices
80
Share the risks. There are many risks inherent to building and operating transport infrastructures:
risks related to the project design which may engender low performance due to inappropriate technical choices, errors in assessing potential demand, etc.;
risks related to the technical and economic aspects of construction may result in higher costs than anticipated and delays in completion;
risks related to operating the infrastructure: competition with other modes of transport, labour and maintenance costs, traffic risks, etc.;
risks related to financing: variable interest rates, pricing, risk of inflation, etc.
Benefit from the presumed advantages of the private sector: economies of scale, by bringing in financial partners, well-established buil-
ders and operators, managers of multiple infrastructures; performance obligation, to reward shareholders whose experience may be
beneficial to the project, though the end purpose may be different; flexibility: regulations concerning public management may constitute an obs-
tacle for managing an industrial and commercial project such as the construc-tion and operation of transport infrastructures. A partnership with the private sector, under public control, can help improve results;
know-how in a complex industrial and commercial activity. Managing an urban transport project requires skills which are not necessarily found in the public sector. The extensive experience of the private sector in this area can help ensure better performance.
Motives of the private partnerHave access to the urban transport sector. Without PPP, the role of the private
sector is restricted to performing the construction work or else implementing projects at their own risk.
Obtain guarantees. A PPP contract must be mutually beneficial to all parties. While the private partner provides funding, the public partner provides financial guarantees or guaranteed minimum commercial revenue which are sufficient to ensure the project.

81
Chapter 6 / Public-Private Partnerships (PPP)
6/2 Determining factorsin choosing a PPP
The decision to undertake a public-private partnership and the choice of the most suitable form of partnership greatly depends on the context and the type of project to be developed.
The project context may influence the type of PPP to be implemented. The public partner must evaluate the total cost of the project, its importance in terms of public need, the time frame, the number of actors involved and the geographic area in question. Does providing this public service require a major infrastructure? Will it require high levels of human and financial resources to provide this service? Before a decision can be made, it is necessary to fully understand the context of the proposed project.
The cost of the project is of course a critical factor which will weigh on the choice. Many PPP concern projects for underground systems, LRT and BRT requiring significant levels of financing which the public authorities would have difficulty assuming alone.
A well-structured institutional framework and the public authority’s experience in developing transport projects are also decisive factors. Public transport is an industrial and commercial activity which involves financial risk. Bringing in experienced partners is one way of compensating for a lack of certain skills in this field, though a good PPP should call upon other forms of expertise on the part of the public authority. This can sometimes facilitate obtaining a loan, in particular from international funding agencies.
The tasks entrusted to the private sector (design, construction, development, operation, maintenance) will influence the type of contract.
The sharing of responsibilities and risks will determine the degree of involvement of each partner and the type and clauses of the contract. There are many types of contracts but it is primarily the sharing of financial risk which will determine the key characteristics. There are two categories of risk: commercial risk, related to trends in revenue, and industrial risk, related to the cost of construction and trends in operating and maintenance expenses.
if both types of risk are covered by the public partner, then it would be a management contract in which the private partner is merely performing the work. The private partner must meet the specifications but will not be motivated to improve the service nor propose innovative techniques or ma-nagement;
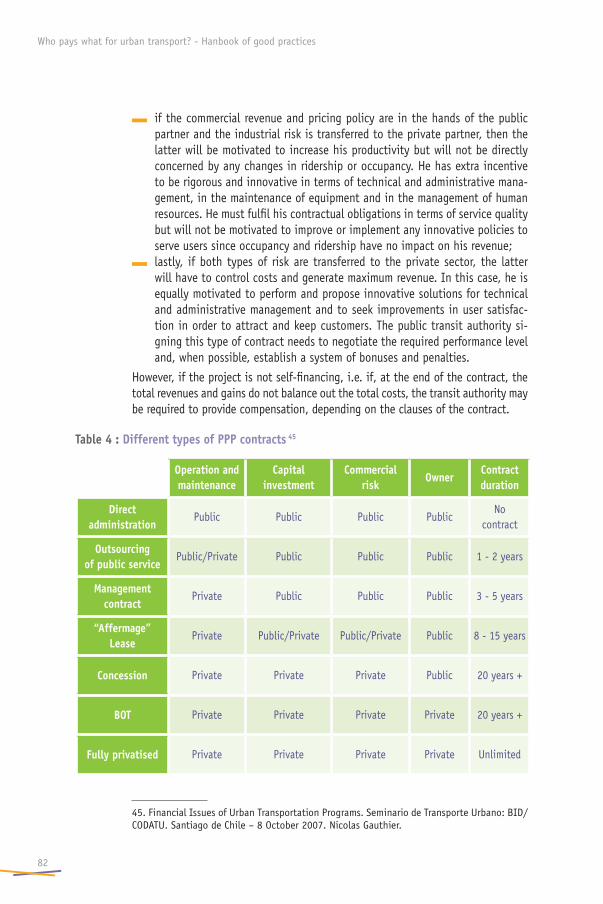
Who pays what for urban transport? - Hanbook of good practices
82
if the commercial revenue and pricing policy are in the hands of the public partner and the industrial risk is transferred to the private partner, then the latter will be motivated to increase his productivity but will not be directly concerned by any changes in ridership or occupancy. He has extra incentive to be rigorous and innovative in terms of technical and administrative mana-gement, in the maintenance of equipment and in the management of human resources. He must fulfil his contractual obligations in terms of service quality but will not be motivated to improve or implement any innovative policies to serve users since occupancy and ridership have no impact on his revenue;
lastly, if both types of risk are transferred to the private sector, the latter will have to control costs and generate maximum revenue. In this case, he is equally motivated to perform and propose innovative solutions for technical and administrative management and to seek improvements in user satisfac-tion in order to attract and keep customers. The public transit authority si-gning this type of contract needs to negotiate the required performance level and, when possible, establish a system of bonuses and penalties.
However, if the project is not self-financing, i.e. if, at the end of the contract, the total revenues and gains do not balance out the total costs, the transit authority may be required to provide compensation, depending on the clauses of the contract.
Table 4 : Different types of PPP contracts 45
Operation and maintenance
Capital investment
Commercial risk
OwnerContract duration
Direct administration
Public Public Public PublicNo
contract
Outsourcing of public service
Public/Private Public Public Public 1 - 2 years
Management contract
Private Public Public Public 3 - 5 years
“Affermage” Lease
Private Public/Private Public/Private Public 8 - 15 years
Concession Private Private Private Public 20 years +
BOT Private Private Private Private 20 years +
Fully privatised Private Private Private Private Unlimited
45. Financial Issues of Urban Transportation Programs. Seminario de Transporte Urbano: BID/CODATU. Santiago de Chile – 8 October 2007. Nicolas Gauthier.

83
Chapter 6 / Public-Private Partnerships (PPP)
PPP is not a miracle solution...Implementing a PPP requires certain conditions and prerequisites without which the project may run serious risks. In order to perform its duties, the private sector requires certain protections, while the public sector needs to maintain its control over the public service.
Legal protection is an absolute necessity for the proper functioning of a PPP for its entire duration. A PPP is governed by a contract which sets out in exhaustive detail the relations of the two partners. It sets the terms of the partnership, the rights and obligations of both parties. In the event of a dispute, the mediating and judicial bodies must be able to intervene in an effective manner. If the private partner is not entirely certain of being able to defend its rights in the event of a dispute, then it will be impossible to implement a PPP.
It is not the PPP which makes a project viable. It is absolutely necessary to take into account the ability of users to pay and it must be an integral part of a master plan for urban transport and development. The industrial and commercial risks engendered also depend (sometimes a great deal) on the way in which the other elements of the system are managed (automobile traffic, sharing of public space, parking, taxis, etc.).
If the project is not self-financing, which is quite often the case, at least in the first years of the project, the public partner must be able to ensure its financial viability. This is all the more true if the transit authority chooses a route which does not optimise income but which it deems most appropriate from an urban development perspective or if it chooses a low pricing scale to fulfil the social function of the public transport system.
The public partner must have the technical know-how to monitor the contract. The private partner generally has qualified staff for the financial, commercial and technical aspects, which is not necessarily the case for the public partner. If the public authority hopes to play its role and maintain control, it must also have high-level staff in the same areas, either on a permanent basis or as consultants.
Drafting the terms of the call for bids which will be used to choose the private partner is both a crucial and difficult process. If the procedure is very restrictive, it may exclude potential partners from offering their know-how and experience, but it has the advantage of giving the winning bidder the explicit technical and financial criteria. If the procedure allows for technical and commercial variants, the selection process may prove more difficult, requiring further negotiation with the chosen partner.

Who pays what for urban transport? - Hanbook of good practices
84
In both cases, negotiations between the two parties should make it possible to find a balance which ensures the workability of the partnership and clearly sets out the clauses of the contract. This is an important phase requiring close attention and sufficient time. Anything unresolved at this stage will prove costly in one way or another in terms of the outcome of the partnership. A review phase at the mid-way point of the contract is advisable because over time, the context and conditions may have changed.
... but it offers a number of advantagesWhen properly organised, a PPP can provide a long-term solution, alongside other mechanisms, to overcome the difficulties of financing urban transport projects.
Mobilise large private resources, both in terms of capital and the ability to borrow. Having a private partner may reassure certain investors or funding agencies who might otherwise hesitate to make such long-term loans.
Share the risks inherent to the project based on modalities defined in the contract, with more or less commitment on the part of the private partner.
Spread public expense over a longer period. If, at the end of the partnership contract period, the total public expense remains the same, because the private partner has, in a sense, advanced the amount to the public transit authority, then the expense will have been spread over a long period, thereby enabling the public authorities to avoid blocking large sums on a single project.
Less expense for administrative staff. Given that the operation of the transport infrastructure will be delegated to a private partner, it is not the transit authority but rather the private partner who is responsible for hiring and managing operational staff, which means a much lower administrative cost and, theoretically, less exposure to “labour risks” for the public partner.
Greater technical expertise of the private partner and better managerial motivation. It is important to be very demanding in terms of the technical expertise of the partner in order to fully benefit from his experience. Furthermore, if the contract is properly defined, it is in the interest of the private partner to provide the best possible technical and commercial management.
The use of PPP for purely financial reasons calls for great caution in that, currently, public authorities are presumably in a better position than the private sector to negotiate loans at attractive interest rates.
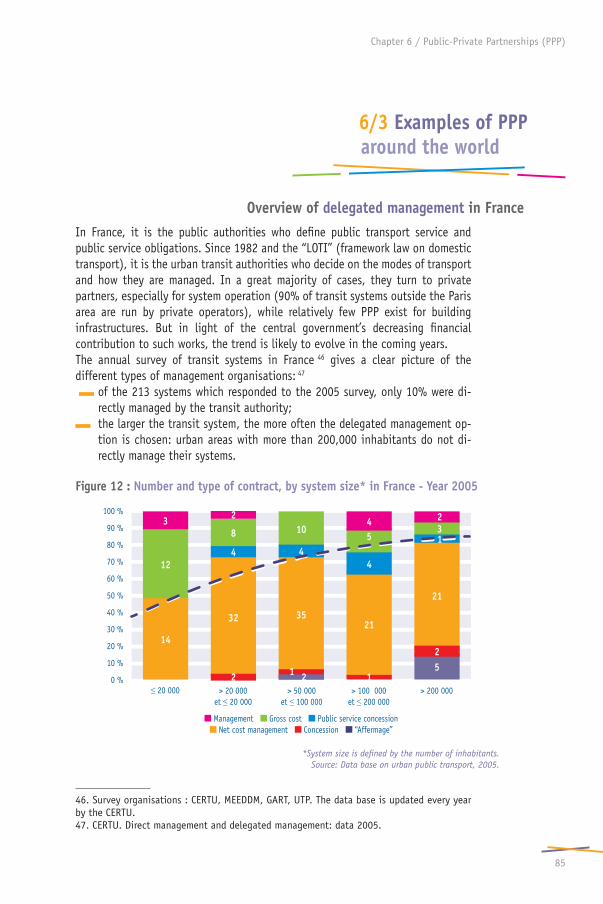
85
Chapter 6 / Public-Private Partnerships (PPP)
6/3 Examples of PPP around the world
Overview of delegated management in FranceIn France, it is the public authorities who define public transport service and public service obligations. Since 1982 and the “LOTI” (framework law on domestic transport), it is the urban transit authorities who decide on the modes of transport and how they are managed. In a great majority of cases, they turn to private partners, especially for system operation (90% of transit systems outside the Paris area are run by private operators), while relatively few PPP exist for building infrastructures. But in light of the central government’s decreasing financial contribution to such works, the trend is likely to evolve in the coming years. The annual survey of transit systems in France 46 gives a clear picture of the different types of management organisations: 47 of the 213 systems which responded to the 2005 survey, only 10% were di-
rectly managed by the transit authority; the larger the transit system, the more often the delegated management op-
tion is chosen: urban areas with more than 200,000 inhabitants do not di-rectly manage their systems.
Figure 12 : Number and type of contract, by system size* in France - Year 2005
*System size is defined by the number of inhabitants.Source: Data base on urban public transport, 2005.
46. Survey organisations : CERTU, MEEDDM, GART, UTP. The data base is updated every year by the CERTU.47. CERTU. Direct management and delegated management: data 2005.
100 %
90 %
80 %
70 %
60 %
50 %
40 %
30 %
20 %
10 %
0 %
Management Gross cost Public service concession Net cost management Concession “Affermage”
35
10
21
54
4
21
5
12
14
3
4 4 1 3 2
8
32
≤ 20 000 > 20 000 et ≤ 20 000
> 50 000 et ≤ 100 000
> 100 000 et ≤ 200 000
> 200 000
2
2 2
2
1 1

Who pays what for urban transport? - Hanbook of good practices
86
The majority of urban transit authorities have chosen PPP contracts in which the commercial and industrial risk are left to the private partner: net cost management contract (121), “affermage” (8), or concession (5). The trend between 1997 and 2005 was to move away from gross cost contracts in which the public authority assumes the commercial risk. As for management contracts in which all of the financial risks are covered by the public authority, their numbers dropped from 43 to 8 during this period. Urban transit authorities are thus increasingly turning to PPP and the degree of delegation is high among larger transit systems. The complexity of management and operation give the public authority all the more reason to bring in the know-how and technical expertise of professional operators.
Metro line 4 of São Paulo: an example for the future?
The public transport system of the São Paulo metropolitan region (20 million inhabitants) currently has four metro lines, operated by Metropolitano de São Paulo (Metrô), and many buses and suburban train lines. Construction of the new line (line 4, or the yellow line) 48 will fully inter-connect the metro-rail networks, thereby covering most of the São Paulo metropolitan region (SPMR). The transit authority of the metropolitan region, the Secretary of Metropolitan Transport of the State of São Paulo, chose a type of PPP which is new to Brazil and Latin America: the owner is Metrô and the operator is a consortium of private companies.
Structure of the PPP
In this set-up, the State of São Paulo entirely finances the infrastructure with its own funds and loans from the World Bank and the JBIC (Japanese Bank for International Cooperation). A concession company was established for to operate the system: “Concessionária da linha 4 do Metrô de São Paulo SA” in which Metrô has a capital holding of US$174 million, and a consortium of investors contributed US$183 million. The rolling stock and systems are acquired by Concessionária da linha 4. For a total cost of approximately US$1.2 billion, the transit authority will finance 80% of the project (infrastructure and part of the rolling stock) and the private partners 20%. The construction contract was signed in 2003 and the concession contract in 2006.
48. Line 5 was built before line 4.
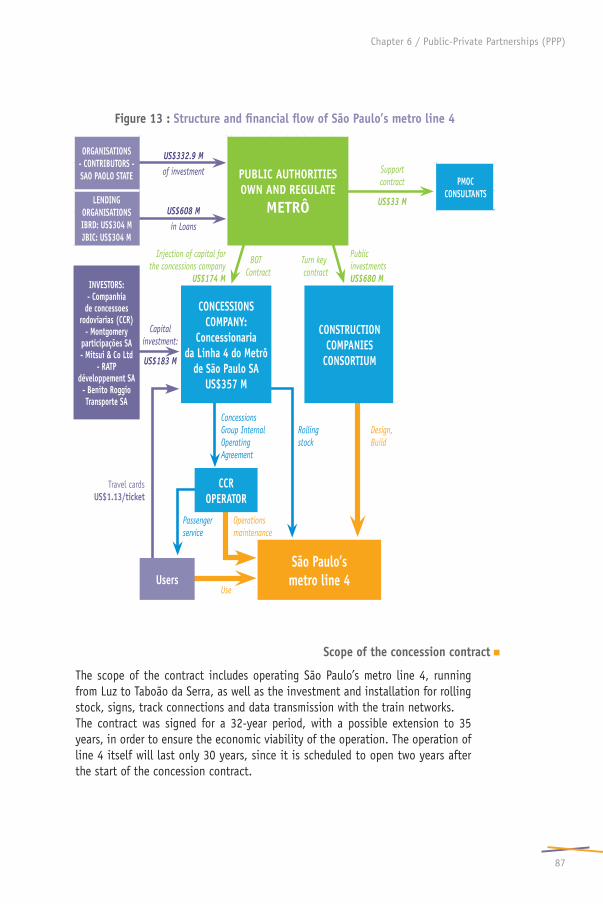
87
Chapter 6 / Public-Private Partnerships (PPP)
Figure 13 : Structure and financial flow of São Paulo’s metro line 4
Scope of the concession contract
The scope of the contract includes operating São Paulo’s metro line 4, running from Luz to Taboão da Serra, as well as the investment and installation for rolling stock, signs, track connections and data transmission with the train networks.The contract was signed for a 32-year period, with a possible extension to 35 years, in order to ensure the economic viability of the operation. The operation of line 4 itself will last only 30 years, since it is scheduled to open two years after the start of the concession contract.
ORGANISATIONS - CONTRIBUTORS - SAO PAOLO STATE
US$332.9 Mof investment PUBLIC AUTHORITIES
OWN AND REGULATE METRÔ
Support contract
US$33 M
PMOC CONSULTANTSLENDING
ORGANISATIONSIBRD: US$304 M JBIC: US$304 M
US$608 M in Loans
Injection of capital for the concessions company
US$174 M
BOT Contract
Turn key contract
Public investments US$680 MINVESTORS:
- Companhia de concessoes
rodoviarias (CCR)- Montgomery
participações SA- Mitsui & Co Ltd
- RATP développement SA
- Benito Roggio Transporte SA
Capital investment:
US$183 M
CONCESSIONS COMPANY:
Concessionaria da Linha 4 do Metrô
de Säo Paulo SA US$357 M
CONSTRUCTION COMPANIES
CONSORTIUM
Concessions Group Internal Operating Agreement
Rolling stock
Design, Build
Travel cards US$1.13/ticket
CCR OPERATOR
Passenger service
Operations maintenance
São Paulo’s metro line 4Users
Use

Who pays what for urban transport? - Hanbook of good practices
88
The contract consists of three phases: phase 1: operation of line 4 with six stations and a maintenance centre in Vila
Sônia. The operating company supplies 14 trains in this phase; phase 2: operation of line 4 with all planned stations and the creation of a
bus line in Vila Sônia and Taboão da Serra; phase 3: Vila Sônia / Taboão da Serra connection, to be specified at a later
time.
The operating company receives three types of revenues: compensation calculated in two stages (phase 1 and phase 2) to remunerate
the company before operations begin. Each phase lasts 24 months; revenue from ticket sales, with a possible adjustment depending on the num-
ber of passengers using line 4 alone or in conjunction with the bus line fee-ding to line 4;
other revenue from sources such as advertising and retail space, etc.
Sharing risks
Delays in construction are entirely covered by Metrô, as the contract with infrastructure builders is its responsibility.
Estimating demand: the risk of lower-than-expected revenue (or the opposite, if the forecasts were pessimistic) is shared starting six months after the opening of the line in phase 1, up to six months after the start of operations in phase 2. The amount of compensation may be positive (the operator receives compensation) or negative (the operator pays money back to the transit authority). Beyond this time frame, the operator alone covers the commercial risk of line 4.
Exchange risk. This is a significant risk since a large share of the loans are in foreign currencies. Calculating revenue from ticket sales takes this risk into account and is therefore covered by the transit authority.
The advantage of the PPP for line 4 is that each partner plays a role in its area of expertise. The transit authority is responsible for covering the construction works because this is the most difficult part to finance, requiring both public funds and loans from international funding agencies, obtained thanks to public guarantees. The operating company finances everything related to operations, including the rolling stock and the systems for which it can obtain credit terms for the purchase and is then fully responsible for its proper functioning. The participation of Metrô in the operating company is a guarantee of competency and coherence for the entire transit system.

89
Chapter 6 / Public-Private Partnerships (PPP)
Summary
The growing use of PPP around the world in the area of urban transport proves that this mechanism meets the needs of both partners: the transit authority and the private sector. The wide range of types of contracts also shows that the mechanism is flexible and can be adapted to local regulations and institutional cultures, as well as the financial capabilities of the partners. But regardless of the type of contract, some basic rules must be established to govern the PPP:
a solid public contract allowing appropriate agreements with the private sector; a contract which is balanced for both partners with a clear distribution of
roles and risks; a financially balanced project with, if necessary, financial compensation to be
paid by the public partner; clauses providing for the revising of contract terms in the event of a major
change in the context; legal guarantees; a well-designed project and proper integration in the urban transit system as
a whole; an accurate assessment of users’ ability to pay; technical and financial monitoring by the transit authority which must avail
itself of the necessary technical expertise.

Hanbook of good practices in funding urban transport

91
Chapter 7
Additionalmechanisms
This section looks at mechanisms which, though they are not direct sources of funding, may be used to obtain access to funding. The two mechanisms discussed below are the Clean Development Mechanism and decentralised cooperation.
7/1 CDM: Clean Development Mechanism
The Clean Development Mechanism, defined in the UN Kyoto Protocol (article 12), is based on projects to reduce greenhouse gas emissions (GHG). The purpose is to assist developing countries (known as Annex II countries) in achieving sustainable development by implementing GHG mitigation projects in partnership with developed countries (known as Annex I countries) who have signed reduction commitments in the framework of the Kyoto Protocol.The CDM is above all a mechanism aiming to reduce greenhouse gas emissions, but it can also constitute a source of financing via the Certified Emissions Reductions (CER) made possible by the protocol.
Principles of the mechanism as defined by the Kyoto Protocol
A GHG mitigation project must be conducted in partnership between a developed and developing country. The host country must be signatory to the Kyoto Protocol and must establish a Designated National Authority (DNA), in charge of approving projects and verifying their compliance with the country’s objectives for sustainable development.
It must result in measurable and long-term reductions in emissions which would not have been achieved without the project.
It can only be implemented with funding obtained through the sale of emissions reductions generated by the project.

Who pays what for urban transport? - Hanbook of good practices
92
In the framework of the Joint Implementation mechanism, it enables the issuance of Emission Reduction Units (ERU), calculated in CO2 equivalents 49. These ERU can be sold to:
companies in Annex I countries which have not met their quota of GHG reduc-tions in their own projects;
states which are obliged to comply with GHG reduction targets as set out in the Kyoto Protocol.
CDM projects must be approved by the international bodies established for this purpose:
the Executive Board (EB) of the CDM which analyses requests, is responsible for approving and auditing the projects;
Designated Operational Entities (DOE) which are national or international en-tities responsible for validating proposed CDM projects, verifying and certi-fying the reduction in greenhouse gases. 50 In the transport sector, there are seven DOE accredited for validating CDM projects and three for certification and verification.
Figure 14 : Diagram of a CDM project cycle
49. 1 ERU = 1 ton carbon equivalent (tCO2eq).50. The list of DEO accredited by the Executive Board is available on the website of the United Nations Framework Convention on Climate Change (UNFCCC). http://cdm.unfccc.int/DOE/list/index.html
7The EB
generates ERUs
6A DOE
validates and certifies
5A surveillance
plan is implemented
4The EB
registers the project
3A DOE
validates the project
2The host country’s
Designated National Authority (DNA)
confirms approval to the Executive Board (EB)
1The project
design document (PDD) is put
together

93
Chapter 7 / Additional mechanims
Key documents for a successful CDM projectThe Project Design Document (PDD). This is the main technical document for
validation then registration of the project by the CDM authorities. It is an essential part of the project life cycle. 51
The project methodology. The methodology is the document which serves as a basis for the project proponent to calculate the ERU generated by the project. It must be described in the PDD and it must be validated then registered by the Executive Board. Without a methodology registered by the EB, a project cannot be accepted in the framework of the Clean Development Mechanism.
If there is no existing baseline methodology, the project proponent can have one approved which defines:
a baseline scenario which represents the GHG which would be emitted in nor-mal circumstances without implementation of the project. This is a theoretical proposition: the project proponent must use realistic hypotheses to develop the most likely baseline scenario, based on scientific, statistical or expert sources;
a monitoring plan is a guideline document which describes in detail all of the procedures used to monitor the project and gather data once it is operational.
Who participates in CDM projects?1,620 projects are currently registered, with an expected 1.59 billion ERU by 2012. 52 So far, 285,979,364 units have been issued.Some 50 countries are currently participating in CDM projects. The main recipient countries are in:
Asia Pacific (India and China); Latin America (Brazil, Mexico, Chile).
The majority of countries financing CDM projects are located in Europe, with the United Kingdom as the leading financer in Europe and the world.15 sectors of activity are eligible for CDM. 55% of projects registered concern energy efficiency in industry and 20% concern solid waste management, primarily consisting of projects for methane recovery.
51. “Guidelines for completing the project design document” 2 August 2008, by the Exe-cutive Board – EB 41 Annex 12 (http://cdm.unfccc.int/Reference/Guidclarif/pdd/PDD_guid04_v07.pdf).52. As at 15 May 2009. Details and follow-up of the projects can be found at http://cdm.unfccc.int/Statistics/index.html

Who pays what for urban transport? - Hanbook of good practices
94
CDM and Urban TransportThe urban transport sector has long been neglected by the Clean Development Mechanism, as can be seen in the fact that there are only two projects registered and in progress. And yet, mass transit projects are by their very nature sustainable development projects. It appears that there are certain difficulties which deter potential candidates.
Table 5 : Approved CRM projects in the field of transport
Project Host country
Partner country Methodology
Forecast annual reduction
(in t CO2eq)
BRT Bogotá, Colombia : TransMilenio
Phase II to IV
Colombia
Switzerland
The Netherlands
AM0031 246 563
Installation of Low Green House Gases
(GHG) emitting rolling stock cars in metro
system
India Japan AMS-III.C. v 10 41 160
Urban transport projects involve many players, require complex institutional arrangements, necessitate large investments and are designed for the long term, contrary to industrial projects which produce more short-term effects.
Few methodologies have been approved for measuring GHG reductions in the urban transport sector and developing a new baseline methodology would require a great deal of work. Currently, only four methodologies are available to project proponents:
a methodology for large-scale projects: AM0031 “Baseline Methodology for Bus Rapid Transit Projects” (Version 1, validated on 28 July 2006);
three simplified methodologies for small-scale projects: - AMS-III.C. “Emission reductions by low-greenhouse gas emitting vehicles”; - AMS-III.S. “Introduction of low-emission vehicles to commercial vehicle fleets; - AMS-III.T. “Plant oil production and use for transport applications”;
a simplified methodology, AMS-III.U presented in a project in the process of validation but not yet approved.

95
Chapter 7 / Additional mechanims
The existing rules for the functioning of the project and the duration may make it difficult to integrate CDM in sectors with less clearly defined boundaries, such as transport, even though they are greatly responsible for GHG emis-sions.
The lag between the cost of the project – often quite high for transport infras-tructure projects – and the revenue finally earned from selling ERU, does not encourage developers to invest in CDM projects in the area of transport. This obstacle is all the greater due to the uncertainty for the developer of reaping any benefits: uncertainty about the number of ERU actually generated by the project, in relation to the number specified in the PDD; uncertainty about the value of the carbon unit on the fluctuating carbon trading market, with no real predictability. In the end, a project proponent has no guarantee of the real revenue to be gained from selling his credits.
It is difficult for a project proponent to prove the additionality of the project, i.e. he must prove that the emissions reductions achieved thanks to the pro-ject, would not have been possible without the creation of this mechanism.
European countries, the lead partners for CDM projects, are not very active in the area of urban transport (except for the Netherlands) but there are signs of new interest, as 11 projects are in the process of being validated by the Executive Board, four of which concern BRT projects, using the methodology implemented by the Transmilenio project in Bogota.53 It is possible that if these methodologies were developed for other types of projects such as LRT, the additional financing provided by the CDM could help get these projects off the ground.
Table 6 : CDM projects in the field of transport pending validation
Project Host country Methodology
Forecast annual reduction
(in t CO2eq)
MIO Cali, Colombia Colombia AM0031 256 281
MEGABUS, Pereira, Colombia Colombia AM0031 33 393
BRT system in Seoul Républic of Korea AM0031 119 628
Envirofit Tricycle-taxi Retrofit Program Philippines AMS-III.C.
v. 11 7 708
Shift to low greenhouse gas emitting vehicles
for materials transport to and from Doom Dooma plant of HLL
India AMS-III.C. v. 5 6 535
53. All of the projects are listed and their PDD are available on the website of the UNFCCC: http://cdm.unfccc.int/Projects/Validation/index.html

Who pays what for urban transport? - Hanbook of good practices
96
Project Host country Methodology
Forecast annual reduction
(in t CO2eq)
Fuel Switch from Petro-diesel to Biofuel for the Transport
Sector in Bangalore Metropolitan Transport Corporation (BMTC),
Karnataka, India.
India AMS-III.C. v. 10 2 784
Plant-Oil Production for Usage in Vehicles, Paraguay Paraguay AMS-III.T. 17 188
Cable Cars Metro Medellín, Colombia Colombia AMS-III.U 16 954
BRT Chongqing Lines 1-4, China China AM0031 252 306
Lohia Auto Industries Electric Vehicles, India India AMS-III.C.
v. 11 25 678
Focus on the Transmilenio project TransMilenio is the largest public investment project carried out in Bogota in recent years. It is one of the most modern and efficient urban bus transport systems in the world. By 2012, 130 km of BRT lines with new stations equipped with raised platforms, will be operational, 1,200 new articulated buses with a capacity of 160 passengers and 500 new buses with a capacity of 70-90 passengers will complete the network. The number of passengers is estimated at approximately 1.8 million a day.Bogota’s Transmilenio project consists of four phases: phase I is already completed and operational and is not part of the CDM project. Phases II, III and IV – the extension of phase I – are covered by the Clean Development Mechanism. This is the first large scale urban transport project to be approved and registered by the CDM, introducing the validation of the first baseline methodology for urban transport.

97
Chapter 7 / Additional mechanims
The expected positive outcomes Environmental:
greater energy efficiency of new vehicles; modal shift away from private cars towards mass transit, thanks to a very
attractive service (security, comfort, reliability); centralised command of vehicles allows a better organisation of traffic and
therefore better occupancy; in terms of local pollution, the reduction in particle pollution (PM), nitrogen
oxide (NOx) and sulphur dioxide (SO2) was quantified for the crediting period 2006-2012 at – 7,000 tons of PM, – 50,000 tons of NOx and – 800 tons of SO2.
Sustainable development: improved environment through reduced GHG emissions; improved “well-being” thanks to reduced local pollution (chemical and noise),
reduced travel time for passengers and fewer accidents; better social integration thanks to improved access for unqualified or low-
qualified labourers to construction sites; greater economic attraction of Bogota (offering a modern mass transit sys-
tem) and reduced cost of congestion.
Estimating the reduction in emissions thanks to the project: to estimate total reductions, the PDD presents the emissions generated by the project activity, leakage emissions due to the project and emissions in the baseline scenario:
the emissions generated by the project are those from bus traffic. This is covered in phases II, III and IV of the project;
leakage by the project refers to the variation in emissions outside the project boundary that occurs as a consequence of the project activity’s implemen-tation: increased emissions due to the manufacture of new buses, emissions from fuel, cement and asphalt for building the dedicated infrastructures; the change in occupancy of taxis and non-BRT buses; the impact of reduced congestion;
the emissions of the baseline scenario. This is based on the calculation of emissions per passenger/km and per category of vehicle (bus, taxi, private cars, two-wheel motorised vehicles) in the reference situation, i.e. for the same period but without the project.
Estimated total reduction of GHG in the first crediting period (tCO2eq)
1,725,940
Number of crediting years (first crediting period) 7
Average annual reduction of GHG forecast for the crediting period (tCO2eq)
246,563

Who pays what for urban transport? - Hanbook of good practices
98
Financial benefits from the sale of carbon credits
This is a key aspect of the financial impact of the project. The revenue gained depends on the quantity of ERU obtained and the market price for a ton of CO2eq. When negotiating the sale of the ERU obtained through the project, in 2001, the recommended unit prices were as follows:
high scenario: US$19 / ton CO2eq; middle scenario: US$10 / ton CO2eq; low scenario: US$3 / ton CO2eq.
Type of scenario US$3 / tCO2eq US$10 / tCO2eq US$19 / tCO2eq
Evaluation of total emissions reductions for the first crediting
period (tCO2eq)1,726,000 1,726,000 1,726,000
Potential revenue from the sale of ERU 5,200,000 17,300,000 32,800,000
Revenue from the sale of ERU for the first crediting period is not very attractive, but the developer chose to take a longer view, with an expected expansion of the system and therefore extended crediting periods (two periods of seven years each, with emissions reductions in the last two periods estimated at 500,000 tCO2eq per year). The overall revenue would thus reach:
approximately US$80 million (at a rate of 1 tCO2eq = US$10) for three crediting periods of seven years each;
approximately US$170 million (at a rate of 1 tCO2eq = US$19) for three credi-ting periods of seven years each.
If the high scenario proves true, with strong prices on the credit trading market, the funds generated by the project would be truly significant and could even contribute to funding the operating costs of the Transmilenio. The first results of the monitoring plan show that the emissions reductions are below forecast but the project proponents believe that when all of the phases have been implemented, the results will be in line with expectations.

99
Chapter 7 / Additional mechanims
7/2 Decentralised cooperation
The growing autonomy of local territories has led them to build ties with other territories in other countries, and to organise direct cooperation relations. This is known as decentralised cooperation.In France, this notion was given a legal framework by the law of 1992, concerning only the international actions of French local authorities with foreign local authorities, regardless of their status in the foreign State. Their actions may only involve the French local authorities’ areas of responsibility. France is the only country which has such a legal framework for decentralised cooperation. At the European Union level, there is no legal basis established by treaty, and it is a notion of management which includes projects implemented by all types of associations and non governmental organisations.European countries have taken the lead in this kind of action, having a long history themselves of twinning with other cities. All 26 regions of France, more than three-fourths of counties, nearly all large cities and urban communities, numerous mid-size and even small towns, as well as a growing number of joint municipal structures are involved in international cooperation projects, with 8,000 underway in 132 countries.The international exchanges concern technical, institutional and political know-how. Mayors are often confronted with similar issues and are generally eager to learn from the experiences of their counterparts.
Decentralised cooperation and urban transportAmong the many different projects in the area of transport, the subject of urban mobility should occupy a prime position because it is a crucial issue, often the responsibility of local governments. And yet we see that this is not the case. There are several reasons which may explain this relative lack of attention:
Urban transport projects do not seem as “vital” as projects for drinking water, housing or education, in the eyes of citizens and local elected officials who represent the public interest. Officials therefore tend to focus their attention and energies on projects for “solidarity” causes.
Cooperation projects in general, and especially those in the context of decentralised cooperation, depend greatly on strong personal relations among elected officials in particular, though their tenure in office may be too short to effectively lead a complex project.
Local structures for governance and financing are often very different and projects may require lengthy periods of preparation, which may cause hesitation among local authorities.
Who pays what for urban transport? - Hanbook of good practices
100
Urban transport projects involve many different partners, both in the public and private sector, and it can prove difficult to bring them together for a joint action in a foreign country.
Urban transport projects require heavy financing, beyond the capacity of local authorities or which they do not know how to obtain from international funding agencies.
Decentralised cooperation and the funding of urban transportLocal authorities directly fund 90% of their decentralised cooperation projects and turn to other funding sources such as the European Union and the Ministry of Foreign Affairs in the case of France, which has a dedicated line of credit for such projects.Decentralised cooperation is not meant to replace other projects, such as those implemented by international funding agencies, but it can play a supplemental and essential role in that local authorities often have expertise in organising complex projects. They may effectively participate in a wide range of actions with variable levels of financial contribution.
Solidarity type actions such as donating and sending equipment for an urban transport line: one example is a cooperation project in Lomé, Togo, organised by the Greater Lyon urban community in conjunction with Sytral and CODATU. 54
Expert assistance in choosing a project or defining urban transport policy: Chongqing and Toulouse are working together on transport policies in the Chinese city. In Rabat, Morocco, the Urban Planning Agency of Greater Lyon and the CERTU 55 participated in the development of the Urban Mobility Plan of the Rabat-Salé-Témara urban area.
Know-how and technology transfer: the aim of these projects is to set up long-term cooperation as part of a partnership, with tangible, measurable results, such as in Vietnam with the opening of the Institute of metropolitan professions in Hanoi, in cooperation with the Ile de France Region, and the PADDI-Centre for urban development studies in Ho Chi Minh City, in cooperation with the Rhône-Alpes Region. 56
54. Read the Lomé-Greater Lyon project description in the “Guide méthodologique de la coo-pération décentralisée en matière de développement urbain” (Methodology of decentralised cooperation in urban development). CODATU. Françoise METEYER-ZELDINE. CNFPT publication (July 2006) p. 24-26.55. Centre d’études sur les Réseaux, les Transports, l’Urbanisme et les constructions publiques. (Centre for the Study of Urban Planning, Transport and Public Facilities). http://certu.fr56. Read the Hanoï-Ile de France project description in “Guide méthodologique de la coo-pération décentralisée en matière de développement urbain” (Methodology of decentralised cooperation in urban development). CODATU. Françoise METEYER-ZELDINE. CNFPT publication (July 2006) p. 19-21.

101
Chapter 7 / Additional mechanims
Cooperation between Chongqing and Toulouse
Exchanges between the cities of Toulouse and Chongqing began in the area of culture in the 1980s, then became more technical as of 2000. In particular, a technical cooperation agreement was signed in 2003 between the Chongqing Institute for urban transport planning and the Traffic and Transport department of the city of Toulouse, the urban planning agency and the CETE 57 of Southwest France.Several missions took place in 2003, 2005 and 2008 to analyse the transport plan of Chongqing, based on the evaluation criteria of the CERTU for urban mobility plans. After this evaluation phase, Chongqing requested expert assistance for the study of a guided transport system in dedicated lanes (BRT) as well as an assessment of mobility problems in the hyper-centre of Chongqing. In the framework of a new protocol signed in September 2008, experts in France and China will participate in missions in both countries every six months in order to share best practices.
Cooperation between Ho Chi Minh City and Rhône-Alpes
The Rhône-Alpes Region and the Province of Ho Chi Minh City have been involved in a programme of decentralised cooperation since 1997, particularly in the areas of training, health and urban management. In 2005 the project of the PADDI (Centre for urban development studies) was launched. This centre serves the People’s Committee of Ho Chi Minh City by providing assistance to the technical departments of the city for specific projects and by training municipal agents. The PADDI organises training workshops in various fields of urban management and contributes its expertise for the implementation of major infrastructure projects. A special Rhône-Alpes event in Ho Chi Minh City in March 2007 marked the start of an important cooperation project in the area of public transport. By organising workshops on case studies in Vietnam, the PADDI helps its trainees to build their own methodology for understanding issues and finding solutions. About ten subjects are covered every year in collaboration with the Vietnamese partners, bringing together 15 to 20 Vietnamese professionals for workshops with a French expert and a Vietnamese administrator. Since 2005, 22 workshops have been held on subjects such as:
improving the management of bus lines; standards and management of underground infrastructures; public-private partnerships; transforming a land use map into reality.
57. Centre d’Etude Technique de l’Equipement (centre for technical infrastructure studies): an organisation under the authority of the Ministry of Ecology, Energy, Sustainable Development and the Sea (MEEDDM).

Who pays what for urban transport? - Hanbook of good practices
102
Though these contributions are minimal from a purely financial perspective, they often make it possible to obtain more sizeable funding from banks or international agencies.Drafting the specifications or the preliminary studies of a project in order to apply for a loan can prove to be a huge hurdle for local authorities who lack the technical expertise. Having access to the know-how of another city can help overcome these problems and improve their ability to take on new projects.
The canton of geneva working with the city of Quito
Initiated in the framework of the IMPACTS network 58, an association of mayors of large European, North and South American cities, this project provided significant support for the design of the urban mobility plan of Quito, a city listed by UNESCO as a World Heritage site for its major historic value.The cooperation programme consisted in expert missions of technicians from the canton of Geneva and professors of the Université Polytechnique de Lausanne, and training in Switzerland for technicians of EMSAT (Empresa municipal de servicios y transporte). The aim was to evaluate the existing transport system, establish an observatory on mobility, develop a planning and traffic regulation process, and to train the technicians of EMSAT.The key advantage of this cooperation agreement for the city of Quito was to boost the expertise of the city’s technical departments in their relations with various foreign consultants. It also helped reorganise the city’s departments, prepare the specifications of international bids for contracts in areas such as car park management and the concession for the tramway line, and to obtain loans from international funding agencies, especially the Inter-American Development Bank.
Decentralised cooperation and the Agence Française de Développement
When AFD (French Development Agency) finances a project, it may add, on top of the loan, a subsidy to support institutional capacity building. Convinced of the important contribution of decentralised cooperation, AFD makes every effort to involve French local authorities in expert missions to assist project owners receiving AFD funding. 59
58. www.impacts.org59. From the brochure “AFD et la coopération décentralisée” (AFD and decentralised cooperation). http://www.afd.fr/jahia/webdav/site/afd/users/administrateur/public/plaquettes/AFD_ cooperation_decentralisee.pdf
103
Chapter 7 / Additional mechanims
AFD may play a role downstream in the case of an existing decentralised cooperation agreement, for example in Hanoi where AFD supported a programme that the Ile de France Region had been running for several years. A loan of €80 million was granted in 2007 for the construction of the infrastructure for Hanoi’s first metro line, with a subsidy of €0.5 million for institutional capacity building. Ile de France provides assistance to Hanoi for restructuring the bus network and establishing a transit authority.
Or AFD may play a role upstream to encourage decentralised cooperation for a project which it is planning to fund. This is the case in Brasília where AFD will finance the first light metro line (a loan of €134 million granted in 2009). The urban community of Montpellier will thus support the Federal District in the process of integrating the new line in a comprehensive and sustainable policy for urban transport (a subsidy of €0.35 million for the studies and sharing of expertise between the two local authorities).
AFD’s policy aims to take into account the specific context of each partner city, without any pre-conceived technical or institutional ideas, and to encourage integrated policies for transport.
The Oudin-Santini law extended to urban transport?
Since 27 January 2005, this law allows French towns, urban communities and public-private corporations in charge of drinking water and sanitation, water utilities, etc. to allocate up to 1% of their budget to decentralised cooperation and international solidarity actions in the field of water and sanitation. In 2007 the field of energy was added. €5.2 million were thus mobilised in 2007, plus 1 million for energy projects.So why not in the field of urban transport?

Hanbook of good practices in funding urban transport

105
Conclusions
ConclusionsKeys to choosing the most appropriate
funding framework
Six cities were closely reviewed in the context of this study. Each of them has its own system of funding which is a function of its political and institutional history, as well as the interaction of the various players. Nonetheless, we can see that the underlying framework is the same, though the mix differs from one city to another, with varying levels of funding from three sources: public funds, contributions from users and contributions from indirect beneficiaries. In sum, the system functions in a framework which requires more or less pu-blic resources depending on the contributions of the other sources.
Cities therefore need to understand to what extent the different sources of funding can contribute. There are those which can be quickly mobilised be-cause they are governed by regulations alone, and those which require a legal or political mechanism which may take longer to implement: passing laws, establishing a public transit authority, ensuring social acceptability, etc.
Finding a balance between the different players depends on the institutional, cultural and social history of each country and city but the balance is never stable and may evolve due to changes decided at a different level: for exam-ple, a government decision to allocate to cities the revenues from parking fines, or a new law allowing the creation of congestion charging schemes. In the latter example, not all cities will choose to implement the scheme but it is still an opportunity for revenues which is now available to them.
The funding framework is not the same for infrastructure investment and ope-rating budgets, even though the players are the same. The arrangements for contributions differ. The best model, in which all contributions are allocated to the urban transport system, can be summarised in the two diagrams below.

Who pays what for urban transport? - Hanbook of good practices
106
Figure 15 : Who pays what for investments?
1. Road users, private cars, trucks and public transport by bus (with certain exemptions) pay taxes on petroleum products which are allocated to national or local budgets. All or part of these taxes are allocated to urban transport.
2. The same users may also have to pay for congestion charging, infrastructure and parking tolls which are allocated to the transit authority.
3. Net revenues of the system are invested in the purchase of equipment.4. Employers pay a tax on payroll, which is allocated to the transit authority.5. Taxpayers pay direct and indirect taxes to the national, regional and local bud-
get. The public authorities may borrow money from national and international institutions.
6. In the framework of PPP, the private partner contributes funds either to the public authorities (in the case of a public-private company) or to the transit authority, or to the transport system in general, in the case of a fully delegated service.
7. Through various modalities, residents and retailers pay a portion of the pro-perty value gains generated by the construction of a transport infrastructure in their vicinity.
8. The public authorities, at the State and local levels, contribute to public trans-port funding from their budget, based on contributions from direct and indirect beneficiaries, taxpayers and financial backers.
Tax payers
International funding agencies
Private sector /
PPP
Central
Regional
Local governments
ResidentsBusinesses
Employers
PUBLIC AUTHORITIES INDIRECT BENEFICIARIES
TRANSPORT SYSTEM
(transit authority)
Collective transport
Roads
USERS: DIRECT BENEFICIARIES
Petro
leum
prod
ucts
tax
Vehi
cle u
sage
tax
on payroll
Taxes
Park
ing f
ares
Operating profits
Land value capture
1
2
3
4
6
7
5
8

107
Conclusions
Figure 16 : Who pays what for operations?
1. Users of individual means of transport contribute to operations by paying tolls (congestion charging, parking, infrastructures) if this revenue is allocated to the transit authority. Users of public transportation contribute by way of transit ticket purchases.
2. The publics authorities contribute to balancing the operating budget of transport companies, when in deficit, by way of subsidies.
3. Employers contribute to the purchase of transit tickets by way of direct aid to their employees.
4. Indirect beneficiaries, companies and retailers pay rent or taxes to the transit authority for the construction or rental of office or shop space, recreation centres, etc.
5. Residents near infrastructures pay taxes on property value gains, which may be allocated to the transport sector
Each city must decide on the mix of funding most appropriate to its specific context and institutional capacities while seeking to optimise ticket revenues and reduce costs.
Central
Regional
Local governments
ResidentsBusinesses
Employers
PUBLIC AUTHORITIES INDIRECT BENEFICIARIES
TRANSPORT SYSTEM
(transit authority)
Collective transport
Roads
USERS: DIRECT BENEFICIARIES
Subsidies / Fares - Operation
Improvement of public spaces,
commercial areas, etc.
Land value capture
Tolls
Fare
s User
reim
burse
ment
11
2
3
4
5

Who pays what for urban transport? - Hanbook of good practices
108
Cost reductions
When public funding possibilities are limited, the aim is to at least break even in terms of operations: direct operating expenses are covered by operating revenues. Measures to achieve this involve not only system management but must also take into account all levels and phases of the system:
proper design of the project which integrates all networks of the system with high-volume corridors and feeder lines;
transport modes adapted to forecasts for demand and future development; separation of public transport from traffic congestion by means of dedicated
or reserved lanes, as well as right-of-way at traffic lights, etc.; training drivers to use green driving practices; modern operating systems: automated payment, integrated ticketing, real-
time information.
Optimised revenues
Because ticket sales represent the primary source of revenue, it is important to make the system as attractive as possible:
by applying variable fares in off-peak hours and days to achieve a better dis-tribution of occupancy and to attract new users of public transport;
by fighting fare evasion: installation of control lines, awareness campaigns, etc.;
by attracting new customers and building loyalty: functional and fare integra-tion for public transport, regulated individual transport to encourage a modal shift, real-time information for users by means of the latest technologies, etc.
Additional revenues
Other sources of revenue can contribute significantly to the funding mix and, in total, allow for investments and help balance the operating budget:
land value capture: €850 million in Copenhagen, €500 million in Brasilia; congestion charging and parking tolls: €55.2 million in 2007 from tolls on
seven bridges in the San Francisco Bay Area, €154 million in London from congestion charging in 2006-2007 and €120 million in Singapore in 2003;
rent from retail and office space built alongside stations: 10% of the ope-rating costs of JR East and soon 40% of the Tokyo-Station-City project in Japan;
employer aid to employees: approximately €230 per year per passenger for Vale Transporte in Brazil, half of the monthly pass in France;
advertising revenue in premises, stations and on vehicles.

109
Conclusions
All potential sources of funding should be explored, without pre-conceived ideas, for short-, medium- and long-term solutions:
short-term: any solution which depends on regulations or is controlled by the transit authority: improved traffic plans for public transport, more revenue from parking, reduction in fare evasion, variable fares, more advertising reve-nue, etc.;
long-term: any solution which requires fundamental changes and social ac-ceptance: congestion charging, integrated urban development projects, land value capture, transport tax based on payroll, etc.
If the system management is delegated to a private operator, a contract must be established for a coherent duration, specifying the nature and volume of the delegated service, and clearly stipulating the respective roles of the transit authority and that of the company, as well as the latter’s commitments in terms of cost reduction and revenue optimisation. The reliability and long-term viability of funding for urban transport systems depends greatly on the quality of the operating contract and the negotiation phase.
If the system management is handled directly by a public corporation, an internal performance contract should be established in the same spirit as the private operator contract so that the objectives and responsibilities are assigned and understood by all.
Organising new sources of funding may require major institutional reforms: establishing a transit authority; allocating revenue from certain taxes to urban transport; legislative or even constitutional changes.
Implementing all the necessary measures can take time because it requires an in-depth review of the transport system as a whole and the city’s mobility requirements. Environmental considerations such as the carbon footprint should also be taken into account. An inter-disciplinary and inter-institutional approach is called for, requiring a very specific study of the city’s context in terms of its urban history, existing transport networks and their mode of management, local institutions and political possibilities. The choices for the future of a city’s public transport system must involve all decision-makers.
These issues are the same in cities all over the world and so we need to seek opportunities to pool our knowledge by mobilising international research networks and to share skills and expertise through city-to-city cooperation agreements. In the end, it is the political leaders who must find the best mix of funding for their territory so that the choices they make in favour of sustainable development for the urban transport system and the local area as a whole may one day become a reality.

Who pays what for urban transport? - Hanbook of good practices
110
References Centre d’Analyse Stratégique : Olivier Paul DUBOIS TAINE, Président. Péage urbain : principes pour
une loi (septembre 2008). Centre d’Analyse Stratégique : La captation de la plus-value foncière et immobilière : une nouvelle
source de financement des infrastructures de transport collectif ? Note de Veille N° 129 (mars 2009) http://www.stratégie.gouv.fr
CERTU-Mobilités et transports : Fiche n° 10 Une décennie de transports collectifs urbains (janvier 2009).
CERTU-Rapports d’études : Le stationnement en France en 2005. CERTU, Dépénaliser et décentraliser le stationnement pour confier le contrôle et la sanction
des infractions aux collectivités locales : l’expérience britannique et ses enseignements pour la France. Collection rapports d’études (janvier 2008).
CERTU-Mobilité : faits et chiffres. Fiche n° 2 Gestion directe et gestion déléguée - données 2005. CODATU, MEEDDAT, Banque Mondiale, AFD, MedCités. : “Les déplacements urbains en Méditerra-
née, Guide de recommandations” (2008). CODATU, Région Rhône Alpes : Guide méthodologique de la coopération décentralisée en matière
de développement urbain. Françoise METEYER-ZELDINE. Ed du CNFPT (juillet 2006). GART : L’année 2007 des transports urbains. http://www.gart.org/tele/chiffresdereferences/An-
neetransporturbains2007.pdf Grand Lyon, Laboratoire d’Economie des Transports : ABRAHAM Claude, BONNAFOUS Alain, CHABA-
NAL Daniel, CHABERT Marc, CROZET Yves, DALMAIS Christiane (Eds.). Péage et financement d’infras-tructures en milieu urbain – Lyon, les leçons d’un périphérique : Acte du colloque, 5-6 décembre 2000, Lyon (France) – Lyon : LET Etudes et Recherches N° 13.
INRETS : Le transport artisanal dans les villes méditerranéennes, Actes Inrets N° 114 (mars 2008). LAAKSO, S. Public transport investment and residential property values in Helsinki, Scandinavian
Housing & Planning Research, 9, 217-229. (1992). MEEDDAT-direction des affaires européennes et internationales, CERTU-Stratégie de mobilité durable
dans les villes des pays en développement : Guide pédagogique. Collection Dossiers (octobre 2008). Notes de synthèse du SES N° 159 : Politique de déplacements au Japon, des enseignements pour
les démarches de planification françaises ? Patricia VARNAISON REVOLLE. CETE de Lyon. Nouvelle stratégie transport de la BEI. http://www.eib.org/attachments/strategies/clean_trans-
port_lending_policy_fr.pdf Transport for London : Impact monitoring. Sixth Annual Report (July 2008). Transports Urbains N°114 : “le projet “Tokyo Station City” et le programme “Station Renaissance”
de JR East : une valorisation commerciale exemplaire des gares par l’opérateur ferroviaire”. Naoya Koide (novembre 2008).


112
Hanbook of good practices in funding urban transport