wider working paper 2016/64 no. 348-2014-4030). manvendra singh and priyanka sarda provided...
TRANSCRIPT

WIDER Working Paper 2016/64
The behavioural implications of women’s empowerment programmes
Lata Gangadharan,1 Tarun Jain,2 Pushkar Maitra,1,3
and Joseph Vecci1,4
May 2016

1 Department of Economics, Monash University, Melbourne, Australia; corresponding author: [email protected]; 2 Indian School of Business, Hyderabad, India, [email protected]; 3 [email protected]; 4 [email protected].
This study has been prepared within the UNU-WIDER project on ‘Discrimination and Affirmative Action: What have we learnt so far?’, which is part of a larger research project on ‘Disadvantaged Groups and Social Mobility’.
Copyright © UNU-WIDER 2016
Information and requests: [email protected]
ISSN 1798-7237 ISBN 978-92-9256-107-9
Typescript prepared by the Authors and Liisa Roponen.
The United Nations University World Institute for Development Economics Research provides economic analysis and policy advice with the aim of promoting sustainable and equitable development. The Institute began operations in 1985 in Helsinki, Finland, as the first research and training centre of the United Nations University. Today it is a unique blend of think tank, research institute, and UN agency—providing a range of services from policy advice to governments as well as freely available original research.
The Institute is funded through income from an endowment fund with additional contributions to its work programme from Denmark, Finland, Sweden, and the United Kingdom.
Katajanokanlaituri 6 B, 00160 Helsinki, Finland
The views expressed in this paper are those of the author(s), and do not necessarily reflect the views of the Institute or the United Nations University, nor the programme/project donors.
Abstract: Participatory community programmes are a potentially important tool for social empowerment and economic development. How do participatory programmes that specifically target women affect community trust and cohesion? This question is important since the long-term success of such programmes might depend critically on the behavioural transformation that they generate. We examine this question in the context of JEEViKA, a community-based empowerment programme that targets women in Bihar, India. Field experiments and surveys in 40 villages in Bihar reveal that JEEViKA is associated with significantly greater trust by and towards women suggesting an important role for community programmes in building economic relationships. We do not find significant differences between JEEViKA and non-JEEViKA villages in term of trustworthiness. Finally, we also find evidence that exposure to JEEViKA is associated with changes in attitudes towards women and their appropriate role in society.
Keywords: community development programmes, women’s empowerment, artefactual field experiments, trust, Bihar, India JEL classification: C93, D03, H43, H53, H75, J16
Acknowledgements: We acknowledge support provided by IGC Bihar, Monash University, Indian School of Business and UNU-WIDER. Vecci acknowledges support from the Australian Government’s Endeavour Research Fellowship and the Swedish Research Council (New Forms of Development Cooperation. Project no. 348-2014-4030). Manvendra Singh and Priyanka Sarda provided outstanding management of the research enterprise. We thank Aishwarya Turlapati, Ankita Kumari, Aprajita Choudhary, Divya Bhagia, Mrityunjay Pandey, Nagaraju Madavi, Narasimha Banavath, Ranjeet Kumar, Surbhi Kumari, Tapojay Pandey, Upasana Pattanayak and Vijaya Shalley for excellent research assistance and Chinmaya Kumar for support in Patna. We thank Mrs. Vijay Lakshmi (CEO, BRLP) and participants in the IGC Bihar Dissemination event as well as the UNU-WIDER workshop on ‘Discrimination and Affirmative Action: What have we learnt so far?’ for their comments and suggestions on earlier versions of this paper. IRB clearance from the Indian School of Business and Monash University.
1 Introduction
Community participation has long been thought of as an important component of service
delivery and provision of public goods. Between 2002 and 2012, for example, the World
Bank allocated over $85 billion to local participatory development (Mansuri and Rao,
2013). Development practitioners have argued that engaging the community in develop-
ment projects will create a closer connection between those who distribute funds and its
intended beneficiaries. An engaged community will not only hold the government ac-
countable, but also influence decisions that directly affect their lives. This can result in
tangible improvements in the types of, quality, and access to government services (Bard-
han, 2005; Bardhan and Mookherjee, 2006; Desai and Joshi, 2014; Rao and Ibanez, 2005;
Wong, 2012).
However, programs with community participation can falter when a subgroup is able to
mobilise to further their self-interest to the detriment of the rest of the community. These
subgroups may have greater information and power over decision-making, leading to po-
tential theft and corruption. This can significantly affect the provision of public goods in
these communities. This appropriation is often to the detriment of minorities and disad-
vantaged groups such as women who often have little voice or authority within the com-
munity. Indeed, (Mansuri and Rao, 2013) point out that local participation in community
development programs is often driven by wealthier, more educated, male participants with
higher social status. These factors often imply that benefits from such programs bypass
women as well as other marginalized sections of the community.
This dynamic is particularly important in the context of India where gender inequality is
particularly stark. Despite two decades of rapid economic growth and social transforma-
tion, women in India fare considerably worse than men. Sex selective abortions, disparity
in education and healthcare provision, and unequal access to economic opportunities are
1

common, especially in rural areas of the country. For example, consider the difference in
educational outcomes: while boys and girls have almost equal enrolment at the primary
level and the start of secondary school, only 73 girls enrol in tertiary school for every 100
boys. Women tend to marry young and have children quickly, and face persistent barriers
to mobility outside the home, labor force participation, and career development.
Community based programs have the potential to alleviate gender inequality, but only
when they encourage female participation in decision making processes, thereby increas-
ing women’s control over economic resources, leading to greater accountability, better
social relationships and changed gender norms (World Bank, 2015). As a result policy
makers have introduced targeted community programs with the specific aim of empower-
ing women as alternatives to both quotas and standard community-based programs.1
At the same time, mutual trust and cooperation are crucial for economic development.
Trust reduces transaction costs and is directly linked to social capital (Fafchamps, 2006).
Economic interactions particularly in developing countries where law enforcement is
weak, rely on trust to facilitate interactions and trade. Indeed, Arrow (1972) states that
“virtually every commercial transaction has within itself an element of trust. It can plau-
sibly be argued that much of the economic backwardness in the world can be explained
by lack of mutual confidence.” These factors suggest that citizens’ trust in other citizens is
a key component in economic and social development. Therefore, measuring the impact
on trust and other behavioral factors is important from the perspective of policymakers
examining community development programs and policies. Yet the academic literature
has paid little attention to developing methods for such measurement and virtually no
program systematically collects data on its behavioral implications.
1 An extensive literature examines the causes and consequences of gender disparity in India. See, forexample, the literature examining reasons for gender discrimination including Rosenzweig and Schultz(1982), Das Gupta and Bhat (1997), Bhat and Zavier (2007), Das Gupta (2010) and Jain (2014). Theconsequences of gender discrimination are discussed by a large literature as well, perhaps best summarizedby Duflo (2012).
2
This paper asks how do participatory programs that specifically target women affect com-
munity trust and cohesion? The long term success of community based programs might
depend critically on the behavioral transformation that they generate, but the answer is
not straightforward as an empirical matter. If the program is associated with greater trust
among both men and women, then the entire community moves towards ‘good’ equilibria
with benefits beyond the program. Conversely, the targeted nature of the program might
generate negative behavioral reactions, which reduces social capital and potentially de-
stroys long term economic and social relationships. Given this theoretical ambiguity, our
main contribution is to use a unique field experiment to examine the behavioral response
to a participatory program and in particular the behavioral response towards women. The
effects of this program on behavioral characteristics such as trust and trustworthiness is
an open empirical question.2
We examine this question in the context of the Bihar Rural Livelihoods Project, or JEE-
ViKA, undertaken by the Government of Bihar and the World Bank. The program is
designed specifically to empower rural women, both socially and economically, through
the creation of self-managed community microfinance institutions, greater access to social
protection (including food security) and a greater community voice.3 Our field experiment
involves a trust task conducted in both JEEViKA and non-JEEViKA villages, we compare
if program villages exhibit differences on measures of trust and trustworthiness.
We conduct field experiments to understand the relationship between community devel-
opment programs and behavioral transformation. Given the explicit gender targeting of
the JEEViKA program, our field experiment is designed to account for gender differences
2 Given our focus on behavioral outcomes, this research directly relates to the literature examiningthe behavioral effects of development programs and policies. Feigenberg et al. (2013) use a public goodsexperiment to examine how microfinance programs in West Bengal in India impact cooperation. Using a setof lab-in-the-field experiments, Cameron et al. (2013) find that the one-child policy in China had significantbehavioral impacts on a whole generation of Chinese children. Using similar methods, Gangadharan et al.(2015) examine backlash from men against female leaders in Indian villages who were elected under aquota policy reserving seats for women.
3 Section 2 describes the program in detail. Also see the implementation plan (BRLPS, 2009).
3
in behavioral responses. The field experiments and respondent surveys were conducted
among 960 participants from 40 villages in Bihar in 2014. JEEViKA was operational in
20 of these villages and not in the remaining 20 villages. The format of the field exper-
iment allows subjects to be randomized into groups, hence reducing selection bias and
enabling causal inference. In addition to the experiments, we collected extensive indi-
vidual and community-level survey data to understand experiences with JEEViKA and
attitudes towards women.
Our central finding is that women in JEEViKA villages are significantly more trusting
and more trusted than in non-JEEViKA villages, a result perhaps of participating in the
community activities that are at the core of the program. Simultaneously, our regression
results do not reveal any differences in trustworthiness among women in the JEEViKA
villages. Thus, the experimental results suggest that the JEEViKA program is positively
associated with trust by and towards women, but cannot conclude that the program com-
prehensively affected other types of community behavior.
Surveys of the experimental participants reveal greater aspirations for their children’s ed-
ucation among JEEViKA village residents, and lower desire for girls to enter traditional
female occupations. In addition, men in JEEViKA villages are more likely to appreciate
the value of women in leadership roles. These findings suggest that the experimental find-
ings on increased trust are also correlated with other attitudinal changes that can translate
into long term women’s empowerment and economic development.
2 The JEEViKA Program
The Bihar Rural Livelihoods Project (or “JEEViKA”) is a poverty reduction program un-
dertaken by the Government of Bihar and the World Bank. The program aims to socially
4

and economically empower the rural poor by focusing on women. It focuses on creating
sustainable livelihoods through self-managed community institutions, improved access to
social protection (including food security) and greater community voice.
The main instrument to achieve these aims are women’s community-based self-help groups
(SHG) that provide a mechanism for savings and borrowing.4 The objective is that over
time and with regular repayments these groups will become self sustaining organizations.
Each village contains a number of SHGs which are federated at the village or hamlet
level to form a Village Organisation (VO). The VO operates as a forum or voice of the
poor in the village and provides resources to their member SHGs through the Community
Investment Fund. The VOs are also responsible for development projects that aim to re-
duce poverty. Each VO comprises of all SHG members and an Executive Committee that
consists of two representatives from each member SHG. VOs are further federated at the
block level to form community level federations that act as lenders to VOs.
In addition to community institutional development, the JEEViKA program comprises of
three other components.
1. Community Investment Fund (CIF). Over half of programs funds are channelled
through the CIF which is responsible for the initial capitalisation of the Commu-
nity Level Federations, funding village food security programs, skill building and
village social services such as funding education and health programs.
2. Special Technical Assistance and Development Funds. This component is respon-
sible for establishing a technical assistance facility which supports the community
institution (including SHGs and VOs) by improving access to financial services.
The Bihar Innovation Fund finances innovations to improve livelihoods.
3. Project Management. This component comprises human resources training, com-
4 The government of India aims to have functioning SHGs in all villages throughout India.
5
munication and monitoring and evaluation services.
The JEEViKA project commenced in 2007 and mobilized 1.3 million households into
93,000 self-help groups and federations by May 2014. These households contributed
USD 9.5 million in the form of savings and received USD 56 million of financing from
commercial banks. Financial literacy and counselling interventions have also been imple-
mented in 18 blocks.
The blocks targeted under the JEEViKA program were not randomly selected. Specif-
ically, the program provided targeted assistance to about 1,220,000 households in 42
blocks in six districts (Nalanda, Gaya, Khagaria, Muzaffarpur, Madhubani, Purnea) in
the state. Within each block, the beneficiaries were the poor, especially the socially
and economically deprived class such as the Scheduled Castes, marginalised backward
classes, people with no productive resources, daily wage laborers, bonded labor, unskilled
marginal farmers, unskilled migrants, disabled and child labor. The relevant districts and
blocks were selected using a poverty and social assessment of the state conducted by
the Bihar Rural Livelihoods Promotion Society. This assessment examined each district
and block on four aspects – poverty, social vulnerability, livelihood potential and social
capital. The blocks that were selected had a high incidence of disadvantaged groups as
reflected in the percentage of SC and ST population, were characterized by adverse status
of women reflected in adverse sex ratio and low female literacy, and had low basic infras-
tructure availability. This means that villages included in the program were poorer across
a number of traits and therefore not representative of the average village in the state.5
In a retrospective evaluation of the program, Datta (2015) examines a range of outcomes
among beneficiary versus non-beneficiary households. The main finding is that the struc-
ture of household debt in beneficiary households is different. JEEViKA SHG members
have significantly lower burden of high cost debt, and instead access smaller loans repeat-5 See BRLPS (2009) and Datta (2015) for more discussion on this issue.
6
edly and borrow more often for productive purposes. Women in beneficiary households
demonstrate higher levels of mobility, decision making, and collective action. The eval-
uation also reports some increases in asset ownership, food security and sanitation pref-
erences of beneficiary households. Concurrently, the program did not affect long term
income dynamics, changing neither land ownership or land leasing patterns, nor shift
away or toward agricultural activities.
Based on ethnographic fieldwork in four villages in rural Bihar, Sanyal et al. (2015) find
that JEEViKA’s focus on women’s empowerment created new “cultural configurations”
and broke down normative restrictions on gender roles. These researchers argue that the
program not only offered women access to physical resources such as credit, but also
a new social identity of SHG member (distinct from identities of caste, religion or eth-
nicity). In addition, membership in JEEViKA meant that women were participating in
new institutional environments, thereby gaining access to knowledge, skills and social
networks outside their traditional domain. Thus, programs such as JEEViKA can have
a transformative social effect beyond the direct economic impact. In the long run, these
direct effects can change social norms (for instance, whether to trust women in financial
transactions) in a way that fundamentally change the nature of economic relationships.
3 Experimental design
We investigate the extent to which participant behavior in experiments is influenced by
perceptions or experience with the JEEViKA program. Harrison and List (2004) argue
that one of the advantages of artefactual field experiments is that participants bring their
prior ideas and experiences from everyday life into the experimental sessions which might
in turn shape their behaviour. Our experimental sessions were conducted in 40 villages in
three districts of Bihar, 20 of which were JEEViKA villages and 20 of which were not.
7
A total of 955 villagers from different sections of the village society participated in the
experimental sessions. We discuss results from two experiments – a trust game, and a risk
game that was embedded in the post-experiment survey.6 In addition to the experiments,
we collected extensive individual and community-level survey data to understand expe-
riences with JEEViKA and other development programs. The rest of this section briefly
describes the details of the experimental design.
3.1 Trust task
The first task in the artefactual field experiment is based on the trust (or investment) game
(Berg et al., 1995). We implement a one-shot version of the game to avoid reputation and
learning effects and to avoid subject fatigue. The Trust task is a two-player game in which
players are randomly assigned one of two roles: a Trustor or a Trustee. Each participant
is given an initial endowment of E. Each Trustor is asked to decide to transfer any part of
this endowment, S to an anonymous Trustee (S ∈ [0, E]). The experimenter triples this
S and gives it to the matched Trustee, who in turn is asked to choose whether to transfer
any money out of E + 3S back to the Trustor. So the payoff for the Trustor is E − S + R
where R is the amount returned by the Trustee; the corresponding payoff for the Trustee is
E +3S −R. The resolution of this game using backward induction is simple. In a one-shot
version of the game, the Trustee should not return any money knowing that the game ends
immediately thereafter. The Trustor, anticipating the Trustee’s decision, should send no
money to the Trustee in the first place. However, actual behavior is often quite different
from the one predicted by theory. In this task, any transfer made by the Trustor to the
anonymous Trustee can be interpreted as a measure of trust and any amount returned by
the Trustee is a measure of trustworthiness.6 We also conducted a modified public goods game, the details of this are in Gangadharan et al. (2015).
This paper focuses on the effects of exposure to the JEEViKA program on trust and trustworthiness andtherefore we use data from the trust experiment only.
8
The strategy method is used to obtain the trustee decisions. To do this, the Trustee is asked
to specify an amount to return R(S ) for every possible amount of S chosen by the Trustor.
We restrict S to specific integer amounts. Specifically, the endowment E is INR 200, so
each trustor could choose to send an amount S from the endowment to his/her anonymous
partner where S ∈ {0, 25, 50, 75, 100, 125, 150, 175, 200}. The experimenter triples this
amount and therefore the trustee receives {0, 75, 150, 225, 300, 375, 450, 525, 600}. The
Trustee therefore provided conditional responses, i.e., how much to return for each of
eight possible choices made by the Trustor. For S = 0, there is no decision to be made.7
In all sessions, participants are given instruction sheets with own gender symbols on the
front page making gender prominent. JEEViKA and Non-JEEViKA villages were ran-
domly assigned to one of two treatments either the control (gender not revealed) or treat-
ment (gender revealed). In the control the gender of the partner was not revealed; in the
gender revealed treatment, the gender of the participant’s partner is revealed. This was
done prior to the participant making his or her decision.8
3.2 Risk game
A risk task similar to Gneezy and Potters (1997) was embedded in the survey. In the
risk task, each player was given the option of investing any part of an initial endowment
of INR 20 in a hypothetical risky project that had a 50% chance of tripling the amount
invested; alternatively the amount invested could be lost with a 50% probability. The in-
dividual could keep any amount he/she chose not to invest. The amount invested provides
a measure of risk preference. A higher amount invested in the riskier option indicates that
the participant is risk loving. This risk preference could be used to control for the possible
confound caused by risk on the amount sent by the trustor in the Trust task. All subjects
7 INR is the currency of India. At the time of conducting the experimental sessions, 1 USD = INR 55.8 Recent studies have demonstrated that priming gender, ethnicity or religion can cause changes in the
behaviour of experimental participants (Benjamin et al., 2010; Burns, 2012; Chen et al., 2014).
9
were paid for this task.
4 Setting and procedure
4.1 Location and village selection
In this section we describe the setting of the experiment, the methods used to select vil-
lages for our study and the recruitment of participants from these villages. Finally, we
describe the procedures for surveying individuals and the local community.
The artefactual field experiment were conducted in the villages of Bihar, India. Specif-
ically, our data was collected from 40 villages in the districts of Gaya, Madhubani and
Khagaria, which are approximately equidistant from the capital city of Patna.9 Figure 1
presents more information on the location of the experimental sessions. Almost 10% of
India’s population resides in Bihar, which is characterized by substantial gender inequal-
ity. Bihar is also one of the fastest growing states in India with an average GDP growth
of 10% between 2010 and 2014.
Using a list of villages provided by the Bihar Rural Livelihoods Project (BRLP) and cor-
responding characteristics from the 2011 Census of India, we randomly chose 40 villages
in Gaya, Khagaria and Madhubani districts. Only one session was conducted in each vil-
lage to prevent information spillovers across sessions, which could result in considerable
loss of experimental control and precision. Column 1 in Table 1 presents the average
village level characteristics for the full sample. The villages, on average, consist of 566
households, with an average of 5 members per household. 33% of the households in these
villages belong to Scheduled Castes. The average literacy rate is around 44%, though men
9 Indian districts are large, and the total population of these districts is close to 11 million, which makethem more populous than countries like Portugal, Hungary, Honduras, Sierra Leone and New Zealand.
10
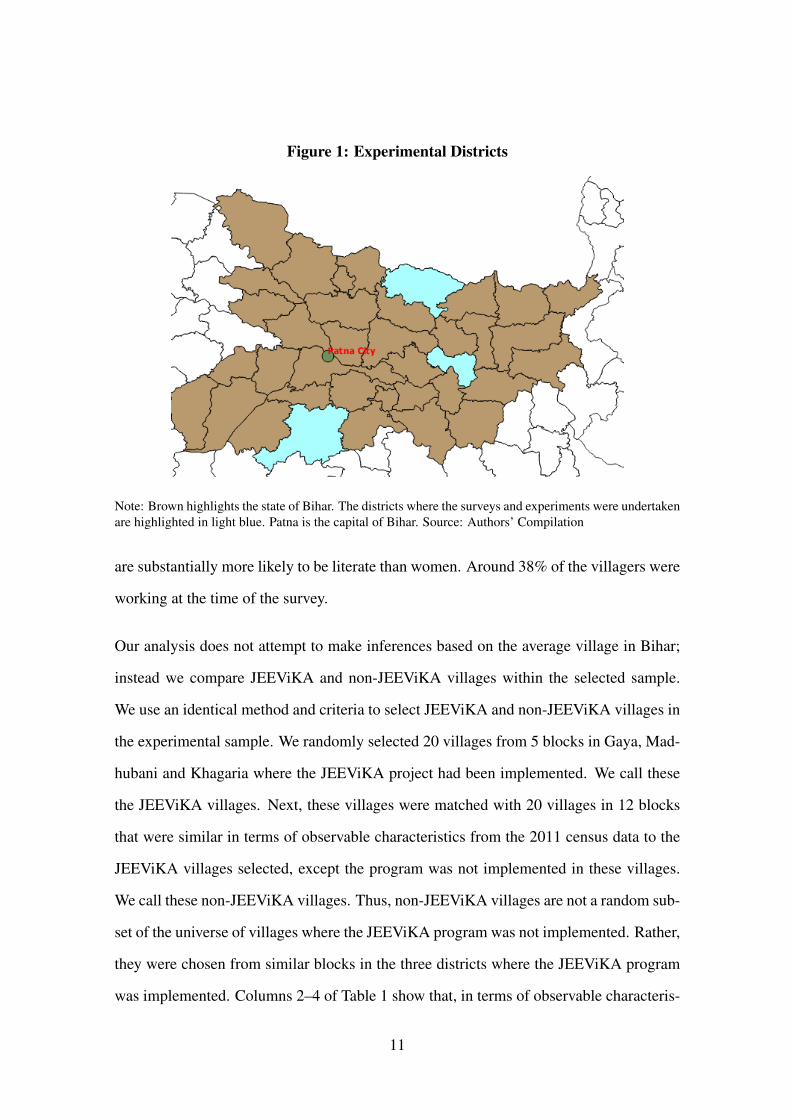
Figure 1: Experimental Districts
Note: Brown highlights the state of Bihar. The districts where the surveys and experiments were undertakenare highlighted in light blue. Patna is the capital of Bihar. Source: Authors’ Compilation
are substantially more likely to be literate than women. Around 38% of the villagers were
working at the time of the survey.
Our analysis does not attempt to make inferences based on the average village in Bihar;
instead we compare JEEViKA and non-JEEViKA villages within the selected sample.
We use an identical method and criteria to select JEEViKA and non-JEEViKA villages in
the experimental sample. We randomly selected 20 villages from 5 blocks in Gaya, Mad-
hubani and Khagaria where the JEEViKA project had been implemented. We call these
the JEEViKA villages. Next, these villages were matched with 20 villages in 12 blocks
that were similar in terms of observable characteristics from the 2011 census data to the
JEEViKA villages selected, except the program was not implemented in these villages.
We call these non-JEEViKA villages. Thus, non-JEEViKA villages are not a random sub-
set of the universe of villages where the JEEViKA program was not implemented. Rather,
they were chosen from similar blocks in the three districts where the JEEViKA program
was implemented. Columns 2–4 of Table 1 show that, in terms of observable characteris-
11
tics, JEEViKA villages are not statistically different from non-JEEViKA villages. Finally,
Columns 5–7 show that in terms of average village level characteristics, those assigned to
the gender revealed treatment are no different to those assigned to the gender not revealed
treatment.
4.2 Participant recruiting
To recruit participants for the experiment, a male and a female member of the research
team visited each village the day before the session was scheduled in that village. They
informed villagers of the event and distributed flyers containing information about par-
ticipation requirements including eligibility (18 or older and literate), remuneration, time
and location of the experimental session. Flyers were also posted at prominent village
landmarks such as community centers, bus stops, tea shops, temples and mosques. Par-
ticipants in the JEEViKA villages were not restricted to those who had directly benefited
from the program; although the program has a specific target population, it may also affect
the local non-target population within the village.
4.3 Procedure
Each village had approximately 24 participants.10 Upon arrival, participants were screened
for eligibility, then their names were recorded on a participant list. Once seated, they
were given stationary and, at random, a number tag representing their ID. The experi-
menter read aloud instructions to establish common knowledge. To determine whether
subjects understood the instructions, each participant answered a set of control questions
in private before the experiment commenced. The experimenter cross-checked answers
10 One village had 20 participants. Additionally, the survey data for one participant could not be used,though experimental data are available for this subject.
12
and started the experiment once satisfied that all subjects understood the task. No com-
munication was allowed during the session. The instructions were read aloud in Hindi.11
Visual descriptions of the tasks were also displayed while reading out the instructions.
The survey questions were administered by research assistants. An analysis of responses
indicates that there are no differences depending on the gender of the research assistant
administering the questions.
All subjects participated in the trust task, then the public goods task followed by the post-
experiment survey. In the survey, each participant answered questions on aspirations for
their children, attitudes towards women and towards female leaders, in additional to ques-
tions on individual and household level demographic and socio-economic characteristics.
The tasks were always run in the same order (i.e., the trust task followed by the public
goods task), no feedback was provided to the subjects in between the two tasks and sub-
jects were paid on the basis of the outcomes in one of the two tasks, randomly determined
after the post experiment survey had been conducted. The only task that subjects received
any feedback for was the one for which they were paid. Paying for one task helps reduce
wealth effects. The average payout to participants was INR 420, or approximately two
days wage for a semi-skilled laborer in Bihar. Including the post-experiment surveys,
each session lasted on average for four hours. Data was entered twice and subsequently
checked and reconciled by two different research assistants. The results were compared
against hard copies in case of inconsistencies.
4.4 Descriptive statistics
Column 1 in Table 2 presents the means for a number of participant characteristics. The
average participant is 27 years old, from a household with 7.8 members and predomi-
11 The instructions were first prepared in English, and then translated into Hindi by a native Hindi speaker.The English and Hindi versions were compared and verified for consistency by a person fluent in both Hindiand English.
13
nantly Hindu (90%), with a mix of upper caste (26%), Scheduled Caste (24%) and Other
Backward Classes (42.5%). More than half the sample have completed high school, with
evidence of significant intergenerational mobility in educational attainment.
Columns 2, 3 and 4 present the average characteristics of the sample in the JEEViKA
and non-JEEViKA villages and the corresponding differences, respectively. The sample
characteristics between the JEEViKA and the non-JEEViKA villages are not systemati-
cally different. Specifically, the sample from the non-JEEViKA villages are significantly
more likely to be Hindu, belong to Upper Caste and are more likely to have completed
primary schooling. Conversely, the sample residing in JEEViKA villages are more likely
to belong to Other Backward Castes, completed tertiary education and have fathers who
have completed primary schooling.
Columns 5 and 6 present the means of the observable characteristics on the basis of
whether the participant was assigned the role of trustor or trustee. The differences pre-
sented in column 7 do not show any statistically significant differences between partici-
pants assigned roles of trustors versus trustees on observed individual level characteristics.
To examine whether the random assignment of participants to treatments was effectively
implemented, Columns 8, 9 and 10 report differences in participant characteristics by
treatment. For most characteristics, there are only minor differences across individuals
assigned to the two treatments.
5 Results
Table 3 presents descriptive statistics by gender on the key outcome variables. Panel A
presents the averages for the trust task. Columns 1 and 2 present the means separately
for the male and female participants in all villages and column 3 the gender difference.
14
Overall, men are significantly more trusting than women: they send a significantly higher
amount as trustors (p-value of difference = 0.05). This is driven by behavior in the non-
JEEViKA villages. (Columns 7–9) show that men exhibit significantly greater trust in
these villages. However, due to a sharp increase in trust by female trustors and a slight
decrease in trust by male trustors, we do not detect significant behavioral differences
by gender in the JEEViKA villages. We return to this issue later when we discuss the
regression results relating to trust behavior.
While amount sent to female trustees is always higher than the amount sent to male
trustees (by the average participant), the gender difference is not statistically significant.
Similarly, there is no gender difference in trustworthiness.
Panel B presents the descriptive statistics on risk preferences, which is defined as the
proportion allocated to the risky asset in the risk task. Men have a significantly greater
preference for risk in the overall sample (+0.10, p < 0.01), as well as in the JEEViKA
(+0.12, p < 0.01) and non-JEEViKA villages (+0.08, p < 0.05). In our trust regressions,
below, we control for the risk preferences of the participants so that regression results are
not confounded by differences in risk preferences.
5.1 JEEViKA and attitude differences
JEEViKA and non-JEEViKA villages display little difference in perceptions about the
appropriate occupation and education aspirations of male and female children and the
appropriateness of women in positions of power (see Table 4). However, respondents in
JEEViKA villages are significantly more likely to strongly agree with the following two
statements: (1) “villages where women have more power perform better”, and (2) “in this
village women have too much political influence”.
Exposure to the JEEViKA program is associated with a significant difference in attitudes
15

of both men and women. Male respondents in JEEViKA villages have higher aspirations
for their daughters than their non-JEEViKA counterparts: they are less likely to want
their daughters to be employed in a traditional female occupation (housewife, teacher or
preschool teachers) and they are more likely to report that they would prefer their daugh-
ters to select the occupation they prefer. Men in JEEViKA villages are also significantly
more likely to agree with the statement “villages with women in power perform better”.
Compared to their non-JEEViKA counterparts, women in JEEViKA villages are more
likely to aspire for tertiary education for their children (+0.077, p < 0.10), perhaps be-
cause the value of education is more readily understood as a result of the JEEViKA pro-
gram. Women also report feeling safer in JEEViKA villages (+0.070, p < 0.10), which is
important given widespread violence against women in this region. However, women are
significantly more likely to report barriers against women in leadership positions (+0.081,
p < 0.10), perhaps because leadership opportunities created by the JEEViKA program
also allow barriers to manifest.
5.2 Trust and trustworthiness
In this section we examine the effects of exposure to the JEEViKA program on participant
trust and trustworthiness in more detail. Recall that in the trust task (Section 3.1), the
amount sent by the trustor is interpreted as a measure of trust while the amount returned
by the trustee is a measure of trustworthiness. First, we examine whether women are more
trusting, particulary after experience with the JEEViKA program, using the following
regression equation.
S iv = β0 + β1Trustor f + β2JEEViKAv + β3Trustor f × JEEViKAv + γXiv + εiv (1)
16

where S iv is the amount sent by trustor i who is a resident of village v in the trust task.
Trustor f is a dummy variable that takes the value of 1 if the trustor is female; JEEViKAv
denotes that the JEEViKA program was implemented in village v. Recall that trustors
and trustees both reside in the same village, but matching was anonymous – trustors did
not know the identity of the matched trustee and vice versa. Finally, Xiv includes a set of
individual controls – age, educational attainment, occupational status, income, religion,
caste, household size, father’s school completion and the proportion of the endowment
allocated to the risky asset in the risk task described in Section 3.2. The regressions
also control for a set of district fixed effects that account for all district level unobserved
heterogeneity. Standard errors are clustered at the village level.12
Table 5 presents regression results on trust from estimation of equation (1). The regression
results presented in Column 1 imply that female trustors exhibit significantly more trust
compared to male trustors in JEEViKA villages (+21.97, p < 0.05). In non-JEEViKA
villages, women are significantly less trusting than men and exposure to the JEEViKA
program is associated with a significant increase in trust by women.
Columns 2 and 3 present the trust results separately for the gender revealed and gender
not revealed villages. The result that females in JEEViKA villages exhibit significantly
higher levels of trust is true only in the gender revealed villages (+33.67, p < 0.05).
Table 6 examines gender differences in being trusted by reporting coefficients from esti-
mation of a variant of equation (1).
S iv = β0 + η1Trustee f + η2Trusteem + η3JEEViKAv + γXiv + uiv (2)12 Note that we cannot include village fixed effects because we are interested in the effect of the
JEEViKAv dummy which is a village level variable. We also cannot include block or sub-district fixedeffects as the roll-out of the JEEViKA program was at block level. Therefore, the JEEViKA status ofvillages in the same block does not vary.
17
In this equation, Trustee f and Trusteem are dummies for the gender of the trustee.13
The regression results presented in Column 1 imply that on average, relative to when
the gender of the trustee is not revealed, female (but not male) trustees are significantly
more trusted (+14.756, p < 0.05). The results in Column 2 decompose the effects by the
JEEViKA status of the village. As the total effects imply, women are more trusted only in
JEEViKA villages (+16.49, p < 0.10).
In summary, the findings in Tables 5 and 6 imply that women exposed to the JEEViKA
program are both more trusting and more trusted. Next, we examine whether women
are more likely to reciprocate this trust (i.e., whether they are more trustworthy), and if
exposure to the JEEViKA program affects this by estimating the following regression.
Riv = α0 + α1Trustee f + α2JEEViKAv + α3Trustee f × JEEViKAv + δZiv + εiv (3)
where Riv is the average proportion returned by the trustee.14 Ziv includes a set of indi-
vidual controls such as age, educational attainment, occupational status, income, religion,
caste, household size, father’s school completion as well as a set of block fixed effects
that account for all block (or sub-district) level unobserved heterogeneity. Standard errors
are clustered at the village level.15 Table 7 shows no statistically significant differences in
trustworthiness by gender or exposure to the JEEViKA program.
13 The reference category is that the gender of the matched trustee is not known to the trustor.14 The proportion returned by the trustee is defined by R
E+3S , where E is the endowment of the trustee andS is the amount sent by the trustor, which is tripled by the experimenter. Recall that we collect informationon R for all possible values of E (i.e., use the strategy method), the average proportion returned is theaverage over all the decisions made by the trustees.
15Our results remain unchanged when pooling the reported R for each trustee over the different values ofS and cluster the standard errors at the individual level.
18
6 Conclusion
A 2009 report by the World Bank, FAO and IFAD offered evidence that community par-
ticipatory programs can and often bypass women (World Bank, FAO and IFAD, 2009).
Women focused community participatory programs such as JEEViKA have significant
potential to empower women leading to long term community development. These pro-
grams can work by increasing women’s skills, bargaining power and ultimately change
perceptions about the appropriate role of women in the community (Ahmed et al., 2009).
By measuring differences in trust and other attitudes in JEEViKA and non-JEEViKA vil-
lages, our research offers an important new dimension on which to evaluate community-
based programs. We find evidence of significant differences in the behaviour and attitudes
towards women in program villages. Specifically, we find that the program is associated
with an improvement in trust, first among women and subsequently reciprocated by men
they interact with. Trust in fellow community members is a key driver of community co-
operation, without trust community driven programs may be less effective. The program is
associated with changes in attitudes of men away from the traditional role and expectation
of women. The finding compliment existing survey research on the JEEViKA program
that find women’s empowerment measured in terms of mobility and decision making im-
proves for those women participating in the program (Datta, 2015). In addition, Sanyal
et al. (2015) find that the JEEViKA program changes cultural norms towards women by
giving women access to new networks and increasing knowledge.
These findings should be accompanied with a few caveats. Given that the original JEE-
ViKA blocks were not randomly selected, it is possible that despite our method of selec-
tion the villages are not matched on unobservable characteristics. For instance, we might
have unobserved selection on political variables. Villages selected for JEEViKA could ei-
ther be safely held by the ruling party or a place where the ruling party had marginal victo-
ries (and thus needs to shore up its support). This might bias our results if there is greater
19

trust in leaders in the sample villages (because everyone agrees that they should vote for
the ruling party) or greater distrust in leaders in the sample villages (due to political po-
larization) than non-JEEViKA villages. Second, we might have unobserved selection on
women’s empowerment. Villages selected for JEEViKA could either have a relatively
high baseline level of women’s empowerment (makes program implementation easier),
or a relatively low baseline level of women’s empowerment (greater urgency for such a
program). Finally we could have unobserved selection on bureaucratic quality. Villages
selected for JEEViKA might be allocated better, more experienced and more motivated
bureaucrats who facilitate and encourage program implementation, and these bureaucrats
could also separately impact trust/leadership outcome variables. So bureaucratic quality
might be a potentially omitted variable that can simultaneously effect both program qual-
ity and the behavioural response. Each of these unobserved differences, resulting from
the fact that the JEEViKA villages were not randomly selected, could result in an omit-
ted variable bias which could potentially affect the external validity of our results. Our
matching of JEEViKA and non-JEEViKA villages on observables however implies that
our analysis accounts for internal validity of the results pertaining to differences between
the JEEViKA and non-JEEViKA villages.
Nonetheless, these findings have important policy implications, both for JEEViKA as well
as for similar projects. It is argued that increased representation of women in villages can
potentially improve both gender equality as well as the quality of governance and commu-
nity outcomes. Our results show that female empowerment programs have the potential
to change attitudes and behaviour such as trust. Further research is needed to understand
if this is a common phenomenon, and if so, why and in what situations? More signifi-
cant is the potential for increases in trust to have large economic and social effects in the
JEEViKA villages. These effects may last well after the formal program ends, adding
to the long term value accruing from the JEEViKA program. Future research evaluat-
ing the effectiveness of community driven development programs could institutionalise
20

procedures for measuring and evaluating trust and other behavioural traits both at base-
line and the endline to identify the behavioural impacts of community driven projects.
Finally, the results presented in this paper are in contrast to the experiences of many com-
munity programs which have been found to ignore the voice of women (Wong, 2012).
In many developing countries, women’s voice is marginalised and untargeted community
programs that leave decision making to elites within a community will not change this
aspect. For participatory community programs to be beneficial for all social groups, pol-
icy makers should ensure that community programs explicitly target women, apart from
other objectives.
21

ReferencesAhmed, Z., C. Euler, S. Khattak, J. Morton, and M. Tariq (2009). Assessing the im-
pact of community-driven development: Twenty six years of Pakistan’s rural supportprogrammes. Technical report, London, UK: DFID.
Arrow, K. (1972). Gifts and exchanges. Philosophy and Public Affairs 1, 340–362.
Bardhan, P. (2005). Scarcity, Conflicts, and Cooperation: Essays in the Political andInstitutional Economics of Development. Cambridge, MA: MIT Press.
Bardhan, P. and D. Mookherjee (2006). The rise of local governments: An overview. InP. Bardhan and D. Mookherjee (Eds.), Decentralization and Governance in DevelopingCountries, pp. 1 – 52. Cambridge, MA: MIT Press.
Benjamin, D., J. Choi, and A. Strickland (2010). Social identity and preferences. Ameri-can Economic Review 100(4), 1913–1928.
Berg, J., J. Dickhaut, and K. McCabe (1995). Trust, reciprocity, and social history. Gamesand Economic Behavior 10(1), 122–142.
Bhat, P. and A. Zavier (2007). Factors influencing the use of prenatal diagnostic tech-niques and the sex ratio at birth in India. Economic and Political Weekly 42(24), 2292– 2303.
BRLPS (2009). Project implementation plan: Jeevika. Technical report, Government ofBihar.
Burns, J. (2012). Race, diversity and pro-social behavior in a segmented society. Journalof Economic Behavior and Organization 81(2), 366 – 378.
Cameron, L., N. Erkal, L. Gangadharan, and X. Meng (2013). Little emperors: Behavioralimpacts of China’s one-child policy. Science 339(6122), 953–957.
Chen, Y., S. Li, T. Liu, and M. Shih (2014). Which hat to wear? Impact of naturalidentities on coordination and cooperation. Games and Economic Behavior 84, 58–86.
Das Gupta, M. (2010). Family systems, political systems, and Asia’s missing girls: Theconstruction of son preference and its unraveling. Asian Population Studies 6(2), 123– 152.
Das Gupta, M. and P. Bhat (1997). Fertility decline and increased manifestation of sexbias in India. Population Studies 51(3), 307 – 315.
Datta, U. (2015). Socio-economic impacts of JEEViKA: A large-scale self-help groupproject in Bihar, India. World Development 68, 1 – 18.
Desai, R. and S. Joshi (2014). Collective action and community development: Evidencefrom self-help groups in rural India. World Bank Economic Review 28(3), 492–524.
22
Duflo, E. (2012). Women empowerment and economic development. Journal of Eco-nomic Literature 50(4), 1051 – 1079.
Fafchamps, M. (2006). Development and social capital. Journal of Development Stud-ies 42, 11801198.
Feigenberg, B., E. Field, and R. Pande (2013). The economic returns to social interaction:Experimental evidence from microfinance. Review of Economic Studies 80, 1459–1483.
Gangadharan, L., T. Jain, P. Maitra, and J. Vecci (2015). Social identity and governance:The behavioral response to female leaders. European Economic Review forthcoming.
Gneezy, U. and J. Potters (1997). An experiment on risk taking and evaluation periods.Quarterly Journal of Economics 112(2), 631 – 645.
Harrison, G. and J. List (2004). Field experiments. Journal of Economic Literature 42(4),1009 – 1055.
Jain, T. (2014). Where there is a will: Fertility behavior and sex bias in large families.Journal of Human Resources 49(2), 393–423.
Mansuri, G. and V. Rao (2013). Localizing development: Does participation work? Tech-nical report, Washington, DC: World Bank.
Rao, V. and A. Ibanez (2005). The social impact of social funds in Jamaica: A ‘par-ticipatory econometric’ analysis of targeting, collective action, and participation incommunity-driven development. Journal of Development Studies 41(5), 788 – 838.
Rosenzweig, M. and T. Schultz (1982). Market opportunities, genetic endowments, andintrafamily resource distribution: Child survival in rural India. American EconomicReview 72(4), 803 – 815.
Sanyal, P., V. Rao, and S. Majumdar (2015). Recasting culture to undo gender: A socio-logical analysis of Jeevika in rural Bihar, India. World Bank Policy Research WorkingPaper No. 7411.
Wong, S. (2012). What have been the impacts of World Bank community-driven devel-opment programs? Technical report, Washington DC: World Bank.
World Bank (2015). The impacts of community driven development interventions onwomen’s empowerment. Technical report, World Bank.
World Bank, FAO and IFAD (2009). Gender in agriculture sourcebook. Washington, DC:World Bank.
23

Tabl
e1:
Vill
age
char
acte
rist
ics
JEE
ViK
Avs
Non
-JE
EV
iKA
Trea
tmen
tPo
oled
Sam
ple
JEE
ViK
AN
on-J
EE
ViK
AD
iffer
ence
Gen
derR
evea
led
Gen
derN
otR
evea
led
Diff
eren
ce(1
)(2
)(3
)(4
)(5
)(6
)(7
)
Num
bero
fhou
seho
lds
566.
0767
0.50
461.
6520
8.85
580.
5555
1.6
28.9
5To
talp
opul
atio
n29
23.5
534
87.7
523
59.3
511
28.4
031
33.9
2713
.242
0.7
Mal
eto
fem
ale
ratio
1.05
1.06
1.05
-0.0
11.
061.
040.
02Fr
actio
nSC
0.33
0.34
0.31
0.03
0.33
0.32
0.01
Frac
tion
ST0.
000.
000.
000.
000.
000.
000.
00Fr
actio
nlit
erat
e0.
440.
420.
45-0
.02
0.44
0.43
0.00
Frac
tion
mal
elit
erat
e0.
520.
550.
490.
060.
520.
51-0
.01
Frac
tion
fem
ale
liter
ate
0.35
0.35
0.35
0.01
0.35
0.35
0.00
Frac
tion
wor
kers
0.38
0.36
0.40
-0.0
40.
380.
380.
00
Not
es:T
his
tabl
esh
ows
the
exan
teba
lanc
ein
the
char
acte
rist
ics
ofvi
llage
sch
osen
fore
xper
imen
ts.∗∗∗p<
0.01,∗∗
p<
0.05,∗
p<
0.10
.So
urce
:Aut
hors
’com
puta
tions
.
24

Tabl
e2:
Part
icip
antc
hara
cter
istic
s
JEE
ViK
Avs
Non
-JE
EV
iKA
Rol
ein
Trus
tTas
kTr
eatm
ent
Pool
edJE
EV
iKA
Non
-D
iffer
ence
Trus
tor
Trus
tee
Diff
eren
ceG
ende
rG
ende
rD
iffer
ence
Sam
ple
JEE
ViK
AR
evea
led
Not
Rev
eale
d(1
)(2
)(3
)(4
)(5
)(6
)(7
)(8
)(9
)(1
0)
Are
you
curr
ently
wor
king
0.39
0.38
70.
388
-0.0
010.
370
0.40
5-0
.035
0.41
0.37
0.04
No
inco
me
inth
epa
st30
days
0.63
0.63
60.
625
0.01
10.
646
0.61
60.
030.
600.
66-0
.06*
Age
inye
ars
27.0
227
.30
26.7
00.
6026
.79
27.2
5-0
.46
27.3
026
.74
0.56
Hou
seho
ldsi
ze7.
777.
817.
720.
097.
821.
719
6.10
17.
498.
27-0
.78*
**H
indu
0.91
0.84
40.
960
-0.1
16**
*0.
897
0.91
6-0
.019
0.89
0.93
-0.0
3**
Upp
erC
aste
0.26
0.20
40.
310
-0.1
06**
*0.
251
0.26
3-0
.012
0.24
0.27
-0.0
3Sc
hedu
led
Cas
te0.
240.
248
0.23
10.
017
0.23
40.
246
-0.0
120.
220.
27-0
.05*
OB
C0.
430.
476
0.37
30.
103*
**0.
439
0.41
00.
029
0.45
0.40
0.05
Ow
nsc
hool
ing
No
scho
olin
g0.
050.
054
0.04
40.
010
0.04
60.
052
-0.0
060.
040.
06-0
.01
Prim
ary
scho
ol0.
300.
248
0.34
2-0
.094
***
0.28
70.
304
-0.0
170.
310.
280.
03Se
cond
ary
scho
ol0.
230.
246
0.21
00.
036
0.23
20.
224
0.00
80.
230.
23-0
.01
Hig
hers
econ
dary
scho
ol0.
280.
280.
275
0.00
50.
148
0.15
1-0
.003
0.25
0.31
-0.0
6***
Tert
iary
educ
atio
n0.
150.
170
0.13
00.
040*
0.28
60.
268
0.01
80.
170.
130.
04**
*Fa
ther
’ssc
hool
ing
No
scho
olin
g0.
380.
380.
380.
000
0.35
80.
405
-0.0
470.
360.
40-0
.04
Prim
ary
scho
olin
g0.
240.
270
0.20
60.
064*
*0.
224
0.25
2-0
.028
0.25
0.22
0.03
Not
es:T
his
tabl
esh
ows
the
expo
stba
lanc
ein
the
char
acte
rist
ics
ofpa
rtic
ipan
tsin
the
expe
rim
ents
.∗∗∗p<
0.01,∗∗
p<
0.05,∗
p<
0.10
.So
urce
:Aut
hors
’com
puta
tions
.
25

Tabl
e3:
Dec
isio
nsin
expe
rim
enta
ltas
ks
All
JEE
ViK
AN
on-J
EE
ViK
AM
ale
Fem
ale
Diff
eren
ceM
ale
Fem
ale
Diff
eren
ceM
ale
Fem
ale
Diff
eren
ce(1
)(2
)(3
=1–
2)(4
)(5
)(6
=4–
5)(7
)(8
)(9
=7-
8)
Pane
lA.T
rust
task
Am
ount
sent
by10
6.61
96.0
48.
37*
100.
2110
2.71
-2.5
010
8.54
89.3
819
.17*
**A
mou
ntse
ntto
99.3
610
7.84
-8.4
797
.66
110.
66-1
3.01
101.
3910
4.92
-3.5
3A
vera
gepr
opor
tion
retu
rned
by0.
490.
480.
010.
500.
480.
020.
480.
480.
01
Pane
lB.R
isk
task
Prop
ortio
nal
loca
ted
toR
isky
Ass
et0.
710.
600.
10**
*0.
740.
620.
12**
*0.
670.
590.
08**
Not
es:∗∗∗p<
0.01,∗∗
p<
0.05,∗
p<
0.10
.So
urce
:Aut
hors
’com
puta
tions
.
26

Tabl
e4:
JEE
ViK
Aan
dat
titud
es
Pool
edM
ale
Fem
ale
All
JEE
ViK
AN
on-
Diff
.JE
EV
iKA
Non
-D
iff.
JEE
ViK
AN
on-
Diff
.JE
EV
iKA
JEE
ViK
AJE
EV
iKA
(1)
(2)
(3)
(4=
2–3)
(5)
(6)
(7=
5–6)
(8)
(9)
(10=
8–9)
Asp
irat
ions
for
child
ren
Gir
ls’e
duca
tion
Wha
tChi
ldW
ants
0.31
80.
326
0.31
00.
016
0.32
80.
289
0.03
80.
325
0.33
2-0
.007
(0.4
66)
(0.4
69)
(0.4
63)
(0.4
70)
(0.4
54)
(0.4
69)
(0.4
72)
Tert
iary
Edu
catio
n0.
357
0.38
10.
333
0.04
80.
399
0.38
00.
019
0.36
30.
286
0.07
7*(0
.479
)(0
.486
)(0
.472
)(0
.491
)(0
.486
)(0
.482
)(0
.453
)B
oys’
educ
atio
nW
hatC
hild
Wan
ts0.
378
0.39
10.
365
0.02
70.
411
0.33
10.
080*
0.37
10.
399
-0.0
28(0
.485
)(0
.489
)(0
.482
)(0
.493
)(0
.471
)(0
.484
)(0
.491
)Te
rtia
ryE
duca
tion
0.44
90.
467
0.43
10.
036
0.47
00.
479
-0.0
090.
464
0.38
20.
082*
(0.4
98)
(0.4
99)
(0.4
96)
(0.5
00)
(0.5
01)
(0.5
00)
(0.4
87)
Gir
ls’o
ccup
atio
nTr
aditi
onal
Fem
ale
0.36
40.
341
0.38
8-0
.046
0.28
20.
380
-0.0
99**
0.40
10.
395
0.00
6(0
.482
)(0
.475
)(0
.488
)(0
.451
)(0
.486
)(0
.491
)(0
.490
)W
hatC
hild
Wan
ts0.
244
0.25
70.
232
0.02
50.
273
0.17
40.
100*
**0.
241
0.29
1-0
.051
(0.4
30)
(0.4
37)
(0.4
22)
(0.4
46)
(0.3
80)
(0.4
28)
(0.4
55)
Boy
s’oc
cupa
tion
Wha
tChi
ldW
ants
0.32
20.
315
0.32
8-0
.014
0.29
50.
269
0.02
60.
335
0.39
0-0
.055
(0.4
67)
(0.4
65)
(0.4
70)
(0.4
57)
(0.4
44)
(0.4
73)
(0.4
89)
Att
itude
stow
ards
Wom
en
Bar
rier
sex
istf
orw
omen
inle
ader
ship
posi
tions
1.65
81.
677
1.63
80.
039
1.69
71.
698
-0.0
011.
657
1.57
60.
081*
(0.4
75)
(0.4
68)
(0.4
81)
(0.4
60)
(0.4
60)
(0.4
76)
(0.4
95)
Feel
safe
0.81
30.
827
0.79
80.
029
0.88
70.
897
-0.0
100.
768
0.69
70.
070*
(0.3
90)
(0.3
78)
(0.4
02)
(0.3
18)
(0.3
05)
(0.4
23)
(0.4
60)
Wom
enre
spec
ted
mor
e0.
436
0.45
50.
417
0.03
80.
529
0.45
50.
075
0.38
00.
378
0.00
2(0
.496
)(0
.498
)(0
.494
)(0
.500
)(0
.499
)(0
.486
)(0
.486
)V
illag
esw
ithw
omen
inpo
wer
perf
orm
bette
r0.
451
0.48
80.
415
0.07
4**
0.47
10.
384
0.08
6**
0.50
60.
445
0.06
1(0
.498
)(0
.500
)(0
.493
)(0
.500
)(0
.487
)(0
.501
)(0
.498
)In
this
villa
gew
omen
have
too
muc
hpo
litic
al0.
194
0.21
50.
173
0.04
2*0.
193
0.14
90.
045
0.23
70.
197
0.04
0in
fluen
ce(0
.396
)(0
.411
)(0
.379
)(0
.396
)(0
.357
)(0
.426
)(0
.399
)
Not
es:∗∗∗p<
0.01,∗∗
p<
0.05,∗
p<
0.10
.So
urce
:Aut
hors
’com
puta
tions
.
27

Table 5: Regression results on trust
All Gender Revealed Gender Not Revealed(1) (2) (3)
Trustor Female -16.983** -16.953 -14.663(7.532) (10.665) (11.976)
JEEViKA Village -11.233 -17.032 -5.524(8.386) (11.800) (11.740)
Trustor Female × JEEViKA Village 21.970** 33.670** 7.502(10.106) (13.330) (16.554)
Proportion Invested in Risky Asset -3.028 -6.433 2.840(8.915) (13.182) (10.315)
Sample Size 477 251 226
Notes: OLS Regression results presented. Dependent variable is the amount sent by theTrustor (Sender) in the Trust task. Standard errors clustered at the village level in parenthesis.∗∗∗p < 0.01,∗∗ p < 0.05,∗ p < 0.10.Source: Authors’ computations.
28

Table 6: Gender differences in trusted
(1) (2)
JEEViKA village -0.970(6.307)
Trustee Male 2.730 4.657(6.921) (8.996)
Trustee Male × JEEViKA village -3.698(10.200)
Trustee Female 14.756* 12.846(7.677) (9.188)
Trustee Female × JEEViKA village 3.643(12.138)
Proportion Invested in Risky Asset -1.346 -1.518(8.398) (8.314)
Sample Size 477 477
Total EffectMale Trustee in JEEViKA village 0.959
(8.232)Female Trustee in JEEViKA village 16.489*
(10.333)
Notes: OLS Regression results presented. Dependentvariable is the amount sent by the Trustor (Sender) in theTrust task. Standard errors clustered at the village level inparenthesis. ∗∗∗p < 0.01,∗∗ p < 0.05,∗ p < 0.10.Source: Authors’ computations.
29

Table 7: Regression results on trustworthiness
Variables All Gender Revealed Gender Not Revealed(1) (2) (3)
Trustee female -0.007 -0.014 0.017(0.026) (0.036) (0.039)
JEEViKA Village 0.014 -0.010 0.053(0.024) (0.031) (0.039)
Trustee Female × JEEViKA Village -0.008 0.025 -0.060(0.033) (0.045) (0.049)
Sample Size 472 246 226
Notes: OLS Regression results presented. Dependent variable is the average amount sentby the Trustee (Receiver) in the Trust task. Standard errors clustered at the village level inparenthesis. ∗∗∗p < 0.01,∗∗ p < 0.05,∗ p < 0.10.Source: Authors’ computations.
30