wildfires: an application of remote sensing and obia
TRANSCRIPT
Abstract: - To maintain soil stability and integrity, it is important to distinguish between soil covered by thick
vegetation and that made arid and barren by fire, particularly when considering growing climate change. The safeguarding of these territories and the fight against its progressive environmental degradation requires great attention be paid to forest fires, particularly when considering the enormous environmental damage that fires have caused to important and widespread areas of the globe. The purpose of the contribution here is to compare processing techniques of high-resolution remotely sensed data from optical satellites to determine the best method of automatic discrimination of fire areas, thereby allowing the management of burnt areas in the context of subsequent fire risk. These integrated techniques were developed in a Geographic Information System (GIS) to get an accurate perimeter, and in general to analyze and manage data, geographic and otherwise, with spatial and geostatistical queries and analyzes. In a such a way that has an immediate reflection in the capability of immediately preparing acts, such as orders, decrees and other provisions, both for the protection of properties and territories and to lay a basis also for the prosecution and repression of crimes.
Key-Words: - Wildfires; Remote Sensing; Object-Based Image Analysis; Structural Analysis; GIS
Received: January 23, 2021. Revised: April 7, 2021. Accepted: April 9, 2021. Published: April 13, 2021.
1 Introduction In this work, the inclusion of multiresolution segmentation, typical of object-based image analysis (OBIA) in a unified package, is proposed for the detection of burnt areas.
The OBIA structural methodology, as is well known, is different from the classical spectral analysis; while pixel-based analysis enhances ambiguity in the statistical definition of classes of land use as the resolution increases in remotely
sensed images, this problem is reduced with the use of multiresolution segmentation techniques and fuzzy classification. By extensively analyzing objects, it is in fact possible to enrich and improve the information obtained from remotely sensed data, obtaining, among other things, immediate integration into Geographic Information System (GIS).
A decision tree was used in this work, taking into account the indices known in the literature (Normalized Difference Vegetation Index - NDVI,
Wildfires: an Application of Remote Sensing and OBIA
GIULIANA BILOTTA
1*, SALVATORE CALCAGNO2, STEFANO BONFA
3
1NT& ITA Department of Planning, University IUAV of Venice
Santa Croce 191,
Tolentini 30135 Venice, ITALY
2DICEAM – Civil, Energy Environmental and Material Engineering Department
Mediterranea University, Località Feo di Vito,
89124 Reggio Calabria, ITALY
3Grouping (UKEIG) N. GEE000176, 87 Hungerdown E46QJ
London, UNITED KINGDOM
WSEAS TRANSACTIONS on ENVIRONMENT and DEVELOPMENT DOI: 10.37394/232015.2021.17.29
Giuliana Bilotta, Salvatore Calcagno, Stefano Bonfa
E-ISSN: 2224-3496 282 Volume 17, 2021
Normalized Burn Index - NBR, etc.) for improving the results.
The main objective of this project is to draw the boundary of the areas covered by fires through an organic and continuous information process, generated both through the homogenization of the specific databases regarding this topic and through the acquisition of all the necessary data for the preparation and system management through the relevant tools made available by current Geomatics technologies and resources, with a particular focus in remote sensing.
The final aim of the project is therefore to create a complete integrated fire system in which forest fire events are shown in relation to the registration of the maps, the geometric data of the burnt area and the degree of damage, allowing for an estimation of the carbon lost following the passage of the fire.
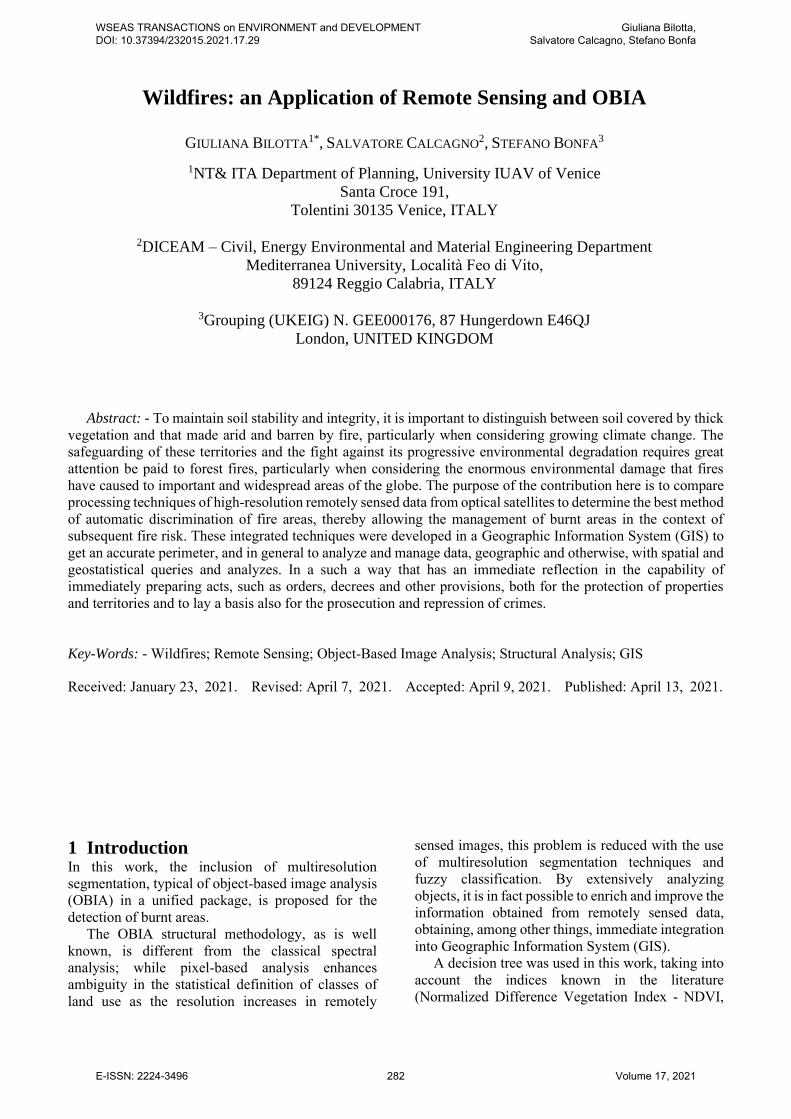
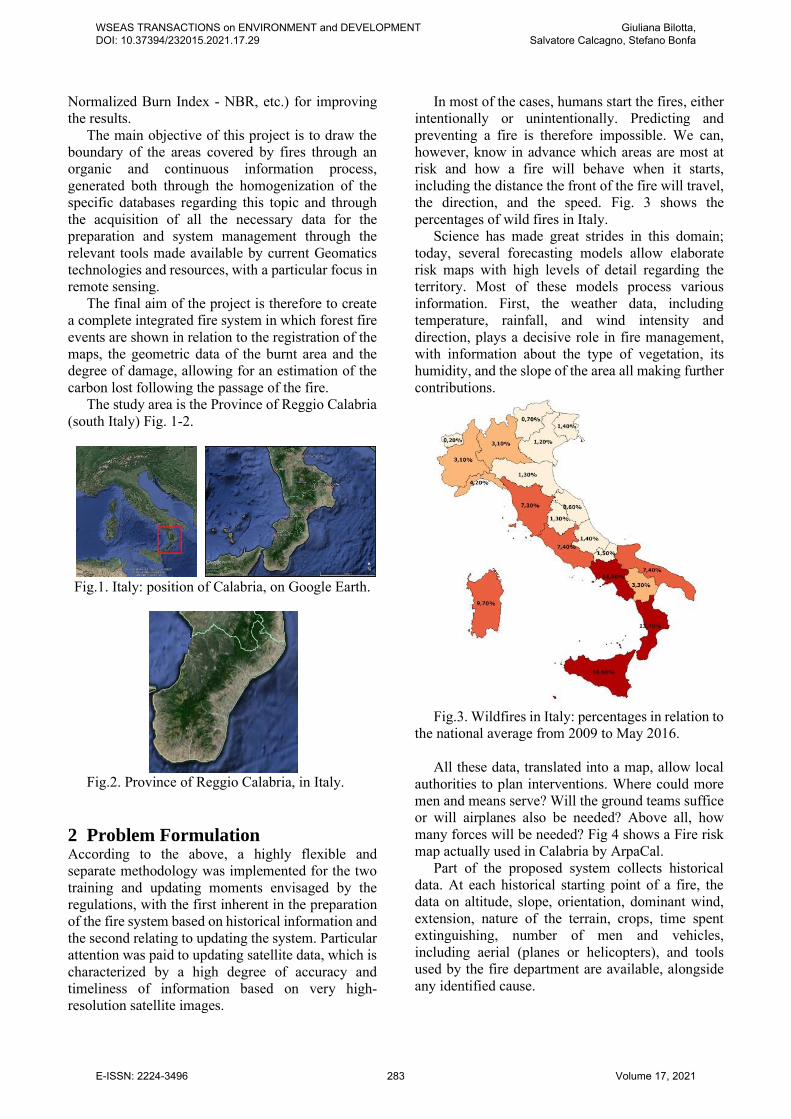
The study area is the Province of Reggio Calabria (south Italy) Fig. 1-2.
Fig.1. Italy: position of Calabria, on Google Earth.
Fig.2. Province of Reggio Calabria, in Italy.
2 Problem Formulation According to the above, a highly flexible and separate methodology was implemented for the two training and updating moments envisaged by the regulations, with the first inherent in the preparation of the fire system based on historical information and the second relating to updating the system. Particular attention was paid to updating satellite data, which is characterized by a high degree of accuracy and timeliness of information based on very high-resolution satellite images.
In most of the cases, humans start the fires, either intentionally or unintentionally. Predicting and preventing a fire is therefore impossible. We can, however, know in advance which areas are most at risk and how a fire will behave when it starts, including the distance the front of the fire will travel, the direction, and the speed. Fig. 3 shows the percentages of wild fires in Italy.
Science has made great strides in this domain; today, several forecasting models allow elaborate risk maps with high levels of detail regarding the territory. Most of these models process various information. First, the weather data, including temperature, rainfall, and wind intensity and direction, plays a decisive role in fire management, with information about the type of vegetation, its humidity, and the slope of the area all making further contributions.
Fig.3. Wildfires in Italy: percentages in relation to
the national average from 2009 to May 2016. All these data, translated into a map, allow local
authorities to plan interventions. Where could more men and means serve? Will the ground teams suffice or will airplanes also be needed? Above all, how many forces will be needed? Fig 4 shows a Fire risk map actually used in Calabria by ArpaCal.
Part of the proposed system collects historical data. At each historical starting point of a fire, the data on altitude, slope, orientation, dominant wind, extension, nature of the terrain, crops, time spent extinguishing, number of men and vehicles, including aerial (planes or helicopters), and tools used by the fire department are available, alongside any identified cause.
WSEAS TRANSACTIONS on ENVIRONMENT and DEVELOPMENT DOI: 10.37394/232015.2021.17.29
Giuliana Bilotta, Salvatore Calcagno, Stefano Bonfa
E-ISSN: 2224-3496 283 Volume 17, 2021

Fig.4. Fire risk map in Calabria, by ArpaCal.
3 Problem Solution The goal was to design and implement a software tool that performs predictive functions of triggering possible forest fires as a result of integration and manipulation of data from different sources and processing by predictive mathematical models to support decisions.
The system to be implemented included a Digital Elevation Model (DEM) as a base and processed weather data, including temperature, orography information, and type of vegetation.
This allowed the obtainment of information in real time on atmospheric, meteorological, environmental, and territorial variations, and the control of fire evolution or development.
To mitigate risk factors, the safety of operators in the field, proactivity in conveying information within the control rooms of crisis operations, must naturally involve firefighters, civil protection, and national authorities.
The functions assigned to the system were the following:
• Risk planning and analysis: Simulation in the geographic areas of fires, evolution of flame fronts, evaluation of means available and
surrounding variations for extinguishing operations;
• Emergency management: Identification of fumes, heat, and direction to coordinate shutdown operations and contain environmental and civil damage, and ease of communication between the parties involved and real-time updates regarding data collection in the field;
• Early Warning: Through the WEB platform and the mobile application, the system must provide alerts to sector operators, reports sent to the system by civilians (including data collected from social networks), and changes in the status of data collected in real time.
Among the most important phases were the design of the logical–conceptual model of the integrated system infrastructure, the homogenization of databases, and the implementation of data entry in order to build the definitive database in PostGIS format. The spatial component (survey geometry) was obtained directly from the databases, in which surveys carried out by the fire brigade are reported. The spatial localization of the areas covered by fire allowed, among other things, an exact correspondence with the cadastre information of the vectorized properties, which were georeferenced and inserted in the Geodatabase.
The third phase included the statistical analysis of data with advanced dynamic creation techniques to self-update analysis reports, such as those relating to the frequency of fires per month, per day, and per hour due to fire ignition and duration, among others. The system was therefore able to also perform spatial statistical analyses in order to improve the analysis of environmental–territorial variables, investigating the spatial relationships between the environmental factors (essentially morphology, vegetation, and land use) and the occurrence of the forest fire. The frequency of fires by class of slope, altimetric class, exposure of the slope, forest category, category of land use, distance from roads and inhabited centers or nuclei, among others, were all also analyzed to constitute a knowledge base for the creation of a fire-risk card. In addition to providing print reports on static (alphanumeric and spatial) analyses, the system was able to manage the printing of the particles affected by fire with related documentation considered to be useful for official publication by local authorities. Establishment of the basic infrastructure of the system with the starting data system and the management and storage infrastructure followed the cadastre updates, and was therefore a part of the complex system proposed.
WSEAS TRANSACTIONS on ENVIRONMENT and DEVELOPMENT DOI: 10.37394/232015.2021.17.29
Giuliana Bilotta, Salvatore Calcagno, Stefano Bonfa
E-ISSN: 2224-3496 284 Volume 17, 2021

The updating of the fire register consisted of detecting the areas covered by fire as events occur or at any point considered to useful to exactly identify the boundary of the territorial portion covered by the fire [1-4]. Fig.5 shows the flow chart of the whole remote sensing update process.
Fig.5 Remote sensing update flow chart.
Various possible intervention processes exist for the system update phase. These differ according to different data acquisition methods, but the hypothesis of updating the system through the acquisition and classification of satellite images is, as mentioned above, the desired solution, as it is characterized by a high degree of accuracy and timeliness of information and is also capable of achieving a better cost/benefit ratio. With the same information equipment, i.e., very-high-resolution satellite images, it is possible also to carry out further studies useful for the monitoring and updating of sector information, such as land use [5-8], illegal landfills [9], asbestos coverage [10], riverbeds, map updates, and environmental pollution. Other important aspects include assessing damage to vegetation and estimating CO2 emissions due to forest fires.
About the accuracy, in this case the accuracy referred to the spatial resolution.
, Landsat 7 has the ETM+ (Enhanced Thematic Mapper Plus) instrument that acquires in a panchromatic band with 15 m of spatial resolution and seven multispectral bands (the sixth being a thermal band).
The IKONOS satellite has a high-resolution sensor. Its capabilities include the capture of multispectral images (Blue, Green and Red, Near IR bands) of 3.2m resolution and a Panchromatic band of 0.82m resolution.
The planned calculations were on the basis of the analysis of satellite imagery of different origins and natures (Landsat, Ikonos), while completing processing adapted to the identification of areas already affected by fires. A multitemporal analysis was carried out for this purpose using the multispectral sensor Enhanced Thematic Mapper (ETM+) of the Landsat 7 satellite, which can analyze very high-resolution images of the Ikonos satellite with the use of statistical techniques based on the Normalized Difference Vegetation Index (NDVI), on the Normalized Burn Ratio (NBR) and the Burned Area Index (BAI). We also planned innovative techniques based on multiresolution segmentation and on the creation of hierarchies of classes related to each other in order to achieve adequate classification of the territory to correctly identify any areas reached by fires.
The choice of the type of high-resolution satellite data was made according to a series of considerations:
• The size of the area to be analyzed; the scope of analysis, in general, is a territory which is mostly not densely urbanized;
• The analysis allowed by Landsat datasets, although valuable for the availability of near, medium, and thermal infrared bands, proved insufficient both for the pixel dimensions and for the unavailability of reliable data following malfunctions of the Landsat 7, therefore, referring to very high-resolution data, such as those of the Ikonos satellite, was considered to be appropriate.
A methodology using Landsat data combined with Ikonos data with very high spatial resolution was therefore implemented. The choice of both data was determined according to different reasons, especially the main objective of accurately conducting an investigation on a space of considerable size while limiting the cost. Landsat data were provided at a relatively low cost compared to its vast utility. For our case this was useful, since the object of analysis were to be subjected to a classification procedure based on decision criteria (vegetation indices) working in the near and medium
Daily forest fire
data by the Fire
Department
Data
entry
info
Fire detection
and satellite
scene request
processing
Choice of
test areas
for GPS
survey
Classificatio
n and
extraction of
burnt areas
Vectorization,
alphanumeric
data entry
Data
entry
cadastral
info
System
data
extractio
n
Comparison
GPS surveys
with Fire Dept.
data
Daily, monthly and yearly reports.
Updated Fire Register
WSEAS TRANSACTIONS on ENVIRONMENT and DEVELOPMENT DOI: 10.37394/232015.2021.17.29
Giuliana Bilotta, Salvatore Calcagno, Stefano Bonfa
E-ISSN: 2224-3496 285 Volume 17, 2021

infrared bands, and Landsat data are rare in that they have a certain variety of bands. However, there is an obligation to combine these data with the Ikonos data, which have very high spatial resolution.
Their merger resulted in data that maintained the large number of Landsat spectral bands for the indices characterizing the subsequent classification procedure, but at the same time presented more accurate detail due to the new spatial resolution inherited from the Ikonos data. By overlapping with a digital elevation model (DEM) relating to the area of interest, which was necessary to ensure adequate corrections regarding the topography of the data, it was also possible to define the slope and slope characteristics necessary to identify the areas covered by fire. The data thus obtained were subjected to a semiautomatic classification procedure developed within the ENVI software. Therefore, the complete analysis followed the following steps:
• Image acquisition; • Classification aimed at highlighting areas
covered by fires; • Elaboration and synthesis through vegetation
indices (NBR and Burned Area Index (BAI)). The analysis conducted revolved around the
processing of classified images using the vegetation indexes NBR and BAI. These indices represented the decision criteria regarding image differentiation.
The NBR was sensitive to vegetation damage caused by fire, while the BAI detected the deposition of combustion remains after fire.
The two indices were calculated in accordance with the following formulas:
( )
( )
NIR SWIRNBR
NIR SWIR
−=
+ (1)
where NIR stands for near-infrared band and SWIR stands for short-wavelength infrared band,
( ) ( )2 21
BAIREDrif REDind NIRrif NIRind
=− + −
(2) (1)
where RED represents red band and NIR stands for near-infrared band.
3.1 Pixel-based image analysis The energy produced by the sun is reflected by objects on Earth in different ways depending on the material they are made of. This energy is “captured” by the sensors of optical satellites and used for the preparation of land cover/land use maps or for representing phenomena occurring on the Earth's surface. To this purpose, pixel-based image analysis is a well-established technique that has been used for
several years for satellite images classification. It can use different classification algorithms, such as maximum likelihood, minimum distance, neural networks. In any case, this is a purely statistical technique that does not use geometric, context or topological information. Some pixel-based classifications on Ikonos image are shown below in Figs. 6, 7, 8. In Fig.9 the confusion matrix.
Fig.6. Ikonos classification: minimum distance.
Fig.7. Ikonos classification: maximum likelihood.
WSEAS TRANSACTIONS on ENVIRONMENT and DEVELOPMENT DOI: 10.37394/232015.2021.17.29
Giuliana Bilotta, Salvatore Calcagno, Stefano Bonfa
E-ISSN: 2224-3496 286 Volume 17, 2021

Fig.8. Ikonos classification: maximum likelihood (with legenda).
Fig.9. Ikonos classification: confusion matrix.
3.2 Object-based image analysis The pixel-based satellite data analysis as main limitation has the recognition of low-level semantic information, as the quantity of energy released by the pixel, and the context does not take any role. In object-based analysis the semantic level raises: rules of relationship in space, topological and statistical information are added and thus the context is determined. The detection bases on Mathematical Morphology concepts application to the image analysis and on Fuzzy Logic principles for classifying. In the presented example, we used eCognition software by Definiens Imaging GmbH, which performs a whole scene segmentation on multiple levels. In addition, we used pixel-based software (ENVI) to compare the classification.
The multiresolution segmentation achieves automatically the generation of vector polygons, extracted directly from the image with a complete
coincidence in the overlap on the raster, and finally obtains the classification by preparing a suitable class hierarchy that take into account the relationships between the segmentation levels produced.
The OBIA [11] tool we used arranges and organizes hierarchically data of different types (vector and raster). Contextual and inter-object relationship rules can be established to significantly increase the automatic recognition of the objects on the Earth's surface. This photo-interpretation approach realizes a highly objective classification, allowing a homogeneous and reproducible process, thus overcoming the issues of traditional pixel-based classification techniques.
The choiced scale factor allows to calibrate the dimension of the polygons obtained from the segmentation, and its determination is related to the scale of the reference map.
Segmentation is defined as multiresolution because, starting from the same image, it is possible to obtain a hierarchy of polygon levels with several scale factors. By decreasing the scaling factor, the dimensions of the generated polygons progressively decrease; smaller dimensions show spectral variability inside the polygons while enhancing the scaling factor. The peculiarity of multiresolution segmentation involves the interconnection between the polygons of the hierarchical segmentation levels.
When creating the first layer of polygons, you can create n new higher hierarchical levels when the scaling factor is greater (larger polygons) or n lower levels when the scaling factor is lower (smaller polygons). All polygons of lower hierarchical levels are geometrically consistent to those of higher hierarchical levels; therefore, each lower polygon belongs only to one higher polygon. All polygons of different segmentation levels constitute a single database, where all connections between polygons in the same or different hierarchical levels are present.
Therefore, for each polygon, the polygons it is in contact with, on the same hierarchical level, the polygons which form a possible lower hierarchical level, and the polygon in which the possible higher hierarchical level is contained are all known.
Therefore, for each polygon, the polygons with which it is in contact are known, on the same hierarchy level, the polygons that form a possible lower hierarchy level, as well as the polygon in which the possible higher hierarchical level is contained.
Characteristic of the object-based approach is a circular interaction between processing and classifying image objects. Based on segmentation, shape, and scale of image objects, specific information is available for classification. Classification, which incorporates contextual and
WSEAS TRANSACTIONS on ENVIRONMENT and DEVELOPMENT DOI: 10.37394/232015.2021.17.29
Giuliana Bilotta, Salvatore Calcagno, Stefano Bonfa
E-ISSN: 2224-3496 287 Volume 17, 2021

semantic information that uses the attributes of image objects and the relationship between linked image objects, leads to an operational classification model.
In many applications, the desired geoinformation and the objects of interest are extracted in a step-by-step fashion through iterative cycles of classification and processing. Therefore, image objects are processing units that can continuously change in terms of shape, classification, and mutual relationships. Similar to human processes of understanding images, this type of circular processing translates into a sequence of intermediate states, with growing classification differentiation and a growing abstraction of the original image information.
The main limitation of satellite data pixel-based analysis is the recognition of low-level semantic information, i.e., the quantity of energy emanating from a single pixel, with context playing no role. In object-based analysis, instead, the semantic level increases; relation rules are added that combine spatial, topological, and statistical information, thus defining the context. Recognition is built on Mathematical Morphology concepts [12-16], applied to imagery analysis and, for classification, Fuzzy logic elements.
The first phase involves segmenting the whole scene into further levels. The multiresolution segmentation automatically creates vectorial polygons, which are extracted directly from the image in perfect coincidence with the overlay on the raster. Then, the classification prepares an appropriate hierarchy of classes considering the relationships between the obtained segmentation levels.
3.3 Segmentation Segmentation is a technique for merging regions from the bottom up, starting with single pixel objects. It operates on different resolutions, so it is multiresolution. In the following steps, the smaller objects in the image are joined together into larger objects.
During this grouping process, the following optimization procedure will downplay nh that is the weighted inhomogeneity of the resultant image objects; while n is the segment dimension, h is an arbitrary heterogeneity determination. For every step, neighboring image objects are joined to embody the lowest growth in the defined inhomogeneity. When the increase surpasses the threshold set by the scaling parameter, the whole process stops. The color or spectral inhomogeneity in every level matches the sum of the standard deviations of the spectral values, where minimization exclusively of the spectral
heterogeneity yields to image objects with fractal shaped edges or branching segments.
In highly structured radar data, this problem is even greater. Segmentation algorithm, from each pixel in an image, fuses adjacent polygons until the heterogeneity change observable between the initial (two) polygons and the newly generated polygon exceeds a customer-defined threshold (scaling factor).
When the change in heterogeneity does not already overcome the defined threshold, the merging is effectively accomplished; elsewhere, the two polygons do not merge but remain separate, and the choice of scaling factor calibrates the size of the resulting polygons.
In segmentation process, the pixels of the image are gradually aggregated in a series of steps until the resulting polygons have the characteristics desired by the user. The process leads to the minimization of the spectral heterogeneity of each polygon derived from the digital number values of the included pixels and on the basis of the geometric heterogeneity depending on the shape of the polygons created. The spectral heterogeneity of each polygon generated by the segmentation process is obtained as the weighted sum of the standard deviations of the digital number values of each spectral band obtained for each of the pixels included in the polygon.
If the segmentation process tended only to minimize spectral heterogeneity, it would result the generation of overly fragmented polygons, with a very high fractal dimension. And this would occur the higher the geometric resolution of the image. To prevent this from happening, the polygons obtained must also minimize the value of geometric heterogeneity, defined by two form factors: the fractal factor and the compactness factor. The fractal factor depends on the complexity of the polygon's perimeter relative to its extent. The compactness factor depends on the dimensional ratio of the polygon axes.
The segmentation algorithm combines adjacent polygons from each pixel in the image until the change in observable heterogeneity between the two primitive polygons and the new polygon obtained exceeds a user-assigned threshold (scale factor). If the melting threshold is not exceeded, the polygons remain distinct. A Flow chart is reported in fig. 10
WSEAS TRANSACTIONS on ENVIRONMENT and DEVELOPMENT DOI: 10.37394/232015.2021.17.29
Giuliana Bilotta, Salvatore Calcagno, Stefano Bonfa
E-ISSN: 2224-3496 288 Volume 17, 2021
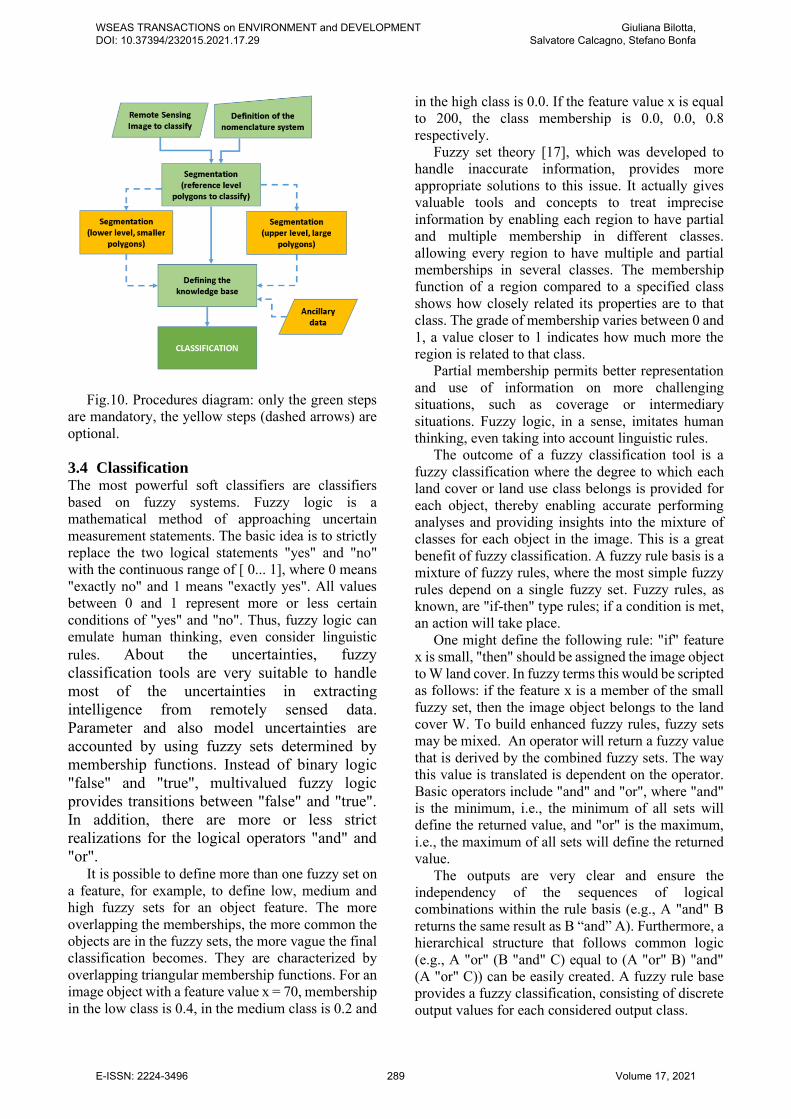
Fig.10. Procedures diagram: only the green steps are mandatory, the yellow steps (dashed arrows) are optional.
3.4 Classification The most powerful soft classifiers are classifiers based on fuzzy systems. Fuzzy logic is a mathematical method of approaching uncertain measurement statements. The basic idea is to strictly replace the two logical statements "yes" and "no" with the continuous range of [ 0... 1], where 0 means "exactly no" and 1 means "exactly yes". All values between 0 and 1 represent more or less certain conditions of "yes" and "no". Thus, fuzzy logic can emulate human thinking, even consider linguistic rules. About the uncertainties, fuzzy classification tools are very suitable to handle most of the uncertainties in extracting intelligence from remotely sensed data. Parameter and also model uncertainties are accounted by using fuzzy sets determined by membership functions. Instead of binary logic "false" and "true", multivalued fuzzy logic provides transitions between "false" and "true". In addition, there are more or less strict realizations for the logical operators "and" and "or".
It is possible to define more than one fuzzy set on a feature, for example, to define low, medium and high fuzzy sets for an object feature. The more overlapping the memberships, the more common the objects are in the fuzzy sets, the more vague the final classification becomes. They are characterized by overlapping triangular membership functions. For an image object with a feature value x = 70, membership in the low class is 0.4, in the medium class is 0.2 and
in the high class is 0.0. If the feature value x is equal to 200, the class membership is 0.0, 0.0, 0.8 respectively.
Fuzzy set theory [17], which was developed to handle inaccurate information, provides more appropriate solutions to this issue. It actually gives valuable tools and concepts to treat imprecise information by enabling each region to have partial and multiple membership in different classes. allowing every region to have multiple and partial memberships in several classes. The membership function of a region compared to a specified class shows how closely related its properties are to that class. The grade of membership varies between 0 and 1, a value closer to 1 indicates how much more the region is related to that class.
Partial membership permits better representation and use of information on more challenging situations, such as coverage or intermediary situations. Fuzzy logic, in a sense, imitates human thinking, even taking into account linguistic rules.
The outcome of a fuzzy classification tool is a fuzzy classification where the degree to which each land cover or land use class belongs is provided for each object, thereby enabling accurate performing analyses and providing insights into the mixture of classes for each object in the image. This is a great benefit of fuzzy classification. A fuzzy rule basis is a mixture of fuzzy rules, where the most simple fuzzy rules depend on a single fuzzy set. Fuzzy rules, as known, are "if-then" type rules; if a condition is met, an action will take place.
One might define the following rule: "if" feature x is small, "then" should be assigned the image object to W land cover. In fuzzy terms this would be scripted as follows: if the feature x is a member of the small fuzzy set, then the image object belongs to the land cover W. To build enhanced fuzzy rules, fuzzy sets may be mixed. An operator will return a fuzzy value that is derived by the combined fuzzy sets. The way this value is translated is dependent on the operator. Basic operators include "and" and "or", where "and" is the minimum, i.e., the minimum of all sets will define the returned value, and "or" is the maximum, i.e., the maximum of all sets will define the returned value.
The outputs are very clear and ensure the independency of the sequences of logical combinations within the rule basis (e.g., A "and" B returns the same result as B “and” A). Furthermore, a hierarchical structure that follows common logic (e.g., A "or" (B "and" C) equal to (A "or" B) "and" (A "or" C)) can be easily created. A fuzzy rule base provides a fuzzy classification, consisting of discrete output values for each considered output class.
WSEAS TRANSACTIONS on ENVIRONMENT and DEVELOPMENT DOI: 10.37394/232015.2021.17.29
Giuliana Bilotta, Salvatore Calcagno, Stefano Bonfa
E-ISSN: 2224-3496 289 Volume 17, 2021
These values are the degree of class assignments. Fuzzy classification provides the chance for an object to be part of a class, while probability-based classification provides the likelihood of belonging to a class. The greater the output value for the class, the more feasible, the more reliable the association. The lowest membership value that an object must have to be assigned to a class can be determined. Fuzzy classification [18], with its improved analysis of class mixture classification efficiency, classification robustness and stability, is possible since it is a potent approach to fuzzy classification.
The results of fuzzy classification are important inputs for information merging in current and future remote sensing applications with multi-data sources. The confidence of the class assignments for every sensor can be used in order to find the most feasible and likely class assignment. A workaround is possible, although conflicting class assignments exist based on data from different sensors.
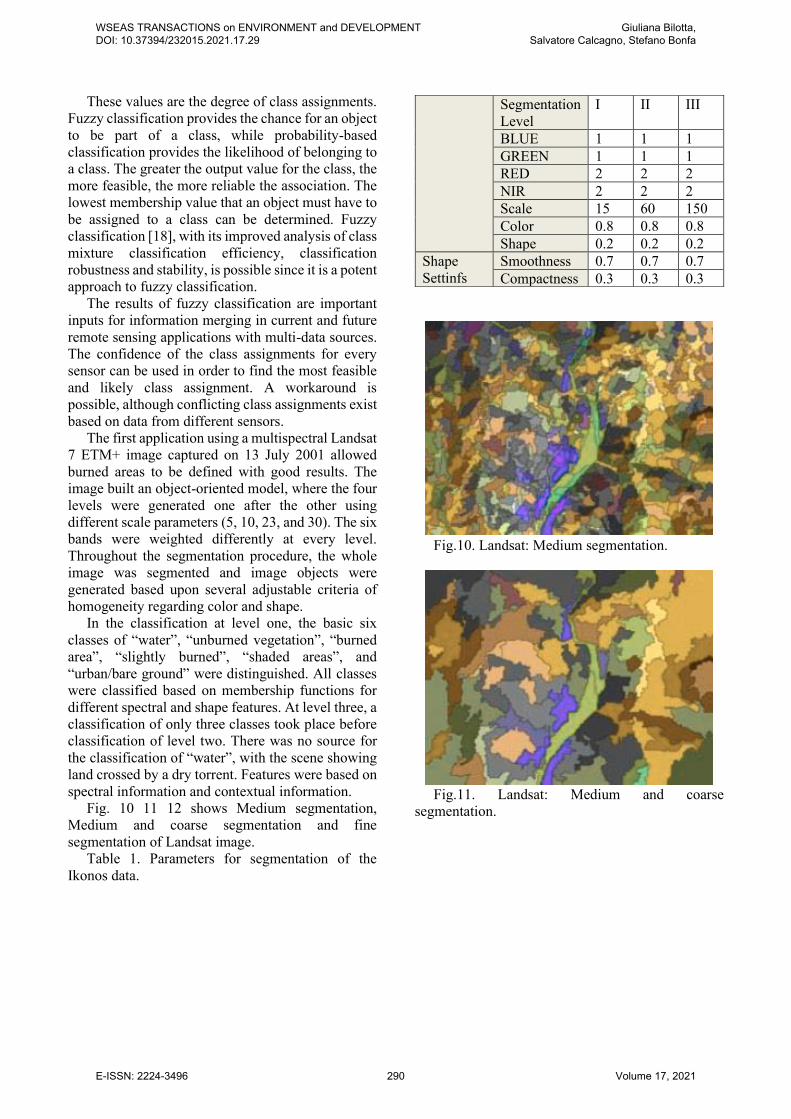
The first application using a multispectral Landsat 7 ETM+ image captured on 13 July 2001 allowed burned areas to be defined with good results. The image built an object-oriented model, where the four levels were generated one after the other using different scale parameters (5, 10, 23, and 30). The six bands were weighted differently at every level. Throughout the segmentation procedure, the whole image was segmented and image objects were generated based upon several adjustable criteria of homogeneity regarding color and shape.
In the classification at level one, the basic six classes of “water”, “unburned vegetation”, “burned area”, “slightly burned”, “shaded areas”, and “urban/bare ground” were distinguished. All classes were classified based on membership functions for different spectral and shape features. At level three, a classification of only three classes took place before classification of level two. There was no source for the classification of “water”, with the scene showing land crossed by a dry torrent. Features were based on spectral information and contextual information.
Fig. 10 11 12 shows Medium segmentation, Medium and coarse segmentation and fine segmentation of Landsat image.
Table 1. Parameters for segmentation of the Ikonos data.
Fig.10. Landsat: Medium segmentation.
Fig.11. Landsat: Medium and coarse
segmentation.
Segmentation Level
I II III
BLUE 1 1 1 GREEN 1 1 1 RED 2 2 2 NIR 2 2 2 Scale 15 60 150 Color 0.8 0.8 0.8 Shape 0.2 0.2 0.2
Shape Settinfs
Smoothness 0.7 0.7 0.7 Compactness 0.3 0.3 0.3
WSEAS TRANSACTIONS on ENVIRONMENT and DEVELOPMENT DOI: 10.37394/232015.2021.17.29
Giuliana Bilotta, Salvatore Calcagno, Stefano Bonfa
E-ISSN: 2224-3496 290 Volume 17, 2021

Fig.12. Landsat: Fine segmentation. Fig.13 and fig 14 show a landasat level 3
classification respectively with two classes and 5 classes.
Fig.13. Landsat level 3 classification.
Fig.14 Classification of Landsat data in a highly
compromised area; third level. Segmentation parameters were determined
empirically in order to produce highly homogeneous objects in specific resolutions and for specific purposes. Segmentations were generated by adjusting the parameters of scale, band weights, color, and shape. As the burned areas appeared to be more visible in bands 3 and 4 than in bands 1 and 2, a “1” was assigned to bands 1 and 2. The sum of all chosen weights for the image layers was normalized to 1. Segmentations were based on higher color weights (80%) and lower shape weights (20%). The scale parameter determined the maximum allowed heterogeneity for the resulting image objects. In fig 15 is shown the chosen parameters for segmentation.
Fig.15. Ikonos, level 1: Parameters for
segmentation. Fig. 16 17 18 19 shows the three level of
segmentation of Ikonos images and a example of classification with 4 classes.
WSEAS TRANSACTIONS on ENVIRONMENT and DEVELOPMENT DOI: 10.37394/232015.2021.17.29
Giuliana Bilotta, Salvatore Calcagno, Stefano Bonfa
E-ISSN: 2224-3496 291 Volume 17, 2021
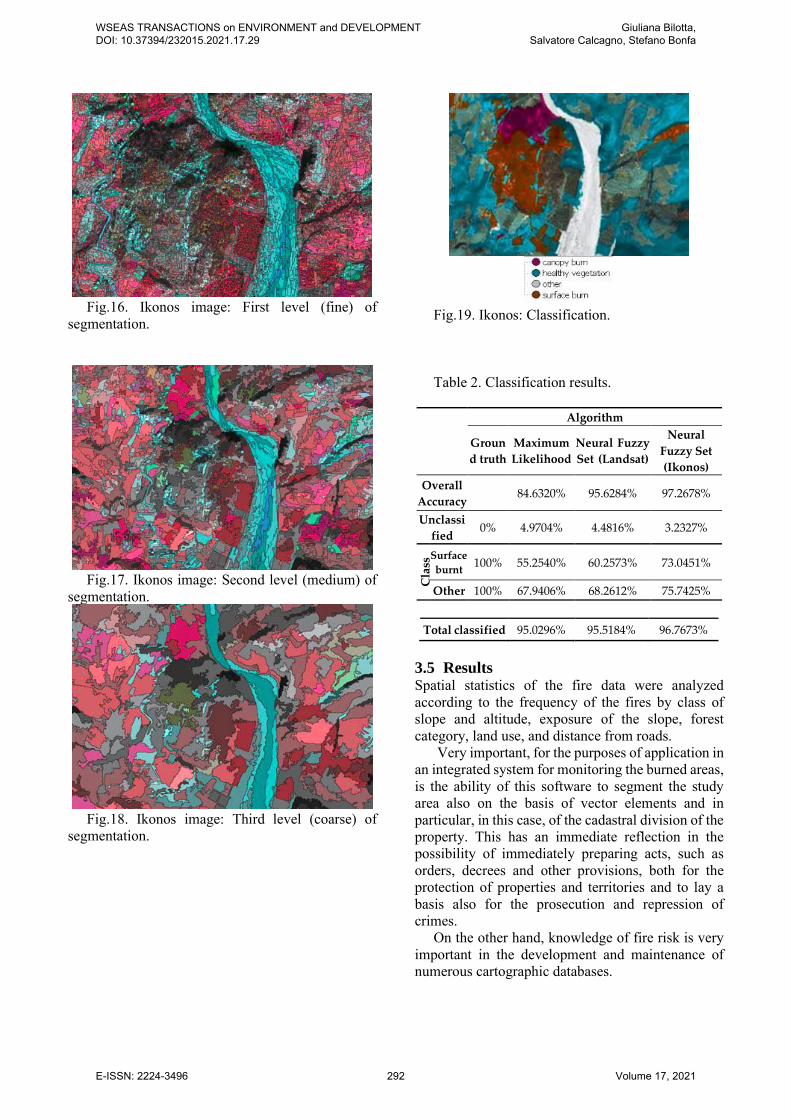
Fig.16. Ikonos image: First level (fine) of segmentation.
Fig.17. Ikonos image: Second level (medium) of segmentation.
Fig.18. Ikonos image: Third level (coarse) of segmentation.
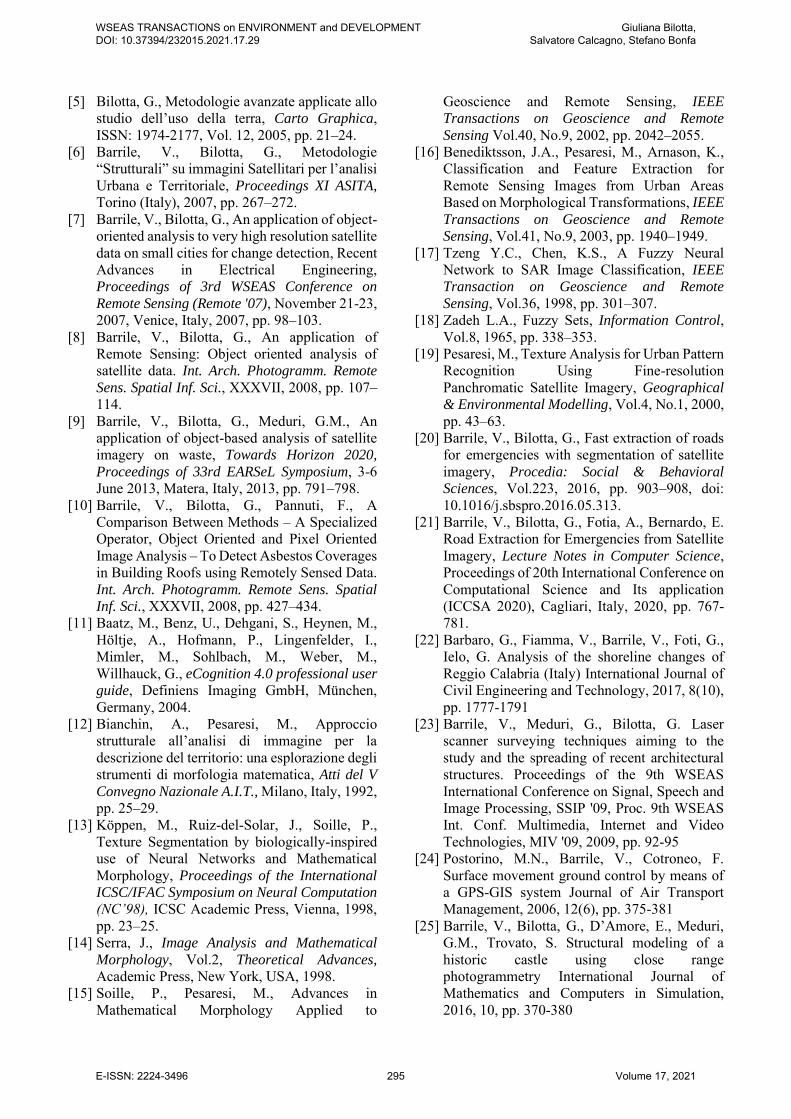
Fig.19. Ikonos: Classification. Table 2. Classification results.
Algorithm
Groun
d truth
Maximum
Likelihood
Neural Fuzzy
Set (Landsat)
Neural
Fuzzy Set
(Ikonos)
Overall
Accuracy 84.6320% 95.6284% 97.2678%
Unclassi
fied 0% 4.9704% 4.4816% 3.2327%
Cla
ss Surface
burnt 100% 55.2540% 60.2573% 73.0451%
Other 100% 67.9406% 68.2612% 75.7425%
Total classified 95.0296% 95.5184% 96.7673%
3.5 Results Spatial statistics of the fire data were analyzed according to the frequency of the fires by class of slope and altitude, exposure of the slope, forest category, land use, and distance from roads.
Very important, for the purposes of application in an integrated system for monitoring the burned areas, is the ability of this software to segment the study area also on the basis of vector elements and in particular, in this case, of the cadastral division of the property. This has an immediate reflection in the possibility of immediately preparing acts, such as orders, decrees and other provisions, both for the protection of properties and territories and to lay a basis also for the prosecution and repression of crimes.
On the other hand, knowledge of fire risk is very important in the development and maintenance of numerous cartographic databases.
WSEAS TRANSACTIONS on ENVIRONMENT and DEVELOPMENT DOI: 10.37394/232015.2021.17.29
Giuliana Bilotta, Salvatore Calcagno, Stefano Bonfa
E-ISSN: 2224-3496 292 Volume 17, 2021

About the comparison between processing techniques of high-resolution remote sensing data we would compare the advantages of each technique.
In pixel-based analysis, fine-scale patches are often inaccurate and not good for landscape metrics. This approach allows the image to be classified into homogeneous "groups" of pixels using statistical techniques.
OBIA segments image first and then classifies the objects.
Advantages: • Good for high spatial resolution data • Representing hierarchical scaling of real-
world multi-scale ecosystems The second step of the process is the actual
classification. All algorithms developed for pixel-based approaches can also be applied to polygons generated by segmentation.
We use objects • because they are most user-meaningful • because they are statically driven • they are directly usable in GIS The classification is based not only on the spectral
characteristics of the image, but also on shape, texture, context and relationships with other objects.
The object-based classification enhances the high information content of the geometric component of the remote sensing images. For this reason, they are of increasing usefulness as the geometric resolution increases.
Advantage of pixel-based analysis: • Objective (the rules are applied te the whole
image) • Spectral information is extracted from
features intrinsic of single pixel Disadvantage of pixel-based analysis: • The context hasn’t any role • Pixel-based semantic information inability to
include or ignore features intelligently • Vector polygons from the classification often
do not coincide with the image Advantage of object-based analysis: • Objective (the rules and chosen parameters
are subjective but the rules are applied to the whole image objectively)
• Multi-scale representation • Hierarchical connection between multiscales • Use of shape, context. Neighborhood
relationships • Transferable rules: boundaries reproduced
automatically across different data sets Disadvantage of object-based analysis: • ldentification of image objects, not real
objects
• lnability to include or ignore features intelligently
• Fusion of real objects due to spectral Finally, with the help of GIS (Figs.20 and 21), a
fire-risk assessment methodology based on the environmental and anthropic characteristics of the municipal area was developed and applied, according to the phases described below:
• Identification of significant environmental and anthropic factors for the purposes of fire risk through bibliographic analysis and evaluation of previous fires;
• Aggregation of factors according to a logical knowledge-processing scheme;
• Application of the evaluation model. Determining the risk of forest fires presupposes knowledge of the conditions of the fuel, i.e., vegetation and plant residues, linked to: • Climatic conditions (atmospheric
precipitation, wind speed and duration, solar radiation, relative humidity, and air temperature);
• Stationary features (slope, exposure, position, rockiness;,
• Vegetable fuel conditions (species present, age, form of maintenance and treatment, structure and coverage, vegetative stage, phytosanitary status, quantity. and degree of decomposition of the ground vegetation).
Fig.20. Management of the classification in GIS.
Fig.21. Overlapping all layers in GIS.
WSEAS TRANSACTIONS on ENVIRONMENT and DEVELOPMENT DOI: 10.37394/232015.2021.17.29
Giuliana Bilotta, Salvatore Calcagno, Stefano Bonfa
E-ISSN: 2224-3496 293 Volume 17, 2021

Characteristics of the evaluation model include
the following: • Versatility and adaptability; • Forecasting capacity; • Simplicity of the structure of the analyzed
database; • Structural simplicity (knowledge trees); • Logical and conceptual rigor. The following information must be inserted in
support of prevention and, at least in part, fire-extinguishing activities:
Distribution of forest fire volunteer teams together with the information contained in the files provided by the fire department;
• Location of water points; • Location of local commands of the fire
department; • Main road networks; • Networks of medium voltage power lines. Of course, for the purposes of risk prevention, the
following must also be implemented: Infrastructural interventions: • Creation of new tracks; • Creation of fire avenues; • Restoration and maintenance of existing
slopes; • Restoration of fire avenues; • Provision of artificial points for the collection
of water. Crop interventions: • Cutting grass; • Collecting woodworking residues; • Dry pruning; • Thinning; • Renaturalization of formations by eliminating
allochthones species with high flammability. Sociocultural interventions: • Information and public awareness campaigns; • Prevention and information campaigns
through schools; • Risk information campaigns with
agroforestry operators.
4 Conclusion With techniques taking into account the NBR and BAI vegetation indices used in the context of object-based classification, structural methodology [19] could be the basis of an integrated system for to create and update the register of areas covered by fire and to monitor territories. This considers the aspect of the fight against forest fires by rapidly populating the GIS with territorial data and allowing for the
direct realization of vector maps. Integrating decision criteria for the discrimination of particular characteristics of burned areas would complete this system, thereby allowing further integration of with additional monitored data to allow real-time analysis of fire risk throughout territories and increase potential to fight forest fires.
OBIA proved useful in extracting satellite images of road networks remaining accessible after emergencies [20,21,22,23]. In recent years, in regard to the use of remote sensing in the fight against forest fires, growing interest has surrounded the combined use of different sensors, optical and radar data, LIDAR data, and passive optical images [24-30], including those obtained with the use of Unmanned Aerial Vehicles (UAV), which are able can closely monitor places with difficult or dangerous access. In recent years, dedicated fire sensors were developed. The use of LIDAR or satellite LIDAR system is better than other systems because it allows to exceed the resolution limit of the satellites: it is unsurpassed in speed and accuracy in mapping morphologies [31-35], so we are confident that the application of LIDAR in this field will improve the results[36-40]. Currently, the use of LIDAR in postfire regeneration is still mainly on a local scale, but future satellite LIDAR systems may help to improve the great problem of postfire hazard assessments.
References:
[1] ITALSCAR, Burned Forest Mapping from Space - An Earth Observation service demonstration project in Italy - funded by the Data User Programme of the European Space Agency requested by the Italian Civil Protection Authorities, Rome, Italy, 2003.
[2] Chirici, G., Corona, P., Travaglini, D., Sperimentazione di tecniche di classificazione object-oriented di immagini QuickBird a fini forestali, L’Italia Forestale e Montana, 4, Proceedings of Workshop “Utilizzo di dati telerilevati per le statistiche di copertura del suolo negli ambienti forestali”, Florence, Italy, 2003.
[3] Marzano, R., Bovio, G., Analisi dell'interfaccia urbano-foresta mediante dati telerilevati per la caratterizzazione del rischio di incendio boschivo, Atti della 8a Conferenza Nazionale
ASITA, Rome, Italy, Vol.2, 2004, pp. 1413–1418.
[4] Mitri, G.H., Gitas, I.Z., Fire type mapping using object-based classification of Ikonos imagery. International Journal of Wildland Fire, Vol.15, 2006, pp. 457–462.
WSEAS TRANSACTIONS on ENVIRONMENT and DEVELOPMENT DOI: 10.37394/232015.2021.17.29
Giuliana Bilotta, Salvatore Calcagno, Stefano Bonfa
E-ISSN: 2224-3496 294 Volume 17, 2021
[5] Bilotta, G., Metodologie avanzate applicate allo studio dell’uso della terra, Carto Graphica, ISSN: 1974-2177, Vol. 12, 2005, pp. 21–24.
[6] Barrile, V., Bilotta, G., Metodologie “Strutturali” su immagini Satellitari per l’analisi Urbana e Territoriale, Proceedings XI ASITA,
Torino (Italy), 2007, pp. 267–272. [7] Barrile, V., Bilotta, G., An application of object-
oriented analysis to very high resolution satellite data on small cities for change detection, Recent Advances in Electrical Engineering, Proceedings of 3rd WSEAS Conference on
Remote Sensing (Remote '07), November 21-23, 2007, Venice, Italy, 2007, pp. 98–103.
[8] Barrile, V., Bilotta, G., An application of Remote Sensing: Object oriented analysis of satellite data. Int. Arch. Photogramm. Remote
Sens. Spatial Inf. Sci., XXXVII, 2008, pp. 107–114.
[9] Barrile, V., Bilotta, G., Meduri, G.M., An application of object-based analysis of satellite imagery on waste, Towards Horizon 2020,
Proceedings of 33rd EARSeL Symposium, 3-6 June 2013, Matera, Italy, 2013, pp. 791–798.
[10] Barrile, V., Bilotta, G., Pannuti, F., A Comparison Between Methods – A Specialized Operator, Object Oriented and Pixel Oriented Image Analysis – To Detect Asbestos Coverages in Building Roofs using Remotely Sensed Data. Int. Arch. Photogramm. Remote Sens. Spatial
Inf. Sci., XXXVII, 2008, pp. 427–434. [11] Baatz, M., Benz, U., Dehgani, S., Heynen, M.,
Höltje, A., Hofmann, P., Lingenfelder, I., Mimler, M., Sohlbach, M., Weber, M., Willhauck, G., eCognition 4.0 professional user
guide, Definiens Imaging GmbH, München, Germany, 2004.
[12] Bianchin, A., Pesaresi, M., Approccio strutturale all’analisi di immagine per la descrizione del territorio: una esplorazione degli strumenti di morfologia matematica, Atti del V
Convegno Nazionale A.I.T., Milano, Italy, 1992, pp. 25–29.
[13] Köppen, M., Ruiz-del-Solar, J., Soille, P., Texture Segmentation by biologically-inspired use of Neural Networks and Mathematical Morphology, Proceedings of the International
ICSC/IFAC Symposium on Neural Computation
(NC’98), ICSC Academic Press, Vienna, 1998, pp. 23–25.
[14] Serra, J., Image Analysis and Mathematical
Morphology, Vol.2, Theoretical Advances, Academic Press, New York, USA, 1998.
[15] Soille, P., Pesaresi, M., Advances in Mathematical Morphology Applied to
Geoscience and Remote Sensing, IEEE
Transactions on Geoscience and Remote
Sensing Vol.40, No.9, 2002, pp. 2042–2055. [16] Benediktsson, J.A., Pesaresi, M., Arnason, K.,
Classification and Feature Extraction for Remote Sensing Images from Urban Areas Based on Morphological Transformations, IEEE
Transactions on Geoscience and Remote
Sensing, Vol.41, No.9, 2003, pp. 1940–1949. [17] Tzeng Y.C., Chen, K.S., A Fuzzy Neural
Network to SAR Image Classification, IEEE
Transaction on Geoscience and Remote
Sensing, Vol.36, 1998, pp. 301–307. [18] Zadeh L.A., Fuzzy Sets, Information Control,
Vol.8, 1965, pp. 338–353. [19] Pesaresi, M., Texture Analysis for Urban Pattern
Recognition Using Fine-resolution Panchromatic Satellite Imagery, Geographical
& Environmental Modelling, Vol.4, No.1, 2000, pp. 43–63.
[20] Barrile, V., Bilotta, G., Fast extraction of roads for emergencies with segmentation of satellite imagery, Procedia: Social & Behavioral
Sciences, Vol.223, 2016, pp. 903–908, doi: 10.1016/j.sbspro.2016.05.313.
[21] Barrile, V., Bilotta, G., Fotia, A., Bernardo, E. Road Extraction for Emergencies from Satellite Imagery, Lecture Notes in Computer Science, Proceedings of 20th International Conference on Computational Science and Its application (ICCSA 2020), Cagliari, Italy, 2020, pp. 767-781.
[22] Barbaro, G., Fiamma, V., Barrile, V., Foti, G., Ielo, G. Analysis of the shoreline changes of Reggio Calabria (Italy) International Journal of Civil Engineering and Technology, 2017, 8(10), pp. 1777-1791
[23] Barrile, V., Meduri, G., Bilotta, G. Laser scanner surveying techniques aiming to the study and the spreading of recent architectural structures. Proceedings of the 9th WSEAS International Conference on Signal, Speech and Image Processing, SSIP '09, Proc. 9th WSEAS Int. Conf. Multimedia, Internet and Video Technologies, MIV '09, 2009, pp. 92-95
[24] Postorino, M.N., Barrile, V., Cotroneo, F. Surface movement ground control by means of a GPS-GIS system Journal of Air Transport Management, 2006, 12(6), pp. 375-381
[25] Barrile, V., Bilotta, G., D’Amore, E., Meduri, G.M., Trovato, S. Structural modeling of a historic castle using close range photogrammetry International Journal of Mathematics and Computers in Simulation, 2016, 10, pp. 370-380
WSEAS TRANSACTIONS on ENVIRONMENT and DEVELOPMENT DOI: 10.37394/232015.2021.17.29
Giuliana Bilotta, Salvatore Calcagno, Stefano Bonfa
E-ISSN: 2224-3496 295 Volume 17, 2021

[26] Barrile, V., Candela, G., Fotia, A., Bernardo, E. UAV Survey of Bridges and Viaduct: Workflow and Application. Lecture Notes in Computer Science (including subseries Lecture Notes in Artificial Intelligence and Lecture Notes in Bioinformatics), 2019, 11622 LNCS, pp. 269-284
[27] Barrile, V., Fotia, A., Bernardo, E. The Submerged Heritage: A Virtual Journey In Our Seabed. ISPRS Annals of the Photogrammetry, Remote Sensing and Spatial Information Sciences, 2019, 42(2/W10), pp. 17-24
[28] Paech, S. J., J. R. Mecikalski, D. M. Sumner, C. S. Pathak, Q. Wu, S. Islam, and T. Sangoyomi,., 2009. A calibrated, high-resolution OES satellite solar insolation product for a climatology of Florida evapotranspiration, J. of the American Water Resources Association (in press).
[29] Harmsen, E. W., N. L. Miller, N. J. Schlegel and J. E. Gonzalez, 2009. Seasonal Climate Change Impacts on Evapotranspiration, Precipitation Deficit and Crop Yield in Puerto Rico, J. Agricultural Water Management 96, 1085–1095.
[30] Barrile, V., Meduri, G., Bilotta, G. Laser scanner surveying techniques aiming to the study and the spreading of recent architectural structures. Proceedings of the 9th WSEAS International Conference on Signal, Speech and Image Processing, SSIP '09, Proc. 9th WSEAS Int. Conf. Multimedia, Internet and Video Technologies, MIV '09, 2009, pp. 92-95.
[31] Eric W. Harmsen, John Mecikalski, Melvin J. Cardona-Soto, Alejandra Rojas Gonzalez, Ramon Vasquez. Estimating Daily Evapotranspiration in Puerto Rico using Satellite Remote Sensing WSEAS TRANSACTIONS on ENVIRONMENT and DEVELOPMENT. Issue 1, Volume 5, January. pp 13-23.
[32] Barrile, V., Bilotta, G., Meduri, G.M., An application of object-based analysis of satellite imagery on waste, Towards Horizon 2020,
Proceedings of 33rd EARSeL Symposium, 3-6 June 2013, Matera, Italy, 2013, pp. 791–798.
[33] Penman, H.L., Natural evaporation from open water, bare soil, and grass, Proc. R. Soc., London. Vol. A193. 1948, pp. 120-145.
[34] Penman, H.L., Vegetation and Hydrology, Tech. Comm. 53. Commonwealth Bureau of soils, Harpenden, England. 1963.
[35] Morton, F.I. Operational estimates of areal evapotranspiration and their significance to the
science and practice of hydrology. Journal of Hydrology, 66. 1983, pp. 1-76.
[36] Goyal, M. R., E. A. Gonzalez, C. Chao de Baez, Temperature versus elevation relationships for Puerto Rico. J. Agric. UPR 72(3). 1988, pp. 449- 467.
[37] Barrile, V., Bilotta, G., An application of object-oriented analysis to very high resolution satellite data on small cities for change detection, Recent Advances in Electrical Engineering, Proceedings of 3rd WSEAS Conference on
Remote Sensing (Remote '07), November 21-23, 2007, Venice, Italy, 2007, pp. 98–103.
[38] Allen, R. G., I. A. Walter, R. Elliott, R. Howell, D. Itenfisu and M. Jensen, R. L. Snyder, The ASCE Standardized Reference Evapotranspiration Equation. Environmental and Water Resources Institute of the American Society of Civil Engineers. 2005, pp. 57.
[39] Harmsen, E. W. and A. Gonzalez, Technical Note: A Computer Program for Estimating Crop Evapotranspiration in Puerto Rico, J. Agric. UPR. 89(1-2). 2005, pp. 107-113.
[40] Barrile, V., Bilotta, G., Pannuti, F., A Comparison Between Methods – A Specialized Operator, Object Oriented and Pixel Oriented Image Analysis – To Detect Asbestos Coverages in Building Roofs using Remotely Sensed Data. Int. Arch. Photogramm. Remote Sens. Spatial
Inf. Sci., XXXVII, 2008, pp. 427–434.
Creative Commons Attribution
License 4.0 (Attribution 4.0
International , CC BY 4.0)
This article is published under the terms of the Creative Commons Attribution License 4.0 https://creativecommons.org/licenses/by/4.0/deed.en_US
WSEAS TRANSACTIONS on ENVIRONMENT and DEVELOPMENT DOI: 10.37394/232015.2021.17.29
Giuliana Bilotta, Salvatore Calcagno, Stefano Bonfa
E-ISSN: 2224-3496 296 Volume 17, 2021