willamette valley water management - salina hart.pdf2016/01/01 · 22 water management partners...
TRANSCRIPT

217 217 217
200 200 200
255 255 255
0 0 0
163 163 163
131 132 122
239 65 53
110 135 120
112 92 56
62 102 130
102 56 48
130 120 111
237 237 237
80 119 27
252 174 .59
83 36
118
Salina N Hart, PE Chief, Reservoir Regulation & Water Quality Section USACE Portland District
2017 Oregon Dam Safety and Reservoir Resilience Conference 28 February 2017
WILLAMETTE VALLEY WATER MANAGEMENT

Portland District Dams Willamette Valley Dams Willamette Valley Project History Authorized Purposes & Benefits Flood and Conservation Season Water Control Diagram Annual Variability

Columbia: 6 Projects
Willamette Valley: 13 Projects
Rogue Valley: 2 Projects
PORTLAND DISTRICT DAMS & LOCKS

WILLAMETTE VALLEY

WILLAMETTE VALLEY
Middle Fork Willamette Subbasin Hills Creek Lookout Point/Dexter Fall Creek
McKenzie Subbasin Cougar Blue River
Coastal Basins Fern Ridge Dorena Cottage Grove
Willamette Valley Sub-Basin Location & Size
Santiam Subbasin Detroit/Big Cliff Green Peter/Foster

1894 Flood, downtown Portland
1943 Flood
1964 Flood, Albany
Willamette Flood of 1996
WILLAMETTE VALLEY PROJECT HISTORY

WILLAMETTE VALLEY PROJECT HISTORY
1936 Congress passed Flood Control Act authorizing Corps to survey the Willamette Basin
1938 Flood Control Act provided for the first seven dams and storage reservoirs Fern Ridge, Cottage Grove, Dorena, Detroit-
Big Cliff, Lookout Point-Dexter
1940 Corps began construction of Fern Ridge and Cottage Grove dams
1950 and 1962 Flood Control Acts authorized additional structures
1969 Blue River Dam was completed
Fern Ridge Dam construction 1940

AUTHORIZED PURPOSES
Flood risk management Hydropower Fish & wildlife Water quality Recreation Irrigation Municipal & industrial water supply Navigation *Not all projects are authorized for hydropower
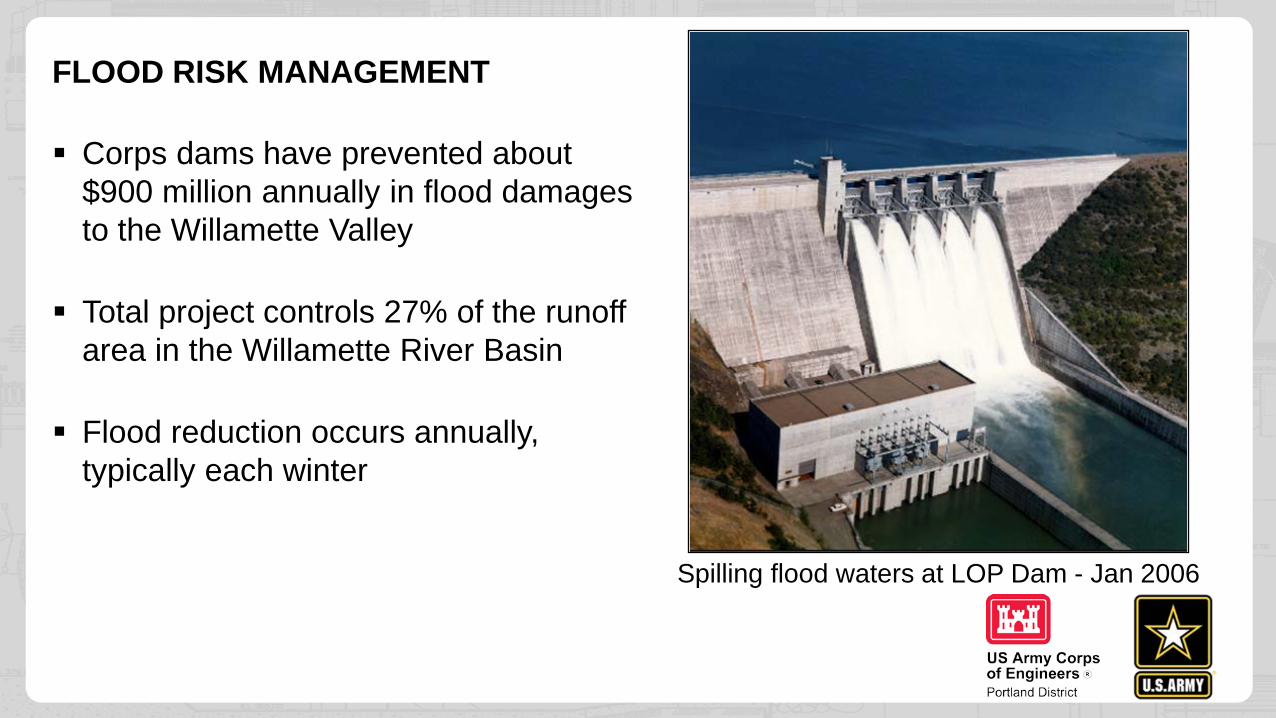
FLOOD RISK MANAGEMENT
Corps dams have prevented about $900 million annually in flood damages to the Willamette Valley
Total project controls 27% of the runoff area in the Willamette River Basin
Flood reduction occurs annually, typically each winter
Spilling flood waters at LOP Dam - Jan 2006
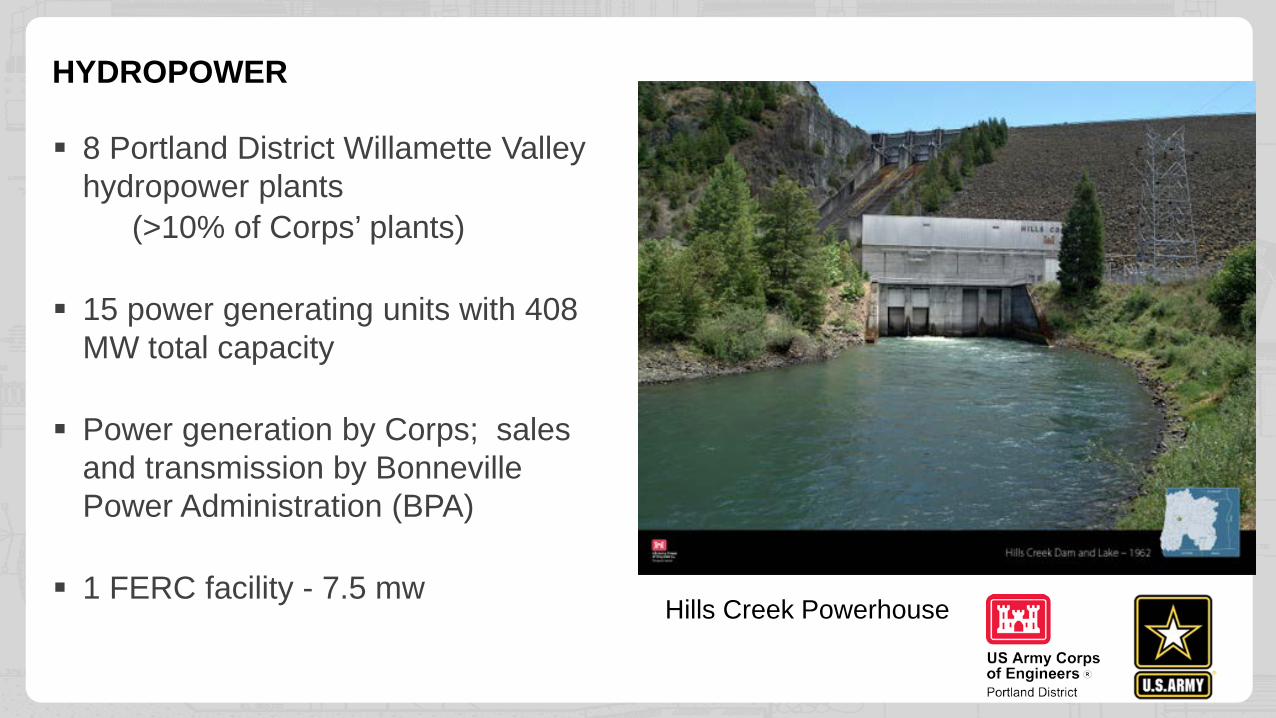
HYDROPOWER
8 Portland District Willamette Valley hydropower plants
(>10% of Corps’ plants)
15 power generating units with 408 MW total capacity
Power generation by Corps; sales and transmission by Bonneville Power Administration (BPA)
1 FERC facility - 7.5 mw Hills Creek Powerhouse

NAVIGATION (WATER QUALITY)
Authorized storage for navigation is used for water quality benefits
Augment flows to improve temperature and turbidity conditions for fish
Maintain statutory minimum flows at Albany/Salem
Willamette River

Over 3.5 million visitors annually
$100 million in economic benefits annually
4 campgrounds, 23 day-use areas, and 7 boat ramps managed by Corps
19 campgrounds, 32 day-use areas, 27 boat ramps, and 8 marinas managed through lease agreement
Detroit Lake
Pine Meadows Cottage Grove
RECREATION

IRRIGATION/WATER SUPPLY
75,000 acre-feet of stored water is contracted for irrigation
Bureau of Reclamation manages water sales from federal projects
Municipal uses for drinking water supply
Current efforts – Willamette Basin Review Farmland below Fern Ridge Dam

ENVIRONMENTAL STEWARDSHIP
Stewardship for critical habitat and special status species including: winter steelhead spring Chinook salmon bull trout Fender’s blue butterflies Kincaid’s lupine Western pond turtles red-legged frogs bald eagles migratory songbirds Oregon chub delisted May, 2015 first fish delisting in the nation

FISHERIES GOALS
Help ESA listed fish (fish that are in jeopardy of becoming extinct). Minimize stranding and dewatering of eggs Daily and hourly ramping release rates
Operate to provide downstream juvenile passage Operate to control downstream water temperatures Provide spawning, incubation and rearing flows Meet Biological Opinion requirements

FLOOD SEASON GOALS Major flood season (November – February) Flood Risk Mitigation Operate projects individually and as a system Use project storage to reduce downstream river stages Evacuate stored water in preparation for the next event Whenever possible, avoid exceeding the storm-peak downstream stage
during evacuation

CONSERVATION SEASON GOALS
Refill in Spring so there is sufficient water to meet authorized purposes
Release stored water through Summer and Fall
Balance the needs of the multiple purposes
Meet or exceed downstream flow targets
Temp targets below Cougar, Detroit and Lookout Point
Operate to facilitate maintenance and project improvements at the dams

WATER STORAGE IN THE BASIN Snow pack/runoff <10% of the system storage.
Snow in the basin is typically melted by June. Snow pack does not sustain runoff. Groundwater is what provides summer base inflows.
The system relies primarily on rainfall during the months of April, May and early June to fill its system of 13 dams and reservoirs in the Willamette River basin.
Cougar Reservoir
WATER CONTROL DIAGRAM
Defined in the original authorization of each project Analysis based on flood risks and hydrologic science of the day
Sets guidelines for risk management and balancing project benefits
Requires reservoir to be at or below rule curve except while storing flood water

WATER CONTROL DIAGRAM

01000200030004000500060007000800090001000011000120001300014000150001600017000180001900020000
1380
1400
1420
1440
1460
1480
1500
1520
1540
1560
1580
1/1/
2016
2/1/
2016
3/1/
2016
4/1/
2016
5/1/
2016
6/1/
2016
7/1/
2016
8/1/
2016
9/1/
2016
10/1
/201
6
11/1
/201
6
12/1
/201
6
INFL
OW
AN
D O
UTF
LOW
(CFS
)
RE
SE
RV
OIR
EL.
(FT
NG
VD
29)
DATE Rule Curve Actual Elevation Inflow Outflow
Spillway Crest
Top of Dam 1580 ft DETROIT 2016 OPERATIONS

22
WATER MANAGEMENT PARTNERS
Corps NOAA Weather Service NW River Forecast Center National Marine Fisheries Service
National Resource Conservation Service Bonneville Power Administration U.S. Geological Survey U.S. Bureau of Reclamation U.S. Fish & Wildlife U.S. Forest Service OR Dept. of Fish & Wildlife
OR Water Resources Dept. OR Dept. of Env. Quality OR Dept. of Agriculture The Nature Conservancy County government Elected officials Hatcheries OR State Marine Board OR State University City of Corvallis, Eugene, Salem,
Springfield, Cottage Grove, Oakridge

NATURAL RESOURCES CONSERVATION SERVICE WATER SUPPLY FORECASTS

Water year type determined by mid-May NRCS Water Supply Forecast Prescribes mainstem Willamette at Salem & Albany and tributary minimum flow
targets
NATURAL RESOURCES CONSERVATION SERVICE WATER SUPPLY FORECASTS
25

RESERVOIR DRAWDOWN PRIORITIES
April - June Green Peter Cougar Lookout Point, Hills Creek Blue River Fall Creek, Dorena, Cottage Grove Detroit, Fern Ridge, Foster
July - October Lookout Point Cougar Hills Creek Green Peter, Blue River Fall Creek, Dorena, Cottage Grove Detroit, Fern Ridge, Foster
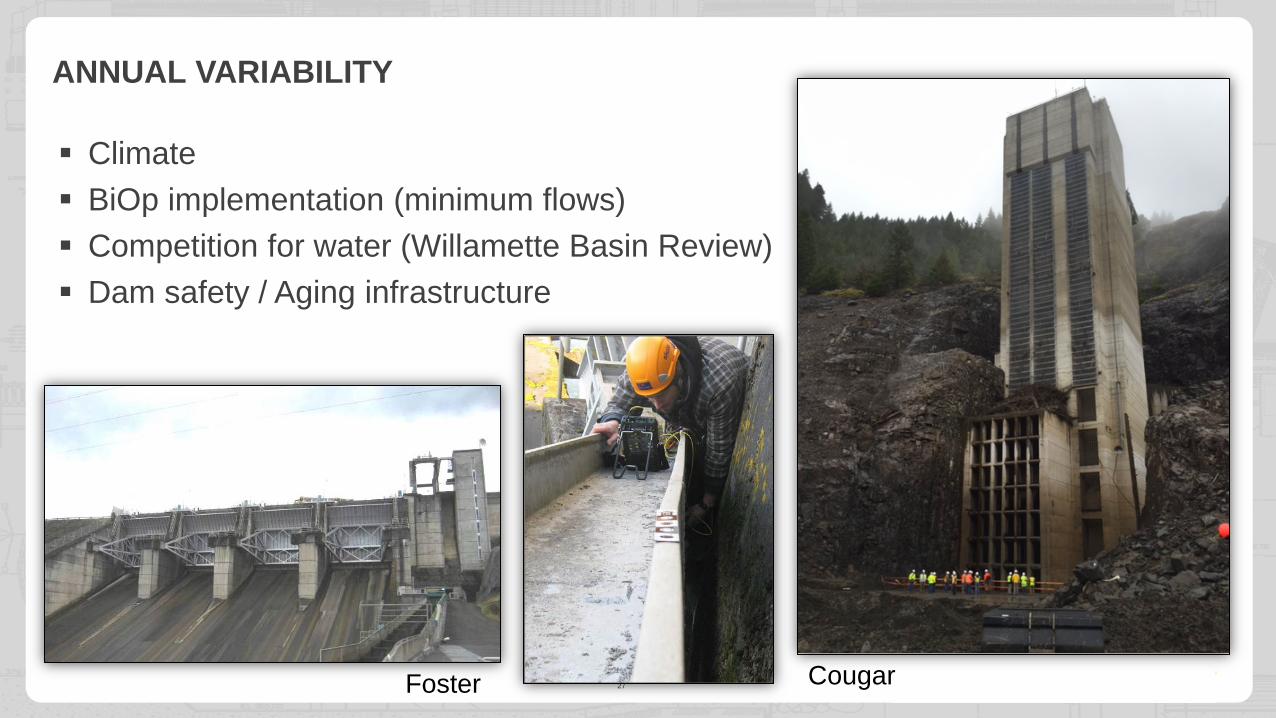
ANNUAL VARIABILITY
Climate BiOp implementation (minimum flows) Competition for water (Willamette Basin Review) Dam safety / Aging infrastructure
27 Foster Cougar

ANNUAL VARIABILITY - HILLS CREEK (MIDDLE FORK WILLAMETTE)
1,420
1,440
1,460
1,480
1,500
1,520
1,540
1,560
1-Jan 31-Jan 1-Mar 31-Mar 30-Apr 30-May 29-Jun 29-Jul 28-Aug 27-Sep 27-Oct 26-Nov 26-Dec
WY2000 WY2001 WY2002 WY2003 WY2004 WY2005WY2006 WY2007 WY2008 WY2009 WY2010 WY2011WY2012 WY2013 WY2014 WY2015 WY2016 Rule Curve
ELE
VATI
ON
(FT
NG
VD
29)

800
820
840
860
880
900
920
940
1-Jan 31-Jan 1-Mar 31-Mar 30-Apr 30-May 29-Jun 29-Jul 28-Aug 27-Sep 27-Oct 26-Nov 26-Dec
WY2000 WY2001 WY2002 WY2003 WY2004 WY2005WY2006 WY2007 WY2008 WY2009 WY2010 WY2011WY2012 WY2013 WY2014 WY2015 WY2016 Rule Curve
ANNUAL VARIABILITY - LOOKOUT POINT (MIDDLE FORK WILLAMETTE) E
LEVA
TIO
N (F
T N
GV
D29
)

ANNUAL VARIABILITY – COUGAR (MCKENZIE)
1,350
1,400
1,450
1,500
1,550
1,600
1,650
1,700
1,750
1-Jan 31-Jan 1-Mar 31-Mar 30-Apr 30-May 29-Jun 29-Jul 28-Aug 27-Sep 27-Oct 26-Nov 26-Dec
WY2000 WY2001 WY2002 WY2003 WY2004 WY2005WY2006 WY2007 WY2008 WY2009 WY2010 WY2011WY2012 WY2013 WY2014 WY2015 WY2016 Rule Curve
ELE
VATI
ON
(FT
NG
VD
29)

ANNUAL VARIABILITY – GREEN PETER (SOUTH SANTIAM)
890
910
930
950
970
990
1,010
1,030
1-Jan 31-Jan 1-Mar 31-Mar 30-Apr 30-May 29-Jun 29-Jul 28-Aug 27-Sep 27-Oct 26-Nov 26-Dec
WY2000 WY2001 WY2002 WY2003 WY2004 WY2005WY2006 WY2007 WY2008 WY2009 WY2010 WY2011WY2012 WY2013 WY2014 WY2015 WY2016 Rule Curve
ELE
VATI
ON
(FT
NG
VD
29)
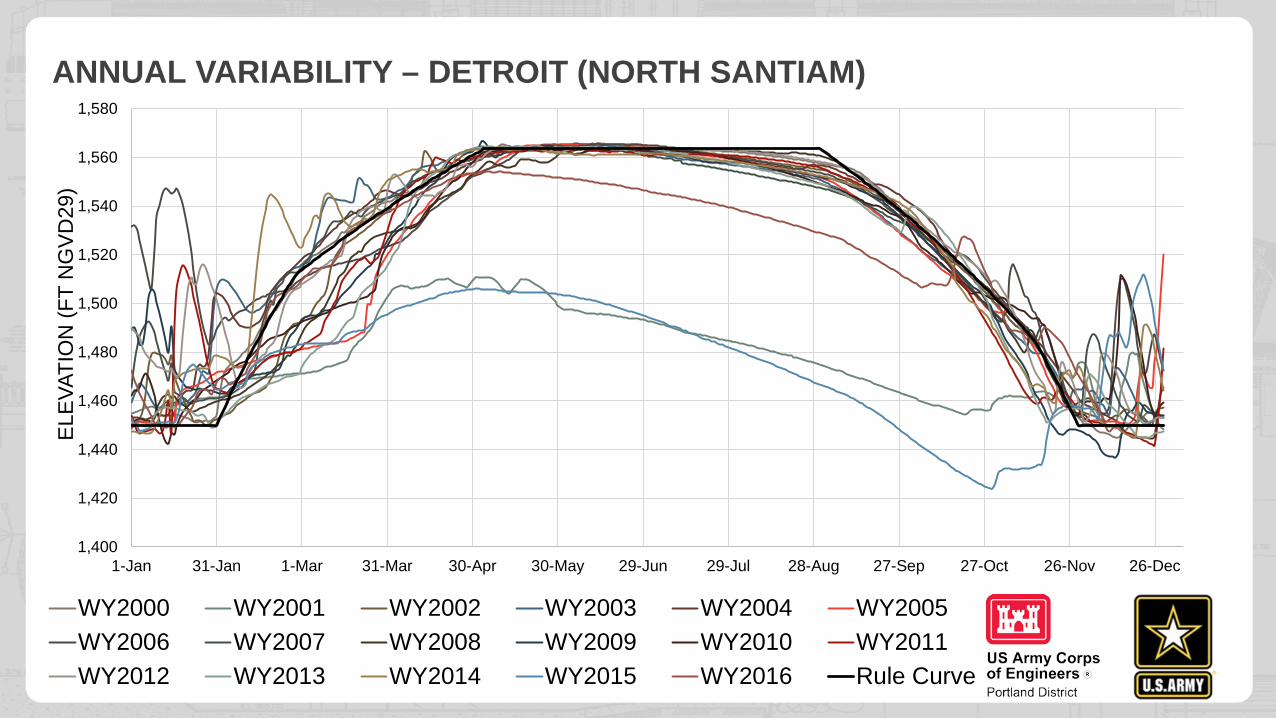
1,400
1,420
1,440
1,460
1,480
1,500
1,520
1,540
1,560
1,580
1-Jan 31-Jan 1-Mar 31-Mar 30-Apr 30-May 29-Jun 29-Jul 28-Aug 27-Sep 27-Oct 26-Nov 26-Dec
WY2000 WY2001 WY2002 WY2003 WY2004 WY2005WY2006 WY2007 WY2008 WY2009 WY2010 WY2011WY2012 WY2013 WY2014 WY2015 WY2016 Rule Curve
ANNUAL VARIABILITY – DETROIT (NORTH SANTIAM) E
LEVA
TIO
N (F
T N
GV
D29
)

SUMMARY
Dams in the Willamette Valley provide many benefits to the region.
Regional Coordination with our Water Management partners occur frequently.
The Water Control Diagram was developed to minimize risk and balancing project benefits.
The Willamette Basin reservoirs are dependent on rain during late spring for refill.

FOR MORE INFORMATION:
About the Corps: (Portland District web site) www.nwp.usace.army.mil Portland District Water Management Reservoir Regulation and Water Quality Section http://www.nwd-wc.usace.army.mil/nwp/wm/ Videos of the Willamette system: http://www.youtube.com/user/PortlandCorps Portland District Public Affairs Office: 503-808-4510 Willamette Storage
27 February 2017