wind energy- 60 gw and beyond · (wind+ solar) 160 470 853 110 210 284 non re excluding coal 98 114...
TRANSCRIPT

Wind Energy- 60 GW and beyond
April 26, 2017New Delhi

Setting the theme
Growth of electricity sector in India
Wind energy growth potential
Conference theme – overview
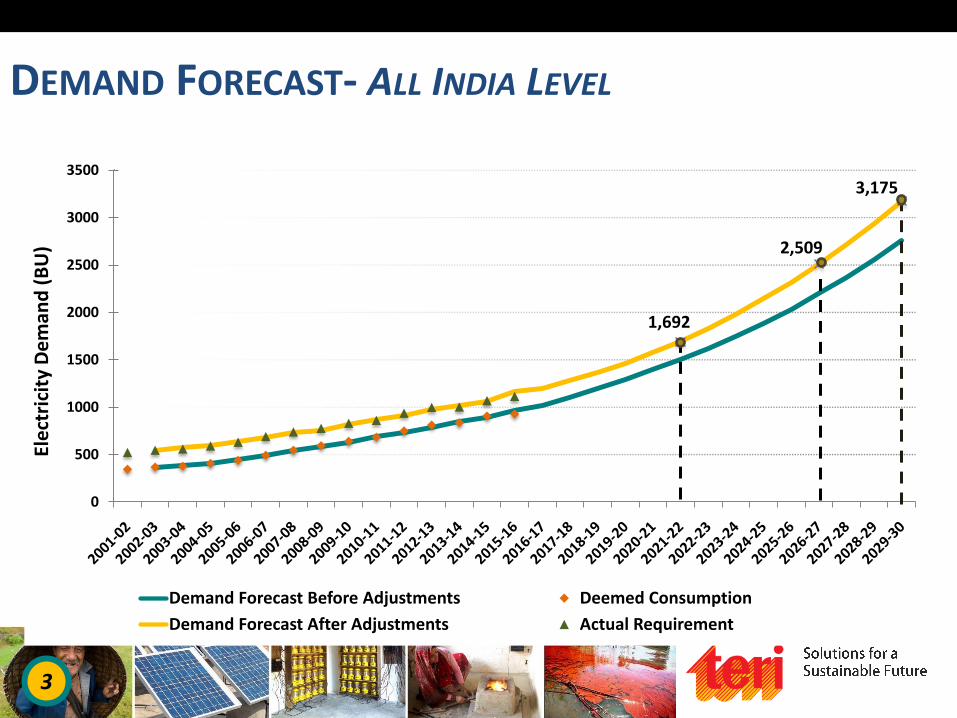
DEMAND FORECAST- ALL INDIA LEVEL
1,692
2,509
3,175
0
500
1000
1500
2000
2500
3000
3500
Ele
ctri
city
De
man
d (
BU
)
Demand Forecast Before Adjustments Deemed Consumption
Demand Forecast After Adjustments Actual Requirement
3

o High correlation observed
• Total power consumption versus GDP and per capita GDP
• Sectoral power consumption and respective sectoral GDP (Industrial and agriculture etc.)
o Electricity demand growth scenario and Installed Capacity
o CAGR of electricity consumption in India - 7.4%
Growth of power sector
Generation (BU) Installed Capacity (GW)
Years High RE Scenario
Low RE Scenario
High RE Scenario
Low RE Scenario
2021 - 22 1692 1692 506 457
2026 - 27 2509 2509 802 542
2029 - 30 3175 3175 1185 872

Indian Power Horizon
o 69% of RE Installations are from Wind Energy.
o To meet the above demand scenario – the generation mix scenario would be:
INSTALLED CAPACITY (GW)
High RE Scenario Low RE Scenario
2021-22 2026-27 2029-30 2021-22 2026-27 2029-30
RenewableEnergy (Wind+ Solar)
160 470 853 110 210 284
Non RE excluding coal
98 114 114 98 114 114
Coal 248 218 218 248 218 474
TOTAL 506 802 1185 457 542 872
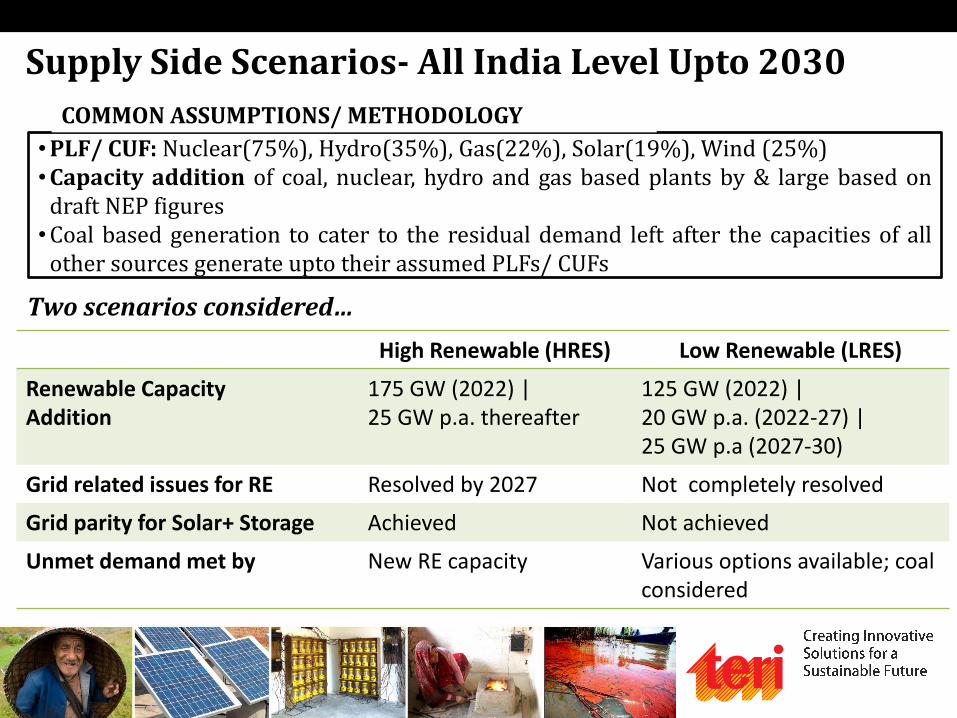
Supply Side Scenarios- All India Level Upto 2030
• PLF/ CUF: Nuclear(75%), Hydro(35%), Gas(22%), Solar(19%), Wind (25%)• Capacity addition of coal, nuclear, hydro and gas based plants by & large based on
draft NEP figures• Coal based generation to cater to the residual demand left after the capacities of all
other sources generate upto their assumed PLFs/ CUFs
COMMON ASSUMPTIONS/ METHODOLOGY
Two scenarios considered…
High Renewable (HRES) Low Renewable (LRES)
Renewable CapacityAddition
175 GW (2022) | 25 GW p.a. thereafter
125 GW (2022) | 20 GW p.a. (2022-27) | 25 GW p.a (2027-30)
Grid related issues for RE Resolved by 2027 Not completely resolved
Grid parity for Solar+ Storage Achieved Not achieved
Unmet demand met by New RE capacity Various options available; coal considered

Supply Side Scenarios- HRES & LRES Results
160 110
470
210
853
284
248249
218
218
218
47498
98
114
114
114
114
Installed Capacity (MW)
274 186678
379
1102
511
1182 1270
15281827
1763
2354236 236
303 303
310 310
Generation (BU)
2022 2027 2030 2022 2027 2030
LEGEND: Wind + Solar Wind + SolarCoal CoalOthers OthersHRES: LRES:
Note: In the HRES, new RE capacity required to meet the unmet demand after 2026 would undergo a downward revision based on the extent of development in storage technologies
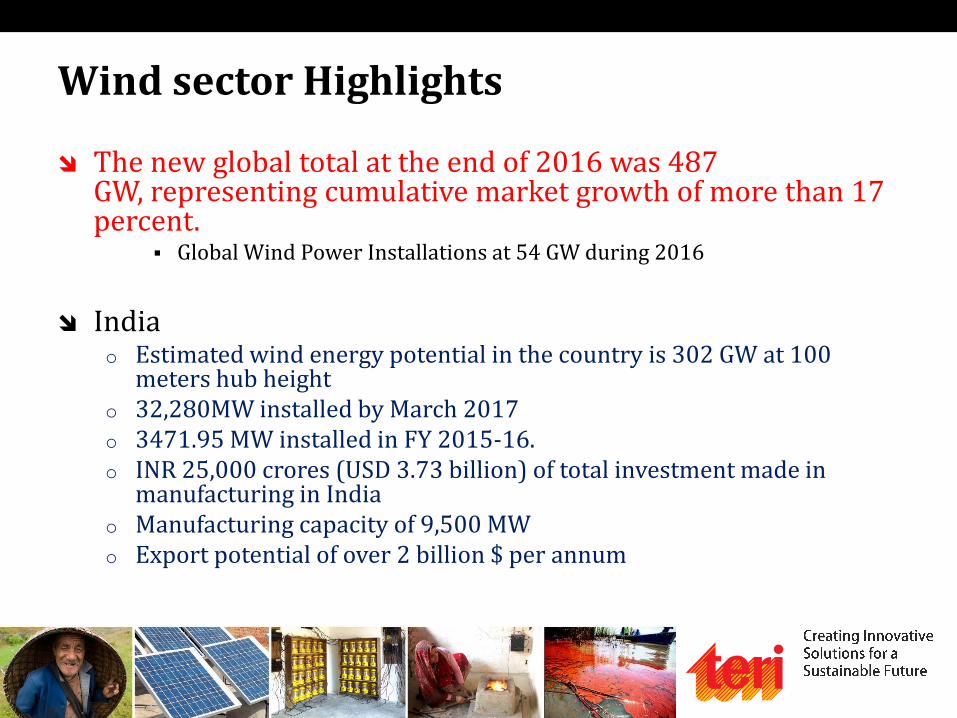
Wind sector Highlights
The new global total at the end of 2016 was 487 GW, representing cumulative market growth of more than 17 percent.
Global Wind Power Installations at 54 GW during 2016
India o Estimated wind energy potential in the country is 302 GW at 100
meters hub heighto 32,280MW installed by March 2017o 3471.95 MW installed in FY 2015-16.o INR 25,000 crores (USD 3.73 billion) of total investment made in
manufacturing in Indiao Manufacturing capacity of 9,500 MWo Export potential of over 2 billion $ per annum
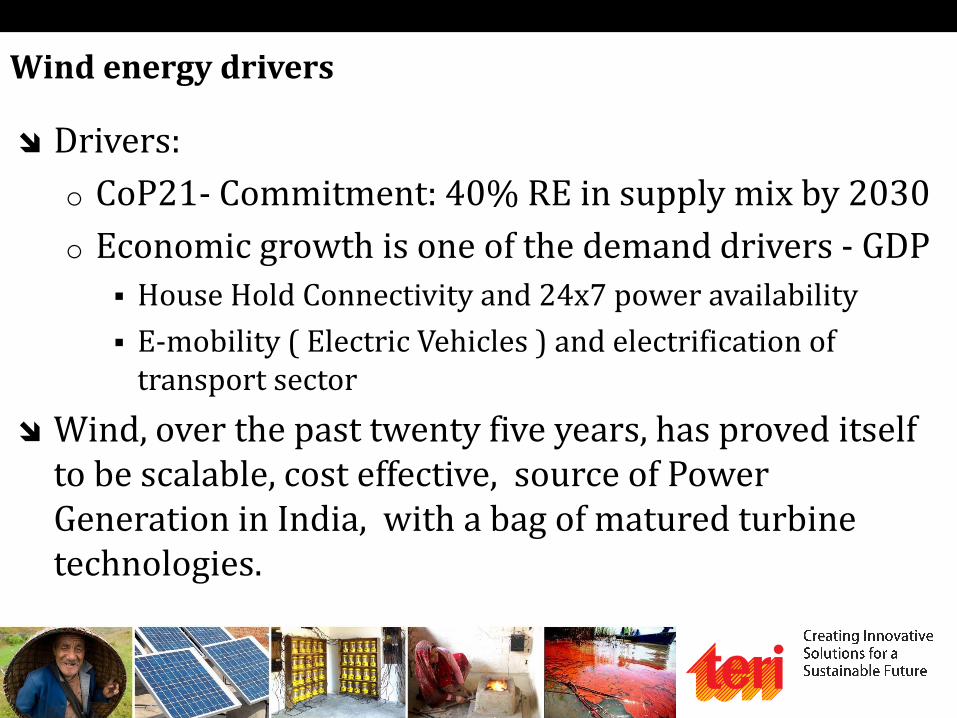
Wind energy drivers
Drivers:
o CoP21- Commitment: 40% RE in supply mix by 2030
o Economic growth is one of the demand drivers - GDP
House Hold Connectivity and 24x7 power availability
E-mobility ( Electric Vehicles ) and electrification of transport sector
Wind, over the past twenty five years, has proved itself to be scalable, cost effective, source of Power Generation in India, with a bag of matured turbine technologies.
Conference theme - Growth focus
Strong policy and regulatory support
Infrastructure planning
Off-shore wind development
Technology innovations
Make in India – Export potential
Cost and Variability to be addressed o Renewables (Wind ) would achieve grid parity and would
become dispatchable power. i.e Wind + Storage/balancing
o Price of dispatchable Wind Power would be about Rs. 5/kWh and would be competitive with price of coal based electricity