wind energy in colombia - world bankdocuments.worldbank.org/curated/en/...a world bank study walter...
TRANSCRIPT

A W O R L D B A N K S T U D Y
Walter Vergara, Alejandro Deeb,
Natsuko Toba, Peter Cramton, Irene Leino
A F R A M E W O R K F O R M A R K E T E N T R Y
Wind Energy
in Colombia
Pub
lic D
iscl
osur
e A
utho
rized
Pub
lic D
iscl
osur
e A
utho
rized
Pub
lic D
iscl
osur
e A
utho
rized
Pub
lic D
iscl
osur
e A
utho
rized
Pub
lic D
iscl
osur
e A
utho
rized
Pub
lic D
iscl
osur
e A
utho
rized
Pub
lic D
iscl
osur
e A
utho
rized
Pub
lic D
iscl
osur
e A
utho
rized
W O R L D B A N K S T U D Y
Wind�Energy��in�Colombia�A�Framework�for�Market�Entry�
Walter�Vergara��Alejandro�Deeb�Natsuko�Toba�Peter�Cramton�Irene�Leino����������������������
SKU_18504_Wind_Energy_Colombia_6-17-10.pdf 1SKU_18504_Wind_Energy_Colombia_6-17-10.pdf 1 6/17/2010 12:31:56 PM6/17/2010 12:31:56 PM

�
Copyright�©�2010�The�International�Bank�for�Reconstruction�and�Development/The�World�Bank�1818�H�Street,�N.W.�Washington,�D.C.�20433,�U.S.A.�All�rights�reserved�Manufactured�in�the�United�States�of�America�First�Printing:�July�2010�
�Printed�on�recycled�paper�
1�2�3�4� � � 13�12�11�10���World�Bank�Studies�are�published�to�communicate�the�results�of�the�Bank’s�work�to�the�development�community�with�the�least�possible�delay.�The�manuscript�of�this�paper�therefore�has�not�been�prepared�in� accordance� with� the� procedures� appropriate� to� formally�edited� texts.� Some� sources� cited� in� this�paper�may�be�informal�documents�that�are�not�readily�available.�
The�findings,�interpretations,�and�conclusions�expressed�herein�are�those�of�the�author(s)�and�do�not� necessarily� reflect� the� views� of� the� International� Bank� for� Reconstruction� and�Development/The�World�Bank�and�its�affiliated�organizations,�or�those�of�the�Executive�Directors�of�The�World�Bank�or�the�governments�they�represent.��
The� World� Bank� does� not� guarantee� the� accuracy� of� the� data� included� in� this� work.� The�boundaries,�colors,�denominations,�and�other�information�shown�on�any�map�in�this�work�do�not�imply�any� judgment�on�the�part�of�The�World�Bank�of� the� legal�status�of�any� territory�or� the�endorsement�or�acceptance�of�such�boundaries.�
The�material�in�this�publication�is�copyrighted.�Copying�and/or�transmitting�portions�or�all�of�this�work� without� permission� may� be� a� violation� of� applicable� law.� The� International� Bank� for�Reconstruction� and� Development/The� World� Bank� encourages� dissemination� of� its� work� and� will�normally�grant�permission�promptly�to�reproduce�portions�of�the�work.�
For�permission�to�photocopy�or�reprint�any�part�of�this�work,�please�send�a�request�with�complete�information� to� the�Copyright�Clearance�Center,� Inc.,�222�Rosewood�Drive,�Danvers,�MA�01923,�USA,�Tel:�978�750�8400,�Fax:�978�750�4470,�www.copyright.com.�
All�other�queries�on�rights�and� licenses,� including�subsidiary�rights,� should�be�addressed� to� the�Office�of�the�Publisher,�The�World�Bank,�1818�H�Street�NW,�Washington,�DC�20433,�USA,�Fax:�202�522�2422,�email:�[email protected].��ISBN:�978�0�8213�8504�3�eISBN:�978�0�8213�8508�1�ISSN:�1726�5878� DOI:�10.1596/978�0�8213�8504�3���Library�of�Congress�Cataloging�in�Publication�Data�has�been�requested.�
��
SKU_18504_Wind_Energy_Colombia_6-17-10.pdf 2SKU_18504_Wind_Energy_Colombia_6-17-10.pdf 2 6/17/2010 12:32:05 PM6/17/2010 12:32:05 PM

iii
Contents�
Preface�.....................................................................................................................................�viii�Acknowledgments�...................................................................................................................�ix�Acronyms�and�Abbreviations�.................................................................................................�x�Executive�Summary�...............................................................................................................�xiii�
Objective�............................................................................................................................�xiii�General�Context�...............................................................................................................�xiii�Alternative�Options�for�Colombia’s�Power�Mix�..........................................................�xiv�Wind�Energy�Capital�Costs�Are�Expected�to�Decrease�..............................................�xiv�Wind�and�Hydro�Energy�Resources�Are�Complementary..........................................�xv�Options�to�Address�Barriers�to�Entry�.............................................................................�xv�Impact�of�Policy�Options�...............................................................................................�xvii�Lessons�Learned�.............................................................................................................�xviii�
1.�Introduction�............................................................................................................................�1�Context�.................................................................................................................................�1�Structure�of�the�Report�.......................................................................................................�3�
2.�Summary�of�Findings�from�First�Stage�Report:�Nonconventional�Renewable�Energy�Barrier�Analysis�....................................................................................................�4�
3.�Cost�Comparison�of�Alternative�Power�Sources�Based�on�the�Expansion�Plan�for�2008–2025�.......................................................................................................................�7�Methodology�for�Technology�Cost�Comparison�............................................................�7�Least�(Levelized)�Cost�Comparison�.................................................................................�9�
4.�Wind�Power�Costs�Outlook�...............................................................................................�13�Technical�Viability�of�Wind�Power�.................................................................................�13�Efficiency�Gains�over�Time�..............................................................................................�14�Capital�Cost�Evolution�.....................................................................................................�14�Operation�and�Maintenance�Costs�Are�Decreasing�.....................................................�15�Wind�Power�Grid�Integration�.........................................................................................�16�Outlook�...............................................................................................................................�16�
5.�Wind�and�Hydro�in�Colombia:�Complementarity�Analysis�........................................�18�Complementarity�of�the�Wind�and�Hydro�Regimes�....................................................�18�Firm�Energy�and�Joint�Operation�of�Wind�and�Hydroelectric�Projects�.....................�25�
6.�Options�to�Aid�Market�Entry�of�Wind�Energy�in�the�Country’s�Power�Mix�............�29�Introduction�.......................................................................................................................�29�Options�to�Facilitate�Market�Entry�of�Wind�Energy�....................................................�29�Proposal�to�Address�the�Reliability�Issue�for�Wind�Energy�........................................�32�
SKU_18504_Wind_Energy_Colombia_6-17-10.pdf 3SKU_18504_Wind_Energy_Colombia_6-17-10.pdf 3 6/17/2010 12:32:05 PM6/17/2010 12:32:05 PM

iv Contents
7.�Assessing�the�Effectiveness�of�Policy�Instruments�and�Policy�Options:�Impact�on�a�300�MW�Wind�Powered�Power�Plant�Operating�in�the�Wholesale�Energy�Market�..................................................................................................................�36�Baseline�Information�........................................................................................................�37�Baseline�Results�.................................................................................................................�39�Impact�of�Selected�Policy�Options�..................................................................................�40�Key�Findings:�Options�to�Foster�Investment�in�Wind�Power�.....................................�47�Conclusions�of�the�Estimated�Impact�of�Alternative�Policy�Options�for�a�
300�MW�Wind�Energy�Power�Plant�in�the�MEM�..................................................�48�8.�Conclusions�..........................................................................................................................�50�
Wind�Energy�Resources�Could�Become�an�Important�Energy�Option�in�Colombia�....................................................................................................................�50�
Policy�Instruments�............................................................................................................�51�Policy�Options�...................................................................................................................�51�Other�Findings�..................................................................................................................�52�Applicability�of�the�Analysis�Conducted�......................................................................�52�
References�.................................................................................................................................�53��APPENDIXES�...........................................................................................................................�55�Appendix�1.�Technology�Cost�Comparison�........................................................................�56�Appendix�2.�Use�of�Earth�Simulator�to�Estimate�the�Likelihood�of�Extreme�
Weather�Events�.................................................................................................................�58�Appendix�3.�Pool�Prices�under�Various�Scenarios�............................................................�60�Appendix�4.�Results�of�the�Expected�Returns�on�Investments�with�the�
Individual�Application�of�the�Policy�Instruments�for�Different�Market�Scenarios�............................................................................................................................�62�
Appendix�5.�Exempting�CERE�Payments�by�50�or�100�Percent�.......................................�67�Appendix�6.�Complementarity�between�Wind�Power�and�Hydroelectric�
Resources�...........................................................................................................................�68�Chapter�1:�Introduction�....................................................................................................�68�Chapter�2:�Methodology�..................................................................................................�69�Chapter�3:�Data�Base�.........................................................................................................�70�Chapter�4:�Extension�of�Jepírachi�Information�..............................................................�77�Chapter�5:�Case�Studies�for�Complementarity�Analysis�.............................................�80�
�
Tables�Table�1.�Actions�Required�to�Reach�a�Financial�Threshold�for�a�300�MW�Wind�
Power�Plant�on�the�Northern�Coast�.............................................................................�xix�Table�3.1.�Power�Generation�Options�Included�in�the�Screening�Curve�Analyses�..........�8�Table�3.2.�Least�Cost�Capacity�Expansion�Mix�(without�CO2e�revenue)�...........................�9�Table�3.3.�Suggested�Capacity�Expansion�Mix�at�US$18�per�Ton�CO2e�...........................�10�
SKU_18504_Wind_Energy_Colombia_6-17-10.pdf 4SKU_18504_Wind_Energy_Colombia_6-17-10.pdf 4 6/17/2010 12:32:06 PM6/17/2010 12:32:06 PM

Contents v
Table�5.1.�Jepírachi�Monthly�Power�Generation�.................................................................�19�Table�5.2.�Wind�Speed�as�a�Fraction�of�Mean�Yearly�Wind�Speeds..................................�21�Table�5.3.�El�Niño�Periods�......................................................................................................�23�Table�5.4.�Wind�and�Hydro�Complementary�during�El�Niño�...........................................�24�Table�5.5.�Complementarity�of�Joint�Operation�of�Hydro�Plant�and�Wind�Farm;�
the�Case�of�the�Nare�River�..............................................................................................�24�Table�5.6.�Firm�Energy�Results�for�Guavio�River�Analyzed�in�Isolated�and�Joint�
Operation�..........................................................................................................................�25�Table�7.1.�Demand�Scenarios�for�the�Interconnected�Grid�and�Resulting�Indicative�
Prices�..................................................................................................................................�39�Table�7.2.�Expected�Returns�on�Equity�before�Taxes�for�a�300�MW�Wind�Farm�in�
Colombia—Business�as�Usual�Results�(no�government�intervention).....................�39�Table�7.3.�Policy�Options,�Allocation�of�Responsibilities�and�Associated�Costs�.............�41�Table�7.4a.�Financial�Results�for�a�300�MW�Wind�Farm�In�Northern�Colombia�
after�Use�of�Financial�Instruments;�Reliability�Payment�Considered�with�a�20�Percent�Firm�Energy�Factor�............................................................................................�44�
Table�7.4b.�Financial�Results�for�a�300�MW�Wind�Farm�in�Northern�Colombia�after�Use�of�Financial�Instruments;�Reliability�Payment�Considered�with�a�30�Percent�Firm�Energy�Factor�............................................................................................�45�
Table�7.4c.�Financial�Results�for�a�300�MW�Wind�Farm�in�Northern�Colombia�after�Use�of�Financial�Instruments;�Reliability�Payment�Considered�with�a�36�Percent�Firm�Energy�Factor�............................................................................................�46�
Table�7.5.�Key�Findings:�Combination�of�Policy�Instruments�to�Reach�a�Financial�Threshold�..........................................................................................................................�47�
Table�A1.1.�Least�Levelized�Cost�Ranking�of�Electricity�Generation�Plant�by�Capacity�Factor�(%)�without�the�Cost�of�CO2�Emissions�............................................�56�
Table�A1.2.�Least�Levelized�Cost�Ranking�of�Electricity�Generation�Plant�by�Capacity�Factor�(%)�with�US$18/Ton�CO2�Emissions..................................................�57�
Table�A3.1�MEM�Scenarios�....................................................................................................�60�Table�A4.1.�Effectiveness�Analysis�of�Individual�Policy�Instruments�..............................�63�Table�A4.2.�Effectiveness�Analysis�of�Policy�Options:�Use�of�Financial�Instruments�....�64�Table�A4.3.�Effectiveness�Analysis�of�Policy�Options:�Use�of�Government�Fees�and�
Payments�...........................................................................................................................�65�Table�A4.4.�Effectiveness�Analysis�of�Policy�Options:�Use�of�Regulatory�
Instruments�.......................................................................................................................�66�Table�A5.1.�Financing�Necessary�if�CERE�Is�Returned�50�Percent�or�100�Percent,�
Depending�on�Investment�Costs�....................................................................................�67�Table�A6.1.�Mean�Monthly�Values�for�the�Guavio,�Nare,�Cauca,�and�Magdalena�
Rivers�.................................................................................................................................�72�Table�A6.2.�Jepírachi�Monthly�Hour�Generation�kWh�(1�to�12)�........................................�74�Table�A6.3.�Jepírachi�Monthly�Hour�Generation�kWh�(13�to�24)�......................................�75�Table�A6.4.�Extended�Monthly�Generation�for�Jepírachi�(January�to�June)�....................�78�Table�A6.5.�Extended�Monthly�Generation�for�Jepírachi�(July�to�December)�.................�79�Table�A6.6.�El�Niño�Periods�since�1950�................................................................................�82�Table�A6.7.�Analysis�of�El�Niño�Occurrences�in�Guavio�River�Discharges�(1986–
1995)�...................................................................................................................................�83�
SKU_18504_Wind_Energy_Colombia_6-17-10.pdf 5SKU_18504_Wind_Energy_Colombia_6-17-10.pdf 5 6/17/2010 12:32:06 PM6/17/2010 12:32:06 PM

vi Contents
Table�A6.8.�Analysis�of�El�Niño�Occurrences�in�Guavio�River�Discharges�(1997–2007)�...................................................................................................................................�84�
Table�A6.9.�Analysis�of�El�Niño�Occurrences�in�Nare�River�Discharges�(1986–1995)�....�85�Table�A6.10.�Analysis�of�El�Niño�Occurrences�in�Nare�River�Discharges�(1997–
2007)�...................................................................................................................................�86�Table�A6.11.�Analysis�of�El�Niño�Occurrences�in�Cauca�River�Discharges�(1986–
1995)�...................................................................................................................................�87�Table�A6.12.�Analysis�of�El�Niño”�Occurrences�in�Cauca�River�Flows�(1997–2007)�......�88�Table�A6.13.�Analysis�of�El�Niño�occurrences�in�Magdalena�River�discharges�
(1986–1995)�........................................................................................................................�89�Table�A6.14.�Analysis�of�El�Niño�Occurrences�in�Magdalena�River�Discharges�
(1997–2007)�........................................................................................................................�90�Table�A6.15.�Analysis�of�El�Niño�Occurrences�at�Jepírachi�Power�Plant�(1986–
1995)�...................................................................................................................................�91�Table�A6.16.�Analysis�of�El�Niño�Occurrences�at�Jepírachi�Power�Plant�(1997–
2007)�...................................................................................................................................�91�Table�A6.17.�Summary�of�El�Niño�occurrences,�1986–2007�...............................................�92�Table�A6.18.�Firm�Energy�for�Guavio�and�Jepírachi�in�Isolated�and�Joint�Operation�....�93�Table�A6.19.�Firm�Energy�for�Nare�and�Jepírachi�in�Isolated�and�Joint�Operation�........�95�Table�A6.20.�Firm�Energy�for�Cauca�and�Jepírachi�in�Isolated�and�Joint�Operation�......�96�Table�A6.21.�Firm�Energy�for�Magdalena�and�Jepírachi�in�Isolated�and�Joint�
Operation�..........................................................................................................................�98��
Figures�Figure�1.1�Installed�Capacity�per�Technology�Type�.............................................................�2�Figure�3.1.�Screening�Curve�for�Levelized�Total�Costs�Measured�in�Cost�of�
Capacity�of�a�Plant�per�Year�(US$/kW�yr)�at�Different�Capacity�Factors�.................�10�Figure�3.2.�Screening�Curve�for�Levelized�Total�Costs�at�Different�Capacity�
Factors�Measured�in�Terms�of�Generation�Costs�(US�cents/kWh)�............................�11�Figure�4.1.�World�Total�Wind�Power�Installed�Capacity�(MW)�........................................�13�Figure�4.2.�Project�Capacity�Factors�by�Commercial�Operation�Date�..............................�14�Figure�4.3.�Reported�US�Wind�Turbine�Transaction�Prices�over�Time�............................�15�Figure�4.4.�Average�Operation�and�Maintenance�Costs�for�Available�Data�Years�
from�2000�to�2007,�by�Last�Year�of�Equipment�Installation�........................................�15�Figure�5.1.�Stations�Used�to�Characterize�Wind�Power�in�Colombia�...............................�20�Figure�5.2.�Almirante�Padilla�Airport,�Guajira�....................................................................�21�Figure�5.3.�Graphic�Representation�of�Wind�Conditions�in�Northern�Colombia�...........�22�Figure�5.4.�Firm�Energy�for�Guavio�River�as�a�Result�of�Isolated�and�Joint�
Operation�..........................................................................................................................�26�Figure�5.5.�Guavio�River�Reservoir�Operation�with�a�Reservoir�Size�of�0.2�in�
Isolated�and�Joint�Operation�..........................................................................................�27�Figure�5.6.�Guavio�River�Reservoir�Operation�with�a�Reservoir�Size�of�0.5�in�
Isolated�and�Joint�Operation�..........................................................................................�27�Figure�7.1.�Colombia�NIS�Demand�Forecasts,�2007–2028�..................................................�37�Figure�7.2.�Wind�Project�Generation�Estimates�2012–2025�................................................�37�Figure�7.3.�Pool�Prices,�Base�Scenario�...................................................................................�38�
SKU_18504_Wind_Energy_Colombia_6-17-10.pdf 6SKU_18504_Wind_Energy_Colombia_6-17-10.pdf 6 6/17/2010 12:32:06 PM6/17/2010 12:32:06 PM
Contents vii
Figure�7.4.�Comparison�of�Pool�Prices�for�Base,�High,�and�Low�Scenarios�.....................�38�Figure�A2.1.�Changes�in�Maximum�Five�Day�Precipitation�Total�(mm)�between�
the�Present�and�the�End�of�the�21st�Century�for�(a)�60�km�and�(b)�20�km,�Respectively�......................................................................................................................�58�
Figure�A2.2.�The�Same�as�In�Figure�A.2.1�Except�for�Consecutive�Dry�Days�(day)�.......�59�Figure�A3.1�Pool�Prices,�Base�High�Hydro�Scenario�..........................................................�60�Figure�A3.2.�Pool�Prices,�High�Scenario�...............................................................................�60�Figure�A3.3.�Comparison�of�Pool�Prices�for�Base�and�Base�High�Hydro�Scenarios�.......�61�Figure�A6.1.�Hourly�Wind�Velocity:�Puerto�Bolívar�...........................................................�70�Figure�A6.2.�Seasonal�Behavior�of�Mean�Wind�Velocity�....................................................�71�Figure�A6.3.�Hourly�Mean�Velocity:�Barranquilla�Airport�................................................�71�Figure�A6.4.�Mean�Wind�Velocity:�Barranquilla�Airport�...................................................�72�Figure�A6.5.�Normalized�Monthly�Discharges�of�the�Four�Rivers�...................................�73�Figure�A6.6.�Power�Curve�for�Each�Unit�..............................................................................�73�Figure�A6.7.�Jepírachi:�Hourly�Generation�..........................................................................�76�Figure�A6.8.�Jepírachi:�Monthly�Mean�Generation�.............................................................�76�Figure�A6.9.�Mean�Monthly�Values�at�the�Guavio�River�Dam�Site�..................................�80�Figure�A6.10.�Mean�Monthly�Values�at�the�Santa�Rita�Dam�Site�on�the�Nare�River�......�80�Figure�A6.11.�Mean�Monthly�Values�at�the�Salvajina�Dam�Site�on�the�Cauca�River�.....�81�Figure�A6.12.�Mean�Monthly�Values�at�the�Salvajina�Dam�Site�on�the�Magdalena�
River...................................................................................................................................�81�Figure�A6.13.�Firm�Energy�for�Guavio�and�Jepírachi�in�Isolated�and�Joint�
Operation�..........................................................................................................................�93�Figure�A6.14.�Guavio�River�Reservoir�Operation�with�Reservoir�Size�0.2�......................�94�Figure�A6.15.�Guavio�River�Reservoir�Operation�with�Reservoir�Size�0.5�......................�94�Figure�A6.16.�Firm�Energy�for�Nare�and�Jepírachi�in�Isolated�and�Joint�Operation�......�95�Figure�A6.17.�Nare�River�Reservoir�Operation�with�Reservoir�Size�0.2�..........................�95�Figure�A6.18.�Nare�River�Reservoir�Operation�with�Reservoir�Size�0.5�..........................�96�Figure�A6.19.�Firm�Energy�for�Cauca�and�Jepírachi�in�Isolated�and�Joint�Operation�....�97�Figure�A6.20.�Cauca�River�Reservoir�Operation�with�Reservoir�Size�0.2�........................�97�Figure�A6.21.�Cauca�River�Reservoir�Operation�with�the�Reservoir�Size�0.5�..................�98�Figure�A6.22.�Firm�Energy�for�Magdalena�and�Jepírachi�in�Isolated�and�Joint�
Operation�...........................................................................................................................�98�Figure�A6.23.�Magdalena�River�Reservoir�Operation�with�Reservoir�Size�0.2�................�99�Figure�A6.24.�Magdalena�River�Reservoir�Operation�with�Reservoir�Size�0.5�................�99��
��
SKU_18504_Wind_Energy_Colombia_6-17-10.pdf 7SKU_18504_Wind_Energy_Colombia_6-17-10.pdf 7 6/17/2010 12:32:06 PM6/17/2010 12:32:06 PM

viii
Preface�
he� urgent� need� to� reduce� the� carbon� footprint� of� human� activities� and� the�increased�awareness�of�the�consequences�of�climate�destabilization�have�rekindled�
interest� in� renewable� energy� sources� as� important� elements� to� consider� in� the�expansion�or�retrofitting�of�power�systems.�This�report,�the�second�in�a�series�aimed�at�assessing� and� addressing� barriers� to� the�market� entry� of�wind� energy� in�Colombia’s�power� sector,� is� but� one� example� of� the� renewed� attention� that� is� rightly� being�conferred�to�the�potential�for�wind�to�become�a�forceful�player�in�low�carbon�futures�in�Latin�America.��
The�role�of�wind�will�not�only�be�a�function�of�cost�effectiveness�and/or�technology�advances� but� also� of� the� ability� to� address�policy� and� regulatory�barriers� that� in� the�past�have�hampered�their�entry�into�developing�markets.�Although�the�report�refers�to�the� specifics� of� Colombia,� its� approach� and� conclusions�may� be� valuable� to� a�wider�audience�in�the�region�and�worldwide.��
If� these� barriers� are� successfully� addressed,� wind� energy� may� contribute�substantially� to� maintain� the� current,� relatively� low�carbon� footprint� of� Colombia�s�power� sector,� aided� by� a� strong� hydro� contribution.� Furthermore,� as� the� report�suggests,�the�wind�option�may�also�contribute�to�the�diversification�of�power�sources�without�increasing�their�carbon�footprint,�while�also�addressing�concerns�related�to�the�vulnerability�of�hydropower�to�increased�climate�variability.���
Walter�Vergara��Team�Leader�
Global�Expert�Team�on�Climate�Change�Adaptation��
��
T
SKU_18504_Wind_Energy_Colombia_6-17-10.pdf 8SKU_18504_Wind_Energy_Colombia_6-17-10.pdf 8 6/17/2010 12:32:06 PM6/17/2010 12:32:06 PM

ix
Acknowledgments�
any�people�contributed�to�this�study,�and�the�authors�would�like�to�thank�them�all.�The�authors�would�like�to�express�their�gratitude�for�the�support�and�inputs�
provided�by�J.�Mejía�(energy�specialist),�A.�Brugman�(power�engineer),�and�A.�Valencia�(renewable� energy� specialist)� in� the� preparation� of� this� study.� The� authors� want� to�thank�the�technical�staff�at�UPME�led�by�C.�A.�Flórez,�in�particular,�J.V.�Dulce,�as�well�as� the� technical� staff� at� ISAGEN� led� by� L.A.� Posado,� and� Las� Empresas� Públicas�Municipales�(EPM),�led�by�L.F.�Rodríguez�Arbelaez,�for�their�valuable�comments.�The�authors�are�also�most�grateful�to�J.�Nash,�P.�Benoit,�G.�Grandolini,�C.�Feinstein,�and�D.�Reinstein�for�their�comments�and�suggestions.�
This� study� is� a� product� of� the� Energy� Unit� of� the� Sustainable� Development�Department�of�the�Latin�America�and�Caribbean�Region�of�the�World�Bank�and�funded�through�the�Energy�Sector�Management�Assistance�Program.�
��
���
M�
SKU_18504_Wind_Energy_Colombia_6-17-10.pdf 9SKU_18504_Wind_Energy_Colombia_6-17-10.pdf 9 6/17/2010 12:32:06 PM6/17/2010 12:32:06 PM

x
Acronyms�and�Abbreviations�
AGC� Automatic�Generation�Control�ANH� Agencia�Nacional�de�Hidrocarburos�(National�Hydrocarbon�Agency)�CCGT� Combined�Cycle�Gas�Turbine�CCS� Carbon�Capture�and�Storage�CDM� Clean�Development�Mechanism�CER� Certified�Emission�Reductions�CERE� Real�Equivalent�Cost�of�the�Capacity�Charge�CFB� Circulating�Fluidized�Bed�CNG� Compressed�Natural�Gas�COLCIENCIAS� Departamento�Administrativo�de�Ciencia,�Tecnología�e�Innovación�
(Colombian�Institute�for�the�Development�of�Science,�Technology�and�Innovation)�
CREG� Comisión�de�Regulación�de�Energía�y�Gas�(Regulatory�Commission�for�Electricity�and�Gas)�
CTF� Clean�Technology�Fund�DNP� Departamento�Nacional�de�Planeación�(National�Planning�Department)�EPM� Empresas�Públicas�de�Medellín�ESP�(Public�Companies�of�Medellín),�
one�of�Colombia’s�largest�energy�producers�ENSO� El�Niño�Southern�Oscillation�ESMAP� World�Bank�Energy�Sector�Management�Assistance�Program�ESP� Electrostatic�Precipitator��FAZNI� Fondo� de� Apoyo� Financiero� para� la� Energización� de� las� Zonas� No�
Interconectadas�(Fund�for�the�Electrification�of�Off�grid�Regions)�FDG� Flue�Gas�Desulfurization�GypsumFGD� Flue�Gas�Desulfurization�GCM� General�Circulation�Model�GDP� Gross�Domestic�Product�GHG� Greenhouse�Gas�GOC� Government�of�Colombia�IDEAM� Instituto�de�Hidrología,�Meteorología�y�Estudios�Ambientales�de�Colombia�
(Institute�of�Hydrology,�Meteorology�and�Environmental�Studies�of�Colombia)�
IEA� International�Energy�Agency�IGCC� Integrated�Gasification�Combined�Cycle�IPCC� Intergovernmental�Panel�on�Climate�Change�IPP� Independent�Power�Producer�IRR� Internal�Rate�of�Return�ISA� Interconexión�Eléctrica�S.A.�ISAGEN� A�major�power�producer�and�commercialization�company�in�
Colombia�JMA� Japan�Meteorological�Agency�LVRT� Low�Voltage�Run�Through�
SKU_18504_Wind_Energy_Colombia_6-17-10.pdf 10SKU_18504_Wind_Energy_Colombia_6-17-10.pdf 10 6/17/2010 12:32:06 PM6/17/2010 12:32:06 PM

Acronyms and Abbreviations xi
MDB� Multilateral�Development�Bank�MEM� Wholesale�Energy�Market�MRI� Meteorological�Research�Institute�of�Japan�NIS� National�Interconnected�System�NREL� National�Renewable�Energy�Laboratory�O&M� Operation�and�Maintenance�PM� Particulate�Matter�PPP� Purchasing�Power�Parity��R&D� Research�and�Development�RE� Renewable�Energy�RET� Renewable�Energy�Technologies�SC� Subcritical�SCR� Selective�Catalytic�Reduction�SDL� Sistema�de�Distribución�Local�(Local�Distribution�System)�SOPAC� Pacific�Islands�Applied�Geoscience�Commission�SOx� Sulfur�Oxide�Gases�SPC� Super�Critical�SSPD� Superintendencia�de�Servicios�Públicos�Domiciliarios�(Superintendency�
for�Residential�Public�Services)�STN� Sistema�de�Transmisión�Nacional�(National�Transmission�System)�STR� Sistema�de�Transmisión�Regional�(Regional�Transmission�System)��TPC� Total�Plant�Cost�UNFCCC� United�Nations�Framework�Convention�on�Climate�Change�UPME� Unidad�de�Planeamiento�Minero�Energética�(Colombia’s�Energy�and�
Mining�Planning�Unit)�URE� Uso�Racional�de�Energía�(Rational�and�Efficient�Use�of�Energy)�USPC� Ultra�Supercritical��
List�of�Units�BTU� British�Thermal�Units�Cal� Calories�Cz� Ash�GJ� Gigajoule�GW� Gigawatt�GWh� Gigawatt�hour�Kbpd� Thousand�barrels�per�day�Kcal� Kilo�calories�Kg� Kilogram�KTOE� Thousand�tons�of�oil�equivalent�KWh� Kilowatt�hour�(103)�Lb� Pounds�M/s� Meters�per�second�MBTU� Million�British�Thermal�Units�Mbbl� Million�barrels��MJ� Megajoules�
SKU_18504_Wind_Energy_Colombia_6-17-10.pdf 11SKU_18504_Wind_Energy_Colombia_6-17-10.pdf 11 6/17/2010 12:32:06 PM6/17/2010 12:32:06 PM

xii Acronyms and Abbreviations
MMT� Million�metric�tons�MTOE� Million�tons�of�oil�equivalent�MWa� Megawatt�average�MWh� Megawatt�hour�(106)�QUADS� Quadrillion�BTU�Tcf� Trillion�cubic�feet�TOE� Tons�of�oil�equivalent�TWh� Terawatt�hour�US$PPP� Purchasing�power�parity����
SKU_18504_Wind_Energy_Colombia_6-17-10.pdf 12SKU_18504_Wind_Energy_Colombia_6-17-10.pdf 12 6/17/2010 12:32:06 PM6/17/2010 12:32:06 PM

xiii
Executive�Summary�
Objective
The�purpose�of�this�report�is�to�provide�decision�makers�in�Colombia�(and�by�extension�other� countries� or� regions),�who� are� considering� the� deployment� or� consolidation� of�wind�power,�with�a� set� of� options� to�promote� its�use.�The�options�presented�are� the�result�of�an�analysis�of�the�Colombian�market;�this�analysis�included�simulations�and�modeling� of� the� country’s� power� sector,� and� extensive� consultations�with� operators,�managers,�and�agents.�More�information�on�the�analysis�and�simulations�is�presented�in� the� appendixes.� Wind� was� chosen� to� exemplify� the� range� of� renewable� energy�alternatives�available�to�complement�traditional�power�sector�technologies�on�the�basis�of�its�technical�maturity,�its�relatively�low�cost�compared�to�other�options,�the�country’s�experience,�and�its�wind�power�potential.�This�report�constitutes�the�second�phase�of�a�barrier�analysis�to�wind�energy�in�Colombia�(Vergara�et�al.�2008).�
General Context
Colombia�has� a� rich� endowment�of� energy� sources.�The�natural�gas� reserves� in� 2008�were�7.3�tera�cubic�feet�(of�which�60�percent�were�proven�reserves).�At�the�current�rate�of� utilization� these� reserves�would� last� 23� years.1� Likewise,�Colombia’s� coal� reserves�are�rated�at�seven�billion�tons�(or�about�100�years�of�production�at�the�present�mining�rate).�Most� coal�mined� is� anthracite,�with� very� low� ash� and� sulfur� content,� ideal� for�exports� to� the�European�market.�Oil� reserves�are�more� limited�but� recent�discoveries�have�expanded�reserves� in�number�of�years�of�supply,�which�until�recently�had�been�estimated�at�eight�years�(Ministry�of�Mines�and�Energy�2008).�The�country�has�also�a�substantial,�relatively�low�cost�hydropower�potential�resulting�from�its�location�in�the�tropical�inter�convergence�zone�and�its�mountain�ranges.�
Within� this�context,� the�country�has�developed�a�power�sector� that�relies�heavily�on�installed,�large�capacity�hydropower�units�that�provide�cost�effective�electricity.�In�2008�the�installed�power�mix�in�Colombia�(13.5�GW)�was�67�percent�hydro,�27�percent�natural� gas,� 5� percent� coal,� and� 0.3� percent�wind� and� cogeneration.� The� total� power�demand�that�same�year�was�54�TWh�(UPME�2009),�met�with�about�9�GW�of�installed�capacity.2�This�structure�also�results�in�a�low�carbon�footprint,�among�the�lowest�in�the�region,�with�87�percent�of�power�generated�and�delivered�to�the�grid�by�hydropower�plants,�resulting�in�an�estimated�350�tons�of�CO2�per�GWh�generated�(about�half�that�of�Mexico).�
From� a�management� perspective,� Colombia’s� power� sector� is� maturing� quickly,�with� relative� stability� in� its� regulations,� an� unbundled� system,� and� a� dispatch�mechanism�that�closely�resembles�a�well�functioning�competitive�market.�Competition�is�promoted�and�tools�have�been�designed�to�attract�cost�effective�capacity�expansions�that�would� promote� reliability3� of� service� (a� fuller� description� of� the� system� and� its�dispatch�mechanism�was�included�in�the�phase�one�report).�
The�wind� regime� in�Colombia�has�been� rated�among� the�best� in�South�America.�Offshore�regions�of�the�northern�part�of�Colombia�have�been�classified�with�class�seven�
SKU_18504_Wind_Energy_Colombia_6-17-10.pdf 13SKU_18504_Wind_Energy_Colombia_6-17-10.pdf 13 6/17/2010 12:32:06 PM6/17/2010 12:32:06 PM

xiv Executive Summary
winds� (winds� over� nine�meters� per� second� [m/s]� at� heights� of� 50�meters).� The� only�other� region� in�South�America�with�similar�wind� intensity� is� the�Patagonia� region�of�Chile�and�Argentina.�Colombia�has�an�estimated�wind�power�potential�of�18�GW�in�the�La� Guajira� region—enough� to� generate� power� to� meet� the� national� power� demand�twice�over4�(Pérez�and�Osorio�2002).�However,�the�country�has�an�installed�capacity�of�only� 19.5� MW� of� wind� energy� (Jepírachi� Project)� and� several� projects� under�consideration,�including�a�200�MW�project�in�Ipapure,�northern�Colombia.�
Under�the�current�circumstances,�and�on�its�own,�the�interconnected�system�would�not� likely� promote� nonconventional� renewable� energy� resources� (for� example,� other�than�hydropower),�such�as�wind,�but�would�instead�maintain�its�high�capacity�share�of�hydro.� Alternatively,� the� system�may�move� toward� a�more� carbon�intensive� energy�resource�mix�(likely�reliant�on�abundant�coal�reserves)�to�meet�any�additional�demand�that�cannot�be�met�through�hydropower�and/or�to�strengthen�the�system’s�resilience�to�deal�with�the�effects�of�droughts�and�El�Niño�years.�Expanding�the�coal�based�power�generation�capacity�would�result�in�an�increase�in�the�carbon�footprint�of�the�economy�from�its�current�relatively�low�level�of�greenhouse�gas�(GHG)�emissions.5�
Alternative Options for Colombia’s Power Mix
A� cost� comparison� of� 37� alternative� technology� options� for� power� generation� in�Colombia,�using�a� levelized� curve/netback�analysis,� indicates� that,� as� expected,� large�hydropower� is� the� least�cost�power�option�with�or�without�CO2e� emission� reduction�revenues�over�a�wide�range�of�capacity�factors.�After�hydropower,�the�rehabilitation�of�existing� (subcritical)� coal�power�plants�and� the� fuel� switch� from�oil�or�natural�gas� to�coal�fired� power� plants� present� some� of� the� lowest� levelized� costs� at� any� capacity�factor;�these�options�are�not�currently�used�in�the�country.�
Allowing� for� CO2� revenues� does� not� significantly� change� the� least�cost� capacity�expansion�ranking.�For�2007�investment�costs�(based�on�which�the�analysis�was�made)�even�at�a�CO2e�price�of�US$50,�wind�power�is�still�not�the�least�cost�option.�Within�this�range� of� revenues,� carbon� credits� fail� to� effectively� affect� the� ranking� of� options,�proving�that�the�Clean�Development�Mechanism�(CDM)�alone�at�the�2007�price�level�is�not� enough� to� promote� alternative� zero�carbon� energy� under� existing� conditions� in�Colombia.� Therefore,� other� policy� options� are� required� to� facilitate�market� entry� for�wind�power.�
Wind Energy Capital Costs Are Expected to Decrease
Primarily� because� of� the� increased� interest� caused� by� climate� concerns,�wind� power�installations� are� experiencing� rapid� change� and� improvements.� For� example,� the�energy�produced�per�unit�of� installed�capacity�(measured�as�the�weighted�average�of�capacity�factors)�went�from�22�percent�for�wind�power�projects�installed�before�1998�to�30–32�percent�for�projects�installed�from�1998�to�2003�and�to�33–35�percent�for�projects�installed�during�2004–2006�(LBNL�2008).�
Investment� costs� have� decreased� in� the� last� year� after� peaking� late� in� 2008.�Investment�costs�for�wind�energy�projects�experienced�a�decreasing�trend,�which�was�interrupted� between� 2004� and� 2008� as� consequence� of� high� demand,� limited�production� capacity,� and� the� global� high� demand� for� raw� materials.� Recent�
SKU_18504_Wind_Energy_Colombia_6-17-10.pdf 14SKU_18504_Wind_Energy_Colombia_6-17-10.pdf 14 6/17/2010 12:32:07 PM6/17/2010 12:32:07 PM

Executive Summary xv
information� indicates� that� investment�costs�have�continued� the� long�term�downward�trend,�with�mid�2009�average�costs�at�around�$1,800/kW.�
Annual�average�operation�and�maintenance�costs�of�wind�power�production�have�also� continuously� declined6� since� 1980.� Most� importantly,� the� capacity�weighted�average�of�2000–2007�Operation�and�Maintenance�(O&M)�costs�for�projects�constructed�in� the� 1980s� was� equal� to� US$30/MWh,� but� dropped� to� US$20/MWh� for� projects�installed�in�the�1990s�and�to�US$9/MWh�for�projects�installed�in�the�2000s.�These�trends�are� expected� to� continue� in� the� foreseeable� future,� gradually� improving� the� relative�competitiveness�of�wind�power.�
Wind and Hydro Energy Resources Are Complementary
The� report� examines� the� extent� to�which� the�wind� resource� is� complementary� to� the�hydro�regime�in�Colombia.7�Wind�power�appears�to�be�available�when�its�contribution�to� the�national� grid� is�most�needed,� that� is,� during� the�dry�periods� and� to� an� extent�during�the�early�evening�when�demand�peaks.�
Large�scale�droughts�could�affect�Colombia’s�interconnected�power�system�due�to�its�high�reliance�on�hydropower.�Historically,�critical�drought�conditions�are�linked�to�El�Niño�events,�such�as�those�of�1991–1992�and�2002–2003.�Existing�power�generation�data� from� Jepírachi� (for� the� period� from� February� 2004� to� March� 2009)� and� wind�velocity�records�data�from�Puerto�Bolívar�were�extended�to�cover�the�period�from�1985�to� 2008� to� assess� wind� generation� capacity� during� drought� periods.� The� analysis�considered� four� rivers� with� substantial� hydropower� development:� Guavio,� Nare,�Cauca,�and�Magdalena.�The�most�severe�droughts�in�these�basins�correspond�to�the�El�Niño�period� from�April�1991� to� July�1992�when�strict�energy�rationing�occurred,�and�from�April�1997�to�May�1998�when�pool�prices�reached�very�high�spot�prices,�forcing�regulatory�changes�in�the�market.�During�these�periods�the�estimated�generation�from�wind� was� well� above� the� mean� value.� That� is,� during� periods� of� extreme� drought�associated� with� El� Niño,� wind� energy� from� northern� Colombia� was� above� average.�This�analysis�is�described�in�detail�in�Appendix�6.�
Complementarity�was�also�explored�by�analyzing� the� joint�operation�of�a� simple�system� consisting� of� a�wind� farm� operating� in� tandem�with� a� hydropower� plant� of�similar�size�for�each�of�the�rivers�studied�and�for�a�range�of�reservoir�sizes.�The�analysis�is� summarized� for� each� of� the� rivers� and� is� also� described� in� Appendix� 6.� Results�suggest� that� firm� energy� from� the� joint� operation� of� wind� and� hydropower� plants�surpasses� the� isolated�operation�of� the�hydropower�plant�and�of� the�wind�farm.�This�result� holds� for� a� wide� range� of� possible� reservoir� sizes� studied.� The� strong�complementarity�that�the�joint�operation�of�wind�and�hydropower�plants�exhibits�has�not�been�recognized�by�the�current�regulatory�system�adopted�by�Colombia.�
Options to Address Barriers to Entry
Despite� the� resource� endowment� and� strategic� advantages,� under� current�circumstances�wind�based�generation�faces�considerable�obstacles�to�participate�in�the�nation’s� power� mix.� Key� obstacles� (described� in� the� first�stage� report8)� include� the�current� relatively� high� capital� intensity� and� the� structure� of� the� regulatory� system,�which� does� not� acknowledge�wind’s� potential� firm� capacity.9� Specifically,� there� is� a�
SKU_18504_Wind_Energy_Colombia_6-17-10.pdf 15SKU_18504_Wind_Energy_Colombia_6-17-10.pdf 15 6/17/2010 12:32:07 PM6/17/2010 12:32:07 PM

xvi Executive Summary
mechanism�in�place�that�remunerates�firm�energy10�(through�auctions),�in�which�wind�power� currently� cannot� participate.� The� first� stage� report� identifies� barriers� that�nonconventional� renewable�energy� sources� face� in� the� country�and�proposes�various�sets�of�policy�options�that�may�lead�to�a�wide�market�entry.�
There� is� a�wide� range� of� potential� instruments� through�which� governments� can�guide� the� functioning� of� power� markets.� Many� of� these� instruments� would� be�applicable� to� the� energy� sector� in�Colombia.�However,� only� a� subset� of� options�was�explored�in�detail� (those�that�are� in�agreement�with�the�existing�regulatory�system�in�Colombia�and�have�the�effect�of�changing�the�financial�results�for�a�potential�investor):��
� Access� international�financial� instruments�to� internalize�global�externalities� in�national� and� private� decisions.� The� government� can� play� an� active� role� in�promoting�access� to� financial� instruments�aimed�at�reducing�GHG�emissions�through:�
o Active�participation� in� the�CDM� by�engaging� in� the�global� carbon�market.�This�is�already�mainstreamed�into�the�environmental�policy�in�Colombia,�but�it�could�be�further�strengthened�within�the�energy�policy;�and�
o Access�to�multilateral�soft� loans�earmarked�for�alternative�energies�or�other�concessionary� funding� sources� for� low� carbon� investments� such� as� the�Clean�Technology�Fund�(CTF).�
� Target� subsidies� through� government� fiscal� mechanisms.� The� government�could�utilize�fiscal�measures�for�the�benefit�of�potential�investors.�Specifically,�the�mechanisms�identified�are:�
o Reduction� in� income� tax.� As� previously� indicated,� tax� exemptions� or�reductions� are� policy� mechanisms� to� guide� investment� toward� areas� of�policy�interest.�From�the�investor’s�point�of�view,�such�policies�are�tools�to�improve�the�after�taxes�returns;�and�
o Exemptions� from�system�charges.�The�government�could�use�the�regulatory�system� to� reduce� or� eliminate� charges� paid� for� automatic� generation�control,� environmental� charges,�and/or�contributions� to� the�Fund� for� the�Electrification�of�Off�grid�Regions�(FAZNI).�
� Reform� the� regulatory� system.� The� regulatory� system� should� be� adjusted� to�promote� a� level� playing� field� for� wind� power,� and� to� guide� the� country�toward�low�carbon�intensity�development.�The�existing�regulatory�system�has�developed�mechanisms�to�steer�the�market�in�order�to�provide�a�more�resilient�interconnected�system�(measured�by� its�capacity� to�deliver� the�demand�even�during� the� most� difficult� hydrological� conditions).� In� doing� so,� Renewable�Energy� Technologies� (RETs)� have� not� received� adequate� compensation� for�their�contribution.�This�situation�could�be�remedied�by:�
o Adjustment� of� the� reliability� charge.� Colombia� has� developed� a� financial�mechanism� to� produce� an� economic� signal� to� investors� as� a� price�premium�on�reliable�installed�power�capacity.�Unfortunately,�the�existing�regulation�does�not�have�clear�rules�to�assess�the�potential�contribution�of�wind� energy� to� the� overall� reliability� of� the� interconnected� system� and�
SKU_18504_Wind_Energy_Colombia_6-17-10.pdf 16SKU_18504_Wind_Energy_Colombia_6-17-10.pdf 16 6/17/2010 12:32:07 PM6/17/2010 12:32:07 PM

Executive Summary xvii
thus� favors� conventional� power� plants.� In� practice� this� discriminatory�treatment�has�been�identified�as�a�major�barrier�to�further�investments�in�the�wind�sector;�
o In� relation� to� the� above,� an� alternative� policy� option� analyzed� is� the�possibility� of� reducing� or� eliminating�Real�Equivalent�Cost� of�Capacity�Charge�(CERE)�payment�obligations�for�certain�RETs,�as�an�extension�of�the�existing�option�for�small�scale�investments;11�and�
o The� regulatory� system�could�also�be� adjusted� to�correct�market� failures� by�creating� charges� and� payments� to� adjust� for� externalities.� To� correct� the�economic� signal� for� environmental� externalities� with� impacts� on� local�communities,� ecosystems� and� economic� sectors,� a� sustainability� charge�(green� charge)� has� been� proposed.�Highly� polluting� technologies�would�be�charged�while�clean�technologies�would�receive�a�payment,�making�the�system�cost�neutral�to�the�government.�
As�found�in�discussions�with�decision�makers�and�high�level�policy�advisors,�the�selected� options� are� consistent�with� the� existing� regulatory� system� in� Colombia� and�agreeable� to� the�key� stakeholders� for� further�analysis.�This�analysis� could� likely� take�place�when� the�government� further� fine�tunes� its�decision�on�policy� instruments�and�policy�options�to�guide�the�power�sector�in�the�future.�
Impact of Policy Options
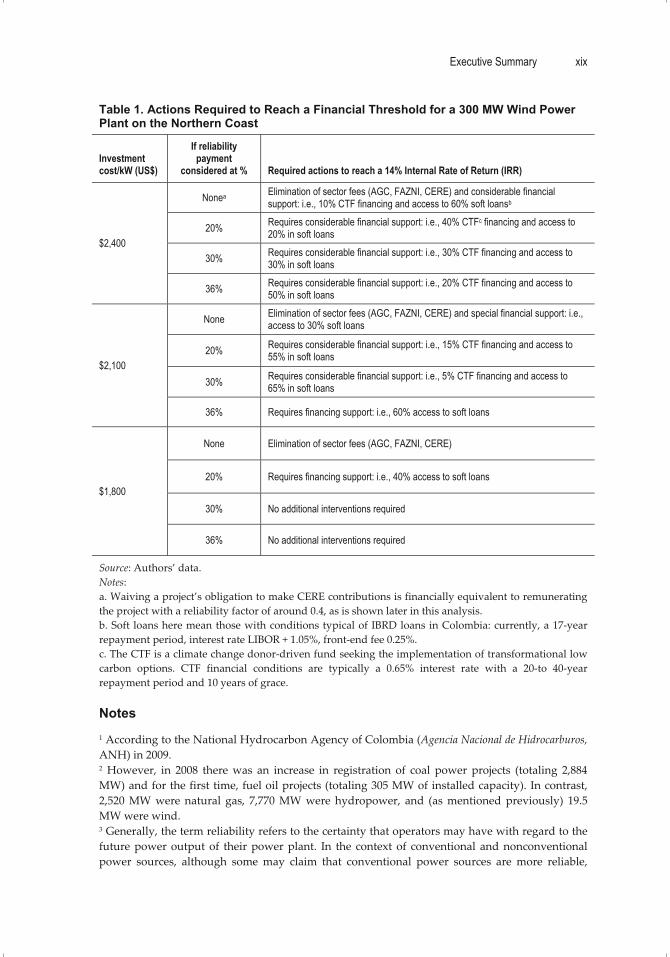
The� assessment� focuses� on� the� identification� of� policy� options� (government�intervention)� that� would� enable� a� wind� power� plant� to� reach� a� 14� percent� rate� of�financial� return� (independent� investor� decision).� The�main� results� of� the� assessment�can� be� found� in� table� 1.� The� table� also� summarizes� the� results� of� applying� different�options� to�a�300�MW�wind�power�project,�assuming� three� investment�costs.�For�each�investment�cost,�three�scenarios�are�described,�depending�on�the�reliability�factor�used�to�recognize� the�project’s�contribution� to� firm�energy�during�dry�periods.�The�values�include�a�worst�case�assessment�of�firm�energy�contribution�(reliability�factor�of�0.20),�an�intermediate�value�(reliability�factor�of�0.30),�and�a�moderate�estimate�of�the�reliable�firm�energy�(0.36).�
Main�results�of�the�impact�assessment�of�the�policy�instruments�are:��
� The� single� most� effective� policy� instrument� to� promote� wind� power� in�Colombia�is�the�granting�of�access�to�reliability�payments,�recognizing�the�firm�energy� and� complementarity� offered� by� wind.� The� implementation� of� this�policy� option� is� relatively� easy� to� incorporate� into� the� existing� regulatory�system.�
� For�new�wind�power�plants�with�costs�in�the�range�of�$1,800/kW�installed,�the�adoption�of�the�reliability�payments�is�enough�to�attract�investors�operating�in�wind�fields�with�similar�characteristics�to�that�found�in�Northern�Guajira.�
� Higher�capital�costs�require�access�to�concessionary�financial�conditions,�such�as�those�provided�under�the�CTF�or�fiscal�incentives.�
SKU_18504_Wind_Energy_Colombia_6-17-10.pdf 17SKU_18504_Wind_Energy_Colombia_6-17-10.pdf 17 6/17/2010 12:32:07 PM6/17/2010 12:32:07 PM

xviii Executive Summary
Lessons Learned
The�principal�lessons�learned�from�this�study�are�as�follows:�
� Wind�powered�power�plants�are�experiencing�improvements�in�efficiency�and�reductions� in� operation� and� maintenance� costs.� Moreover,� since� 2008�investment� costs� have� decreased,� returning� to� the� expected� technology�maturing� behavior� of� cost� reductions�with� time,� a� trend� that� is� expected� to�continue.�
� In�certain� locations,� such�as�northern�Colombia,�wind�resources�are�plentiful�and� could� provide� substantial� complementarity� to� hydro�based� power�systems.�
� Under� existing� conditions� wind� is� not� a� competitive� technology� option� in�Colombia.�Of�the�several�barriers�found,�the�most�relevant�is�the�difficulty�in�accessing�payments�for�wind’s�contribution�to�firm�energy.�
� Governments� have� a� wide� range� of� policy� instruments� and� policy� options�available�to�promote�RET.�
� To�foster�wind�resources,�governments�should�strengthen�wind�data�collection�as�a�public�service,�improve�access�to�research�and�technology�developments,�and�modernize�grid�access�to�wind�power.�
� Although� the� analysis� has� centered� on� Colombia� and� its� energy� sector,� the�approach� and� main� results� are� applicable� to� other� countries� relying� on�hydropower.�
� In� summary,� under� existing� conditions� wind� farms� are� not� financially�attractive�in�Colombia�even�considering�the�drop�in�investment�costs�recorded�during�2009.�However,�wind�investments�would�become�financially�attractive�if�the�benefits�of�reliability�payments�are�extended�to�wind�power,�even�under�current� investment� costs.� The� government� has� other� multiple� policy�instruments�to�steer�independent�investors�toward�RETs.�Adopting�several�of�these�options,� as�detailed� in� the� report,� seems� relatively� simple� and�will�not�distort� the� market.� Improving� the� conditions� for� market� entry� of� the� wind�option� will� serve� to� prepare� the� sector� for� the� anticipated� improvement� of�conditions�as�investment�costs�for�wind�decrease�over�time.�
� Finally,�deployment�of�the�wind�option�would�help�the�sector�to�strengthen�its�climate� resilience� and� be� better� prepared� to� face� climate� variability,�without�increasing�its�carbon�footprint.�
SKU_18504_Wind_Energy_Colombia_6-17-10.pdf 18SKU_18504_Wind_Energy_Colombia_6-17-10.pdf 18 6/17/2010 12:32:07 PM6/17/2010 12:32:07 PM
Executive Summary xix
Table 1. Actions Required to Reach a Financial Threshold for a 300 MW Wind Power Plant on the Northern Coast
Investment cost/kW (US$)
If reliability payment
considered at % Required actions to reach a 14% Internal Rate of Return (IRR)
$2,400
Nonea Elimination of sector fees (AGC, FAZNI, CERE) and considerable financial support: i.e., 10% CTF financing and access to 60% soft loansb
20% Requires considerable financial support: i.e., 40% CTFc financing and access to 20% in soft loans
30% Requires considerable financial support: i.e., 30% CTF financing and access to 30% in soft loans
36% Requires considerable financial support: i.e., 20% CTF financing and access to 50% in soft loans
$2,100
None Elimination of sector fees (AGC, FAZNI, CERE) and special financial support: i.e., access to 30% soft loans
20% Requires considerable financial support: i.e., 15% CTF financing and access to 55% in soft loans
30% Requires considerable financial support: i.e., 5% CTF financing and access to 65% in soft loans
36% Requires financing support: i.e., 60% access to soft loans
$1,800
None Elimination of sector fees (AGC, FAZNI, CERE)
20% Requires financing support: i.e., 40% access to soft loans
30% No additional interventions required
36% No additional interventions required
Source:�Authors’�data.�Notes:��a.�Waiving�a�project’s�obligation�to�make�CERE�contributions�is�financially�equivalent�to�remunerating�the�project�with�a�reliability�factor�of�around�0.4,�as�is�shown�later�in�this�analysis.�b.�Soft� loans�here�mean�those�with�conditions�typical�of�IBRD�loans�in�Colombia:�currently,�a�17�year�repayment�period,�interest�rate�LIBOR�+�1.05%,�front�end�fee�0.25%.�c.�The�CTF�is�a�climate�change�donor�driven�fund�seeking�the�implementation�of�transformational�low�carbon� options.� CTF� financial� conditions� are� typically� a� 0.65%� interest� rate� with� a� 20�to� 40�year�repayment�period�and�10�years�of�grace.��
Notes �1�According�to�the�National�Hydrocarbon�Agency�of�Colombia�(Agencia�Nacional�de�Hidrocarburos,�ANH)�in�2009.�2�However,� in� 2008� there�was� an� increase� in� registration� of� coal� power� projects� (totaling� 2,884�MW)�and�for�the�first�time,�fuel�oil�projects�(totaling�305�MW�of�installed�capacity).�In�contrast,�2,520�MW�were� natural� gas,� 7,770�MW�were�hydropower,� and� (as�mentioned�previously)� 19.5�MW�were�wind.�3�Generally,�the�term�reliability�refers�to�the�certainty�that�operators�may�have�with�regard�to�the�future�power�output�of� their�power�plant.� In� the� context�of� conventional� and�nonconventional�power� sources,� although� some�may� claim� that� conventional� power� sources� are� more� reliable,��
SKU_18504_Wind_Energy_Colombia_6-17-10.pdf 19SKU_18504_Wind_Energy_Colombia_6-17-10.pdf 19 6/17/2010 12:32:07 PM6/17/2010 12:32:07 PM

xx Executive Summary
�others� show� that� their� reliability� is� hampered� by� the� sudden� shutdown� of� a� power� plant.�Alternatively,�nonconventional�renewable�power�plants� (such�as�wind�farms)�are�claimed�to�be�highly�reliable�because�wind�turbines�do�not�all�shut�down�simultaneously�and�instantaneously.�As�explained�in�this�document,�this�is�not�a�concept�that�has�been�integrated�in�the�energy�market�in�Colombia.� It� should�be�noted� that� in� this�document� and� for� the� case� of�Colombia,� the� term�reliability�is�necessarily�related�to�the�reliability�payment�and�the�firm�power�output�that�power�plants� can� produce� during� dry� periods� and� in� times� of� drought� (this� is� further� explained�throughout�the�document).�4�However,�current�technical�constraints�do�not�allow�a�system�to�be�fully�based�on�wind�power.�5�The�level�of�emissions�of�the�sector�is�well�below�the�average�in�the�United�States,�the�European�Union,� Canada,� and�Mexico� (0.35� ton� CO2e/MWh).� Some� power� plants� that� utilize� renewable�energies�have�already�tapped�into�the� international�carbon�trade�(Jepírachi�Wind�Farm,�Amoyá�Run�of�River� Power� Plant)� at� an� individual� level,� and� new�mechanisms� are� being� developed�globally�to�promote�low�carbon�development�paths.�6�Lawrence�Berkeley�National�Laboratory�(LBNL)�estimates�that�this�drop�in�costs�could�be�due�to�the� following:� (a)� O&M� costs� generally� increase� because� as� turbines� age,� component� failures�become�more� common;� (b)� as�manufacturer�warranties� expire,� projects� installed�more� recently�with�larger�turbines�and�more�sophisticated�designs�may�experience�lower�overall�O&M�costs�on�a�per�MWh�basis;�and�(c)�project�size.�To�normalize�for�factors�(a)�and�(b)�above,�LBNL�produces�other� figures�and�analyses� that� can�be� found� in� the�original�publication�but�nonetheless� reveal�O&M�cost�declines.�7�The�analysis�is�based�on�Jepírachi’s�operational�record�and�wind�data�in�meteorological�stations�in�northern�Colombia.�8�Vergara�et�al.,�2008.�9�Note�that�the�firm�capacity�of�renewable�energy�is�the�capacity�of�conventional�sources�replaced,�such� that� demands� can� be� met� with� a� specified� reliability.� The� firm� capacity� of� a� renewable�source�depends�on�the�correlated�variations�in�demands�and�renewable�supplies�(Barrett�2007).�10�Firm�energy�is�defined�as�the�maximum�monthly�energy�that�can�be�produced�without�deficits�during� the� analysis� period� which� includes� El� Niño� occurrences� (this� is� further� explained�throughout�the�document).�11� It� should� be� noted� that� simultaneously� allowing� for� reliability� charges� and� waiving� CERE�payments� is� not� recommended.� It� would� imply� a� logical� contradiction� because� funds� for� the�reliability�charge�come�from�CERE.�
SKU_18504_Wind_Energy_Colombia_6-17-10.pdf 20SKU_18504_Wind_Energy_Colombia_6-17-10.pdf 20 6/17/2010 12:32:08 PM6/17/2010 12:32:08 PM

1
CHAPTER �1 �
Introduction�
Context
This�report�constitutes�the�second�phase�of�an�effort�to�identify�and�address�barriers�to�the� deployment� of� wind� energy� in� Colombia’s� power� sector.� The� first� phase� was�reported� in� a� document� entitled� Review� of� Policy� Framework� for� Increased� Reliance� on�Renewable� Energy� in� Colombia,� completed� in� February� 2008� and� discussed�with� high�level�energy�authorities� in�Colombia.� It�concluded�that�(i)�Colombia�has�a�substantial�nonconventional�renewable�energy�resource�endowment,�in�particular�wind�and�solar�but� also� significant� prospects� for� geothermal,� that� complements� the� existing� large�hydropower�potential;� (ii)�nonconventional�energy�options� face� important�policy�and�regulatory� barriers� that� prevent�market� entry;� (iii)� globally,� several� nonconventional�renewable� energy� options� are� becoming� financially� more� attractive� as� a� result� of� a�normal� maturity� process� and� commercialization� of� low� carbon� options;� (iv)�internalizing� global� and� local� externalities� increases� the� competitiveness� of� selected�nonconventional�sources;�and� (v)�options�are�available� to�decision�makers� to�address�barriers�to�the�expansion�of�nonconventional�power�in�the�Colombian�power�mix.�The�report�was�designed� to� explore� the� impact�of� options� identified� for� addressing� these�barriers.�
The�wind� regime� in�Colombia�has�been� rated�among� the�best� in�South�America.�Offshore�regions�of�the�northern�part�of�Colombia�have�been�classified�with�class�seven�winds� (winds� over� nine�meters� per� second� [m/s]� at� heights� of� 50�meters).� The� only�other�region�in�South�America�with�such�high�wind�availability�is�the�Patagonia�region�of�Chile�and�Argentina.�Colombia�has�an�average�estimated�wind�power�potential�of�18�GW�in�the�La�Guajira�region,�enough�to�meet�the�national�power�demand�twice�over�(Pérez�and�Osorio�2002).�However,� the�country�only�has�an� installed�capacity�of�19.5�MW�of�wind�energy�(Jepírachi�Project,�supported�by�the�Bank)�with�a�few�additional�projects� under� consideration,� including� a� 200�MW�project� in� Ipapure.� Consequently,�wind� power� today� represents� a� small� fraction� of� the� installed� capacity.� In� 2008� the�installed� capacity� in� Colombia� (13.4� GW)� was� 67� percent� hydro� (including� small�hydro),�27�percent�natural�gas,�5�percent�coal,�and�0.3�percent�wind�and�cogeneration.�Figure� 1.1� illustrates� the� installed� capacity� per� technology� type.1� The� total� annual�electricity�demand�that�same�year�was�54�TWh�(UPME�2009).�
Colombia� also� has� substantial� reserves� of� natural� gas� and� coal,� which� could� be�used� to�generate�power.�The�natural�gas� reserves� in� 2007�were� seven� tera� cubic� feet,�including�proven�and�unproven�reserves�(Ministry�of�Mines�and�Energy�2008).�The�La�Guajira�region�of�Colombia�supplies�most�of�the�demand,�62�percent�in�2007,�compared�to�the�next�highest�supplier�(Cusiana)�with�26�percent.�
SKU_18504_Wind_Energy_Colombia_6-17-10.pdf 21SKU_18504_Wind_Energy_Colombia_6-17-10.pdf 21 6/17/2010 12:32:08 PM6/17/2010 12:32:08 PM

2 World Bank Study
Figure 1.1 Installed Capacity per Technology Type
�Source:�UPME�2009.�
Colombia’s�coal�reserves�are�estimated�at�seven�billion�tons�(or�about�100�years�of�
production� at� the� present� mining� rate).� These� reserves� are� mostly� located� in� the�northern�part�of�the�country�and�are�the�largest�coal�reserves�in�South�America.�Most�coal�mined�is�anthracite,�with�very�low�ash�and�sulfur�content,�ideal�for�exports�to�the�European�market.�Current�production� is� 59�MMT� (42�MTOE),�with�plans� to� increase�production�to�100�MMT�by�2010.2�Most�of�Colombia’s�coal�production�is�exported.�Of�the�coal�used�internally�(2.4�MMT�in�2000),�more�than�75�percent�goes�to�industrial�uses�and�the�rest�goes�to�the�power�sector�(equivalent�to�378�KTOE�or�~4,400�GWh).�
Colombia’s� power� sector� is� maturing� quickly,� with� relative� stability� in� its�regulations,�an�unbundled�system,�and�a�dispatch�mechanism�that�closely�resembles�a�well�functioning� competitive� market.� Competition� is� promoted� and� tools� have� been�designed�to�attract�cost�effective�capacity�expansions�that�would�promote�reliability3�of�service.�(A�fuller�description�of�the�system�and�its�dispatch�mechanism�was�included�in�the�stage�one�report.)�
However,� the� interconnected� system,� if� unguided,� is� not� likely� to� promote�nonconventional�renewable�energy�resources�such�as�wind,�but�rather�maintain�a�high�capacity� share�of�hydropower�or� alternatively�move� toward�a�more� carbon�intensive�energy� resource�mix� (likely� reliant� on� abundant� coal� reserves).� In� the� latter� case� this�would� result� in� an� increase� in� the� carbon� footprint� of� the� economy� from� its� current�relatively�low�level�of�GHG�emissions.4�
The� analysis� focuses� on� wind� power.� Wind� is� currently� the� least�cost�nonconventional� renewable� energy� alternative.� There� is� also� the� possible�complementarity�of�the�wind�regime�with�periods�of�low�hydrology,�which�is�further�explored�in�this�report.�The�World�Bank�was�an�early�supporter�of�the�wind�option�in�Colombia�through�its�participation�in�the�Prototype�Carbon�Fund�of�the�Jepírachi�Wind�Power�Plant�in�the�province�of�La�Guajira.�
Hydropower 8994 MW
Natural gas 3702 MW
Coal 700 MWWind 18 MW
Other 26 MW
SKU_18504_Wind_Energy_Colombia_6-17-10.pdf 22SKU_18504_Wind_Energy_Colombia_6-17-10.pdf 22 6/17/2010 12:32:08 PM6/17/2010 12:32:08 PM

Wind Energy in Colombia 3
Structure of the Report
After� the� introduction,�Chapter�2� summarizes� the�main� findings�of� the� first�phase.� It�describes� Colombia’s� energy� profile� and� presents� the� main� barriers� that� limit� the�development� of� nonconventional� renewable� energy� sources.� Chapter� 3� presents� a�comprehensive�comparison�of�37�energy�technologies�through�levelized�cost�analyses.�The�analysis�permits�the�identification�of�the�technologies�most�likely�to�participate�in�the� future� expansion� of� the� interconnected� system.� It� also� studies� whether� CO2�revenues� change� the� least�cost� capacity� ranking.� Chapter� 4� summarizes� the� cost�evolution�of�wind�energy�units�over�time�and�provides�an�overview�of�the�trends�that�define� the� future�of� this� technology.�Chapter�5�presents� the� complementarity�of� joint�operation� of�wind� and� hydro� in�Colombia� and� explores� the� possible� contribution� of�wind� to� firm� energy.� Chapter� 6� introduces� different� policy� options� to� facilitate� the�market�entry�of�wind�power,�and�Chapter�7� reviews� the�effectiveness�of� the�selected�policy�options�in�creating�the�adequate�incentives�(that�is,�expected�financial�returns�on�equity)�to�attract�potential�investors.�Key�findings�and�conclusions�are�summarized�in�the�Chapter�8.�
Notes �1� In� 2008� there�was� an� increase� in� the� registration� of� prospective� coal� power� projects� (totaling�2,884�MW)�and,�for�the�first� time,�of�fuel�oil�projects�(totaling�305�MW�of�installed�capacity).� In�contrast,� 2,520� MW� were� natural� gas,� 7,770� MW� were� hydropower,� and� (as� mentioned�previously)�19.5�MW�were�wind.�2�Although�there�are�plans�to�expand�production,�there�is�also�a�holdback�based�on�fears�that�this�would�cause�a�drop�in�coal�prices�because�Colombia�is�such�an�important�player�in�the�world’s�thermal�coal�market.�3�Generally,�the�term�“reliability”�refers�to�the�certainty�that�operators�may�have�with�regard�to�the� future� power� output� of� their� power� plants.� In� the� context� of� conventional� and�nonconventional�power�sources,�although�some�may�claim�that�conventional�power�sources�are�more�reliable,�others�show�that�their�reliability�is�hampered�by�the�sudden�shutdown�of�a�power�plant.�Alternatively,�nonconventional�renewable�power�plants�(such�as�wind�farms)�are�claimed�to� be� highly� reliable� because� wind� turbines� do� not� all� shut� down� simultaneously� and�instantaneously.�As�explained�in�this�document,�this�is�not�a�concept�that�has�been�integrated�in�the� energy�market� in� Colombia.� It� should� be� noted� that� in� this� document� and� for� the� case� of�Colombia,�the�term�“reliability”�is�necessarily�related�to�the�“reliability�payment”�and�the�“firm�power”�output�that�power�plants�can�produce�during�dry�periods�and�in�times�of�drought�(this�is�further�explained�throughout�the�document).�4� The� sector’s� level� of� emissions� is�well� below� the� average� in� the�United� States,� the� European�Union,� Canada,� and�Mexico� (0.35� ton� CO2e/MWh).� Some� power� plants� that� utilize� renewable�energies�have�already�tapped�into�the� international�carbon�trade�(Jepírachi�Wind�Farm,�Amoyá�Run�of�River� Power� Plant)� at� an� individual� level,� and� new�mechanisms� are� being� developed�globally�to�promote�low�carbon�development�paths.��
SKU_18504_Wind_Energy_Colombia_6-17-10.pdf 23SKU_18504_Wind_Energy_Colombia_6-17-10.pdf 23 6/17/2010 12:32:08 PM6/17/2010 12:32:08 PM
4
CHAPTER �2 �
Summary�of�Findings��from�First�Stage�Report:�
Nonconventional�Renewable�Energy�Barrier�Analysis�
his�chapter�summarizes�the�results�of�the�first�stage�of�the�ESMAP�funded�Review�of�Policy�Framework�for�Increased�Reliance�on�Renewable�Energy�in�Colombia.�Its�
objective�was� to� identify� barriers� to� the� development� of� nonconventional� renewable�energy�resources�in�Colombia.�Large�hydro�is�not�included�as�part�of�nonconventional�energy� resources� because� it� is� a� well�established� option� in� Colombia.� Large�hydropower� is� also� a� relatively� low�cost� renewable� energy� source� and� already�constitutes� the�bulk�of� the�base� load� in� the�power�sector.�This�document�emphasizes�nonconventional�renewable�energy�sources.�
Colombia� is� a� net� energy� exporter.� Colombia� is� not� one� of� the� world’s� leading�energy�producers,�but� it� is�a�net�energy�exporter.�Colombia’s�demand�for�energy�has�been�increasing�over�the�past�decade�and�is�expected�to�grow�at�an�average�of�about�3.5�percent�per�year�through�2020�(UPME�2009).�The�country’s�total�energy�production�in�2006�was� 3.3�QUADS� (quadrillion1�BTU),2�while� consumption�was�1.2�QUADS,� from�which�electricity�consumption�stood�at�0.14�QUADS.3�This�highlights�the�energy�export�nature�of�the�Colombian�economy.�The�difference�between�its�energy�production�and�consumption�has�been�due�mostly�to�oil�and�large�coal�exports.�
The� country� is� a� modest� energy� user� and� CO2� emitter.� The� power� sector� in�Colombia�already�has�a�very�low�carbon�footprint�(0.35�tons/MWh�generated4).�Energy�demand�is�characterized�by�growing�requirements�in�the�transport�sector,�followed�by�the�industrial�and�domestic�sectors.�The�average�power�use�per�capita�is�923�kilowatt�hours�(kWh)/year.�National�carbon�dioxide�(CO2)�emissions�are�59.4�million�metric�tons�(MMT),�or�1.3�tons�of�CO2�(tCO2)/capita,� less�than�half�the�world�average.�Colombia’s�energy� intensiveness� is� 0.2�CO2/GDP� (PPP)� (kg�CO2/2000�US$�PPP),� according� to� the�International�Energy�Agency�(IEA)�in�2006.5�This�is�much�lower�than�that�of�countries�in�Europe�and�North�America.�
Hydropower� is� the� dominant� source� of� energy� and� is� likely� to� continue� to�characterize� Colombia’s� power� sector� for� the� foreseeable� future.� Currently,� about� 64�percent� of� capacity� and� 81� percent� of� generation� are� hydro� based.� A� generous�hydrological� regime� and� a� favorable� orography� provide� the� basis� for� a� large�
T
SKU_18504_Wind_Energy_Colombia_6-17-10.pdf 24SKU_18504_Wind_Energy_Colombia_6-17-10.pdf 24 6/17/2010 12:32:08 PM6/17/2010 12:32:08 PM

Wind Energy in Colombia 5
hydropower� potential.� The� most� recent� bid� for� power� supply� resulted� in� an�overwhelming� supply� of� new� hydropower� plants� to� meet� the� projected� increase� in�demand�in�the�immediate�future.�
A� largely� hydro�based� power� system�may� be� susceptible� to� anticipated� climate�variability�affecting�rainfall�patterns.�A�projected� increase� in� the� intensification�of� the�water� cycle� and� the� possible� intensification� of� extreme� events� (El� Niño�Southern�Oscillation� [ENSO]� and� La�Niña)� associated�with� temperature� dipoles� on� the� Pacific�coast� of� Colombia� may� raise� the� vulnerability� of� the� power� sector� by� affecting� the�reservoir�capacity�of�hydropower�based�plants.�It�is�therefore�prudent�to�examine�how�the�sector’s�climate�resilience�could�be�strengthened.�
Colombia’s� oil� reserves� are� more� limited.� The� country� has� long� relied� on� a�generous�endowment�of�fossil�fuels,�oil,�coal,�and�gas�to�meet�domestic�energy�needs�and� to� contribute� substantially� to� the� balance� of� trade� in� international� markets.�However,� recent� discoveries� have� expanded� reserves� in� number� of� years� of� supply,�which�until�recently�had�been�estimated�at�eight�years�(Ministry�of�Mines�and�Energy�2008).�Natural�gas�supplies�are�sufficient� for�27�years�of�supply�at� the�current� rate�of�consumption;� however,� bottlenecks� in� the� gas� distribution� system� limit� its� use� in�several� areas�of� the� country.�The�main� transportation� restrictions�will�be� removed� in�the� 2010–2012� period� with� new� pipelines� and� transport� loops� that� are� under�construction�and�that�could�facilitate�natural�gas�transport�from�the�main�fields�to�the�large�natural�gas�markets.�
Prior�to�the�use�of�nonconventional�renewable�resources�in�the�power�sector,�there�is�a�need� to�address�a�number�of�barriers� that� impede� the�wide�deployment�of� these�resources.� These� include:� capital� intensity,� local� financial� market� limitations,� lack� of�regulations� and� regulatory� uncertainty,� lack� of� adequate� data� to� assess� resource�availability,� lack� of� clear� rules� for� nonconventional� energy� sources,� bias� toward�conventional�technologies�(for�example,�with�the�firm�energy�reliability�payment),�and�limited�strategic�planning.�
The�Government�of�Colombia�(GOC)�can�play�a�significant�role�in�facilitating�the�entry� of� nonconventional� energy� sources.� Policy� options� include:� (i)� developing� a�strategic�energy�plan�beyond�10�years�that�includes�nonconventional�energy�resources;�(ii)�similarly,�adopting�least�cost�planning�that�includes�environmental�and�social�costs�in�decision�making;�(iii)�modifying�the�regulatory�framework�to�address�obstacles�that�prevent� a� level� playing� field� for� nonconventional� renewable� power� resources;� (iv)�facilitating� information� sharing� on� wind� endowment;� and� (v)� facilitating� access� to�financial�instruments�available�under�climate�change�investment�funds.�
This�report�focuses�on�alternatives�to�address�(counter)�the�relatively�higher�capital�intensity� of� the� wind� power� option,� which� may� result� in� a� more� attractive� energy�source� in� the� country,� provided� that� certain� potential� regulatory� framework�modifications�are�made.��
SKU_18504_Wind_Energy_Colombia_6-17-10.pdf 25SKU_18504_Wind_Energy_Colombia_6-17-10.pdf 25 6/17/2010 12:32:08 PM6/17/2010 12:32:08 PM

6 World Bank Study
Notes �1�1015;�SI�prefix�peta�(P).�2�3.3�QUADS�or�85�MTOE�(IEA�2006).�3�0.14�QUADS�or�42�TWh�(IEA�2006).�4�As�estimated�in�the�recently�completed�PDD�for�the�Amoyá�Environmental�Services�Project.�5�http://www.iea.org/Textbase/stats/indicators.asp?COUNTRY_CODE=CO&Submit=Submit.�
SKU_18504_Wind_Energy_Colombia_6-17-10.pdf 26SKU_18504_Wind_Energy_Colombia_6-17-10.pdf 26 6/17/2010 12:32:08 PM6/17/2010 12:32:08 PM

7
CHAPTER �3 �
Cost�Comparison�of�Alternative�Power�Sources�Based�on�the�
Expansion�Plan�for�2008–2025�
efore�a�detailed�assessment�is�made�of�policy�options�to�facilitate�market�entry�for�wind�power,�this�chapter�provides�a�cost�comparison�of�available�technologies�for�
power�generation,�based�on�the�generation�expansion�plan�for�2008–2025�prepared�by�the�Mines�and�Energy�Planning�Unit�(UPME)�of�the�Colombian�Ministry�of�Mines�and�Energy.� For� this� purpose,� the� analysis� includes� simple� screening� curves� of� 37�power�generation�technologies�to�compare�with�the�results�of�the�wind�option.�
Hydropower�is�the�dominant�source�in�the�National�Interconnected�System�(NIS)�and� is� expected� to� continue� to� be� so� for� the� foreseeable� future.� The� large� base�load�hydro� capacity� is� complemented� today� by� thermal� power,� mostly� from� domestic�natural�gas�fired�power�plants� and�a�much� smaller� amount� from�domestic� coal�fired�power�plants.�
Methodology for Technology Cost Comparison
Due�to�data�availability�restrictions,�the�analysis�is�limited�to�a�simple�static�analysis�to�provide� indicative� values.� Projections� of� increase� or� change� in� capital� cost� of� power�plants�are�beyond�the�scope�of�this�study,�especially�considering�the�rapid�growth�and�volatility� in� capital� costs� experienced� since� the� early� part� of� the� present� decade.�Therefore,� the� most� recent� capital� costs� available� are� used� (2007/2008).� Price�assumptions,� in�line�with�national�projections,�are�made�as�follows:�coal�at�US$35�per�ton,� natural� gas� at�US$4/MBTU,� and� residual� fuel� oil� for� power� plants� at�US$51� per�barrel.�
The�calculation�of�levelized�total�plant�costs�(TPC)�is�based�on�the�“Technical�and�Economic� Assessment� of� Off�grid,� Mini�grid� and� Grid� Electrification� Technologies”�(World�Bank�2007).�The�37�electricity�generation�options� are� listed� in� table� 3.1.�Coal�fired�power�plants�are�considered�as�equipped�with�flue�gas�desulfurization�(FGD)�and�selective� catalytic� reduction� (SCR).� Although� Colombia� currently� does� not� require�FGD,� equipping� coal�fired� power� plants� with� FGD� and� SCR� represents� best�international�practice�even�when� low�sulfur�coal� is�used.� In�addition,�equipping�SCR�and�FGD� is� a� prerequisite� to�make� coal�fired�power�plants� ready� for� carbon� capture�and� storage� (CCS).� Coal�fired� power� plant� options� include� those� that� are�much� less�expensively�made�in�China.�Two�metrics�are�used�to�assess�the�relative�rating,�as�per�
B
SKU_18504_Wind_Energy_Colombia_6-17-10.pdf 27SKU_18504_Wind_Energy_Colombia_6-17-10.pdf 27 6/17/2010 12:32:08 PM6/17/2010 12:32:08 PM

8 World Bank Study
the�procedure�mentioned�above:�the�cost�of�capacity�of�the�plant�per�year�(US$/kW�per�year)�and�the�cost�of�generation�(US$/kWh).� Table 3.1. Power Generation Options Included in the Screening Curve Analyses
Plant Type
Subcritical (SC) coal-fired 300 MW/550MW Diesel 5 MW
Supercritical (SPC) coal-fired 550 MW Hydro 400 MW/1200 MW
Ultra supercritical (USPC) coal-fired 550 MW* Wind 10MW/300 MW
Subcritical (SC) 300 MW/550 MW coal-fired carbon capture and storage (CCS)
Subcritical (SC) Circulating Fluidized Bed (CFB) 300MW/500MW
Supercritical (SPC) coal-fired 550 MW carbon capture and storage (CCS)
Subcritical (SC) Natural Gas Steam 300 MW
Ultra supercritical (USPC) coal-fired 550 MW carbon capture and storage (CCS)
Subcritical (SC) Oil Steam to Coal 300 MW
Integrated Gasification Combined Cycle (IGCC) 300 MW/640 MW
Subcritical (SC) Natural Gas Steam to Coal 300 MW
Integrated Gasification Combined Cycle (IGCC) carbon capture and storage (CCS) 220 MW/555 MW
Subcritical (SC) 500 MW Rehabilitation
Simple Cycle Gas Turbine (GT) 150 MW China subcritical (SC) 300 MW/550 MW
Combined Cycle Gas Turbine (CCGT) 140 MW/560 MW China supercritical (SPC) 550 MW
Combined Cycle Gas Turbine (CCGT) China ultrasupercritical (USPC) 550 MW
Combined Cycle Gas Turbine (CCGT) carbon capture and storage (CCS) 50 MW
China subcritical (SC) 300 MW/SC 550 MW carbon capture and storage (CCS)
Combined Cycle Gas Turbine (CCGT) carbon capture and storage (CCS) 482 MW
China supercritical (SPC) 550 MW carbon capture and storage (CCS)
Fuel Oil Steam 300MW
Source:�Authors’�data.�Notes:� CFB:� Circulating� Fluidized� Bed.� IGCC:� Integrated�Gasification�Combined� Cycle.� CCS:� Carbon�Capture�and�Storage.�CCGT:�Combined�Cycle�Gas�Turbine.�SC:�Subcritical.�SPC:�Supercritical.�USPC:�Ultra�supercritical.�*According� to� the�World�Coal� Institute�website� in� 2009,� new�pulverized� coal� combustion� systems—utilizing� supercritical� and�ultrasupercritical� technology—operate� at� increasingly� higher� temperatures�and�pressures� and� therefore� achieve� higher� efficiencies� and� significant�CO2� reductions� than� those� of�conventional�pulverized�coal�fired�units�(www.worldcoal.org).��
As�of�2006,�nine�coal�fired�power�plants�were� installed� in�Colombia� (totaling�700�MW);�these�were�commissioned�between�1963�and�1999.�Although�it�is�unclear�whether�these�power�plants�have�been�rehabilitated�to�prolong�their�plant�life,�they�are�included�in� the� analysis.� Moreover,� although� a� few� hydropower� plants� operate� at� a� high�capacity� factor�of�around�80�percent,� it� is�assumed� that,�on�average,� the�hydropower�capacity�factor�is�60�percent.�A�40�percent�capacity�factor�is�assumed�for�wind�power.1�
Within�the�screening�curves,�the�electricity�generation�plants�were�ranked�in�order�of�least�levelized�cost�per�kW�for�different�capacity�factors.�The�levelized�cost�analysis�is�done�with�and�without�consideration�of�carbon�revenues.�The�results�are�presented�below.�
SKU_18504_Wind_Energy_Colombia_6-17-10.pdf 28SKU_18504_Wind_Energy_Colombia_6-17-10.pdf 28 6/17/2010 12:32:09 PM6/17/2010 12:32:09 PM

Wind Energy in Colombia 9
Least (Levelized) Cost Comparison
Clearly,�the�low�cost�of�hydropower�in�Colombia�is�evidenced�by�the�high�hydropower�capacity� reserve�of� its�power� system,� in�which�many�hydropower�plants� function� as�base�load.�The�total�hydropower�net�effective�installed�capacity�is�13�GW�with�a�peak�power� demand� at� 9�GW.�With� or�without�CO2e� emission� reduction� revenues,� large�scale�hydropower�is�the�least�cost�power�option.�
The�rehabilitation�of�subcritical�coal�power�plants�and�the�fuel�switch�from�oil�or�natural� gas� to� coal�fired� power� plants� present� the� next� lowest� levelized� costs� at� any�capacity�factor.�However,�these�options�do�not�add�to�installed�capacity.�
The� next� low�cost� option� is� low�cost� manufactured� coal�fired� power� plants,�without� allowance� for� CCS.� Likewise,� Combined� Cycle� Gas� Turbines� (CCGT)� are�among� the� cheapest� technology� options.� Wind� power� generation� under� current�scenarios�and�conditions,�and�even�with�possible�capacity�factors�of�up�to�40�percent,�is�not� among� the� least�cost� choices.� Similarly,� Integrated� Gasification� Combined� Cycle�(IGCC)�and�CCS�technologies�are�also�not�among�the�least�cost�options�in�Colombia.�
The�most� cost�effective�power�generation�options�are�presented� in� tables�3.2�and�3.3.�The�options�presented�are� similar� to� the� current�generation�picture�of�Colombia,�but�with�more� inclusion�of�coal�power�plants�due� to� their� lower�cost.�Abundant�coal�reserves� would� back� up� the� development� of� this� option.� This� assumes� that� the�internalization� of� global� environmental� issues� is� not� considered.� Figures� 3.12� and� 3.2�provide�a�graphic�representation�of�the�results�of�the�analysis.�Figure�3.1�presents�the�results� for� the� aggregate� cost� over� a� year;� this� figure� increases� as� the� capacity� factor�increases� since� it� shows� the� amount� of� power� generated� over� the� year.� Figure� 3.2�presents� the� calculated� generation� costs,� which� decrease� as� the� capacity� factor�increases.���Table 3.2. Least-Cost Capacity Expansion Mix (without CO2e revenue)
Electricity generation Base load Medium load Peak load
Major additions of new capacity
Large and medium hydropower with modest backup requirement of low-cost coal-fired SC, SPC and USPC power plants using most advanced clean coal technology
Large and medium hydropower
Large and medium hydropower
Minor additions of capacity
CCGT and old SC coal power plant rehabilitation using most advanced clean coal technology
CCGT (which could also operate both base load and peaking, as backup)
Gas turbines and diesel
Additional 15% for capacity reserve
Large and medium hydropower Large and medium hydropower
Large and medium hydropower
Source:�Authors’�data.���
SKU_18504_Wind_Energy_Colombia_6-17-10.pdf 29SKU_18504_Wind_Energy_Colombia_6-17-10.pdf 29 6/17/2010 12:32:09 PM6/17/2010 12:32:09 PM

10 World Bank Study
Table 3.3. Suggested Capacity Expansion Mix at US$18 per Ton CO2e
Electricity generation Base load Medium load Peak load
Major new capacity
Large and medium hydropower with modest backup requirement of low-cost coal-fired SC, SPC and USPC power plants using most advanced clean coal technology
Large and medium hydropower and wind power
Large and medium hydropower and wind power
Modest new capacity
CCGT and old SC coal power plant rehabilitation using most advanced clean coal technology
CCGT (which could also operate both base load and peaking, as backup)
Gas turbines and diesel
15% or more capacity reserve
Large and medium hydropower Large and medium hydropower
Large and medium hydropower
Source:�Authors’�data.��
Figure 3.1. Screening Curve for Levelized Total Costs Measured in Cost of Capacity of a Plant per Year (US$/kW-yr) at Different Capacity Factors
�
Source:�Authors’�data.�Note:�Coal�price�US$35/ton;�emission�reductions�US$18/ton�CO2e.��
0
100
200
300
400
500
600
700
10 20 30 40 50 60 70 80 90 100
US$/K
W-y
r
Capacity factor (%)
IGCC CCS 555MW
USPC 550MW CCS
IGCC 640MW
Simple Cycle GT 150 MWSC 550MW
USPC 550MW
CCGT CCS 482MW
China USPC 550MW CCSCCGT 560MW
China USPC 550MW
SC Oil Steam to Coal 300MWSmall Wind 10MW
Wind 300MW
Small to Med Hydro 400MWLarge Hydro 1200MW
SKU_18504_Wind_Energy_Colombia_6-17-10.pdf 30SKU_18504_Wind_Energy_Colombia_6-17-10.pdf 30 6/17/2010 12:32:09 PM6/17/2010 12:32:09 PM

Wind Energy in Colombia 11
Figure 3.2. Screening Curve for Levelized Total Costs at Different Capacity Factors Measured in Terms of Generation Costs (US cents/kWh)
�
Source:�Authors’�data.�Note:�Coal�price�US$35/ton;�Emission�reductions�US$18/ton�CO2e.��
Coal Netback Calculations
For� coal� prices� ranging� up� to�US$60� per� ton,� the� rehabilitation� of� existing� coal�fired�power�plants�(limited�to�a�total�of�700�MW)�is�among�the�least�cost�options�for�adding�capacity.�Rehabilitating�existing�coal�fired�power�plants�is�a�good�option�for�the�range�of�coal�prices�indicated.3�
At�a�price�of�more�than�US$50�per�ton�of�coal,�and�including�US$18�per�CO2e�ton,�new�coal�power�plants�are�not�a� least�cost�option.�Furthermore,� if� low�cost�coal�fired�power� plant4� options� are� excluded,� coal�fired� power� plants� become� the� least�cost�options�only�at�very�low�coal�prices�from�US$10�to�US$20�per�ton.�
0
10
20
30
40
50
60
10 20 30 40 50 60 70 80 90 100
Usce
nt/K
Wh
Capacity factor (%)
IGCC CCS 555MW
USPC 550MW CCS
IGCC 640MW
Simple Cycle GT 150 MW
USPC 550MW
SC 550MW
CCGT CCS 482MW
China USPC 550MW CCS
CCGT 560MW
Small Wind 10MW
Wind 300MW
China USPC 550MW
SC Oil Steam to Coal 300MW
Small to Med Hydro 400MW
Large Hydro 1200MW
SKU_18504_Wind_Energy_Colombia_6-17-10.pdf 31SKU_18504_Wind_Energy_Colombia_6-17-10.pdf 31 6/17/2010 12:32:09 PM6/17/2010 12:32:09 PM

12 World Bank Study
Allowing� for� CO2� revenues� does� not� significantly� change� the� least�cost� capacity�expansion�ranking.�For�analysis�purposes� it� is�assumed�that�CO2e� is�valued�at�US$18�per� ton� for� the� 37�options� (the� results� are� similar� to� those�presented� in� table�A1.2�of�Appendix�1).�For�2007�investment�costs�(base�year�used)�even�at�a�CO2e�price�of�US$50,�wind� power� is� still� not� the� least�cost� option.�Within� this� range� of� revenues,� carbon�credits�fail�to�effectively�affect�the�ranking�of�options,�proving�that�the�CDM�alone�at�the�2009�price�level�is�not�enough�to�promote�alternative�zero�carbon�energy�under�existing� conditions� in� Colombia.� Therefore,� other� policy� options� are� required� to�facilitate�market�entry�for�wind�power.�
From� the� results� of� the� analysis,� and� under� current� and� foreseeable� conditions,�large� hydro� remains� the� best� option� for� power� generation� and� guarantees� a� power�sector�that�is�relatively�low�in�carbon�footprint.�Moreover,�under�the�current�scenario,�coal�seems�an�obvious�backup�option�to�the�base�load.�
Since� this� is� a� limited�estimate,�based�on� secondary�data,� a�more� comprehensive�modeling� exercise� and� impact� analyses� on� low� carbon� growth� should� be� conducted;�this� would� include� all� other� relevant� costs� (for� example,� transportation� costs,�transmission� pipeline� and� distribution� costs,� transaction� costs,� environmental� and�social�costs,�institutional�costs,�logistical�costs,�and�so�forth).�Tools�available�to�perform�this� analysis� include� MARKAL.5� Moreover,� although� not� directly� assessed,� the�deployment� of� renewable� sources,� including�hydro,� reduces� exposure� to�volatility� in�fossil�fuel�prices.��
Notes �1�A� capacity� factor�of� 40�percent� is� assumed:� the�winds�on� the�northern� coast� of�Colombia� are�class�7�and�are�constant.�This�number�has�been�discussed�with�the�utility�that�owns,�maintains,�and�operates�the�only�wind�farm�in�Colombia.�Values�have�been�and�can�be�obtained�in�the�area�(in�a�location�near�the�site�where�a�larger�wind�project�can�be�located).�2� Figure� 3.1� shows� the� cost�per�year�of� operation�of� a�power�plant�operating�at�different�plant�factors.� The� higher� the� plant� factor� the� higher� the� costs� (although� the� cost� per� unit� of� energy�generated�decreases).�On�the�other�hand,�figure�3.2�presents�the�average�generation�costs,�which�decrease�as�the�capacity�factor�increases.�3� In�Colombia,�most� coal�power�plants� are�old� and�have�not�been� retrofitted� (there�has�been�a�focus�on�building�natural�gas�plants,�rather�than�coal�plants).�These�coal�power�plants�could�be�modernized�to�achieve�greater�efficiencies.�4�New�low�cost�coal�fired�power�plants�(imported�from�China,�with�operational�reliability�yet�to�be�defined)�result�in�least�cost;�this�is�especially�true�if�a�supercritical�(SPC)�coal�fired�power�plant�of�550�MW�is�installed.��5�MARKAL�is�a�generic�model�tailored�by�the�input�data�to�represent�the�evolution�over�a�period�of�usually�40�to�50�years�of�a�specific�energy�system�at�the�national,�regional,�state,�provincial�or�community� level.� MARKAL� was� developed� by� the� Energy� Technology� Systems� Analysis�Programme� (ETSAP)� of� the� International� Energy� Agency.� Source:� http://www.etsap.org/Tools/�MARKAL.htm.��
SKU_18504_Wind_Energy_Colombia_6-17-10.pdf 32SKU_18504_Wind_Energy_Colombia_6-17-10.pdf 32 6/17/2010 12:32:09 PM6/17/2010 12:32:09 PM

13
CHAPTER �4 �
Wind�Power�Costs�Outlook�
he�results�of� the�technology�cost�comparison�show�that�under�existing�conditions�(base� year� 2007)� wind� power� is� not� a� least�cost� option� for� power� generation� in�
Colombia,�even�at�a�CO2e�price�of�US$50/ton�and�high�capacity�factors.�However,�wind�power�costs�are�expected�to�decrease�with�time�as�the�technology�matures.�This�chapter�examines�the�trends�in�wind�power�costs�and�performance.��
Technical Viability of Wind Power
In�early�2009�wind�power�installed�capacity�worldwide�reached�121�GW.�Since�the�late�1990s,�wind�power�installed�capacity�has�increased�by�over�20�percent�annually�and�is�expected�to�continue�increasing�in�2009�and�2010�by�similar�magnitudes�(figure�4.1).��
Figure 4.1. World Total Wind Power Installed Capacity (MW)
�Source:�World�Wind�Energy�Association�2009.�
T
SKU_18504_Wind_Energy_Colombia_6-17-10.pdf 33SKU_18504_Wind_Energy_Colombia_6-17-10.pdf 33 6/17/2010 12:32:09 PM6/17/2010 12:32:09 PM
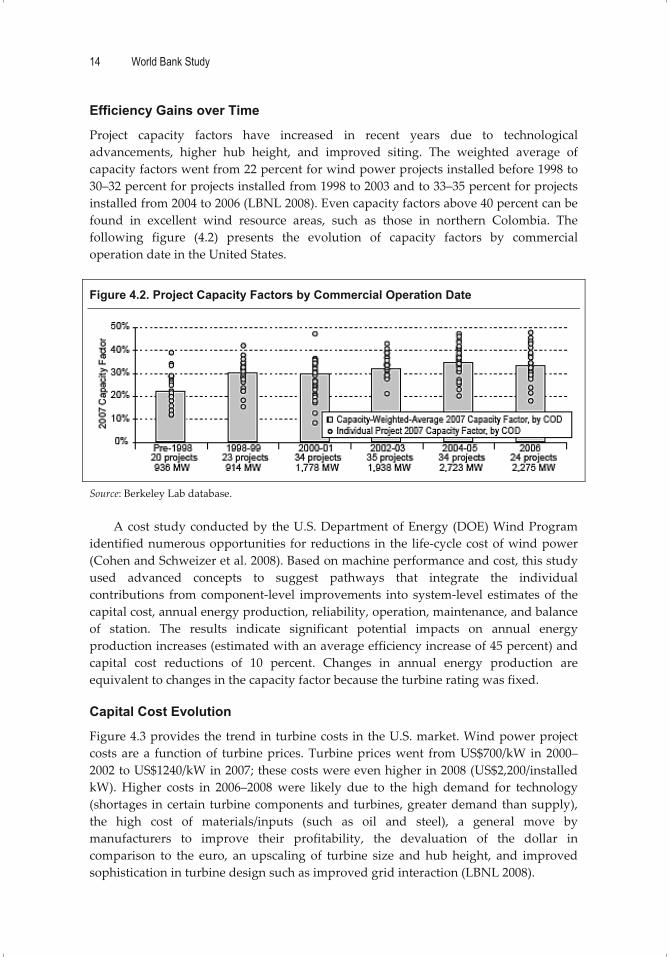
14 World Bank Study
Efficiency Gains over Time
Project� capacity� factors� have� increased� in� recent� years� due� to� technological�advancements,� higher� hub� height,� and� improved� siting.� The� weighted� average� of�capacity�factors�went�from�22�percent�for�wind�power�projects�installed�before�1998�to�30–32�percent�for�projects�installed�from�1998�to�2003�and�to�33–35�percent�for�projects�installed�from�2004�to�2006�(LBNL�2008).�Even�capacity�factors�above�40�percent�can�be�found� in� excellent� wind� resource� areas,� such� as� those� in� northern� Colombia.� The�following� figure� (4.2)� presents� the� evolution� of� capacity� factors� by� commercial�operation�date�in�the�United�States.��
Figure 4.2. Project Capacity Factors by Commercial Operation Date
�Source:�Berkeley�Lab�database.��
A�cost�study�conducted�by�the�U.S.�Department�of�Energy�(DOE)�Wind�Program�identified�numerous�opportunities� for�reductions� in� the� life�cycle�cost�of�wind�power�(Cohen�and�Schweizer�et�al.�2008).�Based�on�machine�performance�and�cost,�this�study�used� advanced� concepts� to� suggest� pathways� that� integrate� the� individual�contributions� from�component�level� improvements� into� system�level� estimates�of� the�capital�cost,�annual�energy�production,�reliability,�operation,�maintenance,�and�balance�of� station.� The� results� indicate� significant� potential� impacts� on� annual� energy�production�increases�(estimated�with�an�average�efficiency�increase�of�45�percent)�and�capital� cost� reductions� of� 10� percent.� Changes� in� annual� energy� production� are�equivalent�to�changes�in�the�capacity�factor�because�the�turbine�rating�was�fixed.��
Capital Cost Evolution
Figure�4.3�provides�the�trend�in�turbine�costs�in�the�U.S.�market.�Wind�power�project�costs�are�a� function�of� turbine�prices.�Turbine�prices�went� from�US$700/kW� in�2000–2002�to�US$1240/kW�in�2007;�these�costs�were�even�higher�in�2008�(US$2,200/installed�kW).�Higher� costs� in� 2006–2008�were� likely� due� to� the� high� demand� for� technology�(shortages� in�certain� turbine�components�and�turbines,�greater�demand�than�supply),�the� high� cost� of� materials/inputs� (such� as� oil� and� steel),� a� general� move� by�manufacturers� to� improve� their� profitability,� the� devaluation� of� the� dollar� in�comparison� to� the� euro,� an� upscaling� of� turbine� size� and� hub� height,� and� improved�sophistication�in�turbine�design�such�as�improved�grid�interaction�(LBNL�2008).�
SKU_18504_Wind_Energy_Colombia_6-17-10.pdf 34SKU_18504_Wind_Energy_Colombia_6-17-10.pdf 34 6/17/2010 12:32:09 PM6/17/2010 12:32:09 PM

Wind Energy in Colombia 15
Figure 4.3. Reported US Wind Turbine Transaction Prices over Time
�Source:�LBNL�2008.��
After�the�peak�values�reached�in�2008�(equivalent�to�unit�investment�costs�around�US$2,400/kW),�new�transactions�indicate�a�return�to�a�more�competitive�market.�As�of�March�2009,�the�European�Wind�Energy�Association�reported�that�the�average�cost�of�recent� projects� is� now� back� to� around� the� level� of� €1,225/kW.� This� translates� to�approximately�US$1,800/kW�as�the�average�2009�transactions�in�the�European�market.�This�would�continue�the�long�term�trend�in�capital�cost�reductions�observed�earlier.�
Operation and Maintenance Costs Are Decreasing
Annual� average� O&M� costs� of� wind� power� production� have� declined1� substantially�since� 1980.� O&M� cost� declines� can� be� observed� in� figure� 4.4� for� projects� that� were�installed� in� 1980,� until� 2005.� The� figure� specifically� suggests� that� capacity�weighted�average� 2000–2007� operation� and� maintenance� costs� for� projects� constructed� in� the�1980s�equal�US$30/MWh,�dropping�to�US$20/MWh�for�projects�installed�in�the�1990s,�and�to�US$9/MWh�for�projects�installed�in�the�2000s.��
Figure 4.4. Average Operation and Maintenance Costs for Available Data Years from 2000 to 2007, by Last Year of Equipment Installation
�Source:�Berkeley�Lab�database;�five�data�points�suppressed�to�protect�confidentiality.�
SKU_18504_Wind_Energy_Colombia_6-17-10.pdf 35SKU_18504_Wind_Energy_Colombia_6-17-10.pdf 35 6/17/2010 12:32:09 PM6/17/2010 12:32:09 PM

16 World Bank Study
Wind Power Grid Integration
Integration�of�large�capacities�of�wind�energy�into�power�systems�is�increasingly�less�of�a� concern� (there� is� growing� literature� in� this� respect2).� In� fact,� as� an� example,� the�European�Wind�Energy�Association�considers�that�integrating�300�GW�of�wind�power�by� year� 2030� into� European� power� systems� is� not� only� a� feasible� option� for� the�electricity�supply,�but�it�has�the�benefits�of�increasing�the�security�of�supply�and�could�contribute� to� low� and� predictable� electricity� prices� (European� Wind� Energy�Association�2008).�Furthermore,�wind�power�has�also�been�stated�to�help�with�system�stability� by� providing� Low� Voltage� Run�Through� (LVRT)3� and� dynamic� variable�support� to� thus� reduce� voltage� excursions� and� dampen� swings� (UWIG� 2007).�Moreover,� by� integrating�wind�power� into� the� energy� grid,� the� aggregation� of�wind�turbines� reduces�variability� in�power�generation;4� simultaneous� loss�of� capacity�does�not� occur� in� a� broad� geographic� region� (as� shown� by� extensive� modeling� studies).�Meso�scale�wind�forecasting�could�provide�some�predictability�of�plant�output�within�some�margin�of�error;�similarly,�forecasts�are�improving�(UWIG�2007).�
Turbine� orders� larger� than� 300� MW� tend� to� result� in� lower� costs� than� turbine�orders� of� less� than� 100�MW� (likely� due� to� economies� of� scale� and� lower� transaction�costs/kW)� (LBNL� 2008).� However,� there� seems� to� be� a� small� difference� in� costs� for�projects�between�30�and�200�MW;� in�general,�variations� in� costs�of�wind�projects�are�more�likely�due�to�regional�differences�such�as�development�costs,�site�and�permitting�requirements,�and�construction�expenses�(URS�2008).�
Outlook
Wind�power�has�undergone�a� fast�developmental�phase.�The�unprecedented�pace�of�growth�during�this�decade�has�outpaced�manufacturing�capabilities,�creating�a�seller’s�side�market.�Prices�have�also�been�affected�by�commodity�price�fluctuations,�associated�with� the� increasing� levels� of� economic� activity� seen� in� the� last� five� years� and�more�recently�by� changes� in� the�worldwide�economy.�Wind�power� capacity� is� expected� to�continue� to� rise� significantly�worldwide� and� to� play� an� increasingly� relevant� role� in�meeting�the�growing�energy�demands�of�the�future.��
Wind� power� installed� capacity� in� Latin� America� is� very� low� and� is� increasing�slowly.�However,�the�slow�pace�of�growth�is�expected�to�change�once�the�downward�trend�in�prices�induces�more�stable�market�conditions.�The�financial�crisis�might�allow�the� industry� to� find� opportunities� for� development� and� to� deal� with� demand�expectations.�
The� threshold�price� for� the�wind�power�option� (300�MW)�to�become�competitive�with�large�hydro�power�(1,200�MW),�which�is�currently�the�least�cost�option,�without�reliance� on� incentives� or� other� subsidies�with� the� 30� or� 40� percent� capacity� factor� is�when� the� levelized� cost� of� wind� energy� is� at� US$940/KW� and� hydro� power� at�US$1,200/KW.�Both�options�then�total�for�either�US$136/KW/year�at�the�capacity�factor�of�30�percent�or�US$139/KW/year�at�the�capacity�factor�of�40�percent.��
SKU_18504_Wind_Energy_Colombia_6-17-10.pdf 36SKU_18504_Wind_Energy_Colombia_6-17-10.pdf 36 6/17/2010 12:32:10 PM6/17/2010 12:32:10 PM

Wind Energy in Colombia 17
Notes��1�LBNL�estimates�that�this�drop�in�costs�could�be�due�to�the�following:�(a)�O&M�costs�generally�increase�because�as�turbines�age,�component�failures�become�more�common;�(b)�as�manufacturer�warranties� expire,�projects� installed�more� recently�with� larger� turbines� and�more� sophisticated�designs�may�experience� lower�overall�O&M�costs�on�a�per�MWh�basis;�and� (c)�project� size.�To�normalize� for� factors� (a)� and� (b)�above,�LBNL�produces�other� figures�and�analyses� that� can�be�found�in�the�original�publication�but�nonetheless�reveal�O&M�cost�declines.�2�See,�for�example,�Boyle�(2007).��3�Also�called�ride�through�faults,�LVRTs�are�devices� that�may�be�required�to�be�available�when�the�voltage� in� the�grid� is� temporarily� reduced�due� to� a� fault�or� load� change� in� the�grid.�Wind�generators�can�serve�as�LVRTs.�4�Aggregation�provides� smoothing� in� the� short� term.�However,� there�are� significant�benefits� to�geographical�dispersion�because�dispersion�provides�smoothing�in�the�long�term.�
SKU_18504_Wind_Energy_Colombia_6-17-10.pdf 37SKU_18504_Wind_Energy_Colombia_6-17-10.pdf 37 6/17/2010 12:32:10 PM6/17/2010 12:32:10 PM

18
CHAPTER �5 �
Wind�and�Hydro�in�Colombia:�Complementarity�Analysis�
lthough�the�levelized�cost�analysis�indicates�that�under�current�conditions�wind�is�not� competitive� with� hydro,� wind� power� under� proper� circumstances� could�
complement�the�sector’s�large�hydro�based�capacity.�This�chapter�examines�the�extent�to� which� the� wind� resource� complements� the� hydro� regime� in� the� country.� It� also�characterizes� some� of� the� climate� vulnerabilities� of� a� hydro�based� power� sector� to�future�climate�change.�
Complementarity of the Wind and Hydro Regimes
Does� the� wind� energy� potential� in� northern� Colombia� have� a� distribution� that� is�complementary�to� the�availability�of�hydropower?�This�question�can�be�examined�on�the�basis�of�Jepírachi’s1�power�generation�records,�available�since�it�started�operations�in� 2004,2� and� on� the� analysis� of� wind� data� in� meteorological� stations� in� northern�Colombia.� Complementarity� could� also� be� measured� by� wind� availability� during�extreme�drought�conditions�associated�with�El�Niño�events,�and�through�the�analysis�of�independent�and�joint�operation�of�the�Jepírachi�wind�farm�and�hydropower�plants�on�selected�rivers�in�Colombia.�This�chapter�presents�the�results�of�these�analyses.�
Generation Data from Jepírachi
Power�generation�data�at�hourly�level�were�available�for�the�Jepírachi�plant�during�its�operation� period.3� These� data� make� it� possible� to� estimate� the� distribution� of� the�average�monthly�generation�under�peak,�medium,�and�base� loads� (table�5.1).�For� the�dry� period� of�December� 1� to�April� 30� (as� defined� by� the� regulatory� agency,�CREG),�Jepírachi� produces� 10� percent� more� energy� than� its� yearly� average.� The� historical�generation�in�Jepírachi�during�the�first�four�months�of�the�year�is�17�percent�above�the�yearly�monthly�generation.���
A
SKU_18504_Wind_Energy_Colombia_6-17-10.pdf 38SKU_18504_Wind_Energy_Colombia_6-17-10.pdf 38 6/17/2010 12:32:10 PM6/17/2010 12:32:10 PM

Wind Energy in Colombia 19
Table 5.1. Jepírachi Monthly Power Generation Jepírachi average generation (MWh) Ratio of average generation Demand Block Demand Block Total Peak Load Med Load Low Load Peak Load Med Load Low Load
Jan 5098 232 4074 792 1.08 1.13 1.00 Feb 5338 258 4269 811 1.20 1.18 1.03 Mar 6414 313 5041 1060 1.46 1.40 1.34 Apr 4893 230 3737 926 1.07 1.03 1.17 May 4515 215 3439 861 1.00 0.95 1.09 Jun 4531 218 3558 755 1.01 0.99 0.96 Jul 6392 290 4768 1334 1.35 1.32 1.69 Aug 5123 248 3939 936 1.15 1.09 1.19 Sep 4046 194 3115 737 0.90 0.86 0.93 Oct 2492 107 1979 406 0.50 0.55 0.51 Nov 2830 130 2307 393 0.61 0.64 0.50 Dec 3722 143 3119 460 0.67 0.86 0.58
Total 55394 2578 43345 9471 1.00 1.00 1.00 “dry” period 25465 1176 20240 4049 1.09 1.12 1.03 “wet” period 29929 1402 23105 5422 0.93 0.91 0.98
Source:�Consultants’�study�(see�Appendix�6).�Note:�The�calculations�assume�that�peak�load�corresponds�to�the�generation�during�the�20th�hour�of�the�day,�medium�load�corresponds�to�generation�during�the�6th�to�19th�and�21th�to�23rd�hours,�and�base�load� corresponds� to� the� remaining� hours� of� the� day.� This� distribution� is� very� important� since� the�medium�and�peak�load�hours�(when�energy�is�more�costly)�have�a�larger�plant�factor�than�the�base�load�hours.�
Table� 5.1� also� shows� the� distribution� of� energy� production�during� the�NIS� Peak�Load,�Medium�Load,�and�Low�Load�periods.�During�the�Peak�Load�period,�defined�as�the�hour�of�peak�demand�(8�p.m.),�Jepírachi�produces�17�percent�more�energy�during�the� dry� season� in� relation� to� production� during� the� wet� season.� This� could� be�interpreted�as�an�indication�of�the�ability�of�wind�based�power�plants�to�contribute�to�peak�demand�when� it� is�most�needed.�The�contribution�of�wind� farms� is�also�higher�during�the�dry�season�for�all�load�conditions.�While�the�hydro�based�system�undergoes�the�dry�season� (low�availability�of�water� for�generation),� the�wind� farms� in�northern�Colombia�could�produce�well�above�their�average�output.�
Wind Data from Reference Stations
Figures�5.1�to�5.3�present�a�graphic�representation4of�the�temporal�characteristics�of�the�northern� coast� wind� field� in� Colombia.� Figure� 5.1� illustrates� the� distribution� of� the�reference� stations� used� to� describe� the� wind� potential� on� the� northern� coast� of�Colombia.�Wind� data� are� summarized� from�Almirante� Padilla� airport� in� La� Guajira�(Station� 6� in� figure� 5.1),� the� closest� climate� station� to� Jepírachi� reported� in� the�Wind�Atlas,�and�three�other�climate�stations�along�the�northern�Caribbean�coast�of�Colombia�(Galerazamba,� Bolívar;� E.� Cortizzos� Airport,� Atlántico;� and� S.� Bolívar� Airport,�Magdalena).�
SKU_18504_Wind_Energy_Colombia_6-17-10.pdf 39SKU_18504_Wind_Energy_Colombia_6-17-10.pdf 39 6/17/2010 12:32:10 PM6/17/2010 12:32:10 PM

20 World Bank Study
The�Almirante�Padilla�Airport�station�provides�data�that�are�representative�of�the�wind�field�found�in�Northern�Guajira.�Its�graphic�representation�is�shown�in�figure�5.2.�The�figure�shows�wind�availability�(speed�above�4.0�m/s)�from�8�or�9�a.m.�until�5�to�7�p.m.� on� a� consistent� basis.� Lower� speeds� are� measured� from� August� to� December.�Higher�speeds�are�measured�from�December�to�April�and�then�again�during�June�and�July.� Figure 5.1. Stations Used to Characterize Wind Power in Colombia
�Source:�UPME�and�IDEAM.��Note:� Station� 6,� Almirante� Padilla� Airport,� Guajira;� Station� 12,� Simón� Bolívar� Airport,� Magdalena;�Station�11,�Soledad�Airport,�Atlántico;�and�Station�1,�Galarezamba,�Bolívar.�
SKU_18504_Wind_Energy_Colombia_6-17-10.pdf 40SKU_18504_Wind_Energy_Colombia_6-17-10.pdf 40 6/17/2010 12:32:10 PM6/17/2010 12:32:10 PM

Wind Energy in Colombia 21
Figure 5.2. Almirante Padilla Airport, Guajira
�
Source:�UPME�and�IDEAM.����
Data� collected�at� other� coastal� sites� along� the�Caribbean� coast� of�Colombia�were�also�analyzed�(figure�5.3).�The�trade�winds�follow�Colombia’s�northern�coast�from�the�northeast�to�the�west�during�most�of�the�year.�This�general�circulation�pattern�remains�year�around,�with�changes�in�intensity�(wind�speeds).�In�all�cases,�wind�intensity�peaks�between�February�and�March.�This�is�indicated�in�table�5.2.���Table 5.2. Wind Speed as a Fraction of Mean Yearly Wind Speeds
Month 1 2 3 4 5 6 7 8 9 10 11 12
Load Peak 1.27 1.38 1.34 1.15 1.00 0.88 0.96 0.88 0.61 0.69 0.81 1.04 Med 1.32 1.36 1.34 1.17 0.94 0.87 0.93 0.85 0.67 0.69 0.81 1.04 Low 1.36 1.39 1.26 1.13 0.99 0.81 0.90 0.81 0.69 0.75 0.88 1.04 W speed avg 7.78 8.05 7.77 6.80 5.60 5.01 5.42 4.94 3.95 4.15 4.86 6.13 Ratio to annual avg 1.33 1.37 1.32 1.16 0.95 0.85 0.92 0.84 0.67 0.71 0.83 1.04
Source:�Authors’�data.��
� �
SKU_18504_Wind_Energy_Colombia_6-17-10.pdf 41SKU_18504_Wind_Energy_Colombia_6-17-10.pdf 41 6/17/2010 12:32:10 PM6/17/2010 12:32:10 PM

22 World Bank Study
On�average,�wind�speed�at�8�p.m.�is�above�the�annual�average�by�11�percent,�and�during�the�“dry”�months�of�December�to�April�the�wind�speeds�are�37�percent�above�the� annual� average,� a� large� increase�given� the� fact� that� the�power�of�wind� energy� is�proportional� to� the� cube� of� the� wind� speed.� Wind� power� is� available� when� its�contribution�to�the�national�grid�is�most�needed,�that�is,�during�the�dry�periods�and�to�an� extent� during� the� afternoon� when� demand� peaks.� Figure� 5.3� presents� the� wind�conditions�in�three�wind�measuring�stations.��
Figure 5.3. Graphic Representation of Wind Conditions in Northern Colombia
Galerazamba, Bolívar E. Cortizzos Airport, Atlántico S. Bolivar Airport, Magdalena
Wind intensities above five m/s are observed year around in the afternoon, with higher values—above 8 m/s—observed during the first three months of the year. Wind direction is predominantly from the northeast.
Wind speeds above 5 m/s are observed in the afternoon, with average values close to 8 m/s. These strong winds are observed until early morning, especially during the first four months. Wind direction is mostly from the northeast, although winds from the north are significant.
From 2 p.m. until 8 p.m., this station exhibits wind speeds above 5 m/s, with average values near 8 m/s for the months of January through April. Winds are predominantly from the north.
Source:�UPME�and�IDEAM.��Note:�E.�Cortizzos�Airport,�Atlántico,�and�S.�Bolívar�Airport,�Magdalena�stations�are�strongly�affected�by�the�Sierra�Nevada�de�Santa�Marta,�which�interrupts�the�wind�flow�to�the�stations�(for�which�reason�the�winds�blow�predominantly�from�the�north).�
SKU_18504_Wind_Energy_Colombia_6-17-10.pdf 42SKU_18504_Wind_Energy_Colombia_6-17-10.pdf 42 6/17/2010 12:32:10 PM6/17/2010 12:32:10 PM

Wind Energy in Colombia 23
Complementarity during El Niño Southern Oscillation (ENSO) Events
Colombia’s� interconnected� hydro�based� system� is� severely� affected� by� large�scale�droughts.�Historically,�critical�drought�conditions�are�linked�to�El�Niño�events,�such�as�those�of�1991–1992�and�2002–2003.�Table�5.3�shows�the�period�of�occurrence�of�El�Niño�events� and� their� length.� Thus,� a� key� element� for� this� analysis� is� whether� there� are�complementarities� between� wind�� and� hydropower� during� dry� periods.� Based� on�existing�power�generation�data� from� Jepírachi� (for� the�period� from�February� 2004� to�March�2009)�and�wind�velocity�records�data�from�Puerto�Bolívar,�wind�and�generation�data�were�extended�to�cover�the�period�from�1985�to�2008.�For�the�El�Niño�periods,�the�wind�data�were�normalized�so�that�positive�values�indicate�above�average�conditions�measured� in� standard� deviations,� and� negative� values� indicate� below�average�conditions.��Table 5.3. El Niño Periods Start Jul-51 Mar-57 Jun-63 May-65 Oct-68 Aug-69 Apr-72 Aug-76 Aug-77
Finish Jan-52 Jul-58 Feb-64 May-66 Jun-69 Feb-70 Feb-73 Mar-77 Feb-78
Months 6 14 8 13 8 6 10 7 6
Start Apr-82 Jul-86 Apr-91 Feb-93 Mar-94 Apr-97 Apr-02 Jan-04 Aug-06
Finish Jul-83 Mar-88 Jul-92 Aug-93 Apr-95 May-98 Apr-03 Mar-05 Feb-07
Months 15 20 15 6 13 13 12 8 6
Source:�IDEAM.���
A�similar�analysis�was�conducted�for� four�rivers�with�hydropower�development:�Guavio,�Nare,�Cauca,�and�Magdalena.�Results�show�negative�values�for�the�four�rivers�during� most� El� Niño� occurrences,� while� the� Jepírachi� generation� resulted�mostly� in�positive� values.� The�most� severe� basin� response� corresponds� to� El� Niño� from�April�1991� to� July�1992�when�energy� rationing�occurred,�and� from�April� 1997� to�May�1998�when� pool� prices� reached� very� high� spot� prices,� forcing� regulatory� changes� in� the�market.�During� these�periods�of� extreme�drought,� the�hydrology�of� the� country�was�severely�affected,�resulting�in�a�reduction�of�mean�reservoir�capacities,�and�the�system�had� to� rely� on� alternative� generation� capacity� provided� through� the� use� of� thermal�capacity.�
During� these� periods� the� estimated� generation� from� Jepírachi� is� well� above� the�mean� value.� That� is,� during� periods� of� extreme� drought� associated� with� El� Niño�phenomena,�wind�energy�from�northern�Colombia�is�above�average,�emphasizing�the�possible�role�of�wind�power�during�these�critical�periods.�This�analysis�is�described�in�a�separate�report�which�can�be�found�from�Appendix�6.�
Table� 5.4� shows� that� El�Niño� periods� have� historically� lasted� between� 6� and� 20�months;�on�average�in�the�1951–2006�period�they�have�lasted�10.5�months.�� �
SKU_18504_Wind_Energy_Colombia_6-17-10.pdf 43SKU_18504_Wind_Energy_Colombia_6-17-10.pdf 43 6/17/2010 12:32:10 PM6/17/2010 12:32:10 PM

24 World Bank Study
Table 5.4. Wind and Hydro Complementary during El Niño
ANALYSIS OF EL NIÑO OCCURRENCES Departure from mean value expressed as number of standard deviations
El Niño occurrences
Jul. 86 Abr. 91 Feb. 93 Mar. 94 Abr. 97 Abr. 02 Jun. 04 Ago. 06 Mar. 88 Jul. 92 Ago. 93 Abr. 95 May. 98 Abr. 03 Mar. 05 Feb. 07
Guavio River 1.03 �0 .5 3 0.64 1.50 �0.87 0.6 6 0.94 �1.02 Nare River �0.73 �1.39 �0.71 �0.64 �1.86 �0.90 0 .6 8 0.08 Cauca River �1.48 �1.14 �0.17 �0.48 �1.53 �1.52 �0.07 �0.90 Magdalena River �0.51 �1 .0 7 0.00 0.80 �1.69 �1.08 �0.81 �0.52 Jepirachi Powerplant 1.23 1.20 0.20 1.23 0 .56 1 .1 9 �0.91 �0.80
Source:�Consultants’�study�(see�Appendix�6).��
Wind and Hydro Generation Complementarity
Complementarity� was� also� explored� through� an� analysis� of� the� joint� operation� of� a�simple� system� consisting� of� a� wind� farm� that� operates� with� a� hydropower� plant� of�similar�size�for�each�of�the�rivers�studied�and�a�range�of�reservoir�sizes.�The�results�for�each� of� the� rivers� are� described� in�Appendix� 6.� Table� 5.5� below�presents� the� results�from� the� joint� analysis� of� Jepírachi� and� the� Nare� River.� These� results� are� similar� to�those� found�when� Jepírachi� is� combined�with� the�other� rivers.�The� firm�energy� from�the�isolated�operation�of�the�hydropower�plant�and�the�wind�farm�is�far�below�the�firm�energy� resulting� from� their� joint� operation.� This� result� holds� for� the� wide� range� of�possible� reservoir� sizes� studied.� It� is� therefore� concluded� that� the� joint� operation� of�wind�� and� hydropower� plants� exhibits� a� strong� complementarity,� which� is� not�rewarded�in�the�current�regulatory�system�adopted�by�Colombia.���Table 5.5. Complementarity of Joint Operation of Hydro Plant and Wind Farm; the Case of the Nare River
FIRM ENERGY FOR NARE AND JEPIRACHI IN ISOLATED AND JOINT OPERATION Firm Energy/Mean Energy
Reservoir volume expressed as a
fraction of mean energy inflow to Nare 0 0.2 0.4 0.6 0.8 1
Nare River(isolated) Jepirachi (isolated) Nare River + Jepirachi in isolated operation Nare River + Jepirachi in joint operation
0.179 0.089 0.268 0.410
0.369 0.089 0.458 0.811
0.435 0.089 0.524 0.943
0.459 0.089 0.548 0.972
0.471 0.089 0.560 0.994
0.480 0.089 0.569 1.009
Source:�Consultants’�study�(see�Appendix�6).�
SKU_18504_Wind_Energy_Colombia_6-17-10.pdf 44SKU_18504_Wind_Energy_Colombia_6-17-10.pdf 44 6/17/2010 12:32:10 PM6/17/2010 12:32:10 PM

Wind Energy in Colombia 25
Firm Energy and Joint Operation of Wind and Hydroelectric Projects
An�analysis�was�conducted�to�understand�the�firm�energy�obtained�from�hydroelectric�plants� (with� and� without� reservoir)� in� conjunction� with� the� Jepírachi� power� plant�under� scenarios� of� joint� and� isolated� operation� (Colombian� regulation� estimates� the�reliability� of� individual� power� plants� and� does� not� consider� joint� operation).� Firm�energy� is� defined� as� the� maximum� monthly� energy� that� can� be� produced� without�deficits�during�the�analysis�period�which�would�include�El�Niño�occurrences.�The�same�results� were� obtained� for� the� total� energy� obtained� from� the� joint� operation� of� the�hydropower�plants�and�the�Jepírachi�plant.�
The�analysis�was�conducted�using�a�simulation�model�that�operates�the�plants�and�the�reservoirs�to�provide�a�given�energy�target,�adjusting�this�target�until�no�deficits�are�generated.�For�this�purpose,�hypothetical�hydroelectric�plants�with�capacity�similar�to�that� of� wind� power� plants� were� analyzed.� Mean� multiannual� inflow� to� the�hydroelectric�power�plants�(expressed�in�energy)�at�the�plant�sites�is�equal�to�the�same�value� for� Jepírachi� generation.� This� was� done� by� multiplying� river� discharges� by� a�factor� to�convert� them�to�energy�such� that�mean� inflows�are�equal� to�mean� Jepírachi�generation.� In� order� to� avoid� confusion� with� existing� hydroelectric� plants,� the�hypothetical� plants� analyzed�will� be� named�Guavio� River,�Nare� River,� Cauca�River,�and�Magdalena�River.�
Several� reservoir� sizes� were� analyzed;� reservoir� size� (expressed� as� a� fraction� of�mean�annual�inflow�to�the�reservoir�in�energy)�varies�between�0�(run�of�river�plant)�to�1�(substantial�regulation�capacity).�Results�are�shown�below.�
An Example: The Guavio River
Table� 5.6� and� figure� 5.4� show� results� for� the� Guavio� River.� Firm� energy� has� been�normalized,�with�actual�firm�energy�divided�by�the�sum�of�mean�energy�for�the�Guavio�River�and�Jepírachi.��Table 5.6. Firm Energy Results for Guavio River Analyzed in Isolated and Joint Operation
FIRM ENERGY FOR GUAVIO AND JEPIRACHI IN ISOLATED AND JOINT OPERATION Firm Energy/Mean Energy
Reservoir volume expressed as a fraction of mean energy inflow to Guavio
0 0.2 0.4 0.6 0.8 1
Guavio River (isolated) Jepirachi (isolated) Guavio River + Jepirachi in isolated operation Guavio River + Jepirachi in joint operation
0.064 0.089 0.153 0.212
0.334 0.089 0.423 0.709
0.451 0.089 0.540 0.860
0.481 0.089 0.570 0.908
0.507 0.089 0.596 0.935
0.514 0.089 0.602 0.962
Source:�Consultants’�study�(see�Appendix�6).�
SKU_18504_Wind_Energy_Colombia_6-17-10.pdf 45SKU_18504_Wind_Energy_Colombia_6-17-10.pdf 45 6/17/2010 12:32:10 PM6/17/2010 12:32:10 PM

26 World Bank Study
Figure 5.4. Firm Energy for Guavio River as a Result of Isolated and Joint Operation
�Source:�Consultants’�study�(see�Appendix�6).��
In�this�case,�the�firm�energy�that�results�from�the�joint�operation�of�the�wind�farm�and� the� hypothetical� hydropower� plant� is� greater� than� the� sum� of� the� isolated�operation�of�the�two�individual�projects.�
Table�5.6�and�figure�5.4�indicate�an�increase�in�firm�energy�when�joint�operation�is�considered.�This�is�because�critical�periods�for�the�Guavio�River�do�not�coincide�with�Jepírachi� generation� during� the� same� period.� Figures� 5.5� and� 5.6,� showing� reservoir�operation� both� in� isolated� and� joint� operation,� illustrate� this� in� greater� detail.� Figure�5.5,� corresponding� to� a� reservoir� size� of� 0.2,� shows� that� in� isolated� operation� the�reservoir� is�emptied�during�the�El�Niño�occurrence�of�April�1997–May�1998,�while� in�joint�operation�the�reservoir�is�emptied�in�April�2001.�The�El�Niño�occurrence�of�April�1997–April� 1998� is� balanced� by� large�scale� generation� in� the� Jepírachi� power� plant,�showing� the� complementarity� of� river� discharges� in� the� Guavio� River� and� wind�generation� in� the� Jepírachi� power�plant.� The� analysis� is� also�performed� for� the�Nare�and� Magdalena� Rivers� and� the� results� are� similar� to� those� presented� here� for� the�Guavio� River� (that� is,� in� joint� operation� the� firm� energy� is� greater� than� in� isolated�operation).� For� purposes� of� simplification,� only� the� Guavio� River� example,� with� a�reservoir�size�of�0.2�and�0.5,�is�shown.�
�
0.000
0.200
0.400
0.600
0.800
1.000
1.200
0 0.1 0.2 0.3 0.4 0.5 0.6 0.7 0.8 0.9 1
Firm
ener
gy/M
ean
ener
gy
Reservoir size/Mean annual energy
Guavio R. + Jepirachi (joint)
Guavio R. + Jepirachi (isolated)
Guavio R.(isolated)
Jepirachi (isolated)
SKU_18504_Wind_Energy_Colombia_6-17-10.pdf 46SKU_18504_Wind_Energy_Colombia_6-17-10.pdf 46 6/17/2010 12:32:11 PM6/17/2010 12:32:11 PM

Wind Energy in Colombia 27
Figure 5.5. Guavio River Reservoir Operation with a Reservoir Size of 0.2 in Isolated and Joint Operation
Source:�Consultants’�study�(see�Appendix�6).�Notes:�0=run�of�river�plant�to�1=substantial�regulation�capacity.�The�bars�represent�El�Niño�occurrences.��
Figure 5.6. Guavio River Reservoir Operation with a Reservoir Size of 0.5 in Isolated and Joint Operation
Source:�Consultants’�study�(see�Appendix�6).�Notes:�0=run�of�river�plant�to�1=substantial�regulation�capacity.�The�bars�represent�El�Niño�occurrences.��
Impact of Extreme Events on Hydropower Capacity
Although� there� is� still� no� consensus� on� how� climate� change� may� affect� average�precipitation� in� Colombia,� there� is� a� generally� accepted� notion� that� global� warming�
0.000
0.200
0.400
0.600
0.800
1.000
1.200De
c-84
Nov-8
5No
v-86
Nov-8
7No
v-88
Nov-8
9No
v-90
Nov-9
1No
v-92
Nov-9
3No
v-94
Nov-9
5No
v-96
Nov-9
7No
v-98
Nov-9
9No
v-00
Nov-0
1No
v-02
Nov-0
3No
v-04
Nov-0
5No
v-06
Nov-0
7No
v-08
Rese
rvoi
r vol
ume/R
esrv
oir c
apac
ity
Joint
Isolated
0.000
0.200
0.400
0.600
0.800
1.000
1.200
Dec-8
4No
v-85
Nov-8
6No
v-87
Nov-8
8No
v-89
Nov-9
0No
v-91
Nov-9
2No
v-93
Nov-9
4No
v-95
Nov-9
6No
v-97
Nov-9
8No
v-99
Nov-0
0No
v-01
Nov-0
2No
v-03
Nov-0
4No
v-05
Nov-0
6No
v-07
Nov-0
8
Rese
rvoi
r vol
ume/R
esrv
oir c
apac
ity
Joint
Isolated
SKU_18504_Wind_Energy_Colombia_6-17-10.pdf 47SKU_18504_Wind_Energy_Colombia_6-17-10.pdf 47 6/17/2010 12:32:11 PM6/17/2010 12:32:11 PM

28 World Bank Study
will� result�not�only� in�changes� in�mean�conditions�but�also� in� increases� in� the�extent�and� frequency� of� extreme� precipitation� events.� Changes� in� extremes�would� have� an�impact�on� the�country’s�hydrological� regime.�Appendix�2�presents�a�summary�of� the�results� of� an� analysis� conducted� with� the� use� of� runoff� data,� derived� from� rainfall�projections�by�the�Earth�Simulator�to�estimate�the�likelihood�of�extreme�weather�events�around�the�end�of�the�century�(2090).�This�would�result� in�an�increase�in�stream�flow�during�the�high�flow�season�and�a�decrease�in�the�low�flow�season.�The�annual�range�of�stream�flow�becomes�larger,�implying�more�floods�in�the�wet�season�and�droughts�in�the�dry�season.�The�anticipated�changes� in�surface�hydrology�will�affect�hydropower�potential�by�reducing�the�potential�firm�capacity�of�reservoirs.��
Notes �1�Jepírachi�is�a�small�wind�farm,�with�19.6�MW�of�nominal�capacity,�located�in�Northern�Guajira,�owned�by�EPM�and�in�operation�since�2004.�2�Note�that�the�capacity�factor�of�Jepírachi�during�the�2004–2008�period�was�lower�than�expected,�nearly�32�percent.�Communication�with�the�wind�farm’s�owners�reveals�that�some�wind�turbines�were�turned�off�for�maintenance�and�that�there�were�periods�(normally�between�midnight�and�6�a.m.)�in�which�the�wind�farm�did�not�generate�due�to�tension�imbalances�in�the�transmission�lines�to�which�the�wind�farm�is�connected.�These�issues�have�now�been�resolved�but�it�is�believed�that�without� these� issues� the� capacity� factor� for� Jepírachi� could� have� been� higher� than� that�experienced.�3� Data� are� from� the� Neon� database� with� historical� operation� data� created� by� Expertos� en�Mercados�S.A.�E.S.P.�(XM),�the�Colombian�hydrothermal�system�operator.�4� The� information� was� compiled� and� published� as� a� joint� effort� by� Unidad� de� Planeamineto�Minero�Energética�(UPME)�and�Institute�of�Hydrology,�Meteorology�and�Environmental�Studies�of� Colombia� (IDEAM),� part� of� the� Ministry� of� Environment,� Housing,� and� Territorial�Development.�
SKU_18504_Wind_Energy_Colombia_6-17-10.pdf 48SKU_18504_Wind_Energy_Colombia_6-17-10.pdf 48 6/17/2010 12:32:11 PM6/17/2010 12:32:11 PM

29
CHAPTER �6 �
Options�to�Aid�Market��Entry�of�Wind�Energy�in��the�Country’s�Power�Mix�
Introduction
Under� current� circumstances� wind�based� generation� faces� considerable� obstacles� to�participate� in� the� nation’s� power�mix.� Key� obstacles,� as� described� in� the� first�phase�report,� include� the� current� relatively� high� capital� intensity� and� the� structure� of� the�regulatory�system�which�does�not�acknowledge�wind�power’s�potential�firm�capacity.1�However,�the�wind�resource�along�the�northern�coast�appears�to�complement�well�the�country’s�hydrological�regime�and�could�be�part�of�a�strategy�to�strengthen�the�climate�resilience� of� the� hydropower�based� sector.� To� promote� wind� power� generation,� the�actions� required� would� result� in� a� positive� impact� on� the� financial� performance� of�projects� while� minimizing� distortions� in� the� existing� power� market� and� the� overall�economy.�This�chapter�reviews�the�typology�of�available�options�to�address�the�higher�capital�cost�of� the�wind�option�as�well�as�an�option� to�address� the�variable�nature�of�wind�energy.�
This� chapter� follows� a� microeconomics� approach.� The� analysis� is� focused� on�potential� investors� as� the� key� economic� agents� sought� by� the� GOC.� These� investors�base� their� investment� decisions� on� important� regulatory� and� financial� aspects.� This�chapter�describes�the�tools�available�to�guide�the�market�and�the�tools�for�government�intervention�in�guiding�the�independent�investors’�decisions,�while�chapter�7�describes�the� financial� analysis� upon� which� the� effectiveness� of� such� tools� is� assessed.� The�interpretation�of�results�provides�guidance�to�decision�makers�on�regulatory�work.�
Options to Facilitate Market Entry of Wind Energy
A�number� of� options� could� be� used� to� facilitate� the�market� entry� of�wind� power� in�Colombia.� This� chapter� describes� a� typology� of� policy� instruments,� out� of� which� a�selection� is�made� for� further�use� in� the� analysis.� The�options� are� categorized� in� four�groups:� (i)� price�based� policy� instruments;� (ii)� policy� options� guiding� renewable�energy�output� (quantity�based�policy� instruments);� (iii)�adjustments� in� the�regulatory�system;� and� (iv)� instruments� that� provide� incentives� other� than� price.� In� addition,� a�proposal� is� detailed,� providing� a� simple� methodology� to� assess� the� contribution� of�wind�powered�plants�to�firm�energy,�an�opening�through�which�wind�farms�could�be�recipients�of�reliability�payments.�
SKU_18504_Wind_Energy_Colombia_6-17-10.pdf 49SKU_18504_Wind_Energy_Colombia_6-17-10.pdf 49 6/17/2010 12:32:11 PM6/17/2010 12:32:11 PM

30 World Bank Study
Price-Based Policy Instruments
Although�many�practitioners�find�these�instruments�very�effective�in�promoting�RET,�their� implementation�may�generate� financial�distortions.�These� instruments�or�policy�tools� have� so� far� not� been� considered� in� Colombia,� nor� are� they� favored� by�market�players� and� policy� makers,� because� the� country’s� generation� requirements� are�currently� being� met� by� independent� power� producers� without� the� need� for�government�financing�or�intervention.�
Feed�in� tariff� system� or� price�based� instrument.� This� approach� forces� utility�companies�to�purchase�all� the�electricity�produced�by�renewable�energy�producers� in�their�service�area�at�a�tariff�determined�by�the�authorities�and�guaranteed�for�a�specific�period�of� time� (typically�10� to�20�years).� Feed�in� tariffs�offer�a� financial� incentive� for�renewable�project�developers�to�exploit�all�available�generating�sites�until�the�marginal�cost� of� producing� energy� equals� the� proposed� feed�in� tariff.� Costs� are� recovered�through�a�levy�on�all�electricity�consumers�who�purchase�power�from�utilities.�
Fixed� premium� system� (environmental� kWh� premium).� This� price�based�mechanism�adds�a�fixed�premium�to�the�basic�wholesale�electricity�price,�making�the�total� price� received� per� kWh� produced� less� predictable� than� in� the� feed�in� tariff�described�above.��
Valuing�carbon�emissions.�Valuing�carbon�emissions�could�be�achieved�by�taxing�power� plants’� emissions� of� pollutants� in� accordance�with� standard� principles� of� tax�policy,�or�by�imposing�a�discriminatory�sales�tax�on�electricity�generated�by�polluting�fossil� fuels� and� using� the� revenue� to� pay� a� premium� to� generators� that� utilize�nonpolluting�renewable�energy�sources.�
Production�tax�credits.�A�production�tax�credit�provides�the�investor�or�owner�of�a�qualifying�generating� facility� an�annual� tax� credit� based�on� the� amount�of� electricity�generated�by�that�facility�to�encourage�improved�operating�performance.�
Policy Options Guiding Renewable Energy Output (Quantity-Based Policy Instruments)
Renewable�energy�mix�targets.�This�instrument�establishes�a�minimum�percentage�of�renewable�energy�as�part�of�the�national�energy�portfolio.�Electric�utilities�are�required�to� procure� a� certain� quantity� of� their� electricity� from� renewable� technologies� as� a�percentage� of� the� total� or� to� install� a� certain� capacity� of� renewable� power.� The�renewable�based�generation� increases�with� the�overall� increase� in�electricity�demand.�Producers� could� then� decide� either� to� implement� the� projects� themselves� or� to� put�them� out� to� tender� from� independent� power� producers.� Suppliers� may� also� choose�competitive� bidding� from� independent� power� producers� and� participate� in� green�certification� systems.� However,� inadequate� administrative� capacity� for� verification�mechanisms,� record� keeping� for� transactions,� and� compliance� may� complicate� their�implementation.�Several�countries�have�adopted�or�are�proposing�national�renewable�energy�targets.�The�European�Union�has�collectively�adopted�a�target�of�22�percent�of�total� electricity� generation� from� renewables� by� 2010,� with� individual�member� states�selecting� their� own� targets.� Japan� has� adopted� a� target� of� 3� percent� of� total� primary�energy� by� 2010.� Recent� legislative� proposals� in� the� United� States� would� require� 10�percent�of�electricity�generation�from�renewables�by�2020.�
Competitively� awarded� subsidies.� Competitively� awarded� subsidies,� that� is,�through� auctions,� could� be� offered� to� promote� certain� technologies� and� achieve�
SKU_18504_Wind_Energy_Colombia_6-17-10.pdf 50SKU_18504_Wind_Energy_Colombia_6-17-10.pdf 50 6/17/2010 12:32:11 PM6/17/2010 12:32:11 PM

Wind Energy in Colombia 31
predefined� output� targets.� In� Poland,� the�World� Bank’s�Global� Environment� Facility�(GEF)� helped� to� develop� markets� and� reduce� costs� for� products� through� subsidies�given�to�technically�qualified�domestic�manufacturers.�
Adjustments in the Regulatory System
Exemption�from�systems�charges.�Colombia�has�an�unbundled�electricity�market.�The�concept� of� unbundling—separately� pricing� all� of� the� services� that� comprise� a� utility�service—could�be�a�disadvantage�for�producers�of�nonconventional�power�when�they�have� to� pay� transmission� charges� on� a� per�capacity� basis.� Some� countries,� such� as�Brazil,�have�experimented�with�reducing�prices�of�transmission�wheeling�for�producers�of� renewable� energy.� To� this� end,� exemption� from� systems� charges� could� be�implemented,� exempting� renewables� from� generation� surcharges� and� considering�these� alternatives� as� load�reduction� technologies.� For� the� Colombian� system� several�policy�instruments�could�be�devised�under�this�heading�to�encourage�new�renewable�plants:� waiving� the� charges� paid� for� automatic� generation� control;� elimination� or�reduction�of�environmental� charges�and/or�contributions� for� the�electrification�of�off�grid� regions;� and� excluding� new� renewable� power� plants� from� CERE� payment�obligations.�
Adjusting� the� “reliability� payment”� regulation.� Colombia� has� developed� a�financial�mechanism�to�produce�an�economic�signal�to�investors�as�a�price�premium�on�reliable� installed� power� capacity.� This� instrument� aims� at� increasing� the� resilience�(“firmness)�of�the�national�interconnected�system�to�extreme�weather�events,�especially�during�unusually�dry�periods.�The�reliability�payment,�or�firm�capacity�charge,�should�promote�an�efficient�mix�of�energy�sources,�without�discriminating�renewable�sources.�Unfortunately,�the�existing�regulation�does�not�have�clear�rules�to�assess�the�potential�contribution�of�wind�energy�to�the�overall�reliability�of�the�interconnected�system�and�thus� favors� conventional� power� plants.� In� practice� this� discriminatory� treatment� has�been� identified� as� a� major� barrier� to� further� investments� in� the� wind� sector.2�Fortunately,� however,� it� is� straightforward� enough� to� include� all� resources� in� a�nondiscriminatory�manner.�All�that�is�required�is�an�objective�method�of�estimating�the�firm� energy� capacity� of� the� resource.� The� issue� of� reliability� payment� is� analyzed� in�detail�below.�
Policy Instruments that Provide Incentives other than Price
These�policy� tools�provide� incentives� for�voluntary� investments� in� renewable�energy�by� waiving� taxes� and/or� reducing� the� costs� of� investments� through� financial�mechanisms.� There� are� at� least� five� broad� categories� of� instruments� that� (i)� reduce�capital� costs� after� purchase� (through� tax� relief)� or� offset� costs� through� a� stream� of�payments� based� on� power� production� (through� production� tax� credits);� (ii)� reduce�investment�costs�up�front�(through�credits,�subsidies,�and�rebates);�(iii)�provide�public�financing�or�public�facilitation�through�concessionary�loans,�grants,�and�other�financial�assistance;� and� (iv)� reduce� capital� and� installation� costs� through� economies� of� bulk�procurement� (Valencia� 2008).� The� following� policy� instruments� are� applicable� in� the�case�of�Colombia.�
Property� tax� incentives.� These� incentives� are� generally� implemented� in� one� of�three�ways:�(i)�renewable�energy�property�is�partially�or�fully�excluded�from�property�tax� assessment,� (ii)� renewable� energy� property� value� is� capped� at� the� value� of� an�
SKU_18504_Wind_Energy_Colombia_6-17-10.pdf 51SKU_18504_Wind_Energy_Colombia_6-17-10.pdf 51 6/17/2010 12:32:11 PM6/17/2010 12:32:11 PM

32 World Bank Study
equivalent� conventional� energy� system� that� provides� the� same� service,� or� (iii)� tax�credits� are� awarded� to� offset� property� taxes.� Experts� have� long� argued� in� favor� of�imposing�corporate�and�sales�taxes�on�electricity�on�the�grounds�that�it�is�a�fairly�price�inelastic�product.�
Reduction�or�elimination�of�import�duties.�Much�of�the�equipment�for�renewable�generation�must�be� imported�to�host�countries.�High�capital� import�duties�and�tariffs�distort� the� market,� artificially� raising� the� price� of� renewable� technologies� and�discouraging� their� adoption.� Temporary� or� permanent� waivers� may� contribute� to�reduce�the�impact�of�high�initial�investment�costs�and�allow�renewable�technologies�to�compete� in� the� market.� Such� waivers� may� be� justified� either� on� the� basis� that�renewables�are�a�pioneer� (or� start�up)� industry�or�on� the�basis� that�payment�of� such�duties�and�tariffs�by�a�generating�company�ultimately�would�have�been�passed�on�to�the�final�consumer.�Tax�exemptions�encourage�investment.�
Financing� of� renewable� energies.� These�may� include:� imposing� a� surcharge� on�electricity�consumption,�to�be�collected�in�a�special�purpose�fund�for�renewable�energy�support� (in�which� case� larger� consumers� bear�most� of� the� burden);� providing� a� tax�credit�to�be�assigned�at�the�local�and�central�levels�on�renewable�energy�produced;�and�taxing�pollution,�which�raises�the�incremental�cost�of�thermal�generation�and�decreases�the� cost� of� competing� renewable� energy,� as� mentioned� above.� Other� options� could�include� a� change� in� culture� in� which� consumers� would� be� willing� to� pay� more� for�“green”�electricity.�Mexico�has�established�a�green�fund�to�promote�renewable�energy.�In�this�case�a�tax�is�collected�from�all�power�services�and�goes�into�a�fund�to�support�renewable�energy�projects.�
Grants� and� low�cost� loans.� Many� countries� have� offered� grants� for� renewable�energy�purchases.�In�some�developing�countries,�notably�China,�India,�and�Sri�Lanka,�multilateral� loans� by� lenders� such� as� the� World� Bank� have� provided� financing� for�renewable� energy,� usually� in� conjunction� with� commercial� lending� (Valencia� 2008).�The�newly�established�CTF�falls�into�this�option.�
Proposal to Address the Reliability Issue for Wind Energy
As� briefly� explained� earlier,� the� Colombian� electricity� market� includes� a� reliability�payment�for�each�resource�based�on�its�ability�to�generate�energy�during�unusually�dry�periods;�this�is�called�“firm�energy.”�The�product�needed�for�reliability�in�Colombia’s�hydro�dominated� electricity� market� was� introduced� in� Colombia� to� minimize� the�probability�of�brownouts�and�blackouts�in�the�interconnected�grid�as�a�consequence�of�hydrological� variability.� This� firm� energy� is� expected� to� meet� user� demand� under�critical�conditions�(when�the�wholesale�market�price�is�larger�than�the�scarcity�price3).�This�is�found�in�CREG�Resolution�071�2006.�
In� 2008,� Colombia� introduced� an� innovative� and� effective� market� in� which�auctions4�are�held�to�commit�enough�firm�energy�to�cover�its�needs�(Cramton�and�Stoft�2007,�2008).5�The�firm�energy�market�coordinates�investment�in�new�resources�to�assure�that�sufficient�firm�energy�is�available�in�dry�periods.�The�firm�energy�product�includes�both� a� financial� call� option� and� the� physical� capability� to� supply� firm� energy.� The�physical�capability�assures�that�there�will�be�sufficient�energy�during�dry�periods.�The�call�option�protects� load� from�high� spot�prices� and� improves� the�performance�of� the�spot�market�during�scarcity.�
SKU_18504_Wind_Energy_Colombia_6-17-10.pdf 52SKU_18504_Wind_Energy_Colombia_6-17-10.pdf 52 6/17/2010 12:32:11 PM6/17/2010 12:32:11 PM

Wind Energy in Colombia 33
To�promote�an�efficient�mix�of�resources�and�for�the�firm�energy�market�to�succeed�in�providing�reliable�electricity�at�least�cost,�all�resources,�including�variable�resources�such�as�wind�power,�should�be�eligible�to�receive�the�same�reliability�payment�based�upon�the�resource’s�ability�to�provide�firm�energy.�Including�wind�power�and�other�variable�resources�in�the�firm�energy�market�has�three�important�benefits�for�Colombia.�First,�it�leads�to�a�more�efficient�mix�of�resources�and�thereby�could�eventually�reduce�electricity�costs.�Second,�it�reduces�risk�by�establishing�a�more�diversified�portfolio�of�fuel� types.� Third,� it� reduces� Colombia’s� reliance� on� coal� and� other� fossil� fuels� to�generate� electricity�during�dry�periods,� thereby� reducing�Colombia’s� emissions� from�fossil�fuels.�
At�present,�the�economic�signal�favors�conventional�power�plants,�but�fortunately,�it� is� straightforward� enough� to� include� all� resources� in� a�nondiscriminatory�manner.�The� key� input� required� in� the� firm� energy� auction� is� an� estimate� of� the� resource’s�ability�to�supply�firm�energy.�This�is�already�done�for�all�hydro�and�thermal�resources.�What� is� required� is� an� analogous�methodology� to� estimate� firm� energy� for� variable�resources.�For�purposes�of�simplicity,�the�analysis�focuses�on�wind�power�as�a�variable�resource,�but�the�same�approach�applies�to�all�variable�resources—all�resources�of�any�type.�In�many�respects,�wind�power�is�actually�simpler�than�hydro�or�thermal,�since�it�is�straightforward�enough�to�estimate�the�energy�output�of�the�wind�resource.�This�is�a�step�already�taken�as�part�of�the�due�diligence�for�any�wind�project.�
For� hydro� resources,� the� regulator� estimates� the� firm� energy� of� a� hydro� project�using� a� time� series� of� hydrological� data,� ideally� five� or� more� decades.� For� thermal�resources,� the� firm�energy� rating� is�based�on� the�unit’s�nameplate� capacity,�which� is�then� reduced� based� on� sustainable� utilization� rates.� Estimating� the� firm� energy� of� a�wind� resource� is� similar� to� that� of� a� hydro� resource,� although� it� is� suggested� that� a�much� shorter� time� series� (perhaps� initially� based� on� Jepírachi’s� five�year� record� of�operation)�should�be�sufficient�to�determine�a�good�estimate�of�firm�energy�capability.�Such�a�series�would�be�produced�as�part�of�the�standard�due�diligence�of�an�investor�in�a�wind�power�project.�No�investor�would�build�a�wind�project�without�first�having�a�fairly�good�idea�of� the�project’s�average�energy�output.�Even�if� this� initial�estimate� is�biased,� there� is� little� economic� harm,� since� as� described� below� the� rating� would� be�adjusted� so� that� it� reflects� the� project’s� long�run� performance,� which� is� measured�automatically�by�the�system�operator.�
As�with�other�resources,�the�firm�energy�rating�should�be�updated�based�on�actual�performance.�This�is�difficult�for�hydro�resources�given�the�low�frequency�of�unusually�dry�periods,�roughly�once�every�10�years.�Wind�power�does�not�face�this�problem.�The�operation�of�wind�farms�generates�meaningful�data�on�firm�energy�that�integrates�local�site�specific�wind� conditions�with� turbine� efficiency.� For� this� reason,� it� would�make�sense� to� have� a� periodic� (yearly)� automatic� adjustment� to� the� firm� energy� rating� of�wind�resources�based�upon�historical�performance.��
For�purposes�of�simplicity,�it�is�recommended�that�the�firm�energy�rating�of�a�wind�resource�be�adjusted�annually�based�on�the�following�exponential�smoothing�formula:�
firm�energy�rating�in�year�t�+�1�=�½�(firm�energy�rating�in�year�t)��+�½�(energy�produced�in�year�t).�
SKU_18504_Wind_Energy_Colombia_6-17-10.pdf 53SKU_18504_Wind_Energy_Colombia_6-17-10.pdf 53 6/17/2010 12:32:12 PM6/17/2010 12:32:12 PM

34 World Bank Study
The�initial�period�for�locating�wind�plants�along�the�northern�coast�could�use�the�five�year�period�recorded�by�Jepírachi,�to�be�updated�annually�thereafter.�This�simple�approach� assures� that� the� firm� energy� rating� of�wind�power� closely� tracks� its� actual�performance.�The�key�assumption�in�the�formula�is�that�wind�power�is�not�correlated�with� dry� periods;� that� is,� wind� resources� on� average� generate� the� same� amount� of�energy� in� unusually� dry� periods� as� in� normal� periods.� If� the� seasonality� for� wind�power�is�correlated�with�dry�seasons,�then�it�would�make�sense�to�modify�the�formula�above�by�replacing�“energy�produced�in�year�t”�with�“energy�produced�in�dry�season�of�year�t”�and�then�scale�up�the�level�of�output�to�an�annual�measure�by�multiplying�by�12/(number�of�months�in�the�dry�season).�
Under� this� simple� approach,� the� firm� energy� rating� and� therefore� the� reliability�payment�will�quickly�converge�to�the�long�run�average�firm�energy�capability,�even�if�the�firm�energy�rating�in�the�initial�year�is�poorly�measured.�
An�exercise�was�conducted� to�calculate� the� results�of� the� firm�capacity� factor� for�the�Jepírachi�wind�farm�in�Colombia,�using�the�method�proposed�above.�
The�analysis�is�based�on�observed�wind�data�recorded�at�meteorological�stations�in�northern�Colombia.�These�data,�together�with�generation�data�from�Jepírachi,�allowed�the�reconstruction�of�a�24�year�data�series�on�monthly�wind�data�and�generation.�This�database�was�then�used�to�estimate�the�corresponding�firm�energy�rating�in�Jepírachi.�On�average,�the�yearly�firm�energy�rating�was�estimated�at�0.38,�with�a�range�between�0.25�and�0.47.6�For�the�dry�season,�the�average�firm�energy�factor�found�was�0.4�(with�an�initial�year�rating�of�0.37�and�a�maximum�firm�energy�factor�of�0.47).�When�this�firm�energy�rating�is�acknowledged�for�the�entire�year,�the�project�owners�could�receive�an�annual� average� of� US$975,000� from� the� reliability� payment,� based� on� the� auction�defined� value� of� US$13.9� per� MWh.� This� of� course� translates� into� very� attractive�earnings,�especially�when�the�lifetime�of�the�project�is�taken�into�consideration.�For�the�24�year�time�series�considered�here,�this�could�mean�total�project�earnings�of�US$23.4�million.�
The� suggested� approach� to� assess� the� reliability� factor� for� wind� farms� is� risk�neutral.�If�the�yearly�estimate�is�used�during�the�“dry�period,”�the�difference�between�the� annual�mean� and� the� dry� period�mean� could� be� interpreted� as� a� risk� reduction�strategy.�A�more�formal�option,�in�tune�with�the�general�risk�aversion�characteristic�of�Colombia’s� regulatory� framework,� is� to�subtract�standard�deviation�affected�by�some�factor�of�the�historical�performance.�
Importantly,�for�wind�power�the�call�option�portion�of�the�firm�energy�product�is�the�same�as�the�call�option�for�thermal�resources.�During�scarcity�periods�in�which�the�spot�price�exceeds� the�scarcity�price,� the�wind�resource�has�an�obligation� to�generate�energy�over�the�day�consistent�with�the�resource’s�firm�energy�rating.�Deviations�from�this�daily�obligation�are�resolved�at� the�spot�energy�price.�As�a�variable�resource,� the�energy�output�of�the�unit�will�surely�differ�from�the�obligation�on�any�particular�day,�but�over�the�course�of�many�days�the�unit�should�produce�an�amount�roughly�equal�to�its�firm�energy�rating.�Thus,�the�resource�should�meet�its�obligation�on�average,�and�if�it�does�so,�then�its�net�payment�for�deviations�would�be�approximately�zero.��
SKU_18504_Wind_Energy_Colombia_6-17-10.pdf 54SKU_18504_Wind_Energy_Colombia_6-17-10.pdf 54 6/17/2010 12:32:12 PM6/17/2010 12:32:12 PM

Wind Energy in Colombia 35
Notes �1�Note�that�the�firm�capacity�of�renewable�energy�is�the�capacity�of�conventional�sources�replaced,�so�that�demands�can�be�met�with�a�specified�reliability.�The�firm�capacity�of�a�renewable�source�depends�on�the�correlated�variations�in�demands�and�renewable�supplies�(Barrett�2007).�2� For� a� thorough� discussion� of� the� effects,� advantages� and� disadvantages� of,� and� barriers� to�distributed�generation,�see�COLCIENCIAS,�ISAGEN,�Universidad�Nacional,�and�Universidad�de�los�Andes�2006.��3� The� scarcity� price� is� determined� by�CREG� and�updated�monthly,� determining� the�wholesale�market� price� from� which� firm� energy� obligations� become� mandatory� and� establishing� the�maximum�price�at�which�this�energy�is�remunerated.�4�The�firm�energy�auction�under�the�reliability�payment�(cargo�por�confiabilidad)� is�a�scheme�that�establishes�long�term�commitments�and�is�expected�to�be�a�component�of�the�wholesale�energy�market�indefinitely.�The�auctions�are�held�during�various�years�prior�to�firm�energy�obligations�(time�is�provided�between�auctions�and�the�start�of�firm�energy�obligations�to�allow�new�projects�to� be� able� to� enter� into�operation).� To� this� end,� each�year� the�Regulatory�Commission� (CREG)�evaluates�the�balance�of�supply�and�demand�of�the�firm�energy�projections�and�if�necessary�calls�for� an� auction� (XM� 2009).� Available� online� at:� www.xm.com.co/Informes%20Empresariales/�InformeAnual_XM.pdf.�The�next�firm�energy�auction�has�not�been�scheduled.�5� It� is�worth�noting�that�although�the�reliability�payment�has�been�successful� in�getting�projects�registered�and�assigned�to�provide�firm�energy,�many�of�the�projects�that�participated�in�the�firm�energy�auction�lacked�an�environmental�assessment�of�alternative�projects�(UPME�2009).�This�can�lead�to�system,�environmental,�and�investor�risks�(for�example,�if�it�is�later�found�that�the�projects�cannot� be� implemented� due� to� more� environmentally� friendly� alternatives).� However,� it� is�important� to� keep� in� perspective� the� lessons� from� similar� cases� in� other� countries� where�hydropower�projects�are�waiting� in� the�pipeline�and�are�being�replaced�by�coal�power�projects�because�it�takes�a�long�time�to�produce�the�environmental�licenses�of�hydropower�projects.�This,�of�course,�may�lead�to�dire�and�unintended�consequences.�For�this�reason,�to�avoid�the�possible�risk�described�above,�it� is�recommended�that�there�be�high�level�coordination�among�ministries�and� expedited� action� by� the� Ministry� of� Environment� to� review� environmental� licenses�(including�a�review�of�possible�alternatives).��6�Lower�values�are�associated�with�the�start�of�the�project�and�the�technical�learning�curve�of�the�operating�agency.�The�range�highlights�the�variability�of�the�wind�field.�7�As�stated�previously,�even�if� the�firm�energy�rating�in�the�initial�year� is�poorly�measured,�the�initial� firm� energy� rating� (and� therefore� the� reliability� payment)� of� 30� percent� will� quickly�converge�to�the�long�run�average�firm�energy�capability.�
SKU_18504_Wind_Energy_Colombia_6-17-10.pdf 55SKU_18504_Wind_Energy_Colombia_6-17-10.pdf 55 6/17/2010 12:32:12 PM6/17/2010 12:32:12 PM

36
CHAPTER �7 �
Assessing�the�Effectiveness�of�Policy�Instruments�and�Policy�Options:�Impact�on�a�300�MW�Wind�Powered�Power�Plant�Operating�in�the�Wholesale�
Energy�Market�
his�chapter�aims�at�exploring�the�effectiveness�of�alternative�policy�instruments�in�facilitating�market� entry�of� the�wind�option.�The� consequences� of� the� alternative�
instruments� are� measured� in� terms� of� the� financial� result� expected� by� potential�investors.�A�hypothetical�300�MW�wind�power�project�is�used�to�estimate�the�impacts�from� the�different� alternatives.�Wind� resources�were�defined�using�historical� records�and�data�from�Jepírachi.�Performance�and�operational�data�are�based�on�this�pilot�wind�farm.� (Details� are� available� upon� request.)� Scenarios� of� the� expected� price�energy�production�response�of� the�Colombian�wholesale�energy�market�(MEM)�from�2008�to�2025� are� used.� This� step� is� both� a� necessary� input� for� assessing� the� financial�sustainability� of� the� wind� project� and� a� useful� methodology� to� help� evaluate� other�projects.� These� estimates� rely� on�UPME’s� July� 2008� forecasts� for� the� national� energy�market,� and� include� the� analyses� of� demand� forecasts,� natural� gas� prices,� and� the�expected� optimal� (minimum�cost)� generation� expansion� adjusted� to� include� the�characteristics�of�the�Colombian�transmission�grid.�
For� the� purpose� of� assessing� the� attractiveness� of� the� wind� farm� investment�through� its� financial� return,� the� study� kept� the� value� of� the� reliability� payment� for�plant�energy�remuneration�constant�at�US$13.05/MWh�up�to�November�2012,�and�then�increased� this� to� US$14.00/MWh� through� the� planning� horizon.1� The� following�chapters�summarize�the�analyses�made,�relegating�the�more�detailed�technical�studies�to�technical�appendixes�and�supporting�documentation.�This�section�concludes�with�an�examination�of�the�options�available�to�the�government�for�the�promotion�of�increased�RET�participation�in�the�country’s�energy�mix.�
T
SKU_18504_Wind_Energy_Colombia_6-17-10.pdf 56SKU_18504_Wind_Energy_Colombia_6-17-10.pdf 56 6/17/2010 12:32:12 PM6/17/2010 12:32:12 PM

Wind Energy in Colombia 37
�
Baseline Information
Domestic Demand Forecasts
As�stated�above,�demand�forecasts�for�the�National�Interconnected�System�(NIS)�were�obtained� from�UPME’s� latest� forecasts� dated� July� 2008� (figure� 7.1),� before� the� global�financial� crisis� ensued,� and� thus� may� be� currently� characterized� as� somewhat�optimistic.��
Figure 7.1. Colombia NIS Demand Forecasts, 2007–2028
�Source:�UPME,�July�2008.��
Wind Project Generation
Based� on� the� MEM� projections,� figure� 7.2� shows� the� estimated� monthly� values� for�wind�power�generation,�including�average,�low�(P10),�and�high�(P90)�estimates.2�Wind�conditions�are�average�conditions,�estimated�based�on�the�existing�Jepírachi�records.��
Figure 7.2. Wind Project Generation Estimates 2012–2025
�Source:�Authors’�data.��
0
20,000
40,000
60,000
80,000
100,000
120,000
GWH
Low Mean High
LOW 52,851 53,882 55,398 57,435 59,392 61,261 63,221 65,274 67,318 69,338 71,415 73,498 75,693 78,067 80 ,066 82,109 84,393 86,727 89,016MEAN 52,851 54,086 56,060 58,567 60,907 63,313 65,754 68,279 70,897 73,611 76,372 79,297 82,386 85,218 88,136 91,377 94,203 97,006 100,128HIGH 52,851 54,290 56,608 59,247 62,100 65,027 68,01 3 71,142 74,466 77,953 81,954 85,358 89,471 92,821 96,279 100,35 104,02 107,58 111,556
2007 2008 2009 2010 2011 2012 2013 2014 2015 2016 2017 2018 2019 2020 2021 2022 2023 2024 2025
0
50
100
150
200
250RET PROJECT GENERATION (GWH)
MeanP10P90
Jan-12
Oct-12
Jul-13
Apr-14
Jan-15
Oct-15
Jul-16
Apr-17
Jan-18
Oct-18
Jul-19
Apr-20
Jan-21
Oct-21
Jul-22
Apr-23
Jan-24
Oct-24
Jul-25
(GW
H)
SKU_18504_Wind_Energy_Colombia_6-17-10.pdf 57SKU_18504_Wind_Energy_Colombia_6-17-10.pdf 57 6/17/2010 12:32:12 PM6/17/2010 12:32:12 PM

38 World Bank Study
�
Pool Prices
Pool�prices�in�the�wholesale�market�are�formed�by�adding�other�variable�costs�(CERE,�FAZNI,� environmental,� and� Automatic� Generation� Control� [AGC])� to� the� pure�marginal� cost.� This� is� presented� for� the� mean� case� scenario� in� figure� 7.3� (the� other�scenarios�analyzed�are�included�in�Appendix�3).�Pool�price�comparisons�of�the�mean,�high�and�low�scenarios�are�presented�in�figure�7.4.��
Figure 7.3. Pool Prices, Base Scenario
�
Source:�Authors’�data.��
Figure 7.4. Comparison of Pool Prices for Base, High, and Low Scenarios
�Source:�Authors’�data.�
Annual NIS Balances
This�analysis�also�projects�annual�energy�balances�for�the�NIS�under�the�four�scenarios�considered.�These�projections�show�the�magnitude�of�the�effect�of�reduced�hydrology�generation� versus� official� expected� hydrology� generation,� with� the� corresponding�increase�in�the�gap�to�be�met�by�alternative�means,�that�is,�thermal�generation.�(These�balances�can�be�found�in�Appendix�4,�tables�A4.1�to�A4.4.)�
0
20
40
60
80
100
120
US$/M
wh
POOL PRICES—Mean Scenario
MeanP10P90
Jul-08
Jun-09
May-10
Apr-11
Mar-12
Feb-13
Jan-14
Dec-14
Nov-15
Oct-16
Sep-17
Aug-18
Jul-19
Jun-20
May-21
Apr-22
Mar-23
Feb-24
Jan-25
Dec-25
0
20
40
60
80
100
120
140
US$/M
Wh
AVERAGE POOL PRICES—Mean, High and Low Scenarios
MeanHighLow
Jul-08
Feb-09Sep-
09Apr-
10Nov-
10Jun
-11Jan
-12Aug-
12Mar-
13Oct-1
3May-
14Dec-
14Jul
-15Feb-
16Sep-
16Apr-
17Nov-
17Jun
-18Jan
-19Aug-
19Mar-
20Oct-2
0May-
21Dec-
21Jul
-22Feb-
23Sep-
23Apr-
24Nov-
24Jun
-25
SKU_18504_Wind_Energy_Colombia_6-17-10.pdf 58SKU_18504_Wind_Energy_Colombia_6-17-10.pdf 58 6/17/2010 12:32:12 PM6/17/2010 12:32:12 PM

Wind Energy in Colombia 39
�
Baseline Results
A�threshold�of�14�percent�Internal�Rate�of�Return�(IRR)�was�used�to�indicate�adequate�return� to� potential� investors� based� on� experience�with� previous� operations� (Amoyá,�Jepírachi)�and�on�a�comparison�with�international�markets.�
Three�scenarios�were�used�to�define�the�overall�energy�demand�and�its�relation�to�fuel�prices.�The�outcomes�of�these�scenarios�determine�for�an�“investment�project”�the�set� of�prices� that� the� investor�might� expect.� The�overall� indicative�prices� range� from�US$39.41/MWh�for� the�base�high�hydro�scenario� (see� table�7.1)� to�US$66.70/MWh�for�the� high� demand–high� fuel� prices� scenario.� The� baseline� scenario� has� an� indicative�price� of� US$50.60/MWh.� Although� all� the� cases� were� analyzed� for� all� the� basic�scenarios,�the�presentation�will�focus�on�the�baseline�conditions.��Table 7.1. Demand Scenarios for the Interconnected Grid and Resulting Indicative Prices
Scenario Demand Fuel prices Hydro Indicative price a
(US$/MWh)
Low Low Low Revised 43.3 Baseline Base Base Revised b 50.6
High High High Revised 66.7
Source:�Authors’�data.�a.�Indicative�average�energy�price�over�the�2007�to�2028�simulation�period.�b.�Energy�production�factor�for�hydropower�plants�estimated�from�historical�generation�records�from�the�NEON�database.��
Table� 7.2� presents� the� results� obtained� for� the� baseline� analysis.� The� expected�returns� on� equity� are� shown� for� each� of� the� general� scenarios� considered� for�Colombia’s�interconnected�system.�In�addition,�given�the�importance�of�the�investment�costs�in�the�policy�analysis�and�in�the�financial�returns,�table�7.2�presents�results�for�a�wide� range� of� unit� investments� (expressed� in� US$/kW).� These� results� indicate� that�returns� are� sensitive� to� the� general� growth� scenario� and� the� general� economic�environment.� Because� investments� in� the� power� sector� are� long� term,� average�conditions� should� be� expected� to� dominate.� The� selected� baseline� scenario��provides� a� conservative� picture� of� potential� returns,� although� with� a� medium� risk.���Table 7.2. Expected Returns on Equity before Taxes for a 300 MW Wind Farm in Colombia—Business-as-Usual Results (no government intervention)
Capital cost per kW installed
National Base Scenarios $2,400 $2,100 $1,800
Low 4.7% 6.2% 8.1%
Medium/Baseline 5.8% 7.6% 9.9%
High 9.2% 11.5% 14.8%
Source:�Authors’�data.�Note:�The�results�assume�access�to�Carbon�Emission�Reductions�of�US$18/tCO2.�
�
SKU_18504_Wind_Energy_Colombia_6-17-10.pdf 59SKU_18504_Wind_Energy_Colombia_6-17-10.pdf 59 6/17/2010 12:32:12 PM6/17/2010 12:32:12 PM

40 World Bank Study
�
As� the� unit� investment� costs� decrease,� the� return� increases� should� be� expected.�Nevertheless,�it�should�be�emphasized�that�under�the�business�as�usual�scenario—that�is,� without� policy� intervention—wind� energy� investments� are� not� attractive� to�potential� investors.�Thus,� if� the�GOC�aims� to� increase� the�proportion�of� its�electricity�from�renewable�sources,�it�is�required�to�adopt�policies�to�aid�market�entry�of�RET�by�creating� the� enabling� environment� for� independent� investors� to� develop�nonconventional�renewable�source�power�projects.�
Impact of Selected Policy Options
Not�all� of� the� available�policy� instruments� are� applicable� to� the� case� of�Colombia.�A�selection� was� therefore� made,� considering� those� that� would� fit� the� regulatory�framework�and�that�focus�on�actions�that�would�not�distort�the�wholesale�market.�
In� order� to� assess� the� effectiveness� of� the� options,� the� financial� results� of� their�deployment�are�quantified.�The�assessment�of� financial�results� from�different�options�assists� in� the� selection� of� policy� instruments� and� the� adoption� of� a� coherent� set� of�alternatives�that�individually�or�jointly�accomplish�the�desired�results�for�the�potential�investors.��
Selected Policy Options
The�options�were�grouped�under�common�policy�themes:�Group� I.� Access� international� financial� instruments� to� internalize� global�
externalities�in�national�and�private�decisions.�The�government�can�play�a�leading�and�active� role� in� accessing� bilateral� and� multilateral� financial� instruments� aimed� at�reducing�GHG�emissions,�such�as�the�CDM�(this�instrument�is�already�mainstreamed�into�Colombia’s�environmental�policy).�This�would�be�complemented�through:�
� The�government�acting�as�a�bridge�to�attract�multilateral�soft�loans�earmarked�for�alternative�energies;�and�
� The� government� facilitating� access� to� clean� technology� concessionary�financing.�
Group�II.�Target�subsidies�and�government�fiscal�mechanisms.�Under�this�group�of� policy� options� the� government� uses� fiscal� measures� for� the� benefit� of� potential�investors.�Specifically,�the�mechanisms�identified�include�tax�subsidies�and�waiving�of�dispatch�control�charges�(like�AGC).�
Group� III.� Reform� the� regulatory� system.� Under� this� policy� package,� the�regulatory� system� is� adjusted� to� be� technologically� neutral� (creating� a� level� playing�field� among� technologies),� and� could�be� complemented� to�guide� the� country� toward�low� carbon� intensity� development.� The� existing� regulatory� system� has� developed�mechanisms� to� steer� the�market� in� order� to� provide� a�more� resilient� interconnected�system�(expressed�by�its�capacity�to�deliver�the�demand�even�during�the�most�difficult�hydrological�conditions).�In�doing�so,�RETs�have�not�received�adequate�compensation�for� their� contribution.� This� situation� needs� to� be� adjusted� and� new� tools� could� be�included�to�give�greater�flexibility�to�the�government�in�fostering�RET.�This�includes:�
� Complementing�the�scope�of�the�reliability�charge�to�include�RET,�and�wind�in�particular;�
SKU_18504_Wind_Energy_Colombia_6-17-10.pdf 60SKU_18504_Wind_Energy_Colombia_6-17-10.pdf 60 6/17/2010 12:32:13 PM6/17/2010 12:32:13 PM
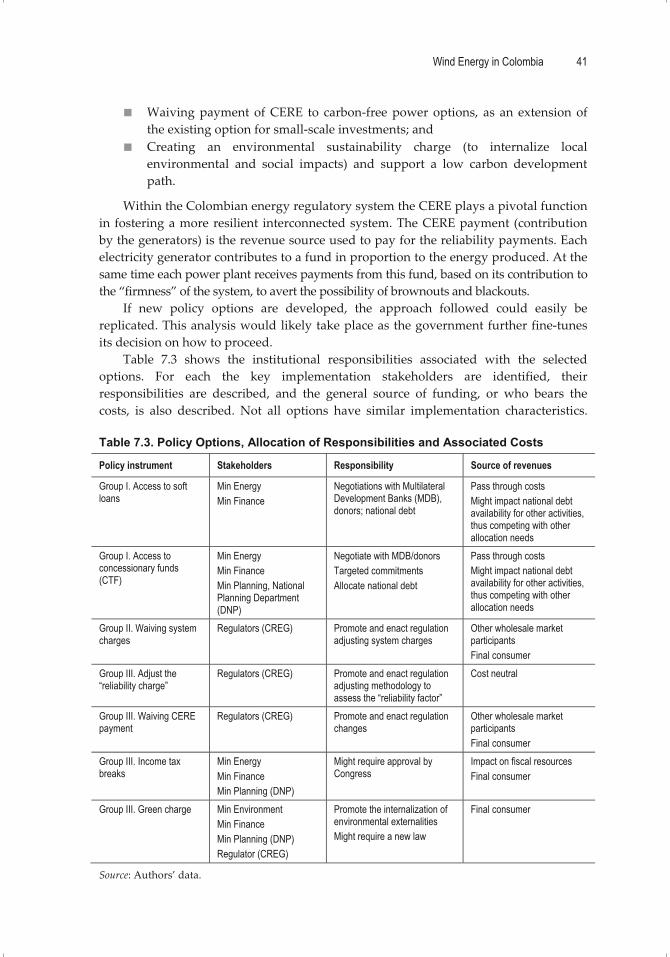
Wind Energy in Colombia 41
�
� Waiving�payment� of�CERE� to� carbon�free�power�options,� as� an� extension�of�the�existing�option�for�small�scale�investments;�and�
� Creating� an� environmental� sustainability� charge� (to� internalize� local�environmental� and� social� impacts)� and� support� a� low� carbon� development�path.�
Within�the�Colombian�energy�regulatory�system�the�CERE�plays�a�pivotal�function�in� fostering�a�more�resilient� interconnected�system.�The�CERE�payment� (contribution�by�the�generators)�is�the�revenue�source�used�to�pay�for�the�reliability�payments.�Each�electricity�generator�contributes�to�a�fund�in�proportion�to�the�energy�produced.�At�the�same�time�each�power�plant�receives�payments�from�this�fund,�based�on�its�contribution�to�the�“firmness”�of�the�system,�to�avert�the�possibility�of�brownouts�and�blackouts.�
If� new� policy� options� are� developed,� the� approach� followed� could� easily� be�replicated.�This�analysis�would�likely�take�place�as�the�government�further�fine�tunes�its�decision�on�how�to�proceed.�
Table� 7.3� shows� the� institutional� responsibilities� associated� with� the� selected�options.� For� each� the� key� implementation� stakeholders� are� identified,� their�responsibilities� are� described,� and� the� general� source� of� funding,� or� who� bears� the�costs,� is� also� described.� Not� all� options� have� similar� implementation� characteristics.���Table 7.3. Policy Options, Allocation of Responsibilities and Associated Costs
Policy instrument Stakeholders Responsibility Source of revenues
Group I. Access to soft loans
Min Energy Min Finance
Negotiations with Multilateral Development Banks (MDB), donors; national debt
Pass through costs Might impact national debt availability for other activities, thus competing with other allocation needs
Group I. Access to concessionary funds (CTF)
Min Energy Min Finance Min Planning, National Planning Department (DNP)
Negotiate with MDB/donors Targeted commitments Allocate national debt
Pass through costs Might impact national debt availability for other activities, thus competing with other allocation needs
Group II. Waiving system charges
Regulators (CREG) Promote and enact regulation adjusting system charges
Other wholesale market participants Final consumer
Group III. Adjust the “reliability charge”
Regulators (CREG) Promote and enact regulation adjusting methodology to assess the “reliability factor”
Cost neutral
Group III. Waiving CERE payment
Regulators (CREG) Promote and enact regulation changes
Other wholesale market participants Final consumer
Group III. Income tax breaks
Min Energy Min Finance Min Planning (DNP)
Might require approval by Congress
Impact on fiscal resources Final consumer
Group III. Green charge Min Environment Min Finance Min Planning (DNP) Regulator (CREG)
Promote the internalization of environmental externalities Might require a new law
Final consumer
Source:�Authors’�data.�
SKU_18504_Wind_Energy_Colombia_6-17-10.pdf 61SKU_18504_Wind_Energy_Colombia_6-17-10.pdf 61 6/17/2010 12:32:13 PM6/17/2010 12:32:13 PM

42 World Bank Study
�
For�example,�access�to�concessionary�funds�might�require�the�country�to�make�targeted�commitments�as� to�GHG�emission� reductions� to�achieve�by�defined�dates,�as�well�as�potential� impacts�on� the�national�debt�ceiling,�with�potential�allocation�conflicts�with�other� sectors� and�national� needs.� Table� 7.3� shows� that� in� general� the� selected�policy�instruments� are� relative� easy� to� implement,� especially� those� related� to� adjusting� the�regulatory�system.�
Results
Tables�7.4a,�b,�and�c�present�the�calculated�returns�on�investments�resulting�from�the�application� of� the� policy� instruments.� The� results� are� presented� for� a� range� of� unit�investments�from�US$1,800/kW�to�US$2,400/kW.�Table�7.4a�presents�the�results�with�20�percent,�table�7.4b�with�30�percent,�and�table�7.4c�with�36�percent�reliability�payment.3�The� policy� instruments� used� are� classified� in� three� types:� financial� instruments;�government� fees,� including� taxes;� and� regulatory� instruments.� The� internal� rate� of�return�is�calculated�for�the�project�and�for�equity,�before�and�after�taxes.�The�threshold�to� judge�the�policy�effective� is�14�percent.�The�tables�are�divided�between�two�policy�options:� policy� option� A� with� using� the� reliability� payment� and� policy� option� B�without� using� the� reliability� payment.� Both� policy� options� use� the� same� base� and�carbon� revenues� (US$18/tCO2)� as� a� basis,� and� add� one� or� more� policy� instruments�when�going�toward�the�right�in�the�columns.�For�purposes�of�simplicity,�the�results�are�summarized�only�for�the�medium�case�scenario.�The�analyses�were�also�conducted�for�each� market� scenario,� the� results� of� which� can� be� found� in� Appendix� 4.� The� term�“base”�in�the�table�indicates�the�status�quo.�
Tables�7.4a,�b,�and�c�provide�a�summary�of�a�possible�set�of�policy�options�open�to�the� GOC.� The� selection� of� the� set� of� policy� instruments� needed� depends� on� the�expected� level�of� investment�costs�associated�with�wind�power�projects� in�Colombia.�The�industry�outlook�seems�to�be�that�costs�will�decrease�with�time,�but�the�reduction�of� costs� alone� does� not� make� the� wind� power� sector� financially� feasible.� If� wind�receives� reliability� payments� for� its� contribution� to� firm� energy,� the� need� for�complementary�inducements�is�a�function�of�the�methodology�adopted�to�assess�such�contribution.� If� the� suggested� methodology� is� adopted,� no� further� inducement� is�required.�If�a�more�risk�averse�estimate�is�used,�other�policy�instruments�are�required,�at�least�until�the�investment�costs�catch�up�the�difference.�
The�results�indicate:��
� All�options�considered�improve�the�financial�return�on�wind�investments.�� Wind� farms� become� attractive� to� the� Colombian� energy� market� when� their�
unit� investment� costs� (US$� per� kW� installed)� are� such� that� independent�investors� reach� the� target� IRR� of� 14� percent.� Under� existing� market� and�regulatory� conditions� (wind�plants� are�not� recipients� of� reliability�payment),�the� investment� cost� threshold� is� estimated� to� be� $1,250/kW.� If� wind� farms�benefit�from�reliability�payments,�the�threshold�unit�investment�cost�increases�as� follows:� for� reliability� factors�of� 20,� 30,� and�36�percent,� the� corresponding�threshold� unit� investment� costs� are� $1,660/kW;� $1,820� /kW,� and� $1,880/kW,�respectively.� In� the� latter� two� cases,� investment� in� wind� projects� becomes�financially�viable�for�existing�wind�technologies.�
SKU_18504_Wind_Energy_Colombia_6-17-10.pdf 62SKU_18504_Wind_Energy_Colombia_6-17-10.pdf 62 6/17/2010 12:32:13 PM6/17/2010 12:32:13 PM

Wind Energy in Colombia 43
�
� Adjusting� the� reliability� payment� (leveling� the� regulatory� playing� field� for�nonconventional�renewable�energy�technologies)�is�a�very�effective�incentive.�A� reliability� factor�greater� than�30�percent�by� itself� allows�wind� farms� to�be�financially� feasible� for� low� investment� costs,� such� as� those� recently� reported�for�Europe.�
� Eliminating�income�taxes�does�not�seem�to�be�an�effective�instrument�to�attract�investments�to�RET,�given�the�criteria�utilized�to�judge�financial�feasibility.�It�does�not�lead�to�a�14�percent�IRR�under�the�conditions�considered.�
� If�reliability�payment�is�not�used,�also�eliminating�fees�(AGC,�FAZNI,�CERE)�makes�wind�power�attractive�at�a�US$1,800/kW�investment�cost.�
� Access�to�concessionary�financing�has�a�significant�effect.�This�option�requires�clean�technology�concessionary�funding4�for�up�to�40�percent�of�the�total�unit�investment�to�reach�a�14�percent�IRR.�
� As� expected,� the� reduction� in� unit� investment� (US$2,400� versus� US$1,800)�improves� return� on� investment.� However,� a� reduction� in� investment� costs�alone�falls�short�of�reaching�the�14�percent�IRR�target.�
In�summary,�under�existing�conditions�wind�farms�are�not�financially�attractive�in�Colombia� even� considering� the� drop� in� investment� costs� recorded� during� 2009.�However,� wind� investments� would� become� financially� attractive� if� the� benefits� of�reliability�payments�are�extended�to�wind�power,�even�under�current�investment�costs.�The�government�has�other�multiple�policy�instruments�to�steer�independent�investors�toward� RETs.� Adopting� several� of� these� options,� as� detailed� in� the� report,� seems�relatively�simple�and�will�not�distort�the�market.�Improving�the�conditions�for�market�entry� of� the� wind� option� will� serve� to� prepare� the� sector� for� the� anticipated�improvement�of�conditions�as�investment�costs�for�wind�decrease�over�time.�
Finally,� deployment� of� the�wind� option�would� help� the� sector� to� strengthen� its�climate�resilience�and�be�better�prepared�to�face�climate�variability,�without�increasing�its�carbon�footprint.�
To�complement�the�incentive�structure,�the�government�has�various�instruments�at�its�disposal.�If�it�uses�the�capacity�to�partially�waive�CERE�payments,�the�attractiveness�to�potential�investors�is�increased�and�wind�power�projects�could�be�implemented�at�a�faster�pace�and�for�a�wider�set�of� international�investment�costs.5�The�results�for�each�set�of�policy�instruments�integrated�into�a�policy�option�illustrate�the�advantages�and�limitations�of�such�an�approach.�The�GOC�would�do�better�by�mixing�policy�options�to�obtain�the�desired�results.�This�is�the�analysis�introduced�in�the�next�section.�
� �
SKU_18504_Wind_Energy_Colombia_6-17-10.pdf 63SKU_18504_Wind_Energy_Colombia_6-17-10.pdf 63 6/17/2010 12:32:13 PM6/17/2010 12:32:13 PM

44 W
orld Bank Study
�
Table 7.4a. Financial Results for a 300 MW Wind Farm In Northern Colombia after Use of Financial Instruments; Reliability Payment Considered with a 20 Percent Firm Energy Factor
�
Source:�Authors’�data.�Note:�If�no�financing�terms�are�mentioned,�it�is�assumed�that�the�investor�must�finance�70�percent�of�the�project�costs�through�commercial�credits.�*Income�tax�reduction�of�15%�after�2017.�
��
SKU_18504_W
ind_Energy_Colombia_6-17-10.pdf 64
SKU_18504_W
ind_Energy_Colombia_6-17-10.pdf 64
6/17/2010 12:32:13 PM6/17/2010 12:32:13 PM

Wind Energy in Colombia
45
�
Table 7.4b. Financial Results for a 300 MW Wind Farm in Northern Colombia after Use of Financial Instruments; Reliability Payment Considered with a 30 Percent Firm Energy Factor
�
Source:�Authors’�data.�Note:�If�no�financing�terms�are�mentioned,�it�is�assumed�that�the�investor�must�finance�70�percent�of�the�project�costs�through�commercial�credits.�*Income�tax�reduction�of�15%�after�2017.�
��
SKU_18504_W
ind_Energy_Colombia_6-17-10.pdf 65
SKU_18504_W
ind_Energy_Colombia_6-17-10.pdf 65
6/17/2010 12:32:13 PM6/17/2010 12:32:13 PM

46 W
orld Bank Study
�
Table 7.4c. Financial Results for a 300 MW Wind Farm in Northern Colombia after Use of Financial Instruments; Reliability Payment Considered with a 36 Percent Firm Energy Factor
�
Source:�Authors’�data.�Note:�If�no�financing�terms�are�mentioned,�it�is�assumed�that�the�investor�must�finance�70�percent�of�the�project�costs�through�commercial�credits.�*Income�tax�reduction�of�15%�after�2017.�
�
SKU_18504_W
ind_Energy_Colombia_6-17-10.pdf 66
SKU_18504_W
ind_Energy_Colombia_6-17-10.pdf 66
6/17/2010 12:32:14 PM6/17/2010 12:32:14 PM

Wind Energy in Colombia 47
�
Key Findings: Options to Foster Investment in Wind Power
The� analysis� of� the� information� generated� in� the� previous� section� illustrates� the�alternatives� available� to� the� GOC� for� promotion� of� wind� power.� The� higher� the�investment�cost,�the�greater�government�intervention�is�needed�to�promote�investment�in� RET.� Moreover,� for� investors� not� paying� for� CERE� it� is� the� same� as� having� a�reliability�factor�of�0.4.�This�should�be�obvious:�CERE�is�the�fund�used�to�remunerate�the� guaranteed� firm� energy.� Recognizing� the� contribution� of� wind� power� to� firm�energy� allows� it� to� benefit� from� reliability� payments,� thus� offsetting� the� expenditure�incurred� in� paying�CERE.�At� the� conceptual� level,� policy�makers� have� the� option� of�either� waiving� CERE� payment� from� wind�power� producers,� or� recognizing� their�project’s�firm�capacity.�In�this�case,�it�may�be�simpler�to�recognize�the�firm�capacity�of�each�project.�
Table�7.5�summarizes�alternative�enabling�environments�conducive�to�investments�in�the�wind�power�sector�under�the�three�cases�of�reliability�payments.��Table 7.5. Key Findings: Combination of Policy Instruments to Reach a Financial Threshold
Investment cost/kW (US$)
If reliability payment considered at Required actions to reach a 14% IRR
$2,400 20% Need 40% clean tech concessionary financing + 20% soft loans 6+ 10% commercial credits
30% Need 30% of clean tech concessionary financing + 30% soft loans + 10% commercial credits
36% Need 20% clean tech concessionary financing + 50% soft loans
$2,100 20% Need 15% clean tech concessionary financing + 55% soft loans; or 20% of clean tech concessionary financing + 40% soft loans + 10% commercial credits
30% Need 5% clean tech concessionary financing + 65% soft loans; or 20% of clean tech concessionary financing + 10% soft loans + 40% commercial credits
36% Need 60% soft loans + 10% commercial credits
$1,800 20% Need 40% soft loans + 30% commercial credits
30% No concessionary financing is needed
36% No concessionary financing is needed
Source:�Authors’�data.��
If� the�GOC�decides� to�promote�wind�power�under� a�pessimistic� investment� cost�outlook,� high� reliability� factors,� reduction� in� fees,� and� concessionary� financing� are�required� (individually� or� in� conjunction).�On� the� other� hand,� if� investment� costs� are�US$1,800/kW,� then� less� concessionary� financing�and� fewer�policy� instruments�would�be�required.�The�results�summarized�in�table�7.5�provide�a�guideline�for�the�GOC�in�the�selection�of�a�long�term�policy�option�for�various�wind�technology�investment�costs.�A�potential�transition�strategy�would�be�to�develop�and�apply�long�term�policy�options—to� capture� all� the� complementarity� benefits� to� the� interconnected� system—while�creating� conditions� for� some� early� entrants� to� give� the� energy� market� players� and�operators� the� opportunity� to� learn� and� gain� experience� in� the� operation� and� system�maintenance�of�large�scale�wind�projects.�
SKU_18504_Wind_Energy_Colombia_6-17-10.pdf 67SKU_18504_Wind_Energy_Colombia_6-17-10.pdf 67 6/17/2010 12:32:14 PM6/17/2010 12:32:14 PM

48 World Bank Study
�
Conclusions of the Estimated Impact of Alternative Policy Options for a 300 MW Wind Energy Power Plant in the MEM
The� analysis� conducted� and� the� results� summarized� in� previous� sections� allow� the�following�general�conclusions�and�results:��In�conclusion,� the�analysis�from�the�viewpoint�of�potential� investors�provides�a�good�foundation�for�understanding�the�relative�strength�of�different�options.�
� Under�current�policy,�regulatory�and�market�conditions,�wind�power�projects�are�not�attractive�for�private�investment.�
� The� starting� point� to� promote�wind�power� should� be� to� review� the� existing�regulatory�system�in�detail�and�remove�any�biases�against� renewable�energy�technologies.�
� Of�all�the�options�available�to�the�GOC�to�improve�the�financial�performance�of� wind�power� plants,� the� reliability� payment� has� the� greatest� influence� on�returns.� If� the� reliability� charge� is� applied� at� levels� reflecting� the� historical�contribution�of�Jepírachi’s�energy�generation�during�the�dry�period,� financial�performance�for�wind�power�improves�significantly.��
� If�investment�costs�for�wind�power�continue�decreasing�from�the�high�values�observed� in� late� 2008,� as� expected� in� the� near� future,� the� returns� improve�considerably.�Therefore,�some�options�could�be�seen�as�a�bridge�mechanism�to�be� ready� for� future� conditions� under� which� wind� power� would� be� more�competitive.�
� Access� to� concessionary� resources,� such� as� those� associated� with� clean�technology�multilateral�funds�and�soft�loans,�could�be�very�useful�to�promote�early� investments;� and� exempting� some� charges� and� payments� used� in� the�regulatory� system� is� shown� to� be� very� effective� in� increasing� the� IRR.�Internalizing� costs� of� global� externalities� through� clean� technology�concessionary� loans�would�be� enough� to�provide� returns�on� equity�over� the�selected� threshold,� for� basically� all� investment� costs� (in� the� analysis� the�maximum�US$2,400/kW�is�used).�This�holds� true�even� if� the�generators�have�to�pay�all�MEM�charges.�
� The� results� also� indicate� that� the� GOC� has� the� possibility� to� target� future�expectations� regarding� the� investment� costs� associated� with� wind� energy�technology.� At� one� extreme� the� regulators� might� study� the� possibility� of�fostering�RETs�even�at�investment�prices�above�US$2,200/kW,�for�example.�Or�they� might� consider� a� more� conservative� approach� targeting� wind� projects�only� if� investment� costs� fall� below� US$1,900/kW� or� a� similar� value.� As�previously� indicated,� the� higher� the� investment� costs,� the� greater� the�government�intervention�required.�
� Waiving� the� payment� of� CERE� by� RET� generators� is� equivalent� to�remunerating� the� contribution� of�wind�power� projects� (for� the� conditions� of�the�easterly�wind�fields�in�northern�Colombia)�at�a�reliability�factor�of�around�0.4.�That�is,�from�the�potential�investor’s�viewpoint�(expected�financial�returns�on�investment),�waiving�a�project’s�obligation�to�make�CERE�contributions�is�financially� equivalent� to� remunerating� the� project�with� a� reliability� factor� of�
SKU_18504_Wind_Energy_Colombia_6-17-10.pdf 68SKU_18504_Wind_Energy_Colombia_6-17-10.pdf 68 6/17/2010 12:32:14 PM6/17/2010 12:32:14 PM

Wind Energy in Colombia 49
�
0.4.�However,�it�should�be�noted�that�policy�makers�have�the�option�of�either�waiving� CERE� payment� from� wind�power� producers,� or� recognizing� their�project’s� firm� capacity.� In� this� case,� it�may� be� simpler� to� recognize� the� firm�capacity�of�each�project.�
� The�GOC�could�also�consider�temporary�incentives�for�RET�initiatives.�That�is,�the�energy�sector�could�benefit�from�the�early�implementation�of�wind�projects�as�a�mechanism�to�gain�experience�in�operating�the�interconnected�system�for�the�possible�case�of�when�wind�energy�becomes�a�more�significant�contributor�to�the�grid.�Similarly,�the�energy�sector�would�also�benefit�from�having�a�well�functioning�regulatory�system�for�this�power�technology.�After�a�well�defined�“promotion� and� experimentation� period,”� sufficient� to� give� the� technology�time�to�further�reduce�its�investment�needs,�the�incentives�could�be�eliminated�or�adjusted.��
Notes �1�As�previously�indicated,�the�reliability�payment�seeks�to�provide�independent�investors�with�an�economic�signal�of�the�relative�importance�of�reliable� installed�(firm)�power�capacity.�The�GOC�conducted�a�public�auction�to�allocate�“reliability�payments”�for�future�power�plants.�A�value�of�US$13,998/MWh�has�resulted�from�the�firm�energy�auction�held�in�May�2008.�2�P10�indicates�the�energy�generated�with�a�10�percent�probability�of�values�being�lower,�and�P90�indicates�the�value�with�a�90�percent�probability�of�values�being�lower.�These�probabilities�refer�to�monthly�values�and�cannot�be�assumed�for�longer�periods.�3� As� explained� in� previous� sections,� estimates� using� the� available� information� from� Jepírachi,�complemented�by�observational�records�from�nearby�wind�measuring�stations�from�1985�to�2008,�produced� a� reliability� factor� of� 0.415� with� a� standard� deviation� of� 0.055.� For� illustration,� a�reliability� factor� of� 0.36� is� used� in� this� analysis,� equivalent� to� the�mean� value� reduced� by� one�standard�deviation.�4� The� Clean� Technology� Fund� (CTF)� is� a� climate� change� donor�driven� fund� seeking� the�implementation�of�transformational�low�carbon�options.�CTF�financial�conditions�are�typically�a�0.65%�interest�rate�with�a�20��to�40�year�repayment�period�and�10�years�of�grace.�5� It� should� be� noted� that� simultaneously� allowing� for� reliability� charges� and� waiving� CERE�payments� is� not� recommended.� It� would� imply� a� logical� contradiction� because� funds� for� the�reliability�charge�come�from�CERE.�6�CTF�conditions�are�those�defined�for�the�CTF�(typically,�a�0.65�percent� interest�rate�with�a�20�year�repayment�period�and�10�years�of�grace.�Soft�loans�here�mean�those�with�conditions�typical�of� IBRD� loans� in� Colombia:� currently� a� 17�year� repayment� period,� interest� rate� LIBOR� +� 1.05�percent,�front�end�fee�0.25�percent.�
SKU_18504_Wind_Energy_Colombia_6-17-10.pdf 69SKU_18504_Wind_Energy_Colombia_6-17-10.pdf 69 6/17/2010 12:32:14 PM6/17/2010 12:32:14 PM

50
CHAPTER �8 �
Conclusions�
olombia�has�a�power�sector� that� is�quickly�maturing,�with�relative�stability� in� its�regulations,� an� unbundled� system,� and� a� dispatch� mechanism� that� closely�
resembles�a�well�functioning�competitive�market.�Competition� is�promoted�and� tools�have� been�designed� to� attract� cost�effective� capacity� expansions� that�would�promote�reliability�of�service�(a�fuller�description�of�the�system�and�its�dispatch�mechanism�was�included�in�first�stage�of�this�project’s�report).�
The�Colombian�energy�sector� is�characterized�by� low�carbon� intensity,�below�the�world�average.�For�the�foreseeable�future,�hydropower�will�likely�continue�to�provide�the�backbone�of�the�power�sector.�However,�a�highly�hydro�dependent�power�system�makes�the�system�intrinsically�vulnerable�to�severe�droughts.�This�vulnerability�could�be�addressed�by�diversification�of�the�power�mix.�
Wind Energy Resources Could Become an Important Energy Option in Colombia
Colombia�has�considerable�wind�resources,�estimated�to�exceed�14�GW,�mostly�on�its�northern�coast.�However,�the�potential�development�of�this�resource�is� limited�by�the�high� initial� investment� costs� and� provisions� in� the� regulatory� system� that� affect� this�energy�source.�
Wind�technology�costs�reached�a�historical�low�of�US$1,600/kW�in�2002�and�since�then� costs� soared� to� a� high� of� US$2,400/kW� by� September� 2008.� This� trend� was�reversed� in�2009,�with� recent� figures� reporting�average�values�around�US$1,800/kW.1�This�decreasing�cost�trend�is�expected�to�continue.�The�research�in�this�study�showed�that� costs� of� US$1,800� or� below� make� wind� a� viable� option� even� with� less� heavy�intervention� from� the� government.� However,� under� current� policy,� regulatory,� and�market�conditions,�wind�power�projects�are�still�not�attractive�for�private� investment.�Some�reforms�and�changes� in�the�market�conditions�could�therefore�also�be�seen�as�a�bridge�mechanism�to�be�ready�when�wind�power�becomes�a�more�competitive�option�with�decreasing�investment�costs�in�the�future.�
The�report�highlights�ways�to�assess�the�complementarity�between�wind�and�water�resources� and� the� potential� contribution� to� firm� energy� production� during� “critical”�dry�periods.� For� the�Colombian� case,� the� results� indicate� that� during� the�dry� season�(when�water� resources� availability� becomes� a� concern� and� electricity� prices� rise)� the�wind�resources�could�produce�above�average,�at�least�in�the�northern�part�of�Colombia.�More� importantly� for� Colombia,� during� critical� El� Niño� events� wind� contribution�exceeds�non�El�Niño�years.�This�contribution�should�be�recognized�and�remunerated�as�well�as�rewarded�in�the�current�regulatory�system�adopted�by�Colombia.�
C
SKU_18504_Wind_Energy_Colombia_6-17-10.pdf 70SKU_18504_Wind_Energy_Colombia_6-17-10.pdf 70 6/17/2010 12:32:14 PM6/17/2010 12:32:14 PM

Wind Energy in Colombia 51
�
Policy Instruments
There� is� a� wide� range� of� instruments� through� which� governments� could� guide� the�functioning� of� selected� markets.� However,� not� all� of� the� available� instruments� are�applicable� to� the� case� of� Colombia.� Therefore,� only� a� reduced� subset� was� explored,�namely�those� instruments�that�are�compatible�with�and�relatively�easy�to� incorporate�into� the� existing� regulatory� system� in�Colombia� and� have� the� effect� of� changing� the�financial� results� for� a� potential� investor.� The� instruments� have� been� classified� as:� (i)�financial� instruments;� (ii)� payments� to� government,� fees,� and� charges;� and� (iii)�adjustment�to�the�existing�regulatory�system.�
Policy Options
The�existing�regulatory�system�needs�to�be�assessed�and�any�biases�against�renewable�energy�technologies�need�to�be�removed�in�order�to�create�a�level�playing�field�for�all�technologies.� In� addition,� changes� in� financial� and� fiscal� conditions� could� also�make�wind�power�competitive�in�Colombia.�There�is�a�wide�range�of�options�through�which�governments� could� guide� the� functioning� of� the� sector.� The� instruments� explored� in�this� study� have� been� classified� as:� (i)� price�� and� quantity�based� instruments;� (ii)�adjustment�in�the�regulatory�system;�and�(iii)�financial�incentives�other�than�price.�
From�assessing� the� effectiveness� of� the� instruments,� it�was� found� that� the� single�most�effective�policy�instrument�to�promote�wind�power�in�Colombia�is�the�granting�of�access� to� reliability� payments,� recognizing� the� firm� energy� and� complementarity�offered� by� wind.� The� implementation� of� this� policy� option� is� relatively� easy� to�incorporate�into�the�existing�regulatory�system.�
For� new�wind�power� plants� with� costs� in� the� range� of� $1,800/kW� installed,� the�adoption� of� the� reliability� payments� is� enough� to� attract� independent� investors,�operating� in� wind� fields� with� similar� characteristics� to� those� found� in� Northern�Guajira.�
Higher� capital� costs� require� access� to� concessionary� financial� conditions,� such� as�those� provided� under� the� CTF� or� fiscal� incentives.� Likewise,� internalizing� costs� of�global�externalities�through�certified�emission�reductions,�already�used�to�some�extent,�would�help�to�make�the�projects�more�viable.�Exempting�some�charges�and�payments�used�in�the�regulatory�system�is�also�shown�to�be�a�very�effective�way�of�increasing�the�returns� on� investments.� This� is� true� in� particular� if� CERE� charges� are� exempted.�However,�it�should�be�noted�that�CERE�payments�and�reliability�charges�are�two�sides�of� the�same�coin,�since� the� funds�for�reliability�charges�come�from�CERE.�Temporary�incentives�for�wind�and�other�renewable�energy�could�also�be�considered�in�order�for�the� sector� to� benefit� and� gain� experience� from� the� early� implementation� of� wind�projects�before�wind�energy�becomes�a�more�significant�contributor�to�the�grid.�
Lack� of� access� to� the� benefit� of� “reliability� (firm� energy)� payments”� for� wind�powered� plants� is� a� serious� limitation� to� their� development.� A� simple� method� for�calculating� the� firm� energy� rating� of� wind�powered� plants� was� introduced.� It� is�recommended� that� the� firm� energy� rating� of� a� wind� resource� be� adjusted� annually�based�on�the�following�exponential�smoothing�formula:�
firm�energy�rating�in�year�t�+�1�=�½�(firm�energy�rating�in�year�t)�+�½�(energy�produced�in�year�t).�
SKU_18504_Wind_Energy_Colombia_6-17-10.pdf 71SKU_18504_Wind_Energy_Colombia_6-17-10.pdf 71 6/17/2010 12:32:14 PM6/17/2010 12:32:14 PM

52 World Bank Study
�
Under�this�approach,�the�firm�energy�rating,�and�therefore�the�reliability�payment,�will�quickly� converge� to� the� long�run� average� firm� energy� capability,� even� if� the� firm�energy�rating�in�the�initial�year�is�poorly�measured.�The�suggested�approach�to�assess�the�reliability�factor�for�wind�farms�is�risk�neutral.�If�the�yearly�estimate�is�used�during�the� “dry�period,”� the�difference� between� the� annual�mean� and� the�dry�period�mean�could�be� interpreted�as�a�risk�reduction�strategy.�A�more�formal�option,� in� tune�with�the� general� risk� aversion� characteristic� of� Colombia’s� regulatory� framework,� is� to�subtract�standard�deviation�affected�by�some�factor�of�the�historical�performance.�
Other Findings
Reliable�data�are�needed�to�assess�the�specific�potential�of�wind�throughout�Colombia.�Without� these�data,� promoters� and� investors� face� high�uncertainties,�which� translate�into� an� additional� barrier� to� future� investments.� For� this� reason,� the�governments� of�Colombia�and�of�other�countries�in�the�region�are�encouraged�to�assign�resources�to�the�proper� mapping� of� their� wind� resource� endowment� and� to� make� this� information�available�to�the�public.�
Other� actions� required� to� improve� access� to� the� market� include� open� access� to�research� and� technology� developments,� as� well� as� promotion� of� medium�scale�developments�(at�100�MW�or�more�installed�capacity),�allowing�the�grid�operator�to�be�prepared� for� necessary� system� adjustments� and� plan� strategically� for� greater�transmission�requirements�when�investments�in�wind�power�are�increased.�
Applicability of the Analysis Conducted
Although� the� analysis� has� focused� on�Colombia,� the� approach� is� applicable� to� other�countries,� which� could� further� explore� their� nonconventional� renewable� resources.�Other� countries� could� benefit� from� performing� a� similar� analysis� to� understand�possible� complementarities� and� how� renewable� energy� technologies� can� also� play� a�larger�role�in�energy�provision.��
Notes �1�As� of�March� 2009,� the�European�Wind�Energy�Association� reports� that� the� average�of� recent�projects�fluctuates�around�€1,225/kW.�This�translates�to�approximately�US$1,800�(see�explanation�of�turbine�cost�reductions�in�chapter�4).�
SKU_18504_Wind_Energy_Colombia_6-17-10.pdf 72SKU_18504_Wind_Energy_Colombia_6-17-10.pdf 72 6/17/2010 12:32:14 PM6/17/2010 12:32:14 PM
�
References�
Barrett,� Mark.� 2007.� “A� Renewable� Electricity� System� for� the� UK.”� In� Renewable�Electricity�and�the�Grid:�The�Challenge�of�Variability,�ed.�Godfrey�Boyle.�
Boyle,�Godfrey,�ed.�2007.�Renewable�Electricity�and�the�Grid:�The�Challenge�of�Variability.�London:�Earthscan.�
Cohen,�J.,�T.�Schweizer,�A.�Laxson,�S.�Butterfield,�S.�Schreck,�L.�Fingersh,�P.�Veers,�and�T.�Ashwill.�2008.�“Technology�Improvement�Opportunities�for�Low�Wind�Speed�Turbines�and�Implications�for�Cost�of�Energy�Reduction.”�Report�No.�NREL/SR�500�41036.�Golden,�CO:�NREL.�
Cramton,�P.,� and�S.� Stoft.� 2007.� “Colombia�Firm�Energy�Market.”�Proceedings�of� the�Hawaii�International�Conference�on�System�Sciences.�January.�
———.� 2008.� “Forward� Reliability� Markets:� Less� Risk,� Less� Market� Power,� More�Efficiency.”�Utilities�Policy�16:�194–201.�
Edigson,� Pérez� Bedoya,� and� Jaime� A.� Osorio.� 2002.� “Energía,� Pobreza� y� Deterioro�Ecológico� en� Colombia:� Introducción� a� las� Energías�Alternativas”�Todográficas.�Medellín,�Colombia.�
European� Wind� Energy� Association.� 2008.� “Integrating� 300� GW� Wind� Power� in�European�Power�Systems:�Challenges�and�Recommendations.”�Frans�Van�Hulle,�Technical�Advisor.�Presented�at� the�World�Bank’s�SDN�Week.�February�21–22.�World�Bank,�Washington,�DC.�
LBNL�(Lawrence�Berkley�National�Laboratory).�2008.�Annual�Report�on�U.S.�Wind�Power�Installation,�Cost,�and�Performance�Trends:�2007.�Washington,�DC:�U.S.�Department�of�Energy.�May.�
Ministry� of�Mines� and� Energy� 2008.�Memorias� al� Congreso� de� la� República� 2007–2008.�Junio.�ISSN�0120�0291.�
Nohara,� D.,� A.� Kitoh,�M.� Hosaka,� and� T.� Oki.� 2006.� “Impact� of� Climate� Change� on�River�Discharge�Projected�by�Multimodel�Ensemble.”�Journal�of�Hydrometeorology�7:�1076�1089.�
Universidad� Nacional� de� Colombia,� Universidad� de� los� Andes,� COLCIENCIAS,�ISAGEN.�2006.�“Proyecto�Regulación�Para�Incentivar�las�Energías�Alternas�y�la�Generación�Distribuida�en�Colombia.”�Informe�3.�September.�Bogotá,�Colombia.�
UPME.�2009.�Plan�de�Expansión�de�Referencia–Generación–Transmisión�2009–2023.�Mining�Energy�Planning�Unit�(Unidad�de�Planeación�Minero�Energética,�UPME)�of�the�Ministry�of�Mines�and�Energy.�April.�
URS� Corporation.� 2008.� “Study� of� Equipment� Prices� in� the� Energy� Sector.”� Study�prepared�for�the�World�Bank,�Washington,�DC.�June.�
SKU_18504_Wind_Energy_Colombia_6-17-10.pdf 73SKU_18504_Wind_Energy_Colombia_6-17-10.pdf 73 6/17/2010 12:32:15 PM6/17/2010 12:32:15 PM

54 World Bank Study
�
UWIG� (Utility� Wind� Integration� Group.)� 2007.� “Integrating� Wind� into� the� Grid.”�Presented� to� NRC� Panel� on� Electricity� from� Renewables.� Washington,� DC.�December�6.�
Valencia,� Adriana.� 2008.� “Missing� Links:� Demystifying� Alternative� Energy� Use� and�Improving�Decision�Making�for�Increased�Off�grid�Electrification�in�Colombia.”�PhD�Dissertation.�Energy�and�Resources�Group�(ERG),�University�of�California,�Berkeley.�
Vergara,� et� al.� 2008.� “Review� of� Policy� Framework� for� Increased� Reliance� on�Renewable�Energy�in�Colombia.”�ESMAP–World�Bank.�Washington,�DC.�
Vergara.�W.,�ed.�2009.�“Assessing�the�Consequences�of�Climate�Destabilization�in�Latin�America.”�SDWP�32.�World�Bank,�Washington,�DC.�
World� Bank� 2007.� “Technical� and� Economic� Assessment� of� Off�grid,� Mini�grid� and�Grid� Electrification� Technologies.”� Energy� Sector� Management� Assistance�Program� (ESMAP).� Technical� Paper� 121/07.� World� Bank,� Washington,� DC.�December.��
World�Wind�Energy�Association.�2009.�World�Wind�Energy�Report�2008.�Bonn,�Germany.�February.�
�����
SKU_18504_Wind_Energy_Colombia_6-17-10.pdf 74SKU_18504_Wind_Energy_Colombia_6-17-10.pdf 74 6/17/2010 12:32:15 PM6/17/2010 12:32:15 PM

55
�
Appendixes�
��
SKU_18504_Wind_Energy_Colombia_6-17-10.pdf 75SKU_18504_Wind_Energy_Colombia_6-17-10.pdf 75 6/17/2010 12:32:15 PM6/17/2010 12:32:15 PM

56
Appendix 1. Technology Cost Comparison In� relation� to� chapter� 3� of� the� report,� the� following� tables� provide� a� cost� ranking� of�various�technologies�according�to�capacity�factors.���Table A1.1. Least Levelized Cost Ranking of Electricity Generation Plant by Capacity Factor (%) without the Cost of CO2 Emissions
10% 20% 30% 40% 50% 60% 70% 80% 90% 100% 1 SC
500 MW Rehabili-tation
SC 500 MW Rehabili-tation
SC 500 MW Rehabili-tation
SC 500 MW Rehabili-tation
Large Hydro 1200 MW
Large Hydro 1200 MW
Large Hydro 1200 MW
Large Hydro 1200 MW
Large Hydro 1200 MW
Large Hydro 1200 MW
2 SC Oil Steam to Coal 300 MW
SC Oil Steam to Coal 300 MW
SC Oil Steam to Coal 300 MW
SC Oil Steam to Coal 300 MW
SC 500 MW Rehabili-tation
SC 500 MW Rehabili-tation
SC 500 MW Rehabili-tation
SC 500 MW Rehabili-tation
SC 500 MW Rehabili-tation
SC 500 MW Rehabili-tation
3 Simple Cycle GT 150 MW
SC Nat Gas Steam to Coal 300 MW
Large Hydro 1200 MW
Large Hydro 1200 MW
SC Oil Steam to Coal 300 MW
SC Oil Steam to Coal 300 MW
SC Oil Steam to Coal 300 MW
SC Oil Steam to Coal 300 MW
SC Oil Steam to Coal 300 MW
SC Oil Steam to Coal 300 MW
4 SC Nat Gas Steam 300 MW
Large Hydro 1200 MW
SC Nat Gas Steam to Coal 300 MW
SC Nat Gas Steam to Coal 300 MW
SC Nat Gas Steam to Coal 300 MW
SC Nat Gas Steam to Coal 300 MW
SC Nat Gas Steam to Coal 300 MW
SC Nat Gas Steam to Coal 300 MW
SC Nat Gas Steam to Coal 300 MW
SC Nat Gas Steam to Coal 300 MW
5 CCGT 560 MW
CCGT 560 MW
CCGT 560 MW
China SC 550 MW
China SPC 550 MW+ China SC 550 MW
China SPC 550 MW
China SPC 550 MW
China SPC 550 MW
China SPC 550 MW
China SPC 550 MW
6 CCGT 140 MW
CCGT 140 MW
China SC 550 MW+ CCGT 140 MW
China SPC 550 MW
China SC 550 MW+ China USPC 550 MW
China SC 550 MW
China SC 550 MW
China SC 550 MW
China SC 550 MW
Small to Med Hydro 400 MW
7 Large Hydro 1200 MW
Simple Cycle GT 150 MW
China SPC 5 50 MW
CCGT 560 MW
CCGT 560 MW
China USPC 550 MW
China USPC 550 MW
China USPC 550 MW
China USPC 550 MW
China SC 550 MW+ China USPC 550 MW
8 Diesel 5 MW
China SC 550 MW
China SC 300 MW
China SC 300 MW
CCGT 140 MW
China SC 300 MW
China SC 300 MW
China SC 300 MW
Small to Med Hydro 400 MW
China SC 300 MW
9 China SC 550 MW
China SPC 550 MW
China USPC 550 MW
China USPC 550 MW+ CCGT 140 MW
Small to Med Hydro 400 MW
CCGT 560 MW
Small to Med Hydro 400 MW
Small to Med Hydro 400 MW
China SC 300 MW
CCGT 560 MW
10 China SPC 550 MW
China SC 300 MW
Simple Cycle GT 150 MW
Simple Cycle GT 150 MW
China SC 300 MW CCS
CCGT 140 MW
CCGT 560 MW
CCGT 560 MW
CCGT 560 MW
CCGT 140 MW
11 China SC 300 MW
China USPC 550 MW
Diesel 5 MW
Small to Med Hydro 400 MW
SC 550 MW
Small to Med Hydro 400 MW
CCGT 140 MW
CCGT 140 MW
CCGT 140 MW
SC 550 MW+ SPC 550 MW
12 China USPC 550 MW
Diesel 5 MW
China SC 300 MW CCS
Diesel 5 MW
SPC 550 MW
China SC 300 MW CCS
China SC 300 MW CCS
SC 550 MW
SC 550 MW
USPC 550 MW+ China SC 300 MW CCS
13 China SC 300 MW CCS
China SC 300 MW CCS
SC 550 MW + China SC 550 MW CCS
China SC 300 MW CCS
SC 300 MW
SC 550 MW
SC 550 MW
China SC 300 MW CCS
SPC 5 50 MW
SC CFB 500 MW
Source:�Authors’�data.�
SKU_18504_Wind_Energy_Colombia_6-17-10.pdf 76SKU_18504_Wind_Energy_Colombia_6-17-10.pdf 76 6/17/2010 12:32:15 PM6/17/2010 12:32:15 PM

Wind Energy in Colombia 57
�
Table A1.2. Least Levelized Cost Ranking of Electricity Generation Plant by Capacity Factor (%) with US$18/Ton CO2 Emissions
10% 20% 30% 40% 50% 60% 70% 80% 90% 100% 1 SC Oil
Steam to Coal 300 MW
SC 500 MW Rehabili-tation
Large Hydro 1200 MW+
Large Hydro 1200 MW+
Large Hydro 1200 MW+
Large Hydro 1200 MW+
Large Hydro 1200 MW+
Large Hydro 1200 MW
Large Hydro 1200 MW
Large Hydro 1200 MW
2 SC Oil Steam to Coal 300 MW
SC Oil Steam to Coal 300 MW
SC 500 MW Rehabili-tation
SC 500 MW Rehabili-tation
SC 500 MW Rehabili-tation
SC 500 MW Rehabili-tation
Small to Med Hydro 400 MW+ SC 500 MW Rehabili-tation
Small to Med Hydro 400 MW
Small to Med Hydro 400 MW
Small to Med Hydro 400 MW
3 Simple Cycle GT 150 MW
CCGT 560 MW
SC Oil Steam to Coal 300 MW
SC Oil Steam to Coal 300 MW
SC Oil Steam to Coal 300 MW
SC Nat Gas Steam to Coal 300 MW
SC Oil Steam to Coal 300 MW
SC 500 MW Rehabili-tation
SC 500 MW Rehabili-tation
SC 500 MW Rehabili-tation
4 CCGT 560 MW
SC Nat Gas Steam to Coal 300 MW
SC Nat Gas Steam to Coal 300 MW
SC Nat Gas Steam to Coal 300 MW
SC Nat Gas Steam to Coal 300 MW
Small to Med Hydro 400 MW+ SC Nat Gas Steam to Coal 300 MW
SC Nat Gas Steam to Coal 300 MW
SC Oil Steam to Coal 300 MW
SC Oil Steam to Coal 300 MW
China USPC 550 MW
5 SC Nat Gas Steam to Coal 300 MW
CCGT 140 MW
CCGT 560 MW
CCGT 560 MW
CCGT 560 MW
CCGT 560 MW
CCGT 560 MW
SC Nat Gas Steam to Coal 300 MW
SC Nat Gas Steam to Coal 300 MW
China SPC 550 MW
6 CCGT 140 MW
Simple Cycle GT 150 MW
CCGT 140 MW
CCGT 140 MW
CCGT 140 MW
CCGT 140 MW
CCGT 140 MW
China USPC 550 MW
China USPC 550 MW
CCGT 560 MW
7 Large Hydro 1200 MW+
China SC 550 MW
China SC 550 MW
China SPC 550 MW
China SPC 550 MW
China SPC 550 MW
China SPC 550 MW
China SPC 550 MW
China SPC 550 MW
China SC 300 MW CCS
8 Diesel 5 MW
China SPC 550 MW
China SPC 550 MW
China SC 550 MW
Small to Med Hydro 400 MW+ SC Nat Gas Steam to Coal 300 MW
China USPC 550 MW
China USPC 550 MW
CCGT 560 MW+ China USPC 550 MW
CCGT 560 MW
China SC 300 MW
9 China SC 550 MW
China SC 300 MW
China SC 300 MW
China USPC 550 MW
China SC 550 MW
China SC 550 MW
CCGT 140 MW
China SPC 550 MW
China SC 550 MW
SC 300MW CCS
10 China SPC 550 MW
China USPC 550 MW
China USPC 550 MW
China SC 300 MW
China USPC 550 MW
China SC 300 MW
China SC 550 MW
China SC 550 MW+ CCGT 140 MW
CCGT 140 MW
CCGT 140 MW
11 China SC 300 MW
Diesel 5 MW
China SC 300 MW
Small to Med Hydro 400 MW
China SC 300 MW
China SC 300 MW CCS
China SC 300 MW
China SC 300 MW CCS
China SC 300 MW CCS
China SC 550 MW CCS
12 China USPC 550 MW
Small to Med Hydro 400 MW+ China SC 550 MW CCS
Simple Cycle GT 150 MW
China SC 300 MW CCS
China SC 300 MW CCS
China SC 550 MW CCS
China SC 300 MW CCS
China SC 550 MW CCS
China SC 300 MW
China USPC 550 MW CCS
13 China SPC 550 MW CCS
CCGT CCS 50 MW
Diesel 5 MW
Simple Cycle GT 150 MW
China SC 550 MW CCS
SC 300 MW CCS
China SC 550 MW CCS
China USPC 550 MW CCS
SC 300 MW CCS
China SPC 550 MW CCS
14 China USPC 550 MW CCS
China SPC 550 MW CCS
Small to Med Hydro 400 MW
Diesel 5 MW
China SPC 550 MW CCS + CCGT CCS 482 MW
China SPC 550 MW CCS
China SPC 550 MW CCS
China USPC 550 MW CCS
SPC 550 MW + USPC 550 MW
Source:�Authors’�data.�
SKU_18504_Wind_Energy_Colombia_6-17-10.pdf 77SKU_18504_Wind_Energy_Colombia_6-17-10.pdf 77 6/17/2010 12:32:15 PM6/17/2010 12:32:15 PM

58
Appendix 2. Use of Earth Simulator to Estimate the Likelihood of Extreme Weather Events Earth� Simulator�AGCM� (atmospheric� general� circulation�model)� runs,� developed� by�the�Meteorological�Research�Institute�(MRI)�of�the�Japan�Meteorological�Agency�(JMA),�were� used� to� estimate� the� likelihood� of� extreme� weather� events� to� the� end� of� the�century.�The�Earth�Simulator�is�a�super�high�resolution�atmospheric�general�circulation�model� with� a� horizontal� grid� size� of� about� 20� km,� offering� an� unequaled� high�resolution�capability.�The�use�of� the�Earth�Simulator�made�this�super�high�resolution�model’s�long�term�simulation�possible.1�
Although�the�global�20�km�model�is�unique�in�terms�of�its�horizontal�resolution�for�global� change� studies�with� an� integration� period�up� to� 25� years,� available� computer�power� is� still� insufficient� to� enable� ensemble� simulation� experiments;� this� limits� its�application� to� a� single�member� experiment.� To� address� this� caveat,� parallel�experiments�with� lower� resolution� versions� of� the� same�model� (60�km,� 120�km,� and�180�km� mesh)� were� performed.� In� particular,� ensemble� simulations� with� the� 60�km�resolution�have�been�performed�and�compared�with�the�20�km�version�for�this�study.�
Two� extreme� indices� for� precipitation� are� used� to� illustrate� changes� in�precipitation�extremes�over�Colombia,�one�for�heavy�precipitation�and�one�for�dryness.�All� over� the� country,� RX5D� is� projected� to� increase� in� the� future.� Largest� RX5D�increases�(rainfall� intensification)�are�found�over�south�eastern�Colombia.�At�a�higher�resolution�(20�km)�the�model�projects�even�larger�increases�in�RX5D.��
Figure A2.1. Changes in Maximum Five-Day Precipitation Total (mm) between the Present and the End of the 21st Century for (a) 60-km and (b) 20-km, Respectively
For 60-km model, areas with the highest projected consistency in sign are hatched. Zero lines are contoured.
�Source:�MRI�of�the�JMA.�
SKU_18504_Wind_Energy_Colombia_6-17-10.pdf 78SKU_18504_Wind_Energy_Colombia_6-17-10.pdf 78 6/17/2010 12:32:15 PM6/17/2010 12:32:15 PM

Wind Energy in Colombia 59
�
Likewise,�Figure�A2.2�shows�the�changes�in�maximum�number�of�consecutive�dry�days.� A� “dry� day”� is� defined� as� a� day� with� precipitation� less� than� 1� mm� d�1.�Consecutive�dry�day�periods�are�projected�to�increase,�in�particular�over�the�northern�coast.��
Figure A2.2. The Same as In Figure A.2.1 Except for Consecutive Dry Days (day)
�Source:�MRI�of�the�JMA.�
Impact on River Steam Flow
Using� the� runoff� data,� derived� from� rainfall� projections� under� the� Earth� Simulator,�stream� flow� in� large� rivers� can� be� calculated.� The� analysis� used� a� “GRiveT”� river�model.2�In�the�present�day�simulation,�large�rivers�are�well�represented�by�this�model.�Although� the� analysis� has� yet� to� be� made� for� basins� in� Colombia� with� large�hydropower� potential,� a� similar� assessment� made� for� rivers� in� the� Amazon� Basin�indicates� that� the� changes� in� extremes� and� in� particular� the� concentration� of� rainfall�and�the�lengthening�of�dry�periods�will�increase�the�amplitude�of�stream�flows,�which�in�turn�would�affect�the�mean�firm�capacity�of�hydropower�installations.�
Notes �1�This�model�is�an�operational�short�term�numerical�weather�prediction�model�of�JMA�and�part�of�the�next�generation�climate�models�for�long�term�climate�simulation�at�MRI.�2� (GRiveT:� Global� Discharge� model� using� TRIP,� the� 0.5� x� 0.5� version� with� global� data� for�discharge�channels;�Nohara�et�al.� (2006).�The�river�runoff�assessed� in� the� land�surface�model� is�horizontally� interpolated� as� external� input� data� into� the� TRIP� grid� so� that� the� flow� volume� is�saved.�
SKU_18504_Wind_Energy_Colombia_6-17-10.pdf 79SKU_18504_Wind_Energy_Colombia_6-17-10.pdf 79 6/17/2010 12:32:15 PM6/17/2010 12:32:15 PM

60
Appendix 3. Pool Prices under Various Scenarios Pool�prices�in�the�wholesale�market�are�formed�by�adding�other�variable�costs�(CERE,�FAZNI,�environmental�and�Automatic�Generati�on�Control�AGC)�to�the�pure�marginal�cost.�The�report�presents�this�for�the�mean�case�scenario.�
Other�scenarios�are�defined�in�the�Table�A3.1:��Table A3.1 MEM Scenarios
SCENARIO DEMAND FUEL PRICES HYDRO MEAN BASE BASE REVISED
MEAN HIGH HYDRO BASE BASE XM FACTORS LOW LOW LOW REVISED HIGH HIGH HIGH REVISED
Source:�Authors’�data.��The�following�Figures�(A3.1�and�A3.2)�present�this�for�the�mean�high�hydro�and�high�scenario.�Figure�A3.3�compares�the�pool�prices�for�base�and�base�high�hydro�scenarios.��
Figure A3.1 Pool Prices, Base High Hydro Scenario
�
Source:�Authors’�data.��
Figure A3.2. Pool Prices, High Scenario
�Source:�Authors’�data.��
020406080
100120140
US$/M
wh
POOL PRICES—Mean High Hydro Scenario
MeanP10P90
Jul-08
Jun-09
May-10
Apr-11
Mar-12
Feb-13
Jan-14
Dec-14
Nov-15
Oct-16
Sep-17
Aug-18
Jul-19
Jun-20
May-21
Apr-22
Mar-23
Feb-24
Jan-25
Dec-25
020406080
100120140
US$/M
wh
POOL PRICES—High Scenario
MeanP10P90
Jul-08
Jun-09
May-10
Apr-11
Mar-12
Feb-13
Jan-14
Dec-14
Nov-15
Oct-16
Sep-17
Aug-18
Jul-19
Jun-20
May-21
Apr-22
Mar-23
Feb-24
Jan-25
Dec-25
SKU_18504_Wind_Energy_Colombia_6-17-10.pdf 80SKU_18504_Wind_Energy_Colombia_6-17-10.pdf 80 6/17/2010 12:32:15 PM6/17/2010 12:32:15 PM

Wind Energy in Colombia 61
�
Figure A3.3. Comparison of Pool Prices for Base and Base High Hydro Scenarios
�Source:�Authors’�data.��
As�can�be�observed�in�Figure�A3.3,�the�average�pool�prices�for�the�mean�scenario�are�regularly�higher�than�the�mean�high�hydro�scenario.�
��
0
20
40
60
80
100
120
US$/M
Wh
AVERAGE POOL PRICES—Mean and Mean High Hydro Scenarios
Mean
Mean HighHydro
Jul-08
May-09
Mar-10
Jan-11
Nov-11
Sep-12
Jul-13
May-14
Mar-15
Jan-16
Nov-16
Sep-17
Jul-18
May-19
Mar-20
Jan-21
Nov-21
Sep-22
Jul-23
May-24
Mar-25
SKU_18504_Wind_Energy_Colombia_6-17-10.pdf 81SKU_18504_Wind_Energy_Colombia_6-17-10.pdf 81 6/17/2010 12:32:15 PM6/17/2010 12:32:15 PM

62
Appendix 4. Results of the Expected Returns on Investments with the Individual Application of the Policy Instruments for Different Market Scenarios Tables� A4.1–A4.5� depict� the� expected� returns� on� investments� with� the� individual�application�of�the�selected�policy�instruments�discussed�in�chapter�VII�of�the�report.�
The�analysis�of�the�information�contained�in�table�A4.1�indicates:�
� All� policy� instruments� improve� the� financial� outcome� of� the� potential�investment� under� consideration,� as� compared� with� the� baseline� condition.�Individually,� none� attains� the� selected� threshold� of� a� return� on� equity� of� 14�percent�before�taxes.�
� A�generous�access�to�concessionary�financing�(policy�instrument�C2)�provides�the�greater� inducement.�This�option� requires� clean� technology�concessionary�funding�for�up�to�50�percent�of�the�total�unit�investment.�
� Eliminating�CERE�payments�(column�F)�is�a�very�effective�instrument.�� Adjusting�the�access�to�the�reliability�charge�(or�leveling�the�playing�field�for�
nonconventional� renewable� energy� technologies)� is� also� a� very� effective�incentive,�as�indicated�in�column�H,�depending�on�the�methodology�used�for�selecting�the�reliability�factor.�
� Eliminating�income�taxes�does�not�seem�to�be�an�effective�instrument�to�attract�investments�to�RET,�given�the�criteria�used�to�judge�financial�feasibility.�
� As� should� be� expected,� the� comparison� of� results� presented� in� Table� A4.1�indicates�that�a�reduction�in�unit�investment�moves�the�expected�returns�closer�to�the�defined�threshold�of�14�percent�before�taxes�but�falls�short�of�reaching�this�target.�The�use�of�individual�policy�instruments�is�not�sufficient�incentive�for�potential�investors.�The�following�tables�summarize�the�analysis�conducted�when�assessing�the�likely�impact�on�potential� investors�of�the�selected�policy�group�options.�
� This� policy� group� option� does� not� provide� adequate� incentives� to� potential�investors�if�the�investment�costs�are�to�remain�high,�at�or�above�US$2,100/kW.�
� However,� this� policy� group� offers� interesting� flexibility� for� low� unit�investment�costs.�In�particular,�if�the�reliability�factor�is�estimated�through�the�methodology� indicated� in� section� VII.3,� this�would� be� the� only� government�intervention� required� to� open� the� market� to� wind� powered� energy�investments.1�
SKU_18504_Wind_Energy_Colombia_6-17-10.pdf 82SKU_18504_Wind_Energy_Colombia_6-17-10.pdf 82 6/17/2010 12:32:15 PM6/17/2010 12:32:15 PM

Wind Energy in Colombia 63
�
Table A4.1. Effectiveness Analysis of Individual Policy Instruments Results expressed as financial returns on capital for a 300 MW wind farm in northern Colombia POLICY OPTIONS A B1 B2 C1 C2 D E F G H TYPE I Financial Instruments Carbon CERs 18 0 0 0 0 0 0 0 0 0 Access CTCF loans 0 0 0 0.3 0.5 0 0 0 0 0 Access to soft loans 0 0.4 0.7 0 0 0 0 0 0 0 TYPE III Government Fees Income taxes 0.33 0.33 0.33 0.33 0.33 0 0.33 0.33 0.33 0.33 Generator charges 1 1 1 1 1 1 0 1 1 1 TYPE V Regulatory Instruments Sustainability charge 0 0 0 0 0 0 0 0 5 0 CERE payments 1 1 1 1 1 1 1 0 1 1 Reliability charge 0 0 0 0 0 0 0 0 0 0.36
Investments Costs 1800 $/kW Project before taxes 7.5% 5.8% 5.8% 5.8% 5.8% 5.8% 6.2% 9.4% 7.1% 9.5% Project after taxes 6.1% 4.6% 4.6% 4.6% 4.6% 5.8% 5.0% 7.8% 5.8% 7.9% Equity before taxes 7.3% 5.4% 5.9% 7.4% 10.2% 4.9% 5.6% 10.0% 6.8% 10.1% Equity after taxes 5.6% 4.0% 4.4% 5.7% 8.3% 4.9% 4.1% 7.9% 5.1% 8.0%
Investments Costs 2100 $/kW Project before taxes 6.1% 4.4% 4.4% 4.4% 4.4% 4.4% 4.9% 7.8% 5.7% 7.9% Project after taxes 4.9% 3.5% 3.5% 3.5% 3.5% 4.4% 3.9% 6.4% 4.6% 6.4% Equity before taxes 5.4% 3.6% 3.9% 5.2% 7.3% 3.3% 3.8% 7.7% 4.9% 7.8% Equity after taxes 3.9% 2.5% 2.8% 3.8% 5.7% 3.3% 2.6% 5.9% 3.5% 6.0%
Investments Costs 2400 $/kW Project before taxes 4.9% 3.4% 3.4% 3.4% 3.4% 3.4% 3.8% 6.5% 4.6% 6.6% Project after taxes 3.9% 2.6% 2.6% 2.6% 2.6% 3.4% 3.0% 5.3% 3.6% 5.3% Equity before taxes 3.9% 2.2% 2.4% 3.4% 5.2% 1.9% 2.5% 6.0% 3.5% 6.1% Equity after taxes 2.7% 1.3% 1.5% 2.4% 3.9% 1.9% 1.5% 4.4% 2.3% 4.5%
Source:�Authors’�data.�Note:�The�policy�instruments�used�are�read�in�the�upper�half�of�the�table,�while�the�lower�half�indicates�the�expected�financial�returns.�For�example,�policy�instrument�A�corresponds�to�access�to�payments�for�the�reduction�of�GHG�at�a�price�of�US$18/ton�CO2.�Policy� instrument�D�shows� that� income� taxes�are�waived.��
Policy Groups
Tables�A4.2,�A4.3,�and�A4.4�present�the�results�obtained�from�the�analysis�of�the�three�policy� groups� under� consideration.� In� each� case� the� analysis� seeks� to� find� a�combination�of�instruments�that�jointly�create�the�conditions�for�potential�investors�to�move� their� capital� toward�RET� initiatives.� The� tables� retain� the� same�general� design�used� to�describe� the� results�of� individual�policy� instruments.�Reading� the� table� from�
SKU_18504_Wind_Energy_Colombia_6-17-10.pdf 83SKU_18504_Wind_Energy_Colombia_6-17-10.pdf 83 6/17/2010 12:32:15 PM6/17/2010 12:32:15 PM

64 World Bank Study
�
left�to�right,�the�columns�aggregate�the�instruments�used�to�create�the�policy�group�of�interest.� For� example,� as� shown� in� table�A4.2� the�Group� Policy�Options� are� built� as�follows:�Baseline�+�Carbon�CERs�+�Soft�Loans�(20,�40,�and�70�percent)�+�access�to�clean�technology�concessionary�financing�(30�and�50�percent).�
The�use�of�financial�instruments�to�build�a�policy�option�provides�great�flexibility.�In�the�particular�case�under�study�the�threshold,�or�target�financial�rate�of�return�(FRR),�is�not�achieved�if�the�investment�costs�approach�US$2,400/kW.�For�the�low�investment�cost� scenario,� potential� investors� require� access� to� clean� technology� concessionary�resources�for�nearly�30�percent�of�the�expected�cost.��Table A4.2. Effectiveness Analysis of Policy Options: Use of Financial Instruments Financial results for a 300 MW wind farm in northern Colombia POLICY OPTIONS A B C D E F TYPE I Financial Instruments Carbon CERs 0 18 18 18 18 18 Access CTCF loans 0 0 0 0 0.3 0.7 Access to soft loans 0 0 0.3 0.7 0.4 0 TYPE III Government Fees Income taxes 0.33 0.33 0.33 0.33 0.33 0.33 Generator charges 1 1 1 1 1 1 TYPE V Regulatory Instruments Sustainability charge 0 0 0 0 0 0 CERE payments 1 1 1 1 1 1 Reliability charge 0 0 0 0 0 0 Investments Costs 1800 $/kW Project before taxes 5.8% 7.5% 7.5% 7.5% 7.5% 7.5% Project after taxes 4.6% 6.1% 6.1% 6.1% 6.1% 6.1% Equity before taxes 4.9% 7.3% 7.9% 8.7% 12.1% 20.3% Equity after taxes 3.5% 5.6% 6.0% 6.8% 9.9% 18.0% Investments Costs 2100 $/kW Project before taxes 4.4% 6.1% 6.1% 6.1% 6.1% 6.1% Project after taxes 3.5% 4.9% 4.9% 4.9% 4.9% 4.9% Equity before taxes 3.3% 5.4% 5.8% 6.4% 9.0% 15.9% Equity after taxes 2.2% 3.9% 4.2% 4.8% 7.1% 13.7% Investments Costs 2400 $/kW Project before taxes 3.4% 4.9% 4.9% 4.9% 4.9% 4.9% Project after taxes 2.6% 3.9% 3.9% 3.9% 3.9% 3.9% Equity before taxes 1.9% 3.9% 4.2% 4.6% 6.7% 12.5% Equity after taxes 1.1% 2.7% 2.9% 3.3% 5.2% 10.4%
Source:�Authors’�data.�
SKU_18504_Wind_Energy_Colombia_6-17-10.pdf 84SKU_18504_Wind_Energy_Colombia_6-17-10.pdf 84 6/17/2010 12:32:16 PM6/17/2010 12:32:16 PM

Wind Energy in Colombia 65
�
The� use� of� government� fiscal� mechanisms� is� explored� in� table� A4.3� below.� As�indicated�in�the�table,�the�group�encompasses�a�wide�range�of�fees�and�payments�to�the�government.�The�following�sequence�was�used,�as�indicated�by�reading�the�table�from�left� to� right:� baseline� +� Carbon� CERs� +� tax� shelter� +� waiver� of� generator� charges� +�elimination�of�the�obligation�to�contribute�to�CERE.�The�results�indicate�that�this�policy�group�option�alone�cannot�create�the�required�incentives�to�attract�potential� investors�to�wind�power�projects.��Table A4.3. Effectiveness Analysis of Policy Options: Use of Government Fees and Payments
POLICY OPTIONS A B C D E F
TYPE I Financial Instruments Carbon CERs 0 18 18 18 18 18 Access CTCF loans 0 0 0 0 0 0 Access to soft loans 0 0 0 0 0 0 TYPE III Government Fees Income taxes 33% 33% 0% 0% 0% 0% Generator charges 1 1 1 0 1 0 TYPE V Regulatory Instruments Sustainability charge 0 0 0 0 0 0 CERE payments 1 1 1 1 0 0 Reliability charge 0 0 0 0 0 0
Investments Costs 1800 $/kW Project before taxes 5.8% 7.5% 7.5% 8.0% 10.9% 11.3% Project after taxes 4.6% 6.1% 7.5% 8.0% 10.9% 11.3% Equity before taxes 4.9% 7.3% 7.3% 8.0% 12.3% 12.9% Equity after taxes 3.5% 5.6% 7.3% 8.0% 12.3% 12.9%
Investments Costs 2100 $/kW Project before taxes 4.4% 6.1% 6.1% 6.5% 9.1% 9.5% Project after taxes 3.5% 4.9% 6.1% 6.5% 9.1% 9.5% Equity before taxes 3.3% 5.4% 5.4% 5.9% 9.6% 10.2% Equity after taxes 2.2% 3.9% 5.4% 5.9% 9.6% 10.2%
Investments Costs 2400 $/kW Project before taxes 3.4% 4.9% 4.9% 5.3% 7.8% 8.1% Project after taxes 2.6% 3.9% 4.9% 5.3% 7.8% 8.1% Equity before taxes 1.9% 3.9% 3.9% 4.4% 7.7% 8.1% Equity after taxes 1.1% 2.7% 3.9% 4.4% 7.7% 8.1%
Source:�Authors’�data.��� �
SKU_18504_Wind_Energy_Colombia_6-17-10.pdf 85SKU_18504_Wind_Energy_Colombia_6-17-10.pdf 85 6/17/2010 12:32:16 PM6/17/2010 12:32:16 PM

66 World Bank Study
�
The� use� of� regulatory� instruments� comprises� the� last� group� of� policy� options.�Under� this�group� the� following�sequence�of� instruments� is�used,�as�depicted� in� table�A4.3�below:�Baseline�and�Carbon�CERs�+� reliability� charge� (reliability� factors�of� 0.20,�0.30�and�0.36)�+CERE�waiver�(50�percent,�100�percent).�The�results�summarized�in�table�A4.3�indicate:� Table A4.4. Effectiveness Analysis of Policy Options: Use of Regulatory Instruments
POLICY OPTIONS A B1 B2 B3 C1 C2 C3 D1 D2 D3
TYPE I Financial Instruments Carbon CERs 18 18 18 18 18 18 18 18 18 18 Access CTCF loans 0 0 0 0 0 0 0 0 0 0 Access to soft loans 0 0 0 0 0 0 0 0 0 0 TYPE III Government Fees Income taxes 33% 33% 33% 33% 33% 33% 33% 33% 33% 33% Generator charges 1 1 1 1 1 1 1 1 1 1 TYPE V Regulatory Instruments Sustainability charge 0 0 0 0 0 0 0 0 0 0 CERE payments 1 1 0.5 0 1 0.5 0 1 0.5 0 Reliability charge 0 0.2 0.2 0.2 0.3 0.3 0.3 0.36 0.36 0.36 Investments Costs 1800 $/kW Project before taxes 7.5% 9.5% 11.1% 12.6% 10.4% 12.0% 13.5% 10.9% 12.5% 13.9% Project after taxes 6.1% 7.9% 9.3% 10.8% 8.7% 10.2% 11.5% 9.2% 10.6% 12.0% Equity before taxes 7.3% 10.2% 12.6% 15.2% 11.6% 14.1% 16.6% 12.4% 14.9% 17.5% Equity after taxes 5.6% 8.0% 10.2% 12.5% 9.2% 11.5% 13.8% 10.0% 12.3% 14.7% Investments Costs 2100 $/kW Project before taxes 6.1% 7.9% 9.3% 10.7% 8.7% 10.1% 11.5% 9.2% 10.6% 11.9% Project after taxes 4.9% 6.4% 7.7% 9.0% 7.2% 8.5% 9.7% 7.6% 8.9% 10.1% Equity before taxes 5.4% 7.8% 9.9% 12.0% 9.0% 11.1% 13.2% 9.7% 11.8% 13.9% Equity after taxes 3.9% 6.0% 7.8% 9.6% 7.0% 8.8% 10.7% 7.6% 9.5% 11.4% Investments Costs 2400 $/kW Project before taxes 4.9% 6.6% 7.9% 9.2% 7.4% 8.7% 9.9% 7.8% 9.1% 10.3% Project after taxes 3.9% 5.3% 6.5% 7.6% 6.0% 7.2% 8.3% 6.4% 7.5% 8.6% Equity before taxes 3.9% 6.1% 7.9% 9.7% 7.1% 9.0% 10.8% 7.8% 9.6% 11.4% Equity after taxes 2.7% 4.5% 6.1% 7.6% 5.4% 7.0% 8.5% 5.9% 7.5% 9.1%
Source:�Authors’�data.�
Notes �1� As� explained� in� the� document,� estimates� using� the� available� information� from� Jepírachi,�complemented�by�observational�records�from�nearby�wind�measuring�stations�from�1985�to�2008,�produce�a�reliability�factor�of�0.415.�A�standard�deviation�of�0.055�results�in�the�reliability�factor�of�0.36�used�in�this�analysis.�
SKU_18504_Wind_Energy_Colombia_6-17-10.pdf 86SKU_18504_Wind_Energy_Colombia_6-17-10.pdf 86 6/17/2010 12:32:16 PM6/17/2010 12:32:16 PM

67
Appendix 5. Exempting CERE Payments by 50 or 100 Percent In� addition,� the� analysis� also� considered� the� option� of� exempting� 100� percent� or� 50�percent�of� the�CERE�payment.�The� results� show� that� clean� technology� concessionary�financing� is� still� required� if�CERE� is� considered�only� at� 50�percent� and� above� a� unit�price� of� US$2,100.� Alternatively,� this� type� of� financing� is� not� necessary� if� the� unit�investment� is� US$1,800� and� the� CERE� payment� is� exempted,� even� at� 50� percent.� In�short,� eliminating� the� CERE� payment� alone� is� also� an� effective� instrument.� If� CERE�payment�is�eliminated,�a�unit�investment�cost�of�US$1,800/kW�allows�the�IRR�to�reach�the�14�percent�target.�The�results�are�summarized�in�table�A5.1�below.��Table A5.1. Financing Necessary if CERE Is Returned 50 Percent or 100 Percent, Depending on Investment Costs
Investment cost/kW (US$) % Returned CERE In all cases it is assumed that there is 30% equity
$2,400 100% Need 15% clean tech concessionary financing + 55% soft loans
50% Need 40% clean tech concessionary financing + 20% soft loans + 10% commercial credits
$2,100 100% Need 45% soft loans + 25% commercial credits 50% Need 15% clean tech concessionary financing + 55% soft loans
$1,800 100% No additional financing required 50% Need 35% soft loans + 35% commercial credits
Source:�Authors’�data.��
The� results� of� analyzing� the� possibility� of� excluding� the� hypothetical� 300� MW�wind�power� project� from� paying� CERE� charges� indicates� that� not� paying� for� CERE�charges�results�in�a�return�of�investment�that�is�the�same�as�if�the�reliability�payment�is�recognized� at� 40� percent.� Therefore,� the� policy� maker� has� an� option� of� either� not�charging� the�CERE�payment� to�wind�power�producers,�or� recognizing� their�project’s�firm�capacity.�In�this�case,�it�might�be�simpler�and�in�the�country’s�interest�to�recognize�the�firm�capacity�of�each�project.�
SKU_18504_Wind_Energy_Colombia_6-17-10.pdf 87SKU_18504_Wind_Energy_Colombia_6-17-10.pdf 87 6/17/2010 12:32:16 PM6/17/2010 12:32:16 PM

68
Appendix 6. Complementarity between Wind Power and Hydroelectric Resources Jose�Manuel�Mejia�and�Alberto�Brugman��Estudios�Energeticos�Limitada�
Chapter 1: Introduction
This� report� presents� the� results� of� the� studies� conducted� to� analyze� the�complementarities� existing� between� hydroelectric� resources� and� wind� power� in�Colombia,�including�synergies�that�can�occur�during�El�Niño�occurrences.�
Colombia� is� a� country� with� abundant� natural� resources� for� the� production� of�renewable� energy.� Historically,� power�sector� development� has� been� based� on�hydroelectric�energy�(approximately�80�percent�of�energy�consumption).�The�country�also� has� abundant� coal� resources,�which� are� largely� exported� and�which� represent� a�considerable�energy�reserve�of�strategic�interest�for�the�country.�At�the�moment�there�is�only�one�wind�power�farm�in�the�country�(Jepírachi),�located�on�the�Caribbean�coast,�in�the�province�of�La�Guajira,�with�19.5�MW�installed�capacity.�
Several� wind�power� advantages� in� the� Colombian� power� system� have� been�mentioned.� Among� these,� the� complementarities� with� hydroelectric� resources� are�investigated� in� this� study.� Specifically,� preliminary� analyses� indicate� that� during� the�dry� hydrological� period� (December� to� April),� wind� velocities� in� the� Caribbean� are�above�the�annual.�Likewise,�it�has�also�been�argued�that�wind�velocities�are�above�the�mean�when�El�Niño�occurs.�
� This� study� aims� to� find� an� answer� to� the� following� questions:� Does�complementarity�exist�between�water�resources�and�wind�power�resources�in�Colombia� (for� example,� in� La� Guajira)?� What� could� be� the� contribution� of�wind�resources�to�the�reliability�of�the�national�electricity�system?�What�is�the�natural� variability� of� the� wind� resource� (monthly� and� summer� potential�contribution)?� What� is� the� wind�power� contribution� during� the� period� of�“extreme”�summer,�associated�with�the�El�Niño�phenomenon?�
� �
SKU_18504_Wind_Energy_Colombia_6-17-10.pdf 88SKU_18504_Wind_Energy_Colombia_6-17-10.pdf 88 6/17/2010 12:32:16 PM6/17/2010 12:32:16 PM

Wind Energy in Colombia 69
�
Chapter 2: Methodology
The�main�aspects�of�the�methodology�are�to:�1.� Use� the� Puerto� Bolívar� meteorological� station� as� the� basis� of� the� analysis.�
Information�beginning�in�1986�is�available.�2.� Fill�in�abundant�missing�hourly�data.�3.� Conduct�a�statistical�analysis�of�hourly�wind�velocity�characteristics.�4.� Convert� hourly� wind�velocity� data� in� hourly� power� generation� using�
conversion� factors� corresponding� to� a� particular� wind� turbine� and� a� given�capacity�installation.�
5.� Estimate�monthly�generation�information.�6.� Select� four� discharge� measurement� stations� of� the� National� Interconnected�
System�for�analysis�of�synergies�of�joint�hydroelectric�power�and�wind�turbine�operation.�
7.� Analyze�river�discharges�and�Jepírachi�generation�during�El�Niño�occurrences.�8.� Estimate� the� firm� energy� obtained� from� the� individual� operation� of�
hydroelectric�plants�(with�and�without�reservoirs)�and�wind�power�plants,�as�well� as� their� joint� operation.� Firm� energy� will� be� defined� as� the� maximum�energy� that� can� be� produced� without� deficits� during� the� analysis� period,�which�will�include�El�Niño�occurrences.�The�analysis�will�be�conducted�using�a� simulation� model� that� will� operate� the� plants� to� provide� a� given� energy�target,�adjusting�this�target�until�no�deficits�are�generated.�The�analysis�will�be�conducted�for�each�of�the�hydroelectric�plants�selected.�
9.� Measure� synergetic� gains� due� to� the� complementarity� between�hydroelectricity�and�wind�power,�as� the�difference�between� firm�energy� in�a�joint�operation�and�the�sum�of�firm�energies�in�isolated�operation.�
� �
SKU_18504_Wind_Energy_Colombia_6-17-10.pdf 89SKU_18504_Wind_Energy_Colombia_6-17-10.pdf 89 6/17/2010 12:32:16 PM6/17/2010 12:32:16 PM

70 World Bank Study
�
Chapter 3: Data Base
3.1 Wind Velocity Information
The�World� Bank� obtained� hourly� data� for� two� stations� in� the� Colombian� Caribbean�from�IDEAM.�
The�first�station�is�located�in�Puerto�Bolívar,�in�the�vicinity�of�the�Jepírachi�power�plant.� It� covers� the� period� between� October� 1986� and� December� 2008,� with� several�missing� records.� (There� are� 162,124� hourly� records� out� of� a� total� of� 195,072,�representing�83�percent.)�
There� is�no�clear�behavior�of� the�distribution�of�hourly�velocities�during� the�day�for�the�different�months�of�the�year.�The�distribution�of�wind�velocities�in�the�different�hours�of�the�day�is�shown�below.��
Figure A6.1. Hourly Wind Velocity: Puerto Bolívar
�
Source:�IDEAM.��Figure� A6.1� shows� the� trend� of� larger� wind� velocities� during� peak� electricity� load�hours,� while� smaller� wind� velocities� tend� to� be� concentrated� during� early� morning�hours�which� are� the�minimum� load� hours.� Therefore,� there� is� a� complementarity� of�wind�velocities�with�electricity�load,�which�is�a�clear�advantage�for�wind�power.�
As�seen�in�figure�A6.2,�large�wind�velocities�occur�from�December�to�April,�which�are�the�months�with�lower�river�discharges.�This�represents�a�positive�complementarity�between�wind�power�and�hydroelectric�power.�
0.000
0.200
0.400
0.600
0.800
1.000
1.200
1.400
0�1
1�2
2�3
3�4
4�5
5�6
6�7
7�8
8�9
9�10
10�11
11�12
12�13
13�14
14�15
15�16
16�17
17�18
18�19
19�20
20�21
12�22
22�23
23�24
Hou
rly�velicity/daily�velocity
Hours�of�the�day
HOURLY�WIND�VELOCITY�� PUERTO�BOLIVAR
SKU_18504_Wind_Energy_Colombia_6-17-10.pdf 90SKU_18504_Wind_Energy_Colombia_6-17-10.pdf 90 6/17/2010 12:32:16 PM6/17/2010 12:32:16 PM

Wind Energy in Colombia 71
�
Figure A6.2. Seasonal Behavior of Mean Wind Velocity
�
Source:�IDEAM.��
Figures�A6.3�and�A6.4�show�similar�results�for�the�Barranquilla�Airport�where�the�second�station�is�located.�The�results�are�similar�for�the�Puerto�Bolívar�and�Barranquilla�Airports,�although�the�difference�between�the�minimum�and�maximum�values�is�more�accentuated�for�the�Barranquilla�Airport.�
Mean� velocities� at� the� Barranquila�Airport� are� substantially� lower� than� those� at�Puerto�Bolívar�and�do�not�have�a�good�correlation�with�the�Puerto�Bolívar�station,�due�to� the� fact�of� the� shading�effect�of� the�Sierra�Nevada�de�Santa�Marta.�Therefore,� this�station�was�not�used.��
Figure A6.3. Hourly Mean Velocity: Barranquilla Airport
�
Source:�IDEAM.�
0.0
1.0
2.0
3.0
4.0
5.0
6.0
7.0
8.0
9.0
Jan Feb Mar Apr May Jun Jul Aug Sep Oct Nov Dec
Wind�velocity�m/seg
Month
MEAN�WIND�VELOCITY�� PUERTO�BOLIVAR
Series1
0.0000.2000.4000.6000.8001.0001.2001.4001.600
0�1
1�2
2�3
3�4
4�5
5�6
6�7
7�8
8�9
9�10
10�11
11�12
12�13
13�14
14�15
15�16
16�17
17�18
18�19
19�20
20�21
12�22
22�23
23�24
Hourly�velocity
/daily�velocity
Hours
HOURLY�MEAN�VELOCITY�BARRANQUILLA�AIRPORT
SKU_18504_Wind_Energy_Colombia_6-17-10.pdf 91SKU_18504_Wind_Energy_Colombia_6-17-10.pdf 91 6/17/2010 12:32:16 PM6/17/2010 12:32:16 PM

72 World Bank Study
�
Figure A6.4. Mean Wind Velocity: Barranquilla Airport
�
Source:�IDEAM.��
3.2 River Discharges
Monthly�data�for�four�rivers�associated�with�hydroelectric�power�plants�were�used�in�this� study.� The� information� was� obtained� from� databases� for� simulation� of� the�interconnected�hydrothermal�power�system.�
Rivers� considered� were� the� Nare� River� at� the� Santa� Rita� Dam� (1955–2009),� the�Guavio�River� at� the�Guavio�Dam� (1963–2009),� the�Cauca�River� at� the� Salvajina�Dam�(1946–2009),�and�the�Magdalena�River�at�the�Betania�Dam�(1972–2009),�representing�a�sample�of�geographical�regions�of�the�country.�Table�A6.1�shows�mean�monthly�values�for�these�rivers.��Table A6.1. Mean Monthly Values for the Guavio, Nare, Cauca, and Magdalena Rivers
Source:�Appendix�authors’�data.�
0
1
2
3
4
5
6
Jan Feb Mar Apr May Jun Jul Aug Sep Oct Nov Dec
Mean�velocity�m/seg
Month
MEAN�WIND�VELOCITYBARRANQUILLA�AIRPORT
Guavio Nare Cauca MagdalenaJan 18.4 36.2 166.3 145.4Feb 19.9 32.3 145.8 154.6Mar 29.9 34.5 139.7 183.4Apr 65.6 46.4 152.2 225.2May 106.3 62.1 153.1 240.4Jun 139.2 58.2 127.9 240.5Jul 144.4 47.9 103.2 240.3Aug 110.0 48.8 74.6 179.1Sep 76.0 59.3 63.2 138.6Oct 64.9 67.6 109.6 177.4Nov 52.7 67.6 197.2 218.0Dec 31.3 49.6 215.5 199.2
MEAN�MONTHLY�VALUES���m3/seg
SKU_18504_Wind_Energy_Colombia_6-17-10.pdf 92SKU_18504_Wind_Energy_Colombia_6-17-10.pdf 92 6/17/2010 12:32:16 PM6/17/2010 12:32:16 PM

Wind Energy in Colombia 73
�
Figure�A6.5� illustrates� the� diversity� of�meteorological� condition� shown�by� the� rivers�chosen.��
Figure A6.5. Normalized Monthly Discharges of the Four Rivers
�Source:�Appendix�authors’�data.�
3.3 Technical Information for the Jepírachi Power Plant
The� Jepírachi�wind�farm�power�plant� is� located� in� the�northern�part�of�Colombia,�on�the�Guajira�peninsula�on�the�Caribbean�Sea.�It�has�been�equipped�with�15�Nordex�N60�aerogenetors� (1,300�kW�each),�with�a� total� installed� capacity�of� 19.5�MW.�The�power�curve�(relating�wind�velocity�with�power�delivered�by�the�generator)� for�each�unit� is�shown�in�figure�A6.6.���
Figure A6.6. Power Curve for Each Unit
�
Source:�Appendix�authors’�data.�
0
0.5
1
1.5
2
2.5
Jan Feb Mar Apr May Jun Jul Aug Sep Oct Nov Dec
Mon
thly�M
ean/An
nual�M
ean
NORMALIZED�MONTHLY�DISCHARGES
Guavio
Nare
Cauca
Magdalena
02004006008001000120014001600
0 5 10 15 20 25
Factor�kW/m
/seg
Velocity�m/seg
POWER�CURVE�� NORDEX�N60
SKU_18504_Wind_Energy_Colombia_6-17-10.pdf 93SKU_18504_Wind_Energy_Colombia_6-17-10.pdf 93 6/17/2010 12:32:16 PM6/17/2010 12:32:16 PM

74 World Bank Study
�
The�power�curve�is�valid�for�standard�air�density�(1.225�kg/m3).�For�a�different�air�density�a�correction�has�to�be�made.�Air�density�at�Jepírachi�is�1.165�kg/m3).�Velocity�is�at�tower�altitude�(60�meters).�Therefore,�a�correction�must�be�made,�taking�into�account�a�roughness�factor�(0.15),�and�the�air�density� in�the�power�curve�of� the�manufacturer�and�Puerto�Bolivar,�since�velocity�measurements�are�made�at�a�10�meter�altitude.�
3.4 Jepírachi Generation
Hourly�Jepírachi�generation�was�obtained�from�the�Neon�database�operated�by�Xm,�the�system�operator.�The�information�was�available�between�February�2004�and�March�2009.�
The�following�tables�summarize�the�information�at�monthly�hour�level.��Table A6.2. Jepírachi Monthly Hour Generation kWh (1 to 12)
�Source:�Neon�database�operated�by�Xm� �
1 2 3 4 5 6 7 8 9 10 11 12Feb�04 46409 44317 39107 35323 30761 31072 29592 30234 39381 45079 54153 39381Mar�04 140936 125710 116189 113622 113044 109002 104041 115101 135418 137050 158091 135418Apr�04 127838 121365 115335 108995 105044 105672 112597 131031 138595 154124 190674 138595May�04 231996 233364 228772 225541 209674 192621 193550 209064 211206 206943 222462 211206Jun�04 330876 312374 304223 298968 294805 300260 303424 313792 340632 377004 377463 340632Jul�04 242488 227097 221345 203293 183794 170140 176278 190410 187934 202619 246582 187934Aug�04 240662 220931 213009 213823 220730 197890 191253 229974 252703 263633 276345 252703Sep�04 46563 37095 36999 36673 35451 21177 21253 24676 22056 27475 50192 22056Oct�04 61729 55937 48722 49209 46999 38244 34866 53119 66744 77137 89306 66744Nov�04 60176 50989 42348 57550 69987 64443 59364 64631 100781 108311 127689 100781Dec�04 83709 82030 66083 66415 61500 60122 61066 73683 120077 141600 155051 120077Jan�05 117439 112019 113308 107172 100759 93807 74290 90023 134068 173343 197178 134068Feb�05 130617 121767 100697 88478 80324 79221 68862 91027 138653 171403 214050 138653Mar�05 190359 162779 151840 131416 118121 108643 99305 123272 163227 182891 224965 163227Apr�05 154972 150516 145551 132760 114786 114394 122887 146267 163255 173237 184477 163255May�05 134648 127325 118908 107702 107549 107578 111381 134308 133262 135237 146744 133262Jun�05 116432 93899 92139 90527 75461 77493 74215 94447 114563 130210 150332 114563Jul�05 179538 181386 172213 143606 124863 122338 128007 137707 154542 162466 188642 154542Aug�05 172650 150581 147546 135425 126542 119151 122975 133853 132222 146884 182514 132222Sep�05 125927 128747 134390 127963 117870 103245 102499 122933 117671 119877 137928 117671Oct�05 125927 128747 134390 127963 117870 103245 102499 122933 117671 119877 137928 117671Nov�05 58513 46187 46865 45333 45406 50663 45348 58816 76657 83044 92404 76657Dec�05 83773 69392 58543 56719 61611 59192 54709 61794 101314 147022 168341 101314Jan�06 142530 143363 135094 137363 121598 106907 95523 100618 143210 193212 235846 143210Feb�06 186891 176962 156182 146437 141071 134439 136036 174944 230149 268658 279571 230149Mar�06 194406 192387 186007 167988 160020 162331 158345 196017 248324 279524 322582 248324Apr�06 134752 125313 118589 117559 112926 107591 91856 127226 162933 178068 191372 162933May�06 146913 152761 150091 134786 129561 127175 137489 160875 150092 168364 202209 150092Jun�06 188191 181644 165323 153041 145705 142623 149388 158433 193370 216576 245133 193370Jul�06 273952 264547 247057 231815 220277 225774 245223 277116 303914 328205 345305 303914Aug�06 175006 161350 151769 162598 163303 152824 159408 190130 187454 212316 226024 187454Sep�06 121836 112256 113384 115297 101732 93420 97781 122323 114837 110926 150603 114837Oct�06 33764 33913 30844 28615 26543 36114 41069 72346 73642 72866 85308 73642Nov�06 55494 46044 48843 44619 44781 42900 43367 59042 70262 78197 90236 70262Dec�06 59470 51653 51913 44500 46813 39869 46792 66155 110377 157627 223358 110377Jan�07 80766 76745 69222 62755 54673 59807 66482 103797 192493 264594 283181 192493Feb�07 88263 83999 72931 65508 66247 66469 74406 108545 157399 193461 218661 157399Mar�07 136785 117686 122976 113518 102743 94738 106547 177327 197942 207676 238591 197942Apr�07 142636 137103 136786 130534 126182 125110 132306 144649 123012 119740 147654 123012May�07 111543 107354 105961 106932 94222 90915 83770 91401 89206 75341 94698 89206Jun�07 84322 64716 49950 44181 34957 36981 68150 105818 130863 169942 203073 130863Jul�07 179391 156942 143594 155505 162125 168097 182542 217389 231059 226006 253728 231059Aug�07 106610 101659 82770 78702 64441 58055 58989 62929 64588 73801 93390 64588Sep�07 86064 76093 76628 77241 69730 58474 52812 66407 62516 56065 76632 62516Oct�07 24349 17836 14402 12186 12462 13039 13080 21766 21746 20414 26371 21746Nov�07 73889 66966 60180 55416 56802 62436 64525 92063 130866 135115 145750 130866Dec�07 90271 78076 68034 69976 69645 71624 66075 77080 105941 136080 173809 105941Jan�08 150988 139050 130543 137005 126762 108916 101454 118931 173812 220046 245562 173812Feb�08 186657 185811 163518 148699 134753 134196 128160 160803 210344 232433 252266 210344Mar�08 194511 183501 168074 160775 152081 139823 126657 158281 198509 207617 241720 198509Apr�08 192195 174564 152676 149851 135665 127285 127594 147007 160517 152390 174664 160517May�08 163070 154352 140156 139326 141993 135519 154812 179539 169203 163547 194966 169203Jun�08 226274 200330 185411 178294 164696 166520 170894 196275 199596 207061 246916 199596Jul�08 187039 172327 171895 160658 145228 135780 135324 165633 190247 219829 257446 190247Aug�08 105591 89614 80009 76364 70617 65652 67979 82000 88168 94028 106812 88168Sep�08 31755 27904 31262 29408 23547 23649 24996 30282 36672 43186 49006 36672Oct�08 53756 53432 44587 50841 38415 38779 33396 38066 49877 60150 64042 49877Nov�08 34799 34755 34418 32401 31708 38107 34486 38293 45255 60389 56459 45255Dec�08 64346 62404 53736 54629 46539 53755 49296 56524 78246 116582 128353 78246
Hora
JEPIRACHI�MONTHLY�HOUR�GENERATION�KWH�(1�to�12)
SKU_18504_Wind_Energy_Colombia_6-17-10.pdf 94SKU_18504_Wind_Energy_Colombia_6-17-10.pdf 94 6/17/2010 12:32:16 PM6/17/2010 12:32:16 PM

Wind Energy in Colombia 75
�
Table A6.3. Jepírachi Monthly Hour Generation kWh (13 to 24)
�Source:�Neon�database�operated�by�Xm.���
The�distribution�of�wind�velocities�at�different�hours�of�the�day�is�shown�in�figure�A6.7.�A�favorable�complementarity�with�daily�electricity�load�fluctuations�is�observed.�Differences�between�this�curve�and�the�corresponding�curve�for�wind�velocity�are�due�to�the�nonlinear�nature�of�the�relationship�between�wind�velocity�and�power.���
13 14 15 16 17 18 19 20 21 22 23 24Feb�04 98832 116252 121112 116121 115746 109831 102702 88486 75112 71280 66288 54858Mar�04 209915 222360 226980 228988 230264 225482 204557 191778 184204 175480 157655 144963Apr�04 287841 308331 319624 322955 312303 290319 257954 217061 199895 180377 168059 143401May�04 278974 309557 320782 339221 342712 317194 294642 278238 265014 267321 259511 248826Jun�04 409552 425714 447946 471293 475756 464108 438164 412355 400403 399448 385357 361131Jul�04 355699 422982 457067 451330 447171 422930 380081 323514 299569 282693 269326 254858Aug�04 354570 419574 456167 471056 460154 439583 382403 339621 280883 266809 263923 249949Sep�04 97805 137998 189027 204910 213888 183621 148821 138255 123365 98224 89071 70124Oct�04 147251 194101 223123 226578 231010 204510 172888 144304 117469 85971 69242 64860Nov�04 205158 205387 209871 229119 232997 216665 170954 136850 98301 76084 64232 66332Dec�04 231460 276812 299321 321964 310293 266583 179038 126340 97680 90461 87406 84458Jan�05 258325 301063 321480 319443 318790 294302 238770 209083 186783 161498 153155 135287Feb�05 315201 331622 341827 365001 342725 324492 281304 224905 211600 201198 170405 143229Mar�05 376594 427460 455243 469330 450999 418348 379968 329361 291567 258868 229836 211167Apr�05 271492 285599 319247 329261 321717 306514 261862 223342 193847 169473 164377 153722May�05 215529 232751 259749 274240 277104 252820 220982 201209 181340 173999 162739 151609Jun�05 176273 209676 220576 246222 252478 254471 228805 199115 170318 144279 127117 126592Jul�05 265501 308665 346186 355825 358698 316074 281342 258556 241290 221569 203399 194914Aug�05 304565 352928 385470 410458 393774 359458 310473 257302 229357 212566 199387 187263Sep�05 239844 289204 302050 321373 299517 265394 213934 171449 152194 140641 137612 138227Oct�05 239844 289204 302050 321373 299517 265394 213934 171449 152194 140641 137612 138227Nov�05 121430 144074 176884 181349 176428 156629 126755 99778 86610 85577 75391 66819Dec�05 235340 278407 298848 317624 308204 251596 184531 140527 118467 107466 100216 93312Jan�06 297591 312213 335222 350897 362125 335277 265013 220422 195749 186607 173772 166502Feb�06 353252 373926 391412 411281 405491 391225 339936 286458 257249 230442 205121 197894Mar�06 460954 482631 488260 486242 477543 441109 381590 339041 298122 264119 239649 209951Apr�06 279775 329916 377467 401883 393763 359292 301963 224752 192494 171885 149502 143365May�06 319630 357492 384891 409886 406684 373414 302349 240642 193930 167322 151309 147432Jun�06 310895 332181 400086 431605 430180 424080 360362 285688 237219 211937 201652 199751Jul�06 401830 422321 457354 464218 469127 426919 386932 329370 275202 273212 271802 264170Aug�06 333779 366160 409564 453522 457085 416253 363068 302381 254522 221891 211144 200374Sep�06 293854 338058 379687 397428 378110 351788 293816 240502 191294 156274 144871 135047Oct�06 175005 209381 207484 225583 237867 203258 135133 86640 48166 36688 35897 34898Nov�06 191568 235337 270363 286155 295931 260626 194329 148383 113079 94403 83464 75348Dec�06 327977 373835 403263 413182 394487 350348 202481 130575 103574 84822 75342 57249Jan�07 420510 455144 467110 466372 451484 416899 353725 252184 173892 134679 94213 83736Feb�07 341224 390256 421898 428223 425323 391610 329281 261810 194782 147320 120428 106426Mar�07 356405 414973 453991 470945 447771 408009 356324 269582 203153 168954 162023 143045Apr�07 282406 310738 334771 350266 349246 312744 269336 241341 201140 178680 166082 153390May�07 230448 283151 310982 340678 327283 300680 239819 202271 168300 148287 144181 123500Jun�07 233700 257474 290373 324978 346464 336987 274039 169109 138581 134795 116039 102221Jul�07 348952 383832 407687 401533 391359 368189 328132 282425 247193 223914 210796 190559Aug�07 230393 290796 334389 325578 326678 305269 249026 182901 154951 140690 127179 112397Sep�07 174368 203981 240120 289150 282957 259729 219883 171180 140650 117127 106259 93724Oct�07 47037 63818 86835 100704 101463 95600 78947 62255 44651 34891 27253 22520Nov�07 208529 230499 241063 246768 240535 220457 177799 140615 118235 114625 95984 86350Dec�07 230459 241534 264572 278771 263945 234513 196068 156999 130672 118176 103910 98726Jan�08 340054 378326 406077 406508 391829 333922 276244 244967 232306 209806 188271 154815Feb�08 326300 363704 380896 396105 393385 368342 314384 277194 241242 217727 206113 205375Mar�08 389435 437416 464872 473405 454508 409841 347882 294388 270853 251649 227481 208901Apr�08 340106 390412 421859 440491 430585 390649 337703 301237 264715 236788 218018 205065May�08 319964 367183 399320 433539 419788 388254 320916 276542 243471 216244 203152 180406Jun�08 313496 357607 431142 443789 430007 392750 343404 313940 287019 262303 250843 246133Jul�08 370006 394993 417817 435181 430535 375194 314522 269597 250177 239403 229782 204162Aug�08 174777 209503 233851 252589 252856 237003 181824 159600 145402 117937 107903 109202Sep�08 94118 133119 149249 163896 158904 144601 118924 91800 71418 58785 52261 44988Oct�08 100118 117826 151023 151582 155406 141521 126389 111171 96806 84618 69173 64148Nov�08 116445 143008 150568 167772 167080 146407 115897 94145 76043 63186 52745 43469Dec�08 188203 211681 234862 234010 218937 197061 157795 124273 103599 96777 76449 73344
Hora
JEPIRACHI�MONTHLY�HOUR�GENERATION�KWH�(13�to�24)
SKU_18504_Wind_Energy_Colombia_6-17-10.pdf 95SKU_18504_Wind_Energy_Colombia_6-17-10.pdf 95 6/17/2010 12:32:17 PM6/17/2010 12:32:17 PM

76 World Bank Study
�
Figure A6.7. Jepírachi: Hourly Generation
�
Source:�Neon�database�operated�by�Xm.��
Figure A6.8. Jepírachi: Monthly Mean Generation
�
Source:�Neon�database�operated�by�Xm.��
A� favorable� complementarity� with� river� discharges� is� observed.� Differences�between� this� curve� and� the� corresponding� curve� for� wind� velocity� are� due� to� the�nonlinear�nature�of�the�relationship�between�wind�velocity�and�power.���
00.20.40.60.81
1.21.41.61.82
0�1
1�2
2�3
3�4
4�5
5�6
6�7
7�8
8�9
9�10
10�11
11�12
12�13
13�14
14�15
15�16
16�17
17�18
18�19
19�20
20�21
12�22
22�23
23�24
Mon
thly�Hou
r�gene
ratio
n/Mon
thly�gen
eration
Hours
HOURLY�JEPIRACHI�GENERATION
0
0.2
0.4
0.6
0.8
1
1.2
1.4
1.6
Jan Feb Mar Apr May Jun Jul Aug Sep Oct Nov Dec
Mon
thly�Gen
eration/An
nual�Gen
eration
Month
MONTHLY�MEAN�GENERATION�� JEPIRACHI
SKU_18504_Wind_Energy_Colombia_6-17-10.pdf 96SKU_18504_Wind_Energy_Colombia_6-17-10.pdf 96 6/17/2010 12:32:17 PM6/17/2010 12:32:17 PM

Wind Energy in Colombia 77
�
Chapter 4: Extension of Jepírachi Information
Limited�generation�information�at�the�Jepírachi�power�plant�due�to�its�short�operation�period�is�an�obstacle�for�an�analysis�of�this�plant’s�contribution�to�the�firmness�of�the�power� system� in� a� joint� operation.� Therefore,� generation� information� was� extended�using� the� longer� wind� velocity� records� available� at� Puerto� Bolívar.� The� procedure�followed�is�described�below:��
� Power�calculations�using�wind�velocities�data�at�Puerto�Bolívar.�
� For�each�of�the�hours�of�existing�data�at�Puerto�Bolívar,�power�generation�in�a�Nordex�N60�turbine�was�calculated.�
� The� calculation� adjusted�wind� velocity� to� an� altitude� of� 60�ms� using� an�assumed�roughness�factor�(ar).�
� Power�corresponding�to�the�adjusted�velocity�was�calculated�based�on�the�power� curve� of� the� aerogenerator.� It� was� adjusted� to� take� into� account�differences�between�air�densities�at�Jepírachi�and�the�standard�value.�
� Regression� between� hourly� estimated�power� at� Puerto� Bolívar� and� Jepírachi�generation.�
� Common�hourly�data�between� Jepírachi�generation� reported�by�XM�and�Jepírachi� generation� computed� using� the� methodology� described� in� a.�(above),� were� used� to� perform� a� regression� analysis.� This� analysis� was�repeated�using�different�values�of�the�roughness�coefficient,�choosing�the�value�giving�the�best�fit.�
� Missing�hourly�velocity�information�at�Puerto�Bolívar�was�filled�in.�
� Initially,�the�correlation�between�wind�velocities�at�the�Puerto�Bolívar�and�Barranquilla� Airports� was� studied,� but� no� significance� was� found.�Therefore,� missing� data� were� filled� in� based� on� daily� mean� velocity,� if�available.� Otherwise,� monthly� mean� velocity� was� used� and� finally,�multiannual� monthly� mean� velocity� was� used.� All� these� results� were�adjusted�to�consider�the�hourly�seasonality�observed�in�the�data.�
d.� Extension�of�Jepírachi�generation.�� Jepírachi� generation� information� was� extended� (1985–2008)� using� the�
regression� equation� found� and� applied� to� the� filled�in� Puerto� Bolívar�velocity�records.�Tables�A6.4�and�A6.5�show�extended�monthly�generation�values�for�Jepírachi.�
SKU_18504_Wind_Energy_Colombia_6-17-10.pdf 97SKU_18504_Wind_Energy_Colombia_6-17-10.pdf 97 6/17/2010 12:32:17 PM6/17/2010 12:32:17 PM

78 World Bank Study
�
Table A6.4. Extended Monthly Generation for Jepírachi (January to June)
�Source:�Appendix�authors’�data.�
Jan Feb Mar Abr May Jun1985 5834634 5682658 6515124 5886177 5767205 69145231986 5834634 5682658 6515124 5886177 5767205 69145231987 5834634 7887850 6889132 6483911 5767205 72367431988 7268860 7500189 8912351 6991765 7381501 66086711989 5834634 5682658 6515124 5930856 6758656 75760981990 9451220 5305019 4739058 6958182 6607606 77786321991 6888466 6044854 6438107 6649830 7122249 74879651992 6151827 6929893 8137434 7015526 6335503 74838111993 6475069 5620726 7363741 6390443 4092576 72480221994 6418401 7009124 7217540 7328519 7059915 85867331995 6697520 5836699 6443392 6231644 6491717 66271881996 5370648 6182659 6476131 5931191 5767205 69145231997 4676298 7837674 7564978 6823904 5922530 70070941998 5774991 5591419 7138039 6586111 5526878 72762991999 5773035 5364206 6468408 7050548 6026792 67590322000 5834634 5885611 6515124 5886177 6363170 79786512001 6235307 1399111 1603269 1734096 2497808 83618132002 6742444 6307064 7893469 6571283 7252543 71227332003 6213564 7372513 6822730 6040200 8540665 70143302004 4417189 1630762 3947270 4669053 6122227 90377822005 4431175 4802542 6244397 4828971 4138032 36193062006 5030369 6179175 7233905 5023244 5386714 60273822007 5426555 5031539 5762332 4826728 4020576 39477172008 5502418 5912375 6480628 5917684 5767061 6500230
EXTENDED�MONTHLY�GENERATION�FOR�JEPIRACHI�(KWH)
SKU_18504_Wind_Energy_Colombia_6-17-10.pdf 98SKU_18504_Wind_Energy_Colombia_6-17-10.pdf 98 6/17/2010 12:32:17 PM6/17/2010 12:32:17 PM
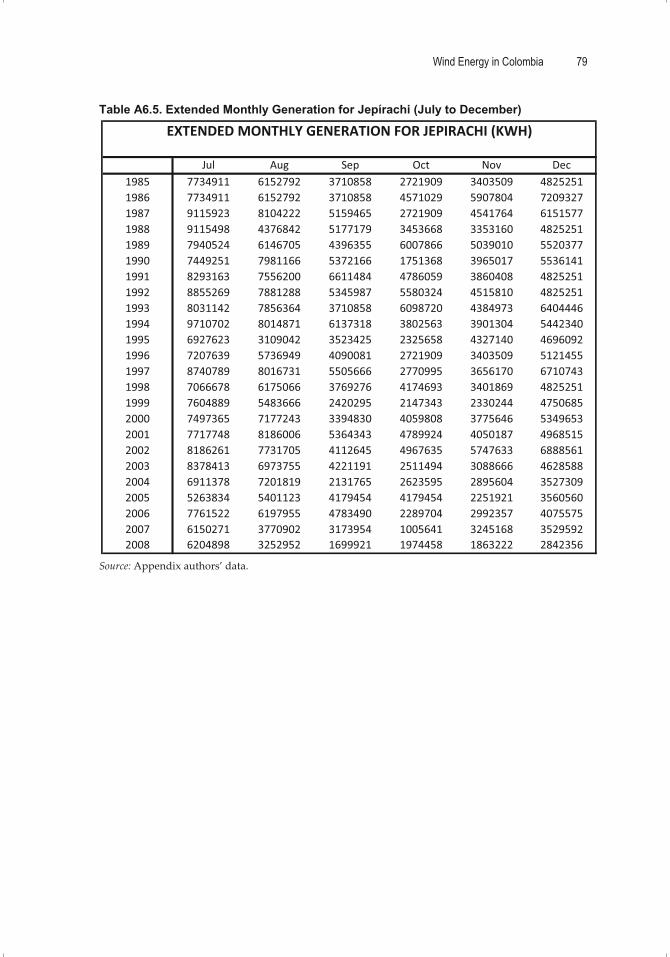
Wind Energy in Colombia 79
�
Table A6.5. Extended Monthly Generation for Jepírachi (July to December)
�Source:�Appendix�authors’�data.�
�� �
Jul Aug Sep Oct Nov Dec1985 7734911 6152792 3710858 2721909 3403509 48252511986 7734911 6152792 3710858 4571029 5907804 72093271987 9115923 8104222 5159465 2721909 4541764 61515771988 9115498 4376842 5177179 3453668 3353160 48252511989 7940524 6146705 4396355 6007866 5039010 55203771990 7449251 7981166 5372166 1751368 3965017 55361411991 8293163 7556200 6611484 4786059 3860408 48252511992 8855269 7881288 5345987 5580324 4515810 48252511993 8031142 7856364 3710858 6098720 4384973 64044461994 9710702 8014871 6137318 3802563 3901304 54423401995 6927623 3109042 3523425 2325658 4327140 46960921996 7207639 5736949 4090081 2721909 3403509 51214551997 8740789 8016731 5505666 2770995 3656170 67107431998 7066678 6175066 3769276 4174693 3401869 48252511999 7604889 5483666 2420295 2147343 2330244 47506852000 7497365 7177243 3394830 4059808 3775646 53496532001 7717748 8186006 5364343 4789924 4050187 49685152002 8186261 7731705 4112645 4967635 5747633 68885612003 8378413 6973755 4221191 2511494 3088666 46285882004 6911378 7201819 2131765 2623595 2895604 35273092005 5263834 5401123 4179454 4179454 2251921 35605602006 7761522 6197955 4783490 2289704 2992357 40755752007 6150271 3770902 3173954 1005641 3245168 35295922008 6204898 3252952 1699921 1974458 1863222 2842356
EXTENDED�MONTHLY�GENERATION�FOR�JEPIRACHI�(KWH)
SKU_18504_Wind_Energy_Colombia_6-17-10.pdf 99SKU_18504_Wind_Energy_Colombia_6-17-10.pdf 99 6/17/2010 12:32:17 PM6/17/2010 12:32:17 PM

80 World Bank Study
�
Chapter 5: Case Studies for Complementarity Analysis
Complementarity�between�hydroelectric�generation�and�wind�generation�at�Jepírachi�is�due� to� two� factors:� noncoincidence� in� seasonal� mean� values� of� both� variables,� and�synergy�obtained�on�the�lack�of�coincidence�of�extreme�events�for�them.�
5.1 Mean Monthly Discharges and Jepírachi Generation
The�following�figures�show�normalized�values�(monthly�mean�divided�by�the�annual�mean)� for� wind� velocities� and� river� discharges� for� the� four� rivers� in� which�complementarity�with�wind�power�was�analyzed.�
Figure�A6.9�shows�the�complementarity�between�these�resources,�since�low�water�discharges�during�the�drier�months�(January�to�April)�correspond�to�high�wind�power.��
Figure A6.9. Mean Monthly Values at the Guavio River Dam Site
�Source:�Appendix�authors’�data.��
Figure A6.10. Mean Monthly Values at the Santa Rita Dam Site on the Nare River
�
Source:�Appendix�authors’�data.�
0
0.5
1
1.5
2
2.5
Jan Feb Mar Apr May Jun Jul Aug Sep Oct Nov Dec
Norm
alize
d m
onth
ly m
ean
Guavio
Jepirachi
0
0.2
0.4
0.6
0.8
1
1.2
1.4
1.6
Jan Feb Mar Apr May Jun Jul Aug Sep Oct Nov Dec
Norm
alize
d m
onth
ly m
ean
Nare
Jepirachi
SKU_18504_Wind_Energy_Colombia_6-17-10.pdf 100SKU_18504_Wind_Energy_Colombia_6-17-10.pdf 100 6/17/2010 12:32:17 PM6/17/2010 12:32:17 PM

Wind Energy in Colombia 81
�
The�graph�shows�very�good�complementarity�between� the�Nare�River�and�wind�power�at� Jepírachi.�Low�discharges�during� the� two�dry� seasons� (December� to�March�and�July�and�August)�correspond�to�high�wind�power;�the�opposite�is�also�true.��
Figure A6.11. Mean Monthly Values at the Salvajina Dam Site on the Cauca River
�Source:�Appendix�authors’�data.��The� Cauca� River� at� the� Salvajina� Dam� site� presents� a� dry� period� from� June� to�September�which�is�complemented�by�high�wind�power�at�the�Jepírachi�site.��
Figure A6.12. Mean Monthly Values at the Salvajina Dam Site on the Magdalena River
�Source:�Appendix�authors’�data.�
�Discharges� of� the�Magdalena� River� at� Betania� follow� a� similar� pattern� to� wind�
power� at� Jepírachi,� although� some� complementarity� is� observed�during� the� first� dry�season�occurring�at�the�beginning�of�the�year.�
0
0.2
0.4
0.6
0.8
1
1.2
1.4
1.6
1.8
Jan Feb Mar Apr May Jun Jul Aug Sep Oct Nov Dec
Norm
alize
d no
nthl
y mea
n
Cauca
Jepirachi
0
0.2
0.4
0.6
0.8
1
1.2
1.4
1.6
Jan Feb Mar Apr May Jun Jul Aug Sep Oct Nov Dec
Norm
alize
d no
nthl
y mea
n
MagdalenaJepirachi
SKU_18504_Wind_Energy_Colombia_6-17-10.pdf 101SKU_18504_Wind_Energy_Colombia_6-17-10.pdf 101 6/17/2010 12:32:17 PM6/17/2010 12:32:17 PM

82 World Bank Study
�
5.2 El Niño occurrences
Colombia’s� interconnected�power�system�is�severely�affected�by�severe�droughts�due�to�its�very�large�hydroelectric�component.�Historically,�during�these�periods�electricity�prices�rise�due�to�the�supply�shortage�and,�in�extreme�cases,�electricity�rationing�may�occur.� An� example� is� the� rationing� in� 1992,� with� severe� economic� and� political�consequences� in� the� country.� Droughts� in� Colombia� occur� due� to� a� global�climatological� event� known� as� El� Niño� that� affects� nearly� the� entire� country.� Next�Table� identifies� the� El� Niño� periods� that� have� occurred� since� 1950,� according� to�IDEAM.��Table A6.6. El Niño Periods since 1950
Source:�Appendix�authors’�data.��
An�analysis�was�conducted�of�the�severity�of�El�Niño�occurrences�in�the�four�rivers�selected�(Nare,�Guavio,�Cauca�and�Magdalena)�compared�with�energy�delivered�by�the�Jepírachi� power� plant.� Initially,� average� historical� values� for� river� discharges� and�Jepírachi� generation� during� El� Niño� periods�were� examined,� as� shown� in� following�tables.�An�example�will�better�illustrate�better�the�analysis�conducted.�The�first�column�of�the�first�table�analyzes�the�severity�of�the�El�Niño�occurrence�between�July�1986�and�March�1988.�The�series�of�mean�discharge�occurrences�in�all�historical�periods�starting�in� July�and� finishing� in�March�of� the� following�year�were�analyzed� (as� shown� in� the�table).�The�mean�and�standard�deviation�of� these�series�were�obtained� (shown�at� the�end� of� the� table),� and� the� departure� from� the� mean� value,� expressed� in� terms� of�
Start Finish Months
Jul�51 Jan�52 6Mar�57 Jul�58 14Jun�63 Feb�64 8May�65 May�66 13Oct�68 Jun�69 8Aug�69 Feb�70 6Apr�72 Feb�73 10Aug�76 Mar�77 7Aug�77 Feb�78 6Apr�82 Jul�83 15Jul�86 Mar�88 20Apr�91 Jul�92 15Feb�93 Aug�93 6Mar�94 Apr�95 13Apr�97 May�98 13Apr�02 Apr�03 12Jun�04 Mar�05 8Aug�06 Feb�07 6
"EL�NIÑO"�PERIODSSource:�IDEAM
SKU_18504_Wind_Energy_Colombia_6-17-10.pdf 102SKU_18504_Wind_Energy_Colombia_6-17-10.pdf 102 6/17/2010 12:32:17 PM6/17/2010 12:32:17 PM

Wind Energy in Colombia 83
�
standard�deviations,�was�obtained�for�the�value�corresponding�to�El�Niño�(July�1986�to�March�1988)�and�is�shown�at�the�end�of�the�table.�The�tables�present�the�information�for�all� El� Niño� occurrences� from� 1985� to� December� 2008� for� the� four� rivers� already�mentioned,� as�well� as� historical� and� reconstructed� generation� at� the� Jepírachi� power�plant.�El�Niño�occurrences�are�shown�in�gray�in�the�tables.� Table A6.7. Analysis of El Niño Occurrences in Guavio River Discharges (1986–1995)
�Source:�Appendix�authors’�data.�
Start Finish Average Start Finish Average Start Finish Average Start Finish Average
Jul�63 Mar�65 60.06 Apr�63 Jul�64 69.92 Feb�63 Aug�63 75.70 Mar�63 Apr�64 56.94Jul�64 Mar�66 67.40 Apr�64 Jul�65 79.97 Feb�64 Aug�64 75.27 Mar�64 Apr�65 64.99Jul�65 Mar�67 57.03 Apr�65 Jul�66 68.81 Feb�65 Aug�65 85.40 Mar�65 Apr�66 67.11Jul�66 Mar�68 63.08 Apr�66 Jul�67 65.89 Feb�66 Aug�66 52.44 Mar�66 Apr�67 51.86Jul�67 Mar�69 67.73 Apr�67 Jul�68 84.14 Feb�67 Aug�67 87.93 Mar�67 Apr�68 67.57Jul�68 Mar�70 65.23 Apr�68 Jul�69 77.97 Feb�68 Aug�68 94.44 Mar�68 Apr�69 70.26Jul�69 Mar�71 75.13 Apr�69 Jul�70 80.53 Feb�69 Aug�69 69.10 Mar�69 Apr�70 64.65Jul�70 Mar�72 80.60 Apr�70 Jul�71 97.58 Feb�70 Aug�70 99.61 Mar�70 Apr�71 82.70Jul�71 Mar�73 77.06 Apr�71 Jul�72 100.64 Feb�71 Aug�71 107.96 Mar�71 Apr�72 84.30Jul�72 Mar�74 67.00 Apr�72 Jul�73 83.92 Feb�72 Aug�72 109.86 Mar�72 Apr�73 72.37Jul�73 Mar�75 67.47 Apr�73 Jul�74 82.51 Feb�73 Aug�73 75.46 Mar�73 Apr�74 68.41Jul�74 Mar�76 66.10 Apr�74 Jul�75 78.49 Feb�74 Aug�74 90.61 Mar�74 Apr�75 64.09Jul�75 Mar�77 74.10 Apr�75 Jul�76 95.67 Feb�75 Aug�75 85.99 Mar�75 Apr�76 70.86Jul�76 Mar�78 62.94 Apr�76 Jul�77 88.67 Feb�76 Aug�76 117.47 Mar�76 Apr�77 78.69Jul�77 Mar�79 60.09 Apr�77 Jul�78 72.44 Feb�77 Aug�77 75.00 Mar�77 Apr�78 58.91Jul�78 Mar�80 59.04 Apr�78 Jul�79 69.74 Feb�78 Aug�78 76.63 Mar�78 Apr�79 59.27Jul�79 Mar�81 60.88 Apr�79 Jul�80 75.49 Feb�79 Aug�79 69.96 Mar�79 Apr�80 63.13Jul�80 Mar�82 59.11 Apr�80 Jul�81 72.39 Feb�80 Aug�80 75.44 Mar�80 Apr�81 59.43Jul�81 Mar�83 70.60 Apr�81 Jul�82 79.08 Feb�81 Aug�81 74.60 Mar�81 Apr�82 66.71Jul�82 Mar�84 78.63 Apr�82 Jul�83 91.63 Feb�82 Aug�82 90.24 Mar�82 Apr�83 79.66Jul�83 Mar�85 73.62 Apr�83 Jul�84 92.31 Feb�83 Aug�83 102.13 Mar�83 Apr�84 77.71Jul�84 Mar�86 67.12 Apr�84 Jul�85 82.16 Feb�84 Aug�84 106.16 Mar�84 Apr�85 69.06Jul�85 Mar�87 75.89 Apr�85 Jul�86 89.86 Feb�85 Aug�85 78.79 Mar�85 Apr�86 67.44Jul�86 Mar�88 73.60 Apr�86 Jul�87 89.63 Feb�86 Aug�86 110.30 Mar�86 Apr�87 78.78Jul�87 Mar�89 70.86 Apr�87 Jul�88 75.53 Feb�87 Aug�87 91.97 Mar�87 Apr�88 64.30Jul�88 Mar�90 72.71 Apr�88 Jul�89 84.73 Feb�88 Aug�88 66.87 Mar�88 Apr�89 65.18Jul�89 Mar�91 66.91 Apr�89 Jul�90 89.78 Feb�89 Aug�89 98.09 Mar�89 Apr�90 73.62Jul�90 Mar�92 65.10 Apr�90 Jul�91 85.34 Feb�90 Aug�90 104.51 Mar�90 Apr�91 70.64Jul�91 Mar�93 65.02 Apr�91 Jul�92 77.94 Feb�91 Aug�91 100.49 Mar�91 Apr�92 69.94Jul�92 Mar�94 69.79 Apr�92 Jul�93 77.95 Feb�92 Aug�92 69.31 Mar�92 Apr�93 59.21Jul�93 Mar�95 77.55 Apr�93 Jul�94 94.88 Feb�93 Aug�93 97.86 Mar�93 Apr�94 73.01Jul�94 Mar�96 60.63 Apr�94 Jul�95 85.68 Feb�94 Aug�94 111.73 Mar�94 Apr�95 80.13Jul�95 Mar�97 57.14 Apr�95 Jul�96 67.70 Feb�95 Aug�95 60.00 Mar�95 Apr�96 50.44Jul�96 Mar�98 60.42 Apr�96 Jul�97 81.59 Feb�96 Aug�96 89.71 Mar�96 Apr�97 64.29Jul�97 Mar�99 68.01 Apr�97 Jul�98 83.38 Feb�97 Aug�97 91.19 Mar�97 Apr�98 58.79Jul�98 Mar�00 70.75 Apr�98 Jul�99 89.81 Feb�98 Aug�98 102.20 Mar�98 Apr�99 78.68Jul�99 Mar�01 66.49 Apr�99 Jul�00 84.11 Feb�99 Aug�99 89.73 Mar�99 Apr�00 69.36Jul�00 Mar�02 67.04 Apr�00 Jul�01 80.88 Feb�00 Aug�00 89.37 Mar�00 Apr�01 68.45Jul�01 Mar�03 70.74 Apr�01 Jul�02 86.79 Feb�01 Aug�01 80.96 Mar�01 Apr�02 68.21Jul�02 Mar�04 64.52 Apr�02 Jul�03 82.16 Feb�02 Aug�02 106.01 Mar�02 Apr�03 73.84Jul�03 Mar�05 73.75 Apr�03 Jul�04 89.32 Feb�03 Aug�03 76.74 Mar�03 Apr�04 65.69Jul�04 Mar�06 64.77 Apr�04 Jul�05 87.01 Feb�04 Aug�04 116.03 Mar�04 Apr�05 81.73Jul�05 Mar�07 63.68 Apr�05 Jul�06 82.15 Feb�05 Aug�05 74.21 Mar�05 Apr�06 68.79Jul�06 Mar�08 56.29 Apr�06 Jul�07 75.35 Feb�06 Aug�06 91.33 Mar�06 Apr�07 67.05Jul�07 Mar�09 59.08 Apr�07 Jul�08 72.14 Feb�07 Aug�07 72.53 Mar�07 Apr�08 56.25Jul�08 Mar�10 Apr�08 Jul�09 Feb�08 Aug�08 75.53 Mar�08 Apr�09 64.01
Average 67.13 Average 82.30 Average 87.89 Average 68.18St,�Dev. 6.29 St,�Dev. 8.25 St,�Dev. 15.63 St,�Dev. 7.99Deviation�from�mean 1.03 Deviation�from�mean �0.53 Deviation�from�mean 0.64 Deviation�from�mean 1.50
Jul.�86 Feb.�93 Mar.�94Mar.�88 Jul.�92 Ago.�93 Abr.�95
Abr.�91
TABLE�1.�ANALYSIS�OF�"EL�NIÑO"�OCCURRENCES���RIVER�DISCHARGES�IN�M3/SEG�GUAVIO�RIVER
SKU_18504_Wind_Energy_Colombia_6-17-10.pdf 103SKU_18504_Wind_Energy_Colombia_6-17-10.pdf 103 6/17/2010 12:32:17 PM6/17/2010 12:32:17 PM

84 World Bank Study
�
Table A6.8. Analysis of El Niño Occurrences in Guavio River Discharges (1997–2007)
�Source:�Appendix�authors’�data.�
Start Finish Average Start Finish Average Start Finish Average Start Finish Average
Apr�63 May�64 63.31 Apr�63 Apr�64 60.12 Jun�63 Mar�64 55.07 Aug�63 Feb�64 44.83Apr�64 May�65 72.89 Apr�64 Apr�65 68.37 Jun�64 Mar�65 65.95 Aug�64 Feb�65 26.30Apr�65 May�66 68.76 Apr�65 Apr�66 71.16 Jun�65 Mar�66 68.78 Aug�65 Feb�66 17.20Apr�66 May�67 55.79 Apr�66 Apr�67 52.96 Jun�66 Mar�67 54.88 Aug�66 Feb�67 30.40Apr�67 May�68 71.22 Apr�67 Apr�68 71.11 Jun�67 Mar�68 66.63 Aug�67 Feb�68 13.75Apr�68 May�69 74.78 Apr�68 Apr�69 73.92 Jun�68 Mar�69 72.64 Aug�68 Feb�69 17.00Apr�69 May�70 70.75 Apr�69 Apr�70 68.19 Jun�69 Mar�70 63.99 Aug�69 Feb�70 27.25Apr�70 May�71 88.02 Apr�70 Apr�71 85.55 Jun�70 Mar�71 82.06 Aug�70 Feb�71 27.10Apr�71 May�72 91.50 Apr�71 Apr�72 86.42 Jun�71 Mar�72 82.82 Aug�71 Feb�72 41.45Apr�72 May�73 76.71 Apr�72 Apr�73 75.02 Jun�72 Mar�73 69.98 Aug�72 Feb�73 12.25Apr�73 May�74 76.01 Apr�73 Apr�74 72.72 Jun�73 Mar�74 73.57 Aug�73 Feb�74 18.95Apr�74 May�75 68.72 Apr�74 Apr�75 66.57 Jun�74 Mar�75 61.98 Aug�74 Feb�75 10.55Apr�75 May�76 79.56 Apr�75 Apr�76 73.17 Jun�75 Mar�76 73.55 Aug�75 Feb�76 18.90Apr�76 May�77 80.13 Apr�76 Apr�77 81.25 Jun�76 Mar�77 78.28 Aug�76 Feb�77 13.60Apr�77 May�78 63.75 Apr�77 Apr�78 61.97 Jun�77 Mar�78 63.85 Aug�77 Feb�78 12.15Apr�78 May�79 63.44 Apr�78 Apr�79 62.76 Jun�78 Mar�79 59.79 Aug�78 Feb�79 9.75Apr�79 May�80 66.56 Apr�79 Apr�80 66.22 Jun�79 Mar�80 65.09 Aug�79 Feb�80 15.85Apr�80 May�81 65.73 Apr�80 Apr�81 62.51 Jun�80 Mar�81 61.18 Aug�80 Feb�81 13.45Apr�81 May�82 72.69 Apr�81 Apr�82 70.11 Jun�81 Mar�82 63.00 Aug�81 Feb�82 17.40Apr�82 May�83 85.02 Apr�82 Apr�83 83.65 Jun�82 Mar�83 76.36 Aug�82 Feb�83 38.75Apr�83 May�84 79.00 Apr�83 Apr�84 78.18 Jun�83 Mar�84 76.96 Aug�83 Feb�84 46.05Apr�84 May�85 74.46 Apr�84 Apr�85 71.91 Jun�84 Mar�85 76.24 Aug�84 Feb�85 11.05Apr�85 May�86 72.19 Apr�85 Apr�86 71.53 Jun�85 Mar�86 72.91 Aug�85 Feb�86 21.30Apr�86 May�87 81.07 Apr�86 Apr�87 81.78 Jun�86 Mar�87 89.00 Aug�86 Feb�87 22.45Apr�87 May�88 67.74 Apr�87 Apr�88 67.54 Jun�87 Mar�88 72.91 Aug�87 Feb�88 13.05Apr�88 May�89 74.24 Apr�88 Apr�89 69.38 Jun�88 Mar�89 73.11 Aug�88 Feb�89 26.65Apr�89 May�90 81.60 Apr�89 Apr�90 74.98 Jun�89 Mar�90 69.63 Aug�89 Feb�90 22.10Apr�90 May�91 72.36 Apr�90 Apr�91 70.81 Jun�90 Mar�91 62.57 Aug�90 Feb�91 16.25Apr�91 May�92 71.50 Apr�91 Apr�92 73.25 Jun�91 Mar�92 76.71 Aug�91 Feb�92 12.90Apr�92 May�93 65.30 Apr�92 Apr�93 62.74 Jun�92 Mar�93 63.53 Aug�92 Feb�93 14.95Apr�93 May�94 81.11 Apr�93 Apr�94 75.67 Jun�93 Mar�94 72.74 Aug�93 Feb�94 14.15Apr�94 May�95 84.00 Apr�94 Apr�95 83.85 Jun�94 Mar�95 83.13 Aug�94 Feb�95 13.55Apr�95 May�96 57.55 Apr�95 Apr�96 52.17 Jun�95 Mar�96 49.24 Aug�95 Feb�96 25.75Apr�96 May�97 71.45 Apr�96 Apr�97 66.82 Jun�96 Mar�97 62.65 Aug�96 Feb�97 23.90Apr�97 May�98 66.70 Apr�97 Apr�98 61.93 Jun�97 Mar�98 56.73 Aug�97 Feb�98 11.35Apr�98 May�99 85.03 Apr�98 Apr�99 83.49 Jun�98 Mar�99 77.69 Aug�98 Feb�99 28.25Apr�99 May�00 77.70 Apr�99 Apr�00 72.42 Jun�99 Mar�00 66.67 Aug�99 Feb�00 23.75Apr�00 May�01 74.14 Apr�00 Apr�01 71.73 Jun�00 Mar�01 70.02 Aug�00 Feb�01 15.95Apr�01 May�02 76.74 Apr�01 Apr�02 71.95 Jun�01 Mar�02 69.77 Aug�01 Feb�02 16.20Apr�02 May�03 80.08 Apr�02 Apr�03 76.43 Jun�02 Mar�03 70.08 Aug�02 Feb�03 10.20Apr�03 May�04 75.61 Apr�03 Apr�04 68.75 Jun�03 Mar�04 62.41 Aug�03 Feb�04 16.10Apr�04 May�05 86.50 Apr�04 Apr�05 84.02 Jun�04 Mar�05 76.66 Aug�04 Feb�05 20.45Apr�05 May�06 76.09 Apr�05 Apr�06 72.65 Jun�05 Mar�06 62.54 Aug�05 Feb�06 16.35Apr�06 May�07 69.01 Apr�06 Apr�07 67.68 Jun�06 Mar�07 57.59 Aug�06 Feb�07 10.80Apr�07 May�08 60.02 Apr�07 Apr�08 58.74 Jun�07 Mar�08 58.73 Aug�07 Feb�08 17.30Apr�08 May�09 Apr�08 Apr�09 67.76 Jun�08 Mar�09 71.00 Aug�08 Feb�09 19.95
Average 73.70 Average 71.13 Average 68.71 Average 19.95St,�Dev. 8.07 St,�Dev. 8.06 St,�Dev. 8.45 St,�Dev. 9.00Deviation�from�mean �0.87 Deviation�from�mean 0.66 Deviation�from�mean 0.94 Deviation�from�mean �1.02
Abr.�97 Abr.�02 Jun.�04 Ago.�06May.�98 Abr.�03 Mar.�05 Feb.�07
TABLE�2.�ANALYSIS�OF�"EL�NIÑO"�OCCURRENCES���RIVER�DISCHARGES�IN�M3/SEG�GUAVIO�RIVER
SKU_18504_Wind_Energy_Colombia_6-17-10.pdf 104SKU_18504_Wind_Energy_Colombia_6-17-10.pdf 104 6/17/2010 12:32:17 PM6/17/2010 12:32:17 PM

Wind Energy in Colombia 85
�
Table A6.9. Analysis of El Niño Occurrences in Nare River Discharges (1986–1995)
�Source:�Appendix�authors’�data.��� �
Start Finish Average Start Finish Average Start Finish Average Start Finish Average
Jul�55 Mar�57 Apr�55 Jul�56 Feb�55 Aug�55 Mar�55 Apr�56Jul�56 Mar�58 46.34 Apr�56 Jul�57 56.21 Feb�56 Aug�56 61.69 Mar�56 Apr�57 57.79Jul�57 Mar�59 32.95 Apr�57 Jul�58 37.60 Feb�57 Aug�57 40.71 Mar�57 Apr�58 37.63Jul�58 Mar�60 33.64 Apr�58 Jul�59 31.68 Feb�58 Aug�58 31.56 Mar�58 Apr�59 30.28Jul�59 Mar�61 40.42 Apr�59 Jul�60 38.61 Feb�59 Aug�59 30.00 Mar�59 Apr�60 35.31Jul�60 Mar�62 42.88 Apr�60 Jul�61 41.01 Feb�60 Aug�60 37.51 Mar�60 Apr�61 40.84Jul�61 Mar�63 52.44 Apr�61 Jul�62 48.93 Feb�61 Aug�61 33.60 Mar�61 Apr�62 41.99Jul�62 Mar�64 49.32 Apr�62 Jul�63 56.69 Feb�62 Aug�62 55.69 Mar�62 Apr�63 56.65Jul�63 Mar�65 44.83 Apr�63 Jul�64 46.53 Feb�63 Aug�63 49.24 Mar�63 Apr�64 45.92Jul�64 Mar�66 45.08 Apr�64 Jul�65 43.83 Feb�64 Aug�64 40.91 Mar�64 Apr�65 43.26Jul�65 Mar�67 46.64 Apr�65 Jul�66 43.56 Feb�65 Aug�65 35.59 Mar�65 Apr�66 41.83Jul�66 Mar�68 47.91 Apr�66 Jul�67 50.76 Feb�66 Aug�66 39.31 Mar�66 Apr�67 46.55Jul�67 Mar�69 46.77 Apr�67 Jul�68 48.89 Feb�67 Aug�67 50.07 Mar�67 Apr�68 45.64Jul�68 Mar�70 48.86 Apr�68 Jul�69 49.41 Feb�68 Aug�68 46.21 Mar�68 Apr�69 49.92Jul�69 Mar�71 54.32 Apr�69 Jul�70 48.59 Feb�69 Aug�69 38.64 Mar�69 Apr�70 44.57Jul�70 Mar�72 66.16 Apr�70 Jul�71 65.99 Feb�70 Aug�70 43.51 Mar�70 Apr�71 58.11Jul�71 Mar�73 55.01 Apr�71 Jul�72 67.64 Feb�71 Aug�71 76.86 Mar�71 Apr�72 66.13Jul�72 Mar�74 48.54 Apr�72 Jul�73 45.06 Feb�72 Aug�72 52.69 Mar�72 Apr�73 45.02Jul�73 Mar�75 60.69 Apr�73 Jul�74 56.09 Feb�73 Aug�73 36.21 Mar�73 Apr�74 52.97Jul�74 Mar�76 61.30 Apr�74 Jul�75 59.13 Feb�74 Aug�74 55.84 Mar�74 Apr�75 57.80Jul�75 Mar�77 53.27 Apr�75 Jul�76 61.31 Feb�75 Aug�75 50.69 Mar�75 Apr�76 60.09Jul�76 Mar�78 39.04 Apr�76 Jul�77 41.66 Feb�76 Aug�76 49.01 Mar�76 Apr�77 41.51Jul�77 Mar�79 49.93 Apr�77 Jul�78 50.83 Feb�77 Aug�77 35.10 Mar�77 Apr�78 44.46Jul�78 Mar�80 48.50 Apr�78 Jul�79 53.37 Feb�78 Aug�78 60.59 Mar�78 Apr�79 52.84Jul�79 Mar�81 42.76 Apr�79 Jul�80 46.91 Feb�79 Aug�79 44.39 Mar�79 Apr�80 48.06Jul�80 Mar�82 51.01 Apr�80 Jul�81 46.15 Feb�80 Aug�80 33.06 Mar�80 Apr�81 37.21Jul�81 Mar�83 49.59 Apr�81 Jul�82 60.96 Feb�81 Aug�81 53.56 Mar�81 Apr�82 58.96Jul�82 Mar�84 39.28 Apr�82 Jul�83 44.58 Feb�82 Aug�82 52.61 Mar�82 Apr�83 44.44Jul�83 Mar�85 49.38 Apr�83 Jul�84 46.66 Feb�83 Aug�83 38.23 Mar�83 Apr�84 40.25Jul�84 Mar�86 53.20 Apr�84 Jul�85 54.26 Feb�84 Aug�84 51.06 Mar�84 Apr�85 52.94Jul�85 Mar�87 46.37 Apr�85 Jul�86 50.79 Feb�85 Aug�85 48.39 Mar�85 Apr�86 50.66Jul�86 Mar�88 43.10 Apr�86 Jul�87 42.14 Feb�86 Aug�86 44.23 Mar�86 Apr�87 42.37Jul�87 Mar�89 57.32 Apr�87 Jul�88 46.19 Feb�87 Aug�87 36.36 Mar�87 Apr�88 42.99Jul�88 Mar�90 61.80 Apr�88 Jul�89 62.64 Feb�88 Aug�88 48.97 Mar�88 Apr�89 61.71Jul�89 Mar�91 48.79 Apr�89 Jul�90 52.78 Feb�89 Aug�89 50.71 Mar�89 Apr�90 52.76Jul�90 Mar�92 41.68 Apr�90 Jul�91 46.19 Feb�90 Aug�90 41.71 Mar�90 Apr�91 44.55Jul�91 Mar�93 35.89 Apr�91 Jul�92 37.53 Feb�91 Aug�91 40.36 Mar�91 Apr�92 37.89Jul�92 Mar�94 42.95 Apr�92 Jul�93 37.80 Feb�92 Aug�92 30.19 Mar�92 Apr�93 35.01Jul�93 Mar�95 46.40 Apr�93 Jul�94 48.09 Feb�93 Aug�93 38.97 Mar�93 Apr�94 46.84Jul�94 Mar�96 49.49 Apr�94 Jul�95 46.95 Feb�94 Aug�94 41.31 Mar�94 Apr�95 42.69Jul�95 Mar�97 57.65 Apr�95 Jul�96 60.15 Feb�95 Aug�95 52.27 Mar�95 Apr�96 53.49Jul�96 Mar�98 41.42 Apr�96 Jul�97 55.28 Feb�96 Aug�96 64.27 Mar�96 Apr�97 57.90Jul�97 Mar�99 43.61 Apr�97 Jul�98 34.03 Feb�97 Aug�97 40.31 Mar�97 Apr�98 31.94Jul�98 Mar�00 68.16 Apr�98 Jul�99 60.18 Feb�98 Aug�98 35.40 Mar�98 Apr�99 55.04Jul�99 Mar�01 70.02 Apr�99 Jul�00 75.00 Feb�99 Aug�99 67.37 Mar�99 Apr�00 71.34Jul�00 Mar�02 49.22 Apr�00 Jul�01 62.89 Feb�00 Aug�00 74.29 Mar�00 Apr�01 66.10Jul�01 Mar�03 38.28 Apr�01 Jul�02 41.34 Feb�01 Aug�01 37.43 Mar�01 Apr�02 38.95Jul�02 Mar�04 40.88 Apr�02 Jul�03 43.82 Feb�02 Aug�02 42.76 Mar�02 Apr�03 40.02Jul�03 Mar�05 51.20 Apr�03 Jul�04 48.73 Feb�03 Aug�03 43.21 Mar�03 Apr�04 45.25Jul�04 Mar�06 57.63 Apr�04 Jul�05 60.48 Feb�04 Aug�04 47.91 Mar�04 Apr�05 55.87Jul�05 Mar�07 54.55 Apr�05 Jul�06 60.24 Feb�05 Aug�05 53.67 Mar�05 Apr�06 56.35Jul�06 Mar�08 61.07 Apr�06 Jul�07 59.86 Feb�06 Aug�06 57.03 Mar�06 Apr�07 55.89Jul�07 Mar�09 73.96 Apr�07 Jul�08 73.12 Feb�07 Aug�07 56.59 Mar�07 Apr�08 67.00Jul�08 Mar�10 Apr�08 Jul�09 Feb�08 Aug�08 76.61 Mar�08 Apr�09 75.74
Average 49.64 Average 50.94 Average 47.07 Average 49.19St,�Dev. 9.01 St,�Dev. 9.68 St,�Dev. 11.42 St,�Dev. 10.14Deviation�from�mean �0.73 Deviation�from�mean �1.39 Deviation�from�mean �0.71 Deviation�from�mean �0.64
TABLE�1.�ANALYSIS�OF�"EL�NIÑO"�OCCURRENCES���RIVER�DISCHARGES�IN�M3/SEG�NARE�RIVER
Jul.�86 Abr.�91 Feb.�93 Mar.�94Mar.�88 Jul.�92 Ago.�93 Abr.�95
SKU_18504_Wind_Energy_Colombia_6-17-10.pdf 105SKU_18504_Wind_Energy_Colombia_6-17-10.pdf 105 6/17/2010 12:32:17 PM6/17/2010 12:32:17 PM

86 World Bank Study
�
Table A6.10. Analysis of El Niño Occurrences in Nare River Discharges (1997–2007)
Source:�Appendix�authors’�data.��� �
Start Finish Average Start Finish Average Start Finish Average Start Finish Average
Apr�55 May�56 Apr�55 Apr�56 Jun�55 Mar�56 Aug�55 Feb�56 66.50Apr�56 May�57 58.19 Apr�56 Apr�57 58.20 Jun�56 Mar�57 57.47 Aug�56 Feb�57 60.37Apr�57 May�58 39.24 Apr�57 Apr�58 38.62 Jun�57 Mar�58 36.82 Aug�57 Feb�58 36.59Apr�58 May�59 31.06 Apr�58 Apr�59 30.50 Jun�58 Mar�59 29.33 Aug�58 Feb�59 31.67Apr�59 May�60 37.24 Apr�59 Apr�60 36.53 Jun�59 Mar�60 37.77 Aug�59 Feb�60 39.74Apr�60 May�61 41.25 Apr�60 Apr�61 41.87 Jun�60 Mar�61 43.10 Aug�60 Feb�61 43.77Apr�61 May�62 46.09 Apr�61 Apr�62 43.05 Jun�61 Mar�62 44.62 Aug�61 Feb�62 47.13Apr�62 May�63 58.41 Apr�62 Apr�63 58.12 Jun�62 Mar�63 56.45 Aug�62 Feb�63 54.54Apr�63 May�64 45.33 Apr�63 Apr�64 45.98 Jun�63 Mar�64 43.47 Aug�63 Feb�64 46.24Apr�64 May�65 45.34 Apr�64 Apr�65 44.93 Jun�64 Mar�65 47.14 Aug�64 Feb�65 48.01Apr�65 May�66 42.59 Apr�65 Apr�66 43.08 Jun�65 Mar�66 44.48 Aug�65 Feb�66 50.44Apr�66 May�67 49.43 Apr�66 Apr�67 48.19 Jun�66 Mar�67 50.35 Aug�66 Feb�67 52.87Apr�67 May�68 46.44 Apr�67 Apr�68 46.63 Jun�67 Mar�68 43.60 Aug�67 Feb�68 41.09Apr�68 May�69 51.84 Apr�68 Apr�69 51.59 Jun�68 Mar�69 52.47 Aug�68 Feb�69 52.79Apr�69 May�70 48.34 Apr�69 Apr�70 46.22 Jun�69 Mar�70 45.80 Aug�69 Feb�70 52.41Apr�70 May�71 63.16 Apr�70 Apr�71 60.55 Jun�70 Mar�71 61.57 Aug�70 Feb�71 65.66Apr�71 May�72 69.01 Apr�71 Apr�72 66.95 Jun�71 Mar�72 66.69 Aug�71 Feb�72 65.93Apr�72 May�73 45.12 Apr�72 Apr�73 45.88 Jun�72 Mar�73 42.84 Aug�72 Feb�73 41.16Apr�73 May�74 55.62 Apr�73 Apr�74 55.19 Jun�73 Mar�74 59.64 Aug�73 Feb�74 66.56Apr�74 May�75 58.40 Apr�74 Apr�75 59.08 Jun�74 Mar�75 61.15 Aug�74 Feb�75 65.34Apr�75 May�76 62.91 Apr�75 Apr�76 61.99 Jun�75 Mar�76 65.32 Aug�75 Feb�76 70.23Apr�76 May�77 41.68 Apr�76 Apr�77 42.15 Jun�76 Mar�77 37.97 Aug�76 Feb�77 36.80Apr�77 May�78 48.39 Apr�77 Apr�78 46.21 Jun�77 Mar�78 44.24 Aug�77 Feb�78 45.09Apr�78 May�79 53.94 Apr�78 Apr�79 53.53 Jun�78 Mar�79 47.93 Aug�78 Feb�79 44.30Apr�79 May�80 48.26 Apr�79 Apr�80 49.18 Jun�79 Mar�80 50.44 Aug�79 Feb�80 54.31Apr�80 May�81 41.59 Apr�80 Apr�81 38.12 Jun�80 Mar�81 38.67 Aug�80 Feb�81 40.77Apr�81 May�82 63.91 Apr�81 Apr�82 61.46 Jun�81 Mar�82 59.95 Aug�81 Feb�82 57.50Apr�82 May�83 45.21 Apr�82 Apr�83 44.71 Jun�82 Mar�83 36.47 Aug�82 Feb�83 36.90Apr�83 May�84 42.62 Apr�83 Apr�84 41.35 Jun�83 Mar�84 40.70 Aug�83 Feb�84 42.60Apr�84 May�85 56.36 Apr�84 Apr�85 54.82 Jun�84 Mar�85 58.02 Aug�84 Feb�85 56.33Apr�85 May�86 51.51 Apr�85 Apr�86 51.78 Jun�85 Mar�86 50.03 Aug�85 Feb�86 54.21Apr�86 May�87 43.39 Apr�86 Apr�87 42.43 Jun�86 Mar�87 41.73 Aug�86 Feb�87 43.03Apr�87 May�88 44.26 Apr�87 Apr�88 44.40 Jun�87 Mar�88 45.13 Aug�87 Feb�88 50.60Apr�88 May�89 63.98 Apr�88 Apr�89 64.13 Jun�88 Mar�89 70.50 Aug�88 Feb�89 77.30Apr�89 May�90 53.56 Apr�89 Apr�90 53.39 Jun�89 Mar�90 53.93 Aug�89 Feb�90 57.53Apr�90 May�91 46.35 Apr�90 Apr�91 45.66 Jun�90 Mar�91 45.21 Aug�90 Feb�91 46.77Apr�91 May�92 38.59 Apr�91 Apr�92 38.48 Jun�91 Mar�92 37.52 Aug�91 Feb�92 37.30Apr�92 May�93 37.71 Apr�92 Apr�93 35.86 Jun�92 Mar�93 36.12 Aug�92 Feb�93 38.96Apr�93 May�94 48.81 Apr�93 Apr�94 48.27 Jun�93 Mar�94 47.68 Aug�93 Feb�94 52.66Apr�94 May�95 44.73 Apr�94 Apr�95 43.57 Jun�94 Mar�95 42.36 Aug�94 Feb�95 43.43Apr�95 May�96 57.36 Apr�95 Apr�96 55.02 Jun�95 Mar�96 56.77 Aug�95 Feb�96 55.47Apr�96 May�97 56.57 Apr�96 Apr�97 58.17 Jun�96 Mar�97 56.75 Aug�96 Feb�97 52.54Apr�97 May�98 32.26 Apr�97 Apr�98 31.30 Jun�97 Mar�98 29.76 Aug�97 Feb�98 26.61Apr�98 May�99 59.91 Apr�98 Apr�99 57.82 Jun�98 Mar�99 61.07 Aug�98 Feb�99 62.09Apr�99 May�00 71.74 Apr�99 Apr�00 70.42 Jun�99 Mar�00 70.61 Aug�99 Feb�00 75.60Apr�00 May�01 65.63 Apr�00 Apr�01 67.12 Jun�00 Mar�01 69.88 Aug�00 Feb�01 66.61Apr�01 May�02 40.43 Apr�01 Apr�02 39.11 Jun�01 Mar�02 36.28 Aug�01 Feb�02 35.47Apr�02 May�03 41.56 Apr�02 Apr�03 41.02 Jun�02 Mar�03 36.45 Aug�02 Feb�03 33.94Apr�03 May�04 47.94 Apr�03 Apr�04 46.32 Jun�03 Mar�04 45.68 Aug�03 Feb�04 43.21Apr�04 May�05 59.60 Apr�04 Apr�05 57.47 Jun�04 Mar�05 57.78 Aug�04 Feb�05 61.81Apr�05 May�06 61.15 Apr�05 Apr�06 57.87 Jun�05 Mar�06 54.53 Aug�05 Feb�06 53.16Apr�06 May�07 59.99 Apr�06 Apr�07 57.12 Jun�06 Mar�07 50.64 Aug�06 Feb�07 52.66Apr�07 May�08 71.09 Apr�07 Apr�08 69.84 Jun�07 Mar�08 68.54 Aug�07 Feb�08 72.04Apr�08 May�09 Apr�08 Apr�09 76.71 Jun�08 Mar�09 78.85 Aug�08 Feb�09 81.06
Average 50.68 Average 50.34 Average 49.97 Average 51.62St,�Dev. 9.93 St,�Dev. 10.39 St,�Dev. 11.42 St,�Dev. 12.43Deviation�from�mean �1.86 Deviation�from�mean �0.90 Deviation�from�mean 0.68 Deviation�from�mean 0.08
TABLE�2.�ANALYSIS�OF�"EL�NIÑO"�OCCURRENCES���RIVER�DISCHARGES�IN�M3/SEG�NARE�RIVER
Ago.�06Abr.�97 Abr.�02 Jun.�04Feb.�07May.�98 Abr.�03 Mar.�05
SKU_18504_Wind_Energy_Colombia_6-17-10.pdf 106SKU_18504_Wind_Energy_Colombia_6-17-10.pdf 106 6/17/2010 12:32:18 PM6/17/2010 12:32:18 PM

Wind Energy in Colombia 87
�
Table A6.11. Analysis of El Niño Occurrences in Cauca River Discharges (1986–1995)
�Source:�Appendix�authors’�data.�� �
Start Finish Average Start Finish Average Start Finish Average Start Finish Average
Jul�46 Mar�48 Apr�46 Jul�47 Feb�46 Aug�46 Mar�46 Apr�47Jul�47 Mar�49 122.05 Apr�47 Jul�48 120.06 Feb�47 Aug�47 83.00 Mar�47 Apr�48 119.43Jul�48 Mar�50 152.67 Apr�48 Jul�49 118.81 Feb�48 Aug�48 115.14 Mar�48 Apr�49 119.00Jul�49 Mar�51 219.10 Apr�49 Jul�50 215.75 Feb�49 Aug�49 122.29 Mar�49 Apr�50 192.93Jul�50 Mar�52 160.95 Apr�50 Jul�51 205.88 Feb�50 Aug�50 295.57 Mar�50 Apr�51 232.36Jul�51 Mar�53 125.95 Apr�51 Jul�52 132.94 Feb�51 Aug�51 144.86 Mar�51 Apr�52 137.86Jul�52 Mar�54 133.10 Apr�52 Jul�53 118.63 Feb�52 Aug�52 123.14 Mar�52 Apr�53 121.86Jul�53 Mar�55 167.52 Apr�53 Jul�54 148.56 Feb�53 Aug�53 104.00 Mar�53 Apr�54 148.14Jul�54 Mar�56 190.62 Apr�54 Jul�55 177.75 Feb�54 Aug�54 144.14 Mar�54 Apr�55 176.00Jul�55 Mar�57 170.10 Apr�55 Jul�56 184.56 Feb�55 Aug�55 163.57 Mar�55 Apr�56 192.64Jul�56 Mar�58 124.86 Apr�56 Jul�57 147.88 Feb�56 Aug�56 152.00 Mar�56 Apr�57 149.07Jul�57 Mar�59 92.10 Apr�57 Jul�58 105.13 Feb�57 Aug�57 125.43 Mar�57 Apr�58 109.86Jul�58 Mar�60 110.38 Apr�58 Jul�59 97.00 Feb�58 Aug�58 84.71 Mar�58 Apr�59 90.29Jul�59 Mar�61 117.76 Apr�59 Jul�60 119.94 Feb�59 Aug�59 91.43 Mar�59 Apr�60 120.50Jul�60 Mar�62 111.62 Apr�60 Jul�61 109.75 Feb�60 Aug�60 114.86 Mar�60 Apr�61 112.00Jul�61 Mar�63 127.29 Apr�61 Jul�62 117.63 Feb�61 Aug�61 98.86 Mar�61 Apr�62 111.64Jul�62 Mar�64 130.52 Apr�62 Jul�63 144.38 Feb�62 Aug�62 122.29 Mar�62 Apr�63 144.36Jul�63 Mar�65 123.86 Apr�63 Jul�64 131.25 Feb�63 Aug�63 159.29 Mar�63 Apr�64 129.00Jul�64 Mar�66 120.67 Apr�64 Jul�65 129.81 Feb�64 Aug�64 121.14 Mar�64 Apr�65 132.43Jul�65 Mar�67 149.76 Apr�65 Jul�66 111.06 Feb�65 Aug�65 94.00 Mar�65 Apr�66 108.14Jul�66 Mar�68 161.86 Apr�66 Jul�67 168.13 Feb�66 Aug�66 94.86 Mar�66 Apr�67 168.07Jul�67 Mar�69 130.33 Apr�67 Jul�68 134.88 Feb�67 Aug�67 147.00 Mar�67 Apr�68 139.36Jul�68 Mar�70 137.00 Apr�68 Jul�69 136.63 Feb�68 Aug�68 133.86 Mar�68 Apr�69 137.29Jul�69 Mar�71 161.86 Apr�69 Jul�70 137.31 Feb�69 Aug�69 128.14 Mar�69 Apr�70 137.50Jul�70 Mar�72 179.00 Apr�70 Jul�71 180.69 Feb�70 Aug�70 131.57 Mar�70 Apr�71 186.93Jul�71 Mar�73 123.00 Apr�71 Jul�72 156.75 Feb�71 Aug�71 179.57 Mar�71 Apr�72 167.00Jul�72 Mar�74 143.10 Apr�72 Jul�73 100.56 Feb�72 Aug�72 133.43 Mar�72 Apr�73 102.21Jul�73 Mar�75 178.90 Apr�73 Jul�74 171.50 Feb�73 Aug�73 89.71 Mar�73 Apr�74 173.36Jul�74 Mar�76 174.43 Apr�74 Jul�75 151.69 Feb�74 Aug�74 159.86 Mar�74 Apr�75 157.21Jul�75 Mar�77 145.24 Apr�75 Jul�76 178.94 Feb�75 Aug�75 155.29 Mar�75 Apr�76 187.86Jul�76 Mar�78 97.76 Apr�76 Jul�77 102.69 Feb�76 Aug�76 152.14 Mar�76 Apr�77 110.29Jul�77 Mar�79 111.86 Apr�77 Jul�78 108.19 Feb�77 Aug�77 77.14 Mar�77 Apr�78 104.71Jul�78 Mar�80 123.76 Apr�78 Jul�79 119.25 Feb�78 Aug�78 92.00 Mar�78 Apr�79 112.71Jul�79 Mar�81 118.10 Apr�79 Jul�80 124.44 Feb�79 Aug�79 118.00 Mar�79 Apr�80 132.64Jul�80 Mar�82 142.24 Apr�80 Jul�81 128.19 Feb�80 Aug�80 105.14 Mar�80 Apr�81 119.00Jul�81 Mar�83 144.95 Apr�81 Jul�82 167.63 Feb�81 Aug�81 151.71 Mar�81 Apr�82 168.86Jul�82 Mar�84 132.19 Apr�82 Jul�83 141.88 Feb�82 Aug�82 171.29 Mar�82 Apr�83 153.00Jul�83 Mar�85 155.00 Apr�83 Jul�84 148.25 Feb�83 Aug�83 128.57 Mar�83 Apr�84 141.64Jul�84 Mar�86 157.14 Apr�84 Jul�85 163.19 Feb�84 Aug�84 158.29 Mar�84 Apr�85 169.21Jul�85 Mar�87 130.90 Apr�85 Jul�86 147.00 Feb�85 Aug�85 117.14 Mar�85 Apr�86 144.50Jul�86 Mar�88 96.57 Apr�86 Jul�87 110.50 Feb�86 Aug�86 148.14 Mar�86 Apr�87 120.00Jul�87 Mar�89 139.76 Apr�87 Jul�88 98.63 Feb�87 Aug�87 80.29 Mar�87 Apr�88 89.14Jul�88 Mar�90 158.19 Apr�88 Jul�89 167.38 Feb�88 Aug�88 101.86 Mar�88 Apr�89 167.71Jul�89 Mar�91 117.14 Apr�89 Jul�90 127.88 Feb�89 Aug�89 147.57 Mar�89 Apr�90 135.07Jul�90 Mar�92 107.52 Apr�90 Jul�91 116.38 Feb�90 Aug�90 129.00 Mar�90 Apr�91 118.36Jul�91 Mar�93 101.48 Apr�91 Jul�92 103.06 Feb�91 Aug�91 111.86 Mar�91 Apr�92 110.07Jul�92 Mar�94 122.95 Apr�92 Jul�93 105.63 Feb�92 Aug�92 78.71 Mar�92 Apr�93 99.86Jul�93 Mar�95 125.52 Apr�93 Jul�94 136.75 Feb�93 Aug�93 121.86 Mar�93 Apr�94 140.43Jul�94 Mar�96 129.10 Apr�94 Jul�95 120.63 Feb�94 Aug�94 134.57 Mar�94 Apr�95 123.86Jul�95 Mar�97 149.90 Apr�95 Jul�96 144.25 Feb�95 Aug�95 106.29 Mar�95 Apr�96 141.50Jul�96 Mar�98 115.71 Apr�96 Jul�97 146.75 Feb�96 Aug�96 152.00 Mar�96 Apr�97 154.50Jul�97 Mar�99 124.76 Apr�97 Jul�98 94.31 Feb�97 Aug�97 131.86 Mar�97 Apr�98 92.43Jul�98 Mar�00 192.90 Apr�98 Jul�99 161.88 Feb�98 Aug�98 91.57 Mar�98 Apr�99 162.07Jul�99 Mar�01 166.79 Apr�99 Jul�00 196.44 Feb�99 Aug�99 177.14 Mar�99 Apr�00 207.86Jul�00 Mar�02 103.21 Apr�00 Jul�01 119.82 Feb�00 Aug�00 186.86 Mar�00 Apr�01 136.77Jul�01 Mar�03 92.33 Apr�01 Jul�02 102.17 Feb�01 Aug�01 88.36 Mar�01 Apr�02 103.56Jul�02 Mar�04 92.67 Apr�02 Jul�03 94.24 Feb�02 Aug�02 97.04 Mar�02 Apr�03 90.42Jul�03 Mar�05 118.19 Apr�03 Jul�04 105.12 Feb�03 Aug�03 91.73 Mar�03 Apr�04 106.50Jul�04 Mar�06 136.31 Apr�04 Jul�05 122.75 Feb�04 Aug�04 88.13 Mar�04 Apr�05 125.39Jul�05 Mar�07 131.57 Apr�05 Jul�06 141.19 Feb�05 Aug�05 119.00 Mar�05 Apr�06 144.29Jul�06 Mar�08 144.85 Apr�06 Jul�07 132.30 Feb�06 Aug�06 148.51 Mar�06 Apr�07 133.14Jul�07 Mar�09 176.39 Apr�07 Jul�08 176.43 Feb�07 Aug�07 130.51 Mar�07 Apr�08 172.94Jul�08 Mar�10 Apr�08 Jul�09 Feb�08 Aug�08 179.73 Mar�08 Apr�09 182.54
Average 136.78 Average 136.54 Average 127.86 Average 139.02St,�Dev. 27.21 St,�Dev. 29.27 St,�Dev. 36.02 St,�Dev. 31.37Deviation�from�mean �1.48 Deviation�from�mean �1.14 Deviation�from�mean �0.17 Deviation�from�mean �0.48
TABLE�1.�ANALYSIS�OF�"EL�NIÑO"�OCCURRENCES���RIVER�DISCHARGES�IN�M3/SEG�CAUCA�RIVER
Jul.�86 Abr.�91 Feb.�93 Mar.�94Mar.�88 Jul.�92 Ago.�93 Abr.�95
SKU_18504_Wind_Energy_Colombia_6-17-10.pdf 107SKU_18504_Wind_Energy_Colombia_6-17-10.pdf 107 6/17/2010 12:32:18 PM6/17/2010 12:32:18 PM

88 World Bank Study
�
Table A6.12. Analysis of El Niño” Occurrences in Cauca River Flows (1997–2007)
�Source:�Appendix�authors’�data.�� �
Start Finish Average Start Finish Average Start Finish Average Start Finish Average
Apr�46 May�47 Apr�46 Apr�47 Jun�46 Mar�47 Aug�46 Feb�47Apr�47 May�48 123.71 Apr�47 Apr�48 122.85 Jun�47 Mar�48 126.30 Aug�47 Feb�48 132.86Apr�48 May�49 120.14 Apr�48 Apr�49 117.08 Jun�48 Mar�49 105.90 Aug�48 Feb�49 107.14Apr�49 May�50 211.14 Apr�49 Apr�50 198.54 Jun�49 Mar�50 197.70 Aug�49 Feb�50 197.86Apr�50 May�51 217.86 Apr�50 Apr�51 221.54 Jun�50 Mar�51 205.30 Aug�50 Feb�51 196.14Apr�51 May�52 137.07 Apr�51 Apr�52 134.31 Jun�51 Mar�52 131.60 Aug�51 Feb�52 135.29Apr�52 May�53 122.07 Apr�52 Apr�53 121.62 Jun�52 Mar�53 115.60 Aug�52 Feb�53 121.14Apr�53 May�54 151.29 Apr�53 Apr�54 151.85 Jun�53 Mar�54 150.00 Aug�53 Feb�54 169.43Apr�54 May�55 180.86 Apr�54 Apr�55 179.92 Jun�54 Mar�55 176.20 Aug�54 Feb�55 184.71Apr�55 May�56 188.21 Apr�55 Apr�56 191.31 Jun�55 Mar�56 195.80 Aug�55 Feb�56 210.57Apr�56 May�57 150.79 Apr�56 Apr�57 147.31 Jun�56 Mar�57 150.90 Aug�56 Feb�57 151.43Apr�57 May�58 108.29 Apr�57 Apr�58 108.23 Jun�57 Mar�58 98.10 Aug�57 Feb�58 94.00Apr�58 May�59 94.00 Apr�58 Apr�59 92.00 Jun�58 Mar�59 91.50 Aug�58 Feb�59 98.00Apr�59 May�60 124.57 Apr�59 Apr�60 124.92 Jun�59 Mar�60 129.60 Aug�59 Feb�60 134.14Apr�60 May�61 109.71 Apr�60 Apr�61 111.31 Jun�60 Mar�61 105.50 Aug�60 Feb�61 114.57Apr�61 May�62 116.57 Apr�61 Apr�62 114.23 Jun�61 Mar�62 114.50 Aug�61 Feb�62 111.29Apr�62 May�63 148.86 Apr�62 Apr�63 144.23 Jun�62 Mar�63 139.10 Aug�62 Feb�63 141.29Apr�63 May�64 128.21 Apr�63 Apr�64 127.23 Jun�63 Mar�64 107.50 Aug�63 Feb�64 111.29Apr�64 May�65 137.57 Apr�64 Apr�65 137.23 Jun�64 Mar�65 137.50 Aug�64 Feb�65 141.71Apr�65 May�66 111.86 Apr�65 Apr�66 110.46 Jun�65 Mar�66 107.90 Aug�65 Feb�66 121.00Apr�66 May�67 172.07 Apr�66 Apr�67 174.77 Jun�66 Mar�67 192.10 Aug�66 Feb�67 217.43Apr�67 May�68 134.86 Apr�67 Apr�68 135.62 Jun�67 Mar�68 131.70 Aug�67 Feb�68 128.71Apr�68 May�69 140.50 Apr�68 Apr�69 137.46 Jun�68 Mar�69 127.80 Aug�68 Feb�69 131.43Apr�69 May�70 141.64 Apr�69 Apr�70 141.31 Jun�69 Mar�70 134.50 Aug�69 Feb�70 132.57Apr�70 May�71 187.93 Apr�70 Apr�71 186.08 Jun�70 Mar�71 193.00 Aug�70 Feb�71 212.43Apr�71 May�72 161.07 Apr�71 Apr�72 162.23 Jun�71 Mar�72 151.40 Aug�71 Feb�72 158.57Apr�72 May�73 99.36 Apr�72 Apr�73 99.00 Jun�72 Mar�73 91.50 Aug�72 Feb�73 87.00Apr�73 May�74 180.07 Apr�73 Apr�74 182.62 Jun�73 Mar�74 204.30 Aug�73 Feb�74 225.71Apr�74 May�75 152.93 Apr�74 Apr�75 150.46 Jun�74 Mar�75 153.20 Aug�74 Feb�75 160.14Apr�75 May�76 186.21 Apr�75 Apr�76 187.85 Jun�75 Mar�76 192.40 Aug�75 Feb�76 206.71Apr�76 May�77 104.93 Apr�76 Apr�77 104.08 Jun�76 Mar�77 90.40 Aug�76 Feb�77 85.14Apr�77 May�78 110.93 Apr�77 Apr�78 108.77 Jun�77 Mar�78 107.50 Aug�77 Feb�78 119.86Apr�78 May�79 118.86 Apr�78 Apr�79 116.62 Jun�78 Mar�79 109.40 Aug�78 Feb�79 110.14Apr�79 May�80 129.79 Apr�79 Apr�80 131.69 Jun�79 Mar�80 131.90 Aug�79 Feb�80 135.29Apr�80 May�81 127.14 Apr�80 Apr�81 118.31 Jun�80 Mar�81 111.40 Aug�80 Feb�81 112.29Apr�81 May�82 174.21 Apr�81 Apr�82 170.00 Jun�81 Mar�82 151.80 Aug�81 Feb�82 144.57Apr�82 May�83 148.79 Apr�82 Apr�83 146.69 Jun�82 Mar�83 121.20 Aug�82 Feb�83 121.71Apr�83 May�84 148.50 Apr�83 Apr�84 143.54 Jun�83 Mar�84 128.50 Aug�83 Feb�84 135.14Apr�84 May�85 170.00 Apr�84 Apr�85 170.54 Jun�84 Mar�85 170.00 Aug�84 Feb�85 188.43Apr�85 May�86 148.50 Apr�85 Apr�86 148.85 Jun�85 Mar�86 148.00 Aug�85 Feb�86 150.14Apr�86 May�87 115.14 Apr�86 Apr�87 114.00 Jun�86 Mar�87 109.30 Aug�86 Feb�87 108.57Apr�87 May�88 92.07 Apr�87 Apr�88 91.38 Jun�87 Mar�88 86.80 Aug�87 Feb�88 91.57Apr�88 May�89 174.93 Apr�88 Apr�89 175.15 Jun�88 Mar�89 194.20 Aug�88 Feb�89 204.29Apr�89 May�90 132.36 Apr�89 Apr�90 128.31 Jun�89 Mar�90 120.10 Aug�89 Feb�90 120.00Apr�90 May�91 117.93 Apr�90 Apr�91 117.31 Jun�90 Mar�91 102.90 Aug�90 Feb�91 101.57Apr�91 May�92 106.43 Apr�91 Apr�92 108.92 Jun�91 Mar�92 106.40 Aug�91 Feb�92 112.00Apr�92 May�93 106.79 Apr�92 Apr�93 102.23 Jun�92 Mar�93 100.80 Aug�92 Feb�93 101.43Apr�93 May�94 141.14 Apr�93 Apr�94 140.54 Jun�93 Mar�94 131.00 Aug�93 Feb�94 137.43Apr�94 May�95 123.50 Apr�94 Apr�95 121.62 Jun�94 Mar�95 110.00 Aug�94 Feb�95 114.14Apr�95 May�96 145.43 Apr�95 Apr�96 145.54 Jun�95 Mar�96 143.40 Aug�95 Feb�96 146.71Apr�96 May�97 148.71 Apr�96 Apr�97 150.54 Jun�96 Mar�97 151.30 Aug�96 Feb�97 157.71Apr�97 May�98 91.86 Apr�97 Apr�98 89.00 Jun�97 Mar�98 78.30 Aug�97 Feb�98 66.00Apr�98 May�99 169.57 Apr�98 Apr�99 170.31 Jun�98 Mar�99 172.00 Aug�98 Feb�99 180.43Apr�99 May�00 205.29 Apr�99 Apr�00 205.85 Jun�99 Mar�00 205.30 Aug�99 Feb�00 225.14Apr�00 May�01 124.74 Apr�00 Apr�01 127.22 Jun�00 Mar�01 115.95 Aug�00 Feb�01 109.57Apr�01 May�02 103.11 Apr�01 Apr�02 102.03 Jun�01 Mar�02 98.72 Aug�01 Feb�02 105.20Apr�02 May�03 92.83 Apr�02 Apr�03 91.22 Jun�02 Mar�03 77.57 Aug�02 Feb�03 71.90Apr�03 May�04 108.64 Apr�03 Apr�04 108.44 Jun�03 Mar�04 104.03 Aug�03 Feb�04 108.37Apr�04 May�05 129.41 Apr�04 Apr�05 129.38 Jun�04 Mar�05 132.23 Aug�04 Feb�05 139.90Apr�05 May�06 144.29 Apr�05 Apr�06 141.38 Jun�05 Mar�06 137.94 Aug�05 Feb�06 147.89Apr�06 May�07 133.75 Apr�06 Apr�07 128.62 Jun�06 Mar�07 108.26 Aug�06 Feb�07 103.66Apr�07 May�08 179.88 Apr�07 Apr�08 177.17 Jun�07 Mar�08 170.51 Aug�07 Feb�08 178.63Apr�08 May�09 Apr�08 Apr�09 180.40 Jun�08 Mar�09 175.81 Aug�08 Feb�09 181.46
Average 139.49 Average 139.02 Average 134.86 Average 139.53St,�Dev. 31.07 St,�Dev. 31.54 St,�Dev. 35.09 St,�Dev. 39.82Deviation�from�mean �1.53 Deviation�from�mean �1.52 Deviation�from�mean �0.07 Deviation�from�mean �0.90
TABLE�2.�ANALYSIS�OF�"EL�NIÑO"�OCCURRENCES���RIVER�DISCHARGES�IN�M3/SEG�CAUCA�RIVER
Ago.�06Abr.�97 Abr.�02 Jun.�04Feb.�07May.�98 Abr.�03 Mar.�05
SKU_18504_Wind_Energy_Colombia_6-17-10.pdf 108SKU_18504_Wind_Energy_Colombia_6-17-10.pdf 108 6/17/2010 12:32:18 PM6/17/2010 12:32:18 PM

Wind Energy in Colombia 89
�
Table A6.13. Analysis of El Niño occurrences in Magdalena River discharges (1986–1995)
�Source:�Appendix�authors’�data.�� �
Start Finish Average Start Finish Average Start Finish Average Start Finish Average
Jul�72 Mar�74 198.51 Apr�72 Jul�73 161.18 Feb�72 Aug�72 215.87 Mar�72 Apr�73 158.22Jul�73 Mar�75 256.77 Apr�73 Jul�74 261.46 Feb�73 Aug�73 152.23 Mar�73 Apr�74 248.98Jul�74 Mar�76 247.04 Apr�74 Jul�75 236.34 Feb�74 Aug�74 297.01 Mar�74 Apr�75 236.84Jul�75 Mar�77 253.34 Apr�75 Jul�76 285.58 Feb�75 Aug�75 234.67 Mar�75 Apr�76 273.19Jul�76 Mar�78 193.41 Apr�76 Jul�77 232.01 Feb�76 Aug�76 304.99 Mar�76 Apr�77 238.92Jul�77 Mar�79 168.98 Apr�77 Jul�78 190.93 Feb�77 Aug�77 176.37 Mar�77 Apr�78 183.85Jul�78 Mar�80 183.66 Apr�78 Jul�79 193.09 Feb�78 Aug�78 178.44 Mar�78 Apr�79 174.26Jul�79 Mar�81 181.18 Apr�79 Jul�80 215.63 Feb�79 Aug�79 218.23 Mar�79 Apr�80 214.96Jul�80 Mar�82 208.41 Apr�80 Jul�81 202.89 Feb�80 Aug�80 204.24 Mar�80 Apr�81 179.19Jul�81 Mar�83 224.60 Apr�81 Jul�82 261.77 Feb�81 Aug�81 223.89 Mar�81 Apr�82 247.41Jul�82 Mar�84 191.81 Apr�82 Jul�83 215.84 Feb�82 Aug�82 283.74 Mar�82 Apr�83 229.51Jul�83 Mar�85 209.93 Apr�83 Jul�84 207.09 Feb�83 Aug�83 182.39 Mar�83 Apr�84 193.59Jul�84 Mar�86 226.24 Apr�84 Jul�85 235.73 Feb�84 Aug�84 226.76 Mar�84 Apr�85 220.95Jul�85 Mar�87 220.01 Apr�85 Jul�86 245.43 Feb�85 Aug�85 208.51 Mar�85 Apr�86 219.66Jul�86 Mar�88 171.06 Apr�86 Jul�87 208.83 Feb�86 Aug�86 285.93 Mar�86 Apr�87 225.78Jul�87 Mar�89 177.14 Apr�87 Jul�88 167.64 Feb�87 Aug�87 156.34 Mar�87 Apr�88 141.64Jul�88 Mar�90 187.12 Apr�88 Jul�89 208.44 Feb�88 Aug�88 173.71 Mar�88 Apr�89 194.78Jul�89 Mar�91 165.73 Apr�89 Jul�90 186.99 Feb�89 Aug�89 194.80 Mar�89 Apr�90 172.93Jul�90 Mar�92 159.59 Apr�90 Jul�91 182.13 Feb�90 Aug�90 211.97 Mar�90 Apr�91 172.99Jul�91 Mar�93 153.53 Apr�91 Jul�92 165.45 Feb�91 Aug�91 184.37 Mar�91 Apr�92 162.81Jul�92 Mar�94 186.16 Apr�92 Jul�93 169.35 Feb�92 Aug�92 140.97 Mar�92 Apr�93 147.02Jul�93 Mar�95 211.82 Apr�93 Jul�94 244.79 Feb�93 Aug�93 207.71 Mar�93 Apr�94 220.15Jul�94 Mar�96 179.88 Apr�94 Jul�95 218.29 Feb�94 Aug�94 296.24 Mar�94 Apr�95 226.53Jul�95 Mar�97 186.36 Apr�95 Jul�96 199.99 Feb�95 Aug�95 158.97 Mar�95 Apr�96 180.45Jul�96 Mar�98 151.98 Apr�96 Jul�97 202.57 Feb�96 Aug�96 248.69 Mar�96 Apr�97 200.88Jul�97 Mar�99 161.50 Apr�97 Jul�98 150.57 Feb�97 Aug�97 186.06 Mar�97 Apr�98 128.23Jul�98 Mar�00 209.02 Apr�98 Jul�99 210.25 Feb�98 Aug�98 157.86 Mar�98 Apr�99 199.95Jul�99 Mar�01 177.97 Apr�99 Jul�00 220.76 Feb�99 Aug�99 237.87 Mar�99 Apr�00 220.04Jul�00 Mar�02 130.18 Apr�00 Jul�01 159.87 Feb�00 Aug�00 233.33 Mar�00 Apr�01 164.61Jul�01 Mar�03 138.89 Apr�01 Jul�02 160.18 Feb�01 Aug�01 157.27 Mar�01 Apr�02 139.78Jul�02 Mar�04 133.77 Apr�02 Jul�03 160.73 Feb�02 Aug�02 192.90 Mar�02 Apr�03 153.91Jul�03 Mar�05 143.48 Apr�03 Jul�04 148.24 Feb�03 Aug�03 145.21 Mar�03 Apr�04 141.28Jul�04 Mar�06 157.62 Apr�04 Jul�05 155.63 Feb�04 Aug�04 145.46 Mar�04 Apr�05 151.70Jul�05 Mar�07 176.31 Apr�05 Jul�06 190.83 Feb�05 Aug�05 158.74 Mar�05 Apr�06 175.89Jul�06 Mar�08 205.89 Apr�06 Jul�07 209.21 Feb�06 Aug�06 233.24 Mar�06 Apr�07 196.84Jul�07 Mar�09 253.50 Apr�07 Jul�08 255.37 Feb�07 Aug�07 212.16 Mar�07 Apr�08 229.54Jul�08 Mar�10 Apr�08 Jul�09 Feb�08 Aug�08 261.97 Mar�08 Apr�09 274.84
Average 188.40 Average 203.36 Average 207.81 Average 195.73St,�Dev. 33.89 St,�Dev. 35.52 St,�Dev. 46.66 St,�Dev. 38.70Deviation�from�mean �0.51 Deviation�from�mean �1.07 Deviation�from�mean 0.00 Deviation�from�mean 0.80
TABLE�1.�ANALYSIS�OF�"EL�NIÑO"�OCCURRENCES���RIVER�DISCHARGES�IN�M3/SEG�MAGDALENA�RIVER
Jul.�86 Abr.�91 Feb.�93 Mar.�94Mar.�88 Jul.�92 Ago.�93 Abr.�95
SKU_18504_Wind_Energy_Colombia_6-17-10.pdf 109SKU_18504_Wind_Energy_Colombia_6-17-10.pdf 109 6/17/2010 12:32:18 PM6/17/2010 12:32:18 PM

90 World Bank Study
�
Table A6.14. Analysis of El Niño Occurrences in Magdalena River Discharges (1997–2007)
�Source:�Appendix�authors’�data.�� �
Start Finish Average Start Finish Average Start Finish Average Start Finish Average
Apr�72 May�73 155.96 Apr�72 Apr�73 154.37 Jun�72 Mar�73 131.63 Aug�72 Feb�73 110.30Apr�73 May�74 263.41 Apr�73 Apr�74 262.03 Jun�73 Mar�74 279.30 Aug�73 Feb�74 288.46Apr�74 May�75 231.73 Apr�74 Apr�75 225.95 Jun�74 Mar�75 219.19 Aug�74 Feb�75 209.10Apr�75 May�76 280.36 Apr�75 Apr�76 276.30 Jun�75 Mar�76 275.74 Aug�75 Feb�76 277.21Apr�76 May�77 234.94 Apr�76 Apr�77 235.78 Jun�76 Mar�77 215.10 Aug�76 Feb�77 199.49Apr�77 May�78 190.36 Apr�77 Apr�78 189.50 Jun�77 Mar�78 175.23 Aug�77 Feb�78 174.39Apr�78 May�79 183.64 Apr�78 Apr�79 179.32 Jun�78 Mar�79 155.50 Aug�78 Feb�79 131.64Apr�79 May�80 211.74 Apr�79 Apr�80 212.75 Jun�79 Mar�80 198.14 Aug�79 Feb�80 187.31Apr�80 May�81 198.64 Apr�80 Apr�81 181.30 Jun�80 Mar�81 169.86 Aug�80 Feb�81 150.37Apr�81 May�82 261.22 Apr�81 Apr�82 254.11 Jun�81 Mar�82 232.97 Aug�81 Feb�82 227.03Apr�82 May�83 227.59 Apr�82 Apr�83 225.99 Jun�82 Mar�83 193.28 Aug�82 Feb�83 178.54Apr�83 May�84 201.66 Apr�83 Apr�84 196.80 Jun�83 Mar�84 176.30 Aug�83 Feb�84 192.64Apr�84 May�85 225.25 Apr�84 Apr�85 226.62 Jun�84 Mar�85 227.59 Aug�84 Feb�85 240.34Apr�85 May�86 225.78 Apr�85 Apr�86 228.61 Jun�85 Mar�86 232.66 Aug�85 Feb�86 193.00Apr�86 May�87 216.29 Apr�86 Apr�87 215.65 Jun�86 Mar�87 215.15 Aug�86 Feb�87 185.46Apr�87 May�88 146.08 Apr�87 Apr�88 145.81 Jun�87 Mar�88 134.43 Aug�87 Feb�88 138.06Apr�88 May�89 209.62 Apr�88 Apr�89 204.78 Jun�88 Mar�89 223.75 Aug�88 Feb�89 189.40Apr�89 May�90 176.95 Apr�89 Apr�90 165.11 Jun�89 Mar�90 154.06 Aug�89 Feb�90 145.20Apr�90 May�91 178.29 Apr�90 Apr�91 176.77 Jun�90 Mar�91 160.47 Aug�90 Feb�91 133.59Apr�91 May�92 158.67 Apr�91 Apr�92 163.41 Jun�91 Mar�92 162.55 Aug�91 Feb�92 164.14Apr�92 May�93 160.81 Apr�92 Apr�93 153.82 Jun�92 Mar�93 152.84 Aug�92 Feb�93 125.54Apr�93 May�94 229.96 Apr�93 Apr�94 219.87 Jun�93 Mar�94 203.01 Aug�93 Feb�94 187.73Apr�94 May�95 221.67 Apr�94 Apr�95 224.13 Jun�94 Mar�95 197.61 Aug�94 Feb�95 164.83Apr�95 May�96 187.24 Apr�95 Apr�96 184.72 Jun�95 Mar�96 175.37 Aug�95 Feb�96 148.77Apr�96 May�97 194.89 Apr�96 Apr�97 191.48 Jun�96 Mar�97 190.73 Aug�96 Feb�97 173.97Apr�97 May�98 134.79 Apr�97 Apr�98 129.55 Jun�97 Mar�98 112.84 Aug�97 Feb�98 79.47Apr�98 May�99 214.17 Apr�98 Apr�99 210.75 Jun�98 Mar�99 203.99 Aug�98 Feb�99 186.63Apr�99 May�00 232.73 Apr�99 Apr�00 220.71 Jun�99 Mar�00 205.14 Aug�99 Feb�00 200.50Apr�00 May�01 157.36 Apr�00 Apr�01 155.56 Jun�00 Mar�01 127.80 Aug�00 Feb�01 121.43Apr�01 May�02 141.89 Apr�01 Apr�02 138.68 Jun�01 Mar�02 131.14 Aug�01 Feb�02 116.09Apr�02 May�03 158.58 Apr�02 Apr�03 154.68 Jun�02 Mar�03 148.39 Aug�02 Feb�03 114.97Apr�03 May�04 145.56 Apr�03 Apr�04 144.25 Jun�03 Mar�04 132.23 Aug�03 Feb�04 129.37Apr�04 May�05 158.50 Apr�04 Apr�05 158.36 Jun�04 Mar�05 151.66 Aug�04 Feb�05 144.40Apr�05 May�06 177.11 Apr�05 Apr�06 176.20 Jun�05 Mar�06 163.69 Aug�05 Feb�06 155.50Apr�06 May�07 194.76 Apr�06 Apr�07 190.65 Jun�06 Mar�07 171.75 Aug�06 Feb�07 148.36Apr�07 May�08 241.32 Apr�07 Apr�08 239.09 Jun�07 Mar�08 238.13 Aug�07 Feb�08 214.46Apr�08 May�09 Apr�08 Apr�09 276.02 Jun�08 Mar�09 289.07 Aug�08 Feb�09 263.03
Average 198.04 Average 197.01 Average 187.25 Average 172.72St,�Dev. 37.52 St,�Dev. 39.22 St,�Dev. 44.13 St,�Dev. 47.26Deviation�from�mean �1.69 Deviation�from�mean �1.08 Deviation�from�mean �0.81 Deviation�from�mean �0.52
TABLE�2.�ANALYSIS�OF�"EL�NIÑO"�OCCURRENCES���RIVER�DISCHARGES�IN�M3/SEG�MAGDALENA�RIVER
Ago.�06Abr.�97 Abr.�02 Jun.�04Feb.�07May.�98 Abr.�03 Mar.�05
SKU_18504_Wind_Energy_Colombia_6-17-10.pdf 110SKU_18504_Wind_Energy_Colombia_6-17-10.pdf 110 6/17/2010 12:32:18 PM6/17/2010 12:32:18 PM

Wind Energy in Colombia 91
�
Table A6.15. Analysis of El Niño Occurrences at Jepírachi Power Plant (1986–1995)
�Source:�Appendix�authors’�data.��Table A6.16. Analysis of El Niño Occurrences at Jepírachi Power Plant (1997–2007)
�Source:�Appendix�authors’�data.�
Start Finish Average Start Finish Average Start Finish Average Start Finish Average
Jul�85 Mar�87 5764185 Apr�85 Jul�86 5715773 Feb�85 Aug�85 6379056 Mar�85 Apr�86 5539347Jul�86 Mar�88 6422022 Apr�86 Jul�87 6441876 Feb�86 Aug�86 6379056 Mar�86 Apr�87 6247520Jul�87 Mar�89 6132963 Apr�87 Jul�88 6816347 Feb�87 Aug�87 7354998 Mar�87 Apr�88 6631787Jul�88 Mar�90 5864084 Apr�88 Jul�89 6095130 Feb�88 Aug�88 7269545 Mar�88 Apr�89 6011369Jul�89 Mar�91 6062719 Apr�89 Jul�90 6475338 Feb�89 Aug�89 6650089 Mar�89 Apr�90 6306075Jul�90 Mar�92 6182776 Apr�90 Jul�91 6395260 Feb�90 Aug�90 6688416 Mar�90 Apr�91 6011417Jul�91 Mar�93 6402382 Apr�91 Jul�92 6756367 Feb�91 Aug�91 7084624 Mar�91 Apr�92 6561814Jul�92 Mar�94 6253623 Apr�92 Jul�93 6441281 Feb�92 Aug�92 7519818 Mar�92 Apr�93 6559013Jul�93 Mar�95 6480640 Apr�93 Jul�94 6721780 Feb�93 Aug�93 6657573 Mar�93 Apr�94 6396776Jul�94 Mar�96 5632175 Apr�94 Jul�95 6577503 Feb�94 Aug�94 7846772 Mar�94 Apr�95 6600790Jul�95 Mar�97 5233897 Apr�95 Jul�96 5506845 Feb�95 Aug�95 5952472 Mar�95 Apr�96 5333111Jul�96 Mar�98 5810455 Apr�96 Jul�97 5966733 Feb�96 Aug�96 6316614 Mar�96 Apr�97 5733818Jul�97 Mar�99 5729205 Apr�97 Jul�98 6257190 Feb�97 Aug�97 7416243 Mar�97 Apr�98 6272154Jul�98 Mar�00 5229874 Apr�98 Jul�99 5865564 Feb�98 Aug�98 6480070 Mar�98 Apr�99 5756883Jul�99 Mar�01 4937749 Apr�99 Jul�00 5658389 Feb�99 Aug�99 6393935 Mar�99 Apr�00 5368818Jul�00 Mar�02 5195507 Apr�00 Jul�01 5064481 Feb�00 Aug�00 6757620 Mar�00 Apr�01 4926389Jul�01 Mar�03 6429024 Apr�01 Jul�02 6109140 Feb�01 Aug�01 4499979 Mar�01 Apr�02 5484855Jul�02 Mar�04 5687418 Apr�02 Jul�03 6810213 Feb�02 Aug�02 7295008 Mar�02 Apr�03 6637391Jul�03 Mar�05 4780761 Apr�03 Jul�04 5508310 Feb�03 Aug�03 7306087 Mar�03 Apr�04 5206022Jul�04 Mar�06 4601699 Apr�04 Jul�05 4903049 Feb�04 Aug�04 5645756 Mar�04 Apr�05 4955349Jul�05 Mar�07 4954198 Apr�05 Jul�06 5004060 Feb�05 Aug�05 4899743 Mar�05 Apr�06 4795268Jul�06 Mar�08 4566048 Apr�06 Jul�07 4981479 Feb�06 Aug�06 6258557 Mar�06 Apr�07 5201357Jul�07 Mar�09 Apr�07 Jul�08 4747240 Feb�07 Aug�07 4787152 Mar�07 Apr�08 4517570Jul�08 Mar�10 Apr�08 Jul�09 Feb�08 Aug�08 5719404 Mar�08 Apr�09
Average 5652427.35 Average 5948667 Average 6481608 Average 5784995.29St,�Dev. 624131.16 St,�Dev. 671731 St,�Dev. 885823 St,�Dev. 665029.00Deviation�from�mean 1.23 Deviation�from�mean 1.20 Deviation�from�mean 0.20 Deviation�from�mean 1.23
TABLE�1.�ANALYSIS�OF�"EL�NIÑO"�OCCURRENCES���ENERGY�IN�KWH�JEPIRACHI�POWERPLANT
Mar.�88 Jul.�92Feb.�93 Mar.�94Jul.�86 Abr.�91Ago.�93 Abr.�95
Start Finish Average Start Finish Average Start Finish Average Start Finish Average
Apr�85 May�86 5485924 Apr�85 Apr�86 5464287 Jun�85 Mar�86 5349617 Aug�85 Feb�86 4618802Apr�86 May�87 6194097 Apr�86 Apr�87 6226935 Jun�86 Mar�87 6281286 Aug�86 Feb�87 5896328Apr�87 May�88 6666956 Apr�87 Apr�88 6611991 Jun�87 Mar�88 6671300 Aug�87 Feb�88 5921141Apr�88 May�89 5857533 Apr�88 Apr�89 5788216 Jun�88 Mar�89 5494269 Aug�88 Feb�89 4671913Apr�89 May�90 6312681 Apr�89 Apr�90 6289994 Jun�89 Mar�90 6212223 Aug�89 Feb�90 5980936Apr�90 May�91 6181645 Apr�90 Apr�91 6109291 Jun�90 Mar�91 5920517 Aug�90 Feb�91 5362740Apr�91 May�92 6554485 Apr�91 Apr�92 6571330 Jun�91 Mar�92 6463968 Aug�91 Feb�92 5817303Apr�92 May�93 6270095 Apr�92 Apr�93 6437596 Jun�92 Mar�93 6394728 Aug�92 Feb�93 5749208Apr�93 May�94 6375075 Apr�93 Apr�94 6322395 Jun�93 Mar�94 6437959 Aug�93 Feb�94 5983270Apr�94 May�95 6548945 Apr�94 Apr�95 6553348 Jun�94 Mar�95 6457344 Aug�94 Feb�95 5690374Apr�95 May�96 5284812 Apr�95 Apr�96 5247704 Jun�95 Mar�96 4956561 Aug�95 Feb�96 4219238Apr�96 May�97 5694275 Apr�96 Apr�97 5676717 Jun�96 Mar�97 5527502 Aug�96 Feb�97 4798268Apr�97 May�98 6126576 Apr�97 Apr�98 6172706 Jun�97 Mar�98 6091264 Aug�97 Feb�98 5432388Apr�98 May�99 5677508 Apr�98 Apr�99 5650640 Jun�98 Mar�99 5429478 Aug�98 Feb�99 4783342Apr�99 May�00 5361301 Apr�99 Apr�00 5284234 Jun�99 Mar�00 4973152 Aug�99 Feb�00 4121783Apr�00 May�01 4639438 Apr�00 Apr�01 4804179 Jun�00 Mar�01 4847088 Aug�00 Feb�01 4484514Apr�01 May�02 5888374 Apr�01 Apr�02 5783438 Jun�01 Mar�02 6438151 Aug�01 Feb�02 5772640Apr�02 May�03 6683619 Apr�02 Apr�03 6540770 Jun�02 Mar�03 6516598 Aug�02 Feb�03 6147751Apr�03 May�04 5155986 Apr�03 Apr�04 5081660 Jun�03 Mar�04 4681166 Aug�03 Feb�04 3924521Apr�04 May�05 4968975 Apr�04 Apr�05 5032894 Jun�04 Mar�05 4980736 Aug�04 Feb�05 3944830Apr�05 May�06 4734004 Apr�05 Apr�06 4683796 Jun�05 Mar�06 4689910 Aug�05 Feb�06 4397437Apr�06 May�07 4971834 Apr�06 Apr�07 5045007 Jun�06 Mar�07 5034841 Aug�06 Feb�07 4399596Apr�07 May�08 4517908 Apr�07 Apr�08 4421820 Jun�07 Mar�08 4271867 Aug�07 Feb�08 3734293Apr�08 May�09 Apr�08 Apr�09 Jun�08 Mar�09 Aug�08 Feb�09
Average 5745741 Average 5730476 Average 5657458 Average 5037070St,�Dev. 685203 St,�Dev. 678529 St,�Dev. 745717 St,�Dev. 799741Deviation�from�mean 0.56 Deviation�from�mean 1.19 Deviation�from�mean �0.91 Deviation�from�mean �0.80
TABLE�2.�ANALYSIS�OF�"EL�NIÑO"�OCCURRENCES���ENERGY�IN�KWH�JEPIRACHI�POWERPLANT
Feb.�07Abr.�97 Abr.�02 Jun.�04 Ago.�06May.�98 Abr.�03 Mar.�05
SKU_18504_Wind_Energy_Colombia_6-17-10.pdf 111SKU_18504_Wind_Energy_Colombia_6-17-10.pdf 111 6/17/2010 12:32:19 PM6/17/2010 12:32:19 PM

92 World Bank Study
�
The�following�table�summarizes�the�results.�One�can�see�that�the�four�rivers�show�negative�values�for�most�El�Niño�occurrences,�while�Jepírachi�generation�is�positive�in�most�of�them.�The�most�severe�occurrences�for�the�rivers�analyzed�are�April�1991–July�1992� (when� a� severe� rationing� occurred� in� the� country)� and� April� 1997–May� 1998�(when�pool�prices�rose�significantly,�forcing�regulatory�changes�in�the�market).�During�these� periods� Jepírachi� generation� is� well� above� the� mean� value,� complementing�hydroelectric�generation.��Table A6.17. Summary of El Niño occurrences, 1986–2007
�Source:�Appendix�authors’�data.��
5.3 Firm Energy
An�analysis�of�firm�energy�was�obtained�from�hydroelectric�plants�(with�and�without�reservoirs)� and� the� Jepírachi� power� plant� in� isolated� operation,� and� compared� with�joint� operation� of� hydro� and� wind� power� plants.� Firm� energy� is� defined� as� the�maximum�monthly�energy� that� can�be�produced�without�deficits�during� the�analysis�period,�which�will�include�El�Niño�occurrences.�The�same�results�were�obtained�for�the�total� energy�obtained� from� the� joint�operation�of� the�hydroelectric�power�plants� and�the�Jepírachi�plant.�
The�analysis�was�conducted�using�a�simulation�model�that�operates�the�plants�and�the�reservoirs�to�provide�a�given�energy�target,�adjusting�this�target�until�no�deficits�are�generated.�The�analysis�was�conducted�for�each�of�the�selected�hydroelectric�plants.�
Hypothetical�hydroelectric�plants�of�similar�capacity�to�that�of�wind�power�plants�were�analyzed.�Mean�multiannual�inflow�to�the�hydroelectric�power�plants�(expressed�in�energy)�at�the�plant�sites�is�equal�to�the�same�value�for�the�Jepírachi�generation.�This�was�done�by�multiplying�river�discharges�by�a�factor�to�convert�them�to�energy�so�that�mean� inflows� are� equal� to� Jepírachi’s� mean� generation.� In� order� to� avoid� confusion�with� existing� hydroelectric� plants,� the� hypothetical� plants� analyzed� will� be� named�Guavio�River,�Nare�River,�Cauca�River,�and�Magdalena�River.�
Several� reservoir� sizes� were� analyzed;� reservoir� size� (expressed� as� a� fraction� of�mean�annual�inflow�to�the�reservoir�in�energy)�varies�between�0�(run�of�river�plant)�to�1�(substantial�regulation�capacity).�Results�are�shown�in�the�following�chapters.�
5.3.1� Guavio�River�Table�A6.18�and�figure�A6.13�show�results�for�the�Guavio�River.�Firm�energy�has�been�normalized� dividing� actual� firm� energy� by� the� sum� of�mean� energy� for� the�Guavio�River�and�Jepírachi.��
Jul.�86 Abr.�91 Feb.�93 Mar.�94 Abr.�97 Abr.�02 Jun.�04 Ago.�06Mar.�88 Jul.�92 Ago.�93 Abr.�95 May.�98 Abr.�03 Mar.�05 Feb.�07
Guavio�River 1.03 �0.53 0.64 1.50 �0.87 0.66 0.94 �1.02Nare�River �0.73 �1.39 �0.71 �0.64 �1.86 �0.90 0.68 0.08Cauca�River �1.48 �1.14 �0.17 �0.48 �1.53 �1.52 �0.07 �0.90
Magdalena�River �0.51 �1.07 0.00 0.80 �1.69 �1.08 �0.81 �0.52Jepirachi�Powerplant 1.23 1.20 0.20 1.23 0.56 1.19 �0.91 �0.80
"EL�NIÑO"�OCCURRENCES
ANALYSIS�OF�"EL�NIÑO"�OCCURRENCESDeparture�from�mean�va lue�expressed�as�number�of�standard�deviations
SKU_18504_Wind_Energy_Colombia_6-17-10.pdf 112SKU_18504_Wind_Energy_Colombia_6-17-10.pdf 112 6/17/2010 12:32:19 PM6/17/2010 12:32:19 PM

Wind Energy in Colombia 93
�
Table A6.18. Firm Energy for Guavio and Jepírachi in Isolated and Joint Operation
�Source:�Appendix�authors’�data.���
Figure A6.13. Firm Energy for Guavio and Jepírachi in Isolated and Joint Operation
�
Source:�Appendix�authors’�data.��
The�substantial�increase�in�firm�energy�when�joint�operation�is�considered�can�be�seen� both� in� the� table� and� the� figure.� This� is� because� critical� periods� for� the�Guavio�River�do�not�coincide�with�Jepírachi�generation�during�the�same�period.�The�following�figures,�showing�reservoir�operation�both�in�isolated�and�joint�operation,�illustrate�this�fact.� Figure� A6.14,� corresponding� to� a� reservoir� size� of� 0.2,� shows� that� in� isolated�operation� the� reservoir� is� emptied�during� the�El�Niño�occurrence�of�April� 1997–May�1998,� while� in� joint� operation� the� reservoir� is� emptied� in� April� 2001.� The� El� Niño�occurrence� of� April� 1997–April� 1998� is� balanced� by� large�scale� generation� in� the�Jepírachi�power�plant,�showing�the�complementarity�of�river�discharges�in�the�Guavio�River�and�wind�generation�in�the�Jepírachi�power�plant.�Figure�A6.15,�corresponding�to�a�reservoir�size�of�0.5,�illustrates�the�same�effect.�
0 0.2 0.4 0.6 0.8 1Guavio�River�(isolated) 0.064 0.334 0.451 0.481 0.507 0.514Jepirachi�(isolated) 0.089 0.089 0.089 0.089 0.089 0.089Guavio�River�+�Jepirachi�in�isolated�operation 0.153 0.423 0.540 0.570 0.596 0.602Guavio�River�+�Jepirachi�in�joint�operation 0.212 0.709 0.860 0.908 0.935 0.962
FIRM�ENERGY�FOR�GUAVIO�AND�JEPIRACHI�IN�ISOLATED�AND�JOINT�OPERATION�
Reservoir�volume�expressed�as�a�fraction�of�mean�energy�inflow�to�Guavio
Firm�Energy/Mean�Energy
0.000
0.200
0.400
0.600
0.800
1.000
1.200
0 0.1 0.2 0.3 0.4 0.5 0.6 0.7 0.8 0.9 1
Firm
ener
gy/M
ean
ener
gy
Reservoir size/Mean annual energy
Guavio R. + Jepirachi (joint)
Guavio R. + Jepirachi (isolated)
Guavio R.(isolated)
Jepirachi (isolated)
SKU_18504_Wind_Energy_Colombia_6-17-10.pdf 113SKU_18504_Wind_Energy_Colombia_6-17-10.pdf 113 6/17/2010 12:32:19 PM6/17/2010 12:32:19 PM
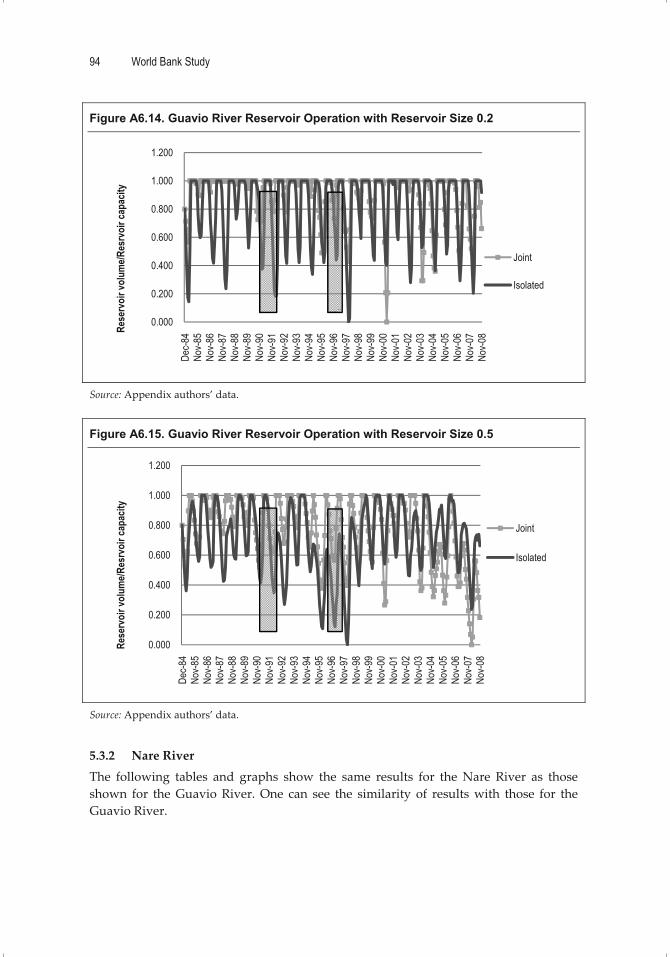
94 World Bank Study
�
Figure A6.14. Guavio River Reservoir Operation with Reservoir Size 0.2
�
Source:�Appendix�authors’�data.��
Figure A6.15. Guavio River Reservoir Operation with Reservoir Size 0.5
�
Source:�Appendix�authors’�data.��
5.3.2� Nare�River�The� following� tables� and� graphs� show� the� same� results� for� the�Nare� River� as� those�shown� for� the�Guavio�River.�One� can� see� the� similarity� of� results�with� those� for� the�Guavio�River.�
0.000
0.200
0.400
0.600
0.800
1.000
1.200
Dec-8
4No
v-85
Nov-8
6No
v-87
Nov-8
8No
v-89
Nov-9
0No
v-91
Nov-9
2No
v-93
Nov-9
4No
v-95
Nov-9
6No
v-97
Nov-9
8No
v-99
Nov-0
0No
v-01
Nov-0
2No
v-03
Nov-0
4No
v-05
Nov-0
6No
v-07
Nov-0
8Rese
rvoi
r vol
ume/R
esrv
oir c
apac
ity
Joint
Isolated
0.000
0.200
0.400
0.600
0.800
1.000
1.200
Dec-8
4No
v-85
Nov-8
6No
v-87
Nov-8
8No
v-89
Nov-9
0No
v-91
Nov-9
2No
v-93
Nov-9
4No
v-95
Nov-9
6No
v-97
Nov-9
8No
v-99
Nov-0
0No
v-01
Nov-0
2No
v-03
Nov-0
4No
v-05
Nov-0
6No
v-07
Nov-0
8
Rese
rvoi
r vol
ume/R
esrv
oir c
apac
ity
Joint
Isolated
SKU_18504_Wind_Energy_Colombia_6-17-10.pdf 114SKU_18504_Wind_Energy_Colombia_6-17-10.pdf 114 6/17/2010 12:32:19 PM6/17/2010 12:32:19 PM

Wind Energy in Colombia 95
�
Table A6.19. Firm Energy for Nare and Jepírachi in Isolated and Joint Operation
Source:�Appendix�authors’�data.��
Figure A6.16. Firm Energy for Nare and Jepírachi in Isolated and Joint Operation
�
Source:�Appendix�authors’�data.��
Figure A6.17. Nare River Reservoir Operation with Reservoir Size 0.2
�
Source:�Appendix�authors’�data.�
0 0.2 0.4 0.6 0.8 1Nare�River(isolated) 0.179 0.369 0.435 0.459 0.471 0.480Jepirachi�(isolated) 0.089 0.089 0.089 0.089 0.089 0.089Nare�River�+�Jepirachi�in�isolated�operation 0.268 0.458 0.524 0.548 0.560 0.569Nare�River�+�Jepirachi�in�joint�operation 0.410 0.811 0.943 0.972 0.994 1.009
FIRM�ENERGY�FOR�NARE�AND�JEPIRACHI�IN�ISOLATED�AND�JOINT�OPERATION
Reservoir�volume�expressed�as�a�fraction�of�mean�energy�inflow�to�Nare
Firm�Energy/Mean�Energy
0.000
0.200
0.400
0.600
0.800
1.000
1.200
0 0.1 0.2 0.3 0.4 0.5 0.6 0.7 0.8 0.9 1
Firm
ener
gy/M
ean
ener
gy
Reservoir size/Mean annual energy
Nare R. + Jepirachi (joint)
Nare R. + Jepirachi (isolated)
Nare R.(isolated)
Jepirachi (isolated)
0.000
0.200
0.400
0.600
0.800
1.000
1.200
Dec-8
4No
v-85
Nov-8
6No
v-87
Nov-8
8No
v-89
Nov-9
0No
v-91
Nov-9
2No
v-93
Nov-9
4No
v-95
Nov-9
6No
v-97
Nov-9
8No
v-99
Nov-0
0No
v-01
Nov-0
2No
v-03
Nov-0
4No
v-05
Nov-0
6No
v-07
Nov-0
8Rese
rvoi
r vol
ume/R
esrv
oir c
apac
ity
Isolated
Joint
SKU_18504_Wind_Energy_Colombia_6-17-10.pdf 115SKU_18504_Wind_Energy_Colombia_6-17-10.pdf 115 6/17/2010 12:32:19 PM6/17/2010 12:32:19 PM

96 World Bank Study
�
Figure A6.18. Nare River Reservoir Operation with Reservoir Size 0.5
�
Source:�Appendix�authors’�data.��
5.3.3� Cauca�River�The� following� tables� and� figures� show� the� same� results� for� the�Cauca�River� as� those�shown�for�the�Guavio�and�Nare�Rivers.�Once�again,�one�can�easily�see�the�similarity�of�results�with�those�for�the�Guavio�and�Nare�Rivers.��Table A6.20. Firm Energy for Cauca and Jepírachi in Isolated and Joint Operation
Source:�Appendix�authors’�data.�
0.000
0.200
0.400
0.600
0.800
1.000
1.200
Dec-8
4No
v-85
Nov-8
6No
v-87
Nov-8
8No
v-89
Nov-9
0No
v-91
Nov-9
2No
v-93
Nov-9
4No
v-95
Nov-9
6No
v-97
Nov-9
8No
v-99
Nov-0
0No
v-01
Nov-0
2No
v-03
Nov-0
4No
v-05
Nov-0
6No
v-07
Nov-0
8
Rese
rvoi
r vol
ume/R
esrv
oir c
apac
ity
Isolated
Joint
0 0.2 0.4 0.6 0.8 1Cauca�River�(isolated) 0.146 0.381 0.417 0.443 0.466 0.489Jepirachi�(isolated) 0.089 0.089 0.089 0.089 0.089 0.089Cauca�River�+�Jepirachi�in�isolated�operation 0.234 0.470 0.506 0.532 0.555 0.578Cauca�River�+�Jepirachi�in�joint�operation 0.346 0.824 0.903 0.922 0.941 0.957
FIRM�ENERGY�FOR�CAUCA�AND�JEPIRACHI�IN�ISOLATED�AND�JOINT�OPERATIONFirm�Energy/Mean�Energy
Reservoir�volume�expressed�as�a�fraction�of�mean�energy�inflow�to�Cauca
SKU_18504_Wind_Energy_Colombia_6-17-10.pdf 116SKU_18504_Wind_Energy_Colombia_6-17-10.pdf 116 6/17/2010 12:32:19 PM6/17/2010 12:32:19 PM

Wind Energy in Colombia 97
�
Figure A6.19. Firm Energy for Cauca and Jepírachi in Isolated and Joint Operation
�
Source:�Appendix�authors’�data.���
Figure A6.20. Cauca River Reservoir Operation with Reservoir Size 0.2
�
Source:�Appendix�authors’�data.��
0.000
0.200
0.400
0.600
0.800
1.000
1.200
0 0.1 0.2 0.3 0.4 0.5 0.6 0.7 0.8 0.9 1
Firm
ener
gy/M
ean
ener
gy
Reservoir size/Mean annual energy
Cauca R. + Jepirachi (joint)
Cauca R. + Jepirachi (isolated)
Cauca R.(isolated)
Jepirachi (isolated)
0.000
0.200
0.400
0.600
0.800
1.000
1.200
Dec-8
4No
v-85
Nov-8
6No
v-87
Nov-8
8No
v-89
Nov-9
0No
v-91
Nov-9
2No
v-93
Nov-9
4No
v-95
Nov-9
6No
v-97
Nov-9
8No
v-99
Nov-0
0No
v-01
Nov-0
2No
v-03
Nov-0
4No
v-05
Nov-0
6No
v-07
Nov-0
8
Rese
rvoi
r vol
ume/R
esrv
oir c
apac
ity
Isolated
Joint
SKU_18504_Wind_Energy_Colombia_6-17-10.pdf 117SKU_18504_Wind_Energy_Colombia_6-17-10.pdf 117 6/17/2010 12:32:20 PM6/17/2010 12:32:20 PM

98 World Bank Study
�
Figure A6.21. Cauca River Reservoir Operation with the Reservoir Size 0.5
�
Source:�Appendix�authors’�data.�
5.3.4� Magdalena�River�The� following� tables� and� figures� show� the� same� results� for� the�Magdalena� River� as�those�shown�for�the�Guavio�River.�One�can�see�the�similarity�of�results�with�those�for�the�Guavio�River.��Table A6.21. Firm Energy for Magdalena and Jepírachi in Isolated and Joint Operation
Source:�Appendix�authors’�data.��
Figure A6.22. Firm Energy for Magdalena and Jepírachi in Isolated and Joint Operation
�
Source:�Appendix�authors’�data.��
0.000
0.200
0.400
0.600
0.800
1.000
1.200
Dec-8
4No
v-85
Nov-8
6No
v-87
Nov-8
8No
v-89
Nov-9
0No
v-91
Nov-9
2No
v-93
Nov-9
4No
v-95
Nov-9
6No
v-97
Nov-9
8No
v-99
Nov-0
0No
v-01
Nov-0
2No
v-03
Nov-0
4No
v-05
Nov-0
6No
v-07
Nov-0
8
Rese
rvoi
r vol
ume/R
esrv
oir c
apac
ity
Isolated
Joint
0 0.2 0.4 0.6 0.8 1Magdalena�River�(isolated) 0.082 0.354 0.429 0.447 0.465 0.484Jepirachi�(isolated) 0.089 0.089 0.089 0.089 0.089 0.089Magdalena�River�+�Jepirachi�in�isolated�operation 0.170 0.442 0.518 0.536 0.554 0.572Magdalena�River�+�Jepirachi�in�joint�operation 0.350 0.770 0.869 0.910 0.929 0.948
FIRM�ENERGY�FOR�MAGDALENA�AND�JEPIRACHI�IN�ISOLATED�AND�JOINT�OPERATION
Reservoir�volume�expressed�as�a�fraction�of�mean�energy�inflow�to�Magdalena
Firm�Energy/Mean�Energy
0.0000.1000.2000.3000.4000.5000.6000.7000.8000.9001.000
0 0.1 0.2 0.3 0.4 0.5 0.6 0.7 0.8 0.9 1
Firm
ener
gy/M
ean
ener
gy
Reservoir size/Mean annual energy
Magdalena R. + Jepirachi (joint)Magdalena R. + Jepirachi (isolated)Magdalena R.(isolated)Jepirachi (isolated)
SKU_18504_Wind_Energy_Colombia_6-17-10.pdf 118SKU_18504_Wind_Energy_Colombia_6-17-10.pdf 118 6/17/2010 12:32:20 PM6/17/2010 12:32:20 PM

Wind Energy in Colombia 99
�
Figure A6.23. Magdalena River Reservoir Operation with Reservoir Size 0.2
�Source:�Appendix�authors’�data.���
Figure A6.24. Magdalena River Reservoir Operation with Reservoir Size 0.5
�
Source:�Appendix�authors’�data.��
��
0.000
0.200
0.400
0.600
0.800
1.000
1.200
Dec-8
4No
v-85
Nov-8
6No
v-87
Nov-8
8No
v-89
Nov-9
0No
v-91
Nov-9
2No
v-93
Nov-9
4No
v-95
Nov-9
6No
v-97
Nov-9
8No
v-99
Nov-0
0No
v-01
Nov-0
2No
v-03
Nov-0
4No
v-05
Nov-0
6No
v-07
Nov-0
8Rese
rvoi
r vol
ume/R
esrv
oir c
apac
ity
Isolated
Joint
0.000
0.200
0.400
0.600
0.800
1.000
1.200
Dec-8
4No
v-85
Nov-8
6No
v-87
Nov-8
8No
v-89
Nov-9
0No
v-91
Nov-9
2No
v-93
Nov-9
4No
v-95
Nov-9
6No
v-97
Nov-9
8No
v-99
Nov-0
0No
v-01
Nov-0
2No
v-03
Nov-0
4No
v-05
Nov-0
6No
v-07
Nov-0
8
Rese
rvoi
r vol
ume/R
esrv
oir c
apac
ity
Isolated
Joint
SKU_18504_Wind_Energy_Colombia_6-17-10.pdf 119SKU_18504_Wind_Energy_Colombia_6-17-10.pdf 119 6/17/2010 12:32:20 PM6/17/2010 12:32:20 PM

�
���
Eco-Audit
Environmental Benefits Statement �The�World�Bank�is�committed�to�preserving�Endangered�Forests�and�natural�resources.�We�print�World�Bank�Working�Papers�and�Country�Studies�on�postconsumer�recycled�paper,� processed� chlorine� free.� The� World� Bank� has� formally� agreed� to� follow� the�recommended� standards� for� paper� usage� set� by� Green� Press� Initiative—a� nonprofit�program� supporting� publishers� in� using� fiber� that� is� not� sourced� from� Endangered�Forests.�For�more�information,�visit�www.greenpressinitiative.org.��In�2008,�the�printing�of�these�books�on�recycled�paper�saved�the�following:��
Trees*� Solid�Waste� Water�Net�Greenhouse�
Gases� Total�Energy�
289� 8,011� 131,944� 27,396� 92�mil.�*40�feet�in��height�and��6–8�inches�in�diameter�
Pounds� Gallons� Pounds�CO2�Equivalent� BTUs�
�
�����
SKU_18504_Wind_Energy_Colombia_6-17-10.pdf 120SKU_18504_Wind_Energy_Colombia_6-17-10.pdf 120 6/17/2010 12:32:20 PM6/17/2010 12:32:20 PM

ISBN 978-0-8213-8504-3
SKU 18504
Wind Energy in Colombia is part of the World Bank Study series. These papers are published to communicate the results of the Bank’s ongoing research and to stimulate public discussion.
The purpose of this study is to provide decision makers—analysts, planners, operators, genera-tors, and policy makers—in Colombia as well as in other countries with a set of policy options to promote the use of wind power. Of the renewable energy alternatives available in Colombia, wind power was chosen for its technical maturity, its relatively low cost compared to other options, and Colombia’s previous experiences and wind power potential. The possible policy options include fi nancial instruments, government fi scal mechanisms, and adjustments to the regulatory system. The single most effective policy instrument to promote wind power in Colombia consists of recog-nizing its potential to complement hydroelectric power. This study is part of an ongoing project to identify and address barriers to the development of nonconventional renewable energy resources in Colombia’s power sector.
World Bank Studies are available individually or on standing order. This World Bank Study series is also available online through the World Bank e-library (www.worldbank.org/newelibrary).