wind farms in a gross pool market: australian national electricity market hugh outhred school of...
TRANSCRIPT

Wind Farms in a Gross Pool Market:Australian National Electricity Market
Hugh OuthredSchool of Electrical Engineering and Telecommunications
The University of New South Wales
Sydney, Australia
Tel: +61 2 9385 4035; Fax: +61 2 9385 5993; Email: [email protected]
www.sergo.ee.unsw.edu.au
Perspectives from AbroadSustainable Energy Ireland, Dublin 13 June

2
Outline
• Scope & design of the Australian NEM
• Managing supply-demand balance
• Ancillary service, spot & derivative markets
• Renewable energy certificate trading
• Network connection issues
• Conclusions

3
Electricity industry structure in SE Australia
Gen 1
Gen 2
Gen X
GenerationSector:-
largegenerators
Gen 3
TransmissionSector
NSWVictoria
South Aust.Queensland& possiblyTasmania
TransmissionSector
NSWVictoria
South Aust.Queensland& possiblyTasmania
Electricity
Financial instrument& REC (emission) trading
Distributor 1
Distributor 2
Distributor Y
Distributionsector
Electricity
Multi-regionNational
ElectricityMarket(NEM)
Intentionsoffers &
payments
Retailer Z
Retailer 2
Retailer 1
Retailsector
Intentionsbids &
payments
Tx networkpricing
Tx networkpricing
Networkaccess End-use
Equipment&
DistributedresourcesElectricity
End-usesector
Contestablecustomers
Franchisecustomers
RetailMarkets
Embeddedgenerators

4
Key NEM features
• NEM covers all participating states:– A multi-region pool with intra-regional loss factors– Ancillary services, spot market & projections– Auctions of inter-regional settlement residues– Operated by NEMMCO (owned by states)
• Compulsory participants in NEM:– All generators & dispatchable links > 30 MW– Network service providers & retailers
• Contestable consumers may buy from NEM

5
Region boundaries & inter-connectors
• Regions boundaries selected so that:– Transmission constraints are rare within a region– Frequently-occurring constraints are placed on
region boundaries
• Region boundaries to be reset as required:– Whenever a constraint occurs > 50 hours/year
• Unregulated inter-connectors are allowed:– If dispatchable so that it can bid like a generator:
• ‘Directlink’ the first (operating since July 2000):– 180 MW DC link between NSW & Queensland regions

6
Scope of the NEM
• Queensland• New South Wales & ACT• Victoria• South Australia• Tasmania (on connection to the mainland)
NEM regions are indicated, and theirboundaries need not be on state borders
(e.g. two regions in NSW)

7
NEM regional spot market model(Based on NEMMCO, 1997)
1,500 MW
NSW
Snowy
Victoria
850 MW
3,000 MW
1,100 MW
Queensland
750 MW
750 MW
South Aust
500 MW
250 MW
300 MW
Tasmania480 MWBasslink
thermalor stabilityflow limits
Directlink180 MW
(unregulated DC)
Murraylink 220 MW (unregulated DC)& possibly SANI (regulated AC)

8
Supply-demand balance in the electricity industry
• Frequency is a measure of supply-demand balance– always varying due to fluctuations in power flows
• Wind farms will make frequency more variable: – Does this matter & if so, who should pay for additional
control action?
ThermalPower stations
Wind farms
Hydrogenerators
Industrial
Commercial
Residential
Generator input power Load electrical power
+ _

9
Managing supply-demand balance in Australian NEM
Spot market forecast &derivative markets
Frequency controlancillary service
markets for period tSupply/demand
projections & FCASderivative markets
FCAS marketsfor period t+1
Spot marketfor period t
Spot marketfor period t+1
time
spotperiod t
spotperiod t+1
increasing uncertainty
Physical issues
Commercial issues

10
NEMMCO processes for managing supply-demand balancePower system reliability & security standards
NEMMCO Forecasts of supply & demand• 10 year (annual)• 2 year (weekly)• 1 week (hourly)• day-ahead spot price& dispatch (30 min)
NEMMCO operation:•Participant bid/offers•Network data•Demand forecast•Reserve threshold•Security constraints•Reliability safety net
Spot& FCASMarkets
DerivativeMarkets

11
Bidding & dispatch(source: NEMMCO)
Day -2 Day -1 Day 0 Day 1
Dispatch Day
Commitment notices
Initial Offers/Bids 1230hrsthen re-bids until dispatch time
ST PASA 1400hrs
1st Pre-dispatch 1600hrsUpdated 3hrly
5-minute & 30-minute prices as set;previous days data at 0800hrs
CapacityEnergy/RoC
12
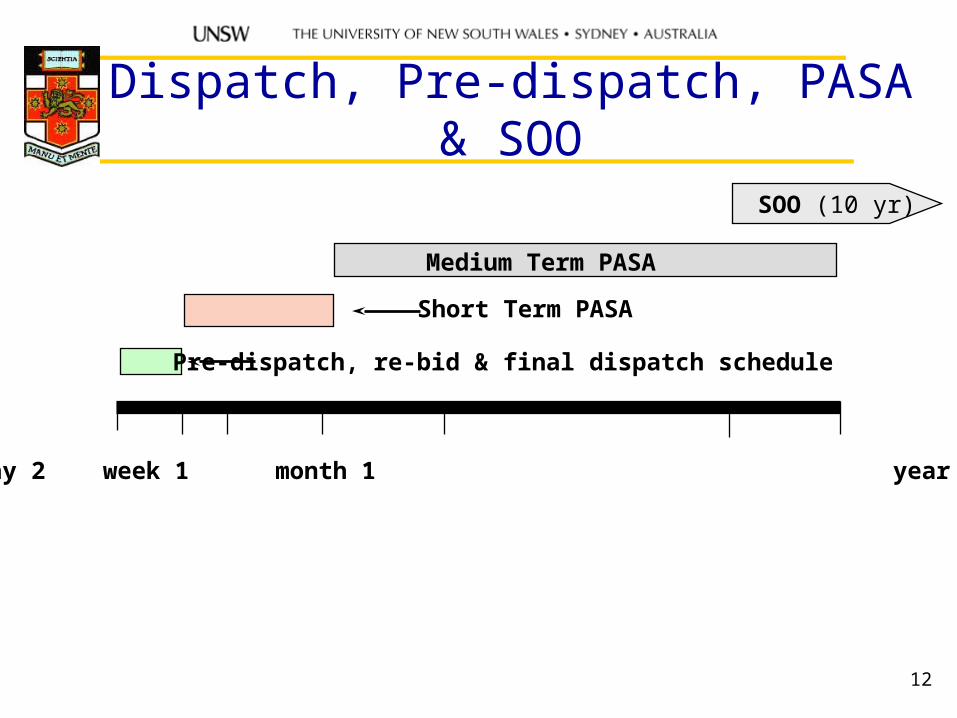
Dispatch, Pre-dispatch, PASA & SOO
0 day 1 day 2 week 1 month 1 year 1 year 2
Medium Term PASA
Pre-dispatch, re-bid & final dispatch schedule
Short Term PASA
SOO (10 yr)
13
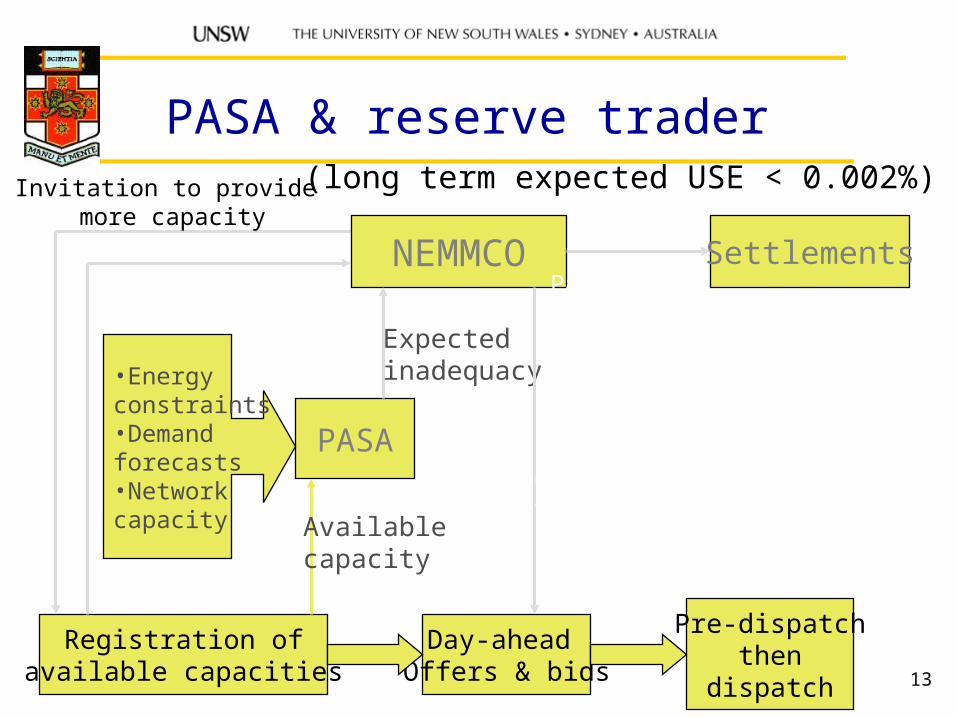
PASA & reserve trader
PASA
•Energyconstraints•Demandforecasts•Networkcapacity
Registration ofavailable capacities
Day-ahead Offers & bids
Pre-dispatchthen
dispatch
Invitation to provide more capacity
Purchase of more capacity
NEMMCO
Expectedinadequacy
Purchased capacityoffered to market (usually at VOLL)Available
capacity
SettlementsPayment for purchased capacity
(long term expected USE < 0.002%)

14
Spot market offers & bids
• Generators, retailers & consumers:– Price-quantity curve (sell/buy) for each half hour:
• ≤ 10 daily prices, quantities changeable until dispatch
– Demand forecasts ‘bid in’ at $10000/MWH (VoLL)
• Dispatchable links between regions:– Flow offer curve based on price difference
• Bids & offers ranked to give dispatch stack:– Considering loss factors & inter-tie constraints– 5 minute prices set by economic dispatch:
• Half-hourly averages are calculated in ‘real time’
15
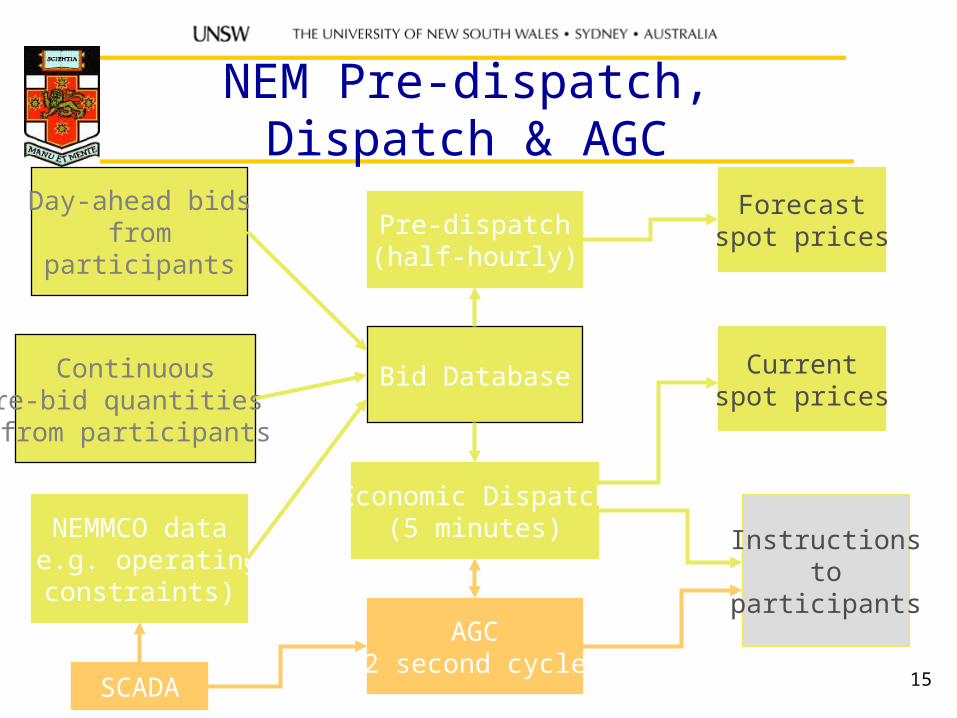
NEM Pre-dispatch, Dispatch & AGC
Bid Database
Instructionsto
participants
Forecastspot prices
Currentspot prices
Pre-dispatch(half-hourly)
Economic Dispatch(5 minutes)NEMMCO data
(e.g. operatingconstraints)
Day-ahead bidsfrom
participants
Continuousre-bid quantities from participants
AGC(2 second cycle)
SCADA

16
Modelling regulated interconnectors& intra-region location
• Regulated interconnector between 2 regions– Modelled by a linearised marginal loss function:
• A ‘dynamic’ network loss factor that depends on flow• Flow limits (security or thermal criteria)
• Locational effects within regions– Modelled by ‘static’ network loss factors (LFs)
• Annual average of estimated half-hour marginal losses for each generator node & group of consumer nodes
– Intra-regional constraints not modelled but a ‘constrained-on’ generator cannot set price
17
Financial instrument trading in support of NEM
• Trading in swap & cap contracts:– Bilateral trading– Over-the-counter instruments– Exchange-traded CFDs (swaps)
• Inter-regional hedges:– Specialised form of financial instrument:
• to manage regional price difference risks• funded by interconnector settlement residues
– NEMMCO inter-regional settlement residue auctions:
• Commenced in 1999

18
Monthly average NEM Regional Ref Prices (RRPs) since market inception (NECA, 03Q1 Stats, 2003)

19
Cumulative spot prices(7-day moving sum) (NECA, 2003)

20
Ave, Max & Min RRP in SA region (truncated at 300 $/MWH) (NECA, 03Q1 Stats, 2003)
21
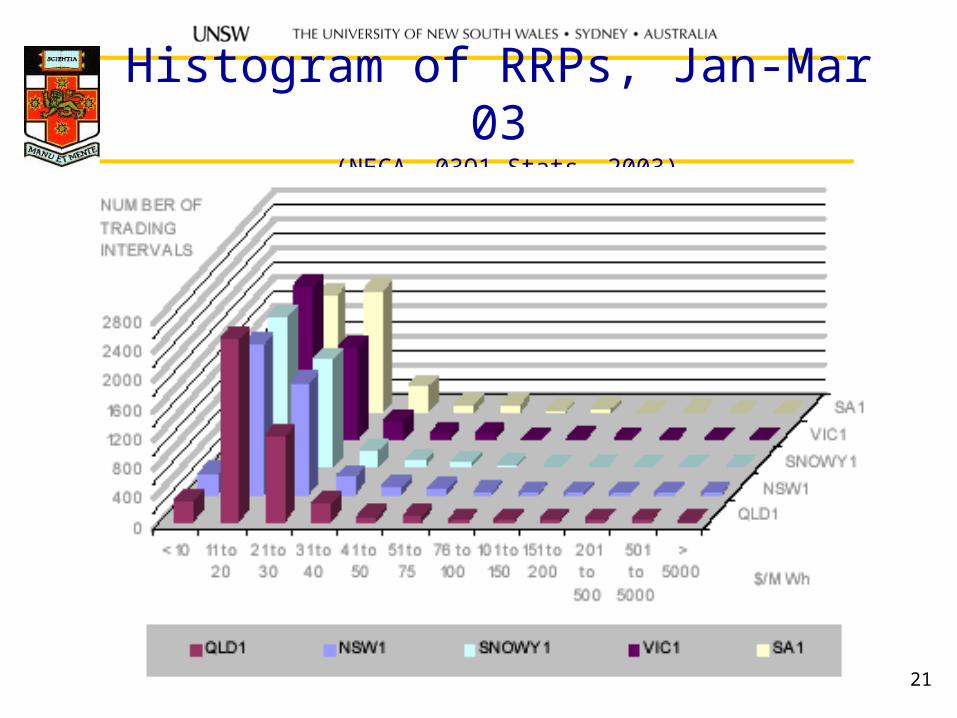
Histogram of RRPs, Jan-Mar 03 (NECA, 03Q1 Stats, 2003)

22
Cumulative duration curve, SA RRP, Jan-Mar 03 (NECA, 03Q1 Stats, 2003)
23
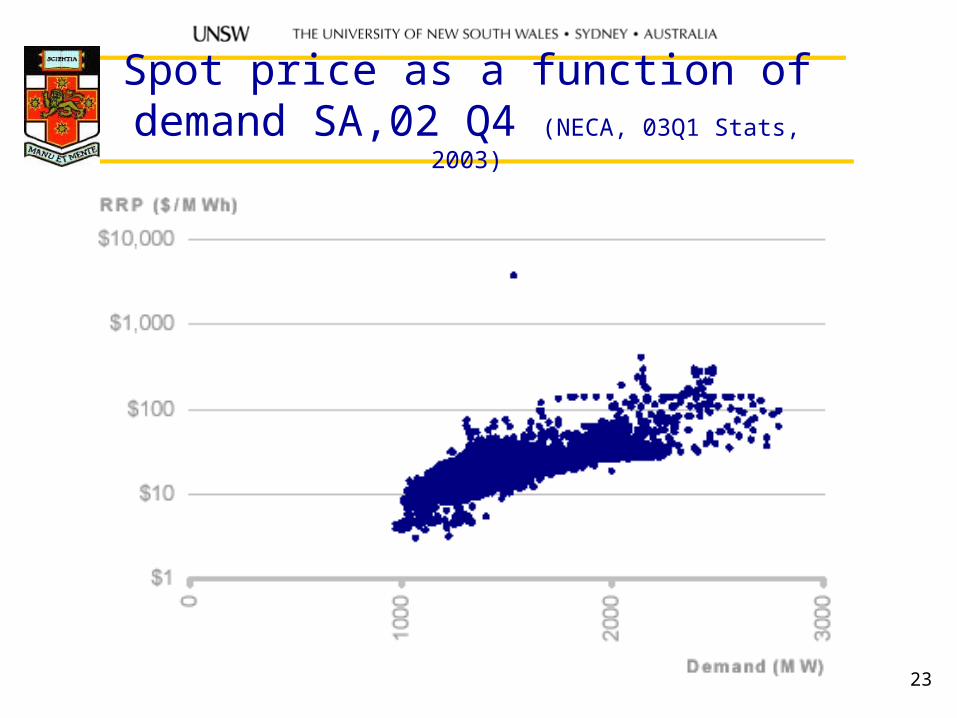
Spot price as a function of demand SA,02 Q4 (NECA, 03Q1 Stats, 2003)
24
Key derivative markets
• Forward contracts (futures)– Expected spot price for a defined load shape
& period (eg flat annual demand)– Either OTC or exchange traded
• Call options
• Renewable energy certificates– Available to qualifying generators– Increasing to 9,500 GWH pa at 2010 then
constant to 2020

25
Flat forward contract prices, 1999-2006 (NECA, 02Q4 Statistics, 2003)
26
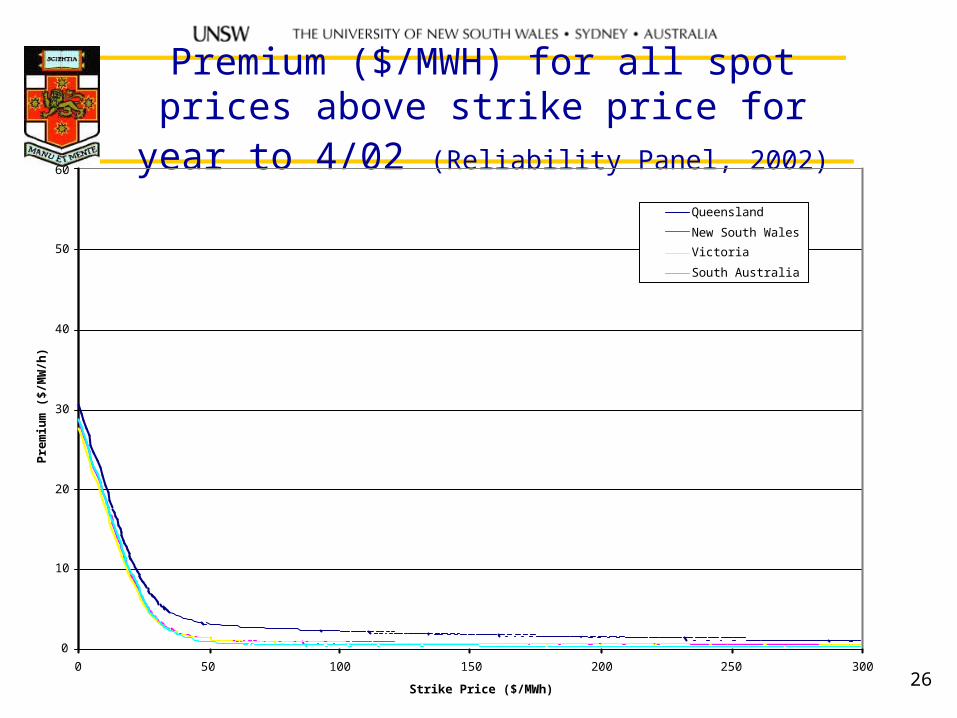
Premium ($/MWH) for all spot prices above strike price for year to 4/02 (Reliability Panel, 2002)
0
10
20
30
40
50
60
0 50 100 150 200 250 300
Strike Price ($/MWh)
Pre
miu
m (
$/M
W/h
)
Queensland
New South Wales
Victoria
South Australia

27
Renewable Energy Certificate Prices - forecast to 2020 (A$/MWH) (ORER, 2003)
20
25
30
35
40
45
50
55
60
2002 2003 2004 2005 2006 2007 2008 2009 2010 2011 2012 2013 2014 2015 2016 2017 2018 2019 2020
28
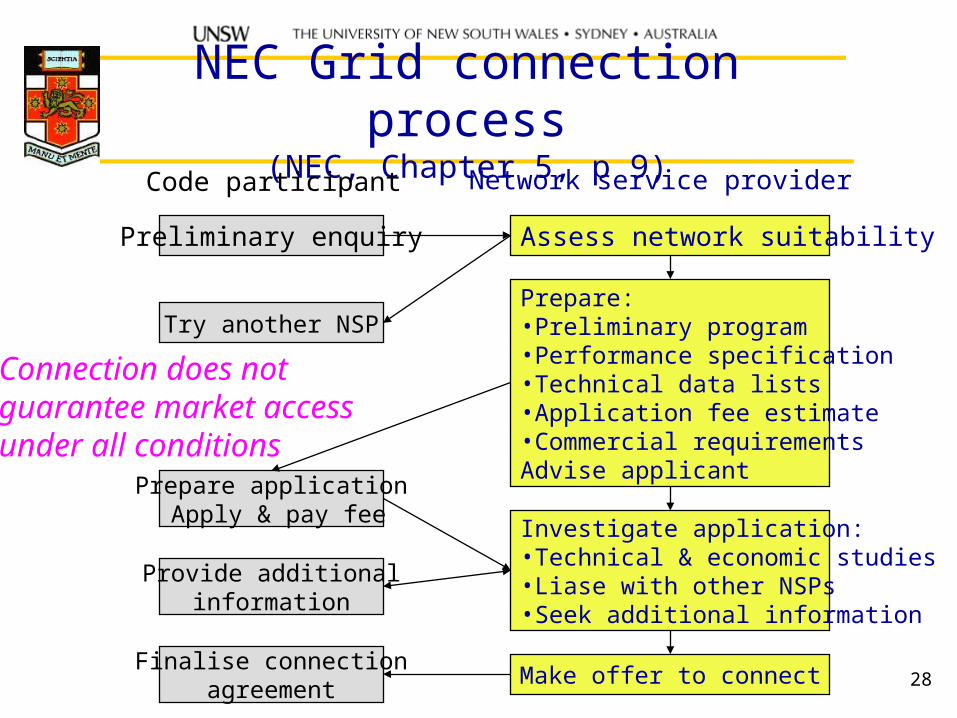
NEC Grid connection process(NEC, Chapter 5, p 9)
Code participant Network service provider
Preliminary enquiry Assess network suitability
Try another NSPPrepare:•Preliminary program•Performance specification•Technical data lists•Application fee estimate•Commercial requirementsAdvise applicant
Prepare application Apply & pay fee
Provide additionalinformation
Investigate application:•Technical & economic studies•Liase with other NSPs•Seek additional information
Make offer to connectFinalise connection
agreement
Connection does notguarantee market accessunder all conditions

29
National Electricity Code (NEC) connection requirements for generators
• Reactive power & voltage control capability
• Quality of electricity injected into network
• Protection requirements
• Remote control arrangements
• Excitation system requirements
• Loading rates
• Ride-through to avoid cascading outages:– Loss of largest generator; 175ms network fault

30
NEC categories of generators
• Either market, non-market or exempt– Market implies sell to NEM
• Can then also sell ancillary services
– Non-market or exempt implies sell to retailer
• Either scheduled or non scheduled:– Scheduled implies centrally dispatched:
• Must then participate in the NEM processes of bidding, pre-dispatch & PASA
• Default category for generation projects > 30 MW• Not appropriate for “intermittent” generation, eg wind

31
Future directions for NEM COAG Energy Market Review (2002) Recommendations
• Create a National Energy Regulator• Improve control of generator market power• Improve operation of derivative markets• Give NEMMCO a NEM-wide planning function• Increase number of NEM regions & aim for full
nodal pricing• Phase in interval metering & retail competition
for all end-users• Enhance competition and network scope for gas• Replace existing climate cahnge policies by
emission trading

32
Key web sites
• COAG Energy market review:– www.energymarketreview.org
• National Electricity Market Management Company:– www.nemmco.com.au
• National Electricity Code Administrator:– www.neca.com.au
• Electricity Supply Association of Australia:– www.esaa.com.au
• University of New South Wales - Sustainable energy research group:– www.sergo.ee.unsw.edu.au