wind turbine operational and emergency stop measurements ... · wind turbine operational and...
TRANSCRIPT

General rights Copyright and moral rights for the publications made accessible in the public portal are retained by the authors and/or other copyright owners and it is a condition of accessing publications that users recognise and abide by the legal requirements associated with these rights.
Users may download and print one copy of any publication from the public portal for the purpose of private study or research.
You may not further distribute the material or use it for any profit-making activity or commercial gain
You may freely distribute the URL identifying the publication in the public portal If you believe that this document breaches copyright please contact us providing details, and we will remove access to the work immediately and investigate your claim.
Downloaded from orbit.dtu.dk on: May 01, 2020
Wind Turbine Operational and Emergency Stop Measurements Using Point TrackingVideogrammetry
Schmidt Paulsen, Uwe; Erne, Oliver; Möller, Theodor; Sanow, Günter; Schmidt, Tim
Published in:Conference proceedings
Publication date:2009
Document VersionPublisher's PDF, also known as Version of record
Link back to DTU Orbit
Citation (APA):Schmidt Paulsen, U., Erne, O., Möller, T., Sanow, G., & Schmidt, T. (2009). Wind Turbine Operational andEmergency Stop Measurements Using Point Tracking Videogrammetry. In Conference proceedings Bethel (US):SEM.

Wind Turbine Operational and Emergency Stop Measurements Using Point Tracking Videogrammetry
Uwe Schmidt Paulsen, National Laboratory for Sustainable Energy, Risoe DTU, Roskilde, Denmark Oliver Erne, Theodor Moeller and Gunter Sanow, GOM GmbH, Mittelweg 7-8, Braunschweig, Germany
Tim Schmidt, Trilion Quality Systems, 500 Davis Drive, Suite 200, Plymouth Meeting, PA 19462
ABSTRACT Wind turbine installations are increasing significantly in numbers as well as capacity as part of the global demand for sustainable energy sources. This leads to stronger need for comprehensive dynamic test data to support reliable cost reductions while meeting safety requirements. The complete wind turbine structural mechanical response at different load conditions is of particular interest. Detailed analysis of the component operational resonances during loading, such as the interaction of the blade and tower deformations is of basic engineering importance. Testing of the structure with traditional equipment would require quite extensive sensor instrumentation and analysis effort. It was found that a 3D full-field optical system has excellent capability to capture the operational displacements of even the largest wind turbines. Dynamic field measurements were performed on a 500 kW Nordtank wind turbine at the Risoe DTU campus in Denmark using a customized PONTOS point tracking photogrammetry system. Data was acquired at 100 Hz for 7 seconds from more than 50 targets within a 50 meter wide field of view. Practical aspects of the measurement setup including illumination requirements, blade and tower targeting, the ability to automatically track numerous targets through multiple rotations, rigid body correction (de-rotation), and the use of projected angles and trajectory analysis are discussed. Results include movies with animated vectors and associated time history plots for 3D directional and resultant displacements of all blades and the support tower, as well as trajectory plots. INTRODUCTION Wind turbine installations are increasing significantly in numbers as well as capacity as part of the global demand for sustainable energy sources. Worldwide, currently only 1% of electrical power comes from turbines, but this will be rapidly increasing. Denmark is already making extensive use of wind turbines. They presently provide 20% of electrical power nationwide, and some districts on the west coast derive 100% of their power needs from wind energy during peak winds and heavy power demand. The goal is to increase the nationwide supply to 30-40% by 2025. The United States has set a target of having wind turbines provide 20% of electrical power requirements by 2030. Larger turbines are more cost-effective per kilowatt-hour than smaller ones. Many installed turbines have a rotor diameter of 80 meters, and the five-year goal with future generation blades (FGB) is to achieve 120 meter blade lengths, and therefore 240 meter diameter rotors for a 20MW wind turbine. This leads to stronger need for comprehensive dynamic test data to support reliable cost reductions while meeting safety requirements. The complete wind turbine (rotor and tower) structural mechanical response is of interest for start-up, normal operations and particularly during emergency stops. Large wind turbines present significant challenges for measurements. Their height precludes a stable vantage point normal to the rotor; measurements must be conducted off-axis, and preferably from ground level. Any rotating component, regardless of size, is more difficult to measure than a non-rotating one. Strain gauges with wireless data transfer, typically mounted as shown in Figure 1, allow some degree of condition monitoring, but give information on loading and stresses and will not provide operating deflection shapes without intelligent data processing. Scanning laser vibrometers are often used for modal analysis, and manufacturers such as Polytec have introduced de-rotator systems for use on tires, consumer and automotive fans, and small turbines. However, this setup requires an axial view of the test object, and the time required for sequential data acquisition precludes use on certain transient events. The state of the art of experimental modal testing of structures is that analysis has advanced from signal or system analysis techniques towards operational modal analysis. Analysis approaches such as physical modeling (mainly FEM) and system identification techniques including non-parametric methods such as frequency peak picking and frequency domain decomposition, and parametric methods such as ARMA, correlative function estimation and state space identification are elements of modal testing [1-4]. In principal, a flexible structure such as a 19 m wind turbine rotor blade can be modally analyzed by using acoustic or force excitation [5-6] and later visualized with software tools such as ME’scope, accounting for noise input and robust estimation of modal frequencies, damping and mode shapes. However, there is still the entire multi-body wind turbine to consider under operational conditions, which will include both symmetric and non-symmetric mode shapes. The structure is assembled from numerous flexible components, which makes the complete vibration picture complex;

testing such a structure demands quite extensive sensor instrumentation and analysis efforts. System responses in operation may be quite different than what is expected. A system analysis approach can provide some answers, in particular the low frequency modes of the vibration components. The technique of using the stroboscopic light effect on camshafts triggered the idea to use this on wind turbines. Operating deflection shapes on rotating shafts have been analyzed [7], and ways were identified to carry out similar measurements on the complete wind turbine structure when under normal operation. Laser vibrometry [8] has been used on rotating shafts for torsional deflection mode shape analysis. In the absence of measured damping, mass and stiffness matrices, we apply the mathematical notation that the structure’s vibration response Z is a result of a mechanical load with associated displacement X: Z=H⋅X [9]. With measured 3D coordinate y on a wind turbine component, displacements of points relative to a reference point x could be used for applying modal analysis techniques [10-11], including transmissibility functions, operating deflection shapes, parameter estimation of damping and resonances, and mode shapes. For the instrumented blade shown in Figure 1, the origin is regarded as a reference position with respect to other sensor positions on the blade. The blade is interpreted as a lumped system with degree of freedom (DOF) elements, each represented as an SDOF system. With the reference position moving in space, the response functions for the vector displacement z=y-x typically resembles those in Figure 2. For the wind turbine under normal (non-transient) conditions, transmissibility functions contain responses excited by Gaussian stochastic wind. There are also guidelines for sensor positioning in terms of uncertainty for the mode shape calculation, again referring to Figure 1 on the relative variation of DOFi+2 and DOFi+1 [6]. This was also kept in mind for targeting for the optical measurements. The distance between two targets measuring the flap-wise accelerations should be as large as (practically) possible, and the angle between their measuring axes should be as close as possible to zero. The wind turbine is instrumented with a variety of sensors on the rotor, nacelle and tower and measurement equipment for 35Hz to 10 kHz sampling. Measurement records are stored for post analysis in a data base [12-13]. Analysis of the data is carried out using the 35 Hz sampled records.
Figure 1: Typical strain gauge locations and degrees of freedom for a wind turbine blade [6].
Figure 2: Frequency response functions, SDOF of mechanical system. Amplitude is on the left and phase on the right.
Full-field optical techniques, particularly stereo photogrammetry and videogrammetry systems, have some intrinsic features and capability that are extremely advantageous for the present challenge of measuring the operational deflection shapes of huge

rotating objects. PONTOS is a 3D point target tracking system developed by GOM. It uses a calibrated pair of cameras to triangulate the x,y,z coordinates of the centers of circular dot targets, which typically have a 10-15 pixel diameter. It is desirable to have an angle between the cameras of about 25 degrees to facilitate accurate triangulation of the z coordinate, although camera angles from 15 to 45 degrees can be used. The practical implication of this is that the distance between the two cameras needs to be between 1/3 - 1/2 of the working distance from the cameras to the test object. A robust ellipse finder algorithm makes a best-fit outline and then the centers of the dot targets can be determined with an accuracy of approximately 1/50 pixel. Therefore, the nominal accuracy of the measurement is 30 microns (0.001”) per meter of field of view. The coordinates of each target at a reference condition are subtracted from the current coordinates in each test image to compute the 3D displacements. A large number of experimental data points can be obtained with negligible mass loading. The commercially available fully integrated PONTOS system comprises a heavy duty carbon fiber camera support, a pair of cameras that can take 500 images per second at full resolution of 1280 x 1024 pixels, synchronized ring flashes for each camera, and a computer for camera and flash control, image processing to determine the target coordinates in each image, and comprehensive deformation analysis, reporting and export software tools. The standard sensor, shown in Figure 3, is normally used for fields of view of 1-3 meters. Common applications include car door slam, engine startup, wind tunnel testing, etc. [14] Modified calibration methods have been developed to meet the desire for larger field of view capability, including civil structure measurements. Fields of view up to about 15 meters have been addressed, for example to study the deflections of beams, and to track orientation and deceleration of aerospace vehicles during swing and ground impact tests [15]. Using the same hardware with different surface preparation and full-field pattern matching (ARAMIS 3D image correlation), thousands of data points are obtained, comparable to the number of nodes in an FEA model, allowing for extensive correlation between experimental and analytic data. ARAMIS has been applied for modal analysis of small rotating devices such as fans, and complex shapes such as dryer panel stampings and a model helicopter. Using both high speed cameras and slower cameras with a phase stepping method for harmonic excitation, detailed comparisons have been made to impact hammer and laser vibrometry results, including assessment of modal assurance criteria (MAC) for flexible modes [16-18]. Because of the potential advantages, the use of stereo optical techniques is being contemplated for modal analysis of passenger aircraft during ground vibration tests (GVT) [19].
Figure 3: Standard PONTOS sensor comprising heavy-duty carbon fiber camera support, stereo pair of 500 fps cameras, synchronized ring flashes, and computer for data acquisition control, image processing, and comprehensive analysis, reporting and data export software features.
EXPERIMENTAL CONSIDERATIONS AND SETUP The goal of this project was to apply the PONTOS system on an operating full-scale wind turbine for the first time ever, which involved some significant experimental challenges. The PONTOS field setup is shown in Figure 4. The cameras were placed on tripods approximately 55 meters away from each other, and approximately 110 meters away from the tower of the wind turbine, resulting in a camera angle of about 30 degrees. High power strobes synchronized to the cameras were used to illuminate retro-reflective targets on the blades and tower. The targets had a diameter of 0.3 meters in order to meet the 10 pixel diameter requirement for accurate determination of the center-point coordinates. Testing indicated that targets wetted by rain could still be successfully identified. The targets, shown in Figure 5, were positioned with certain criteria in mind. Lines consisting of at least three markers were established to define pitch deflection axes for each blade. The minimum spacing between targets was two to three times the diameter, in order to ensure that target identification would be consistent from frame to frame despite multiple rotations. The
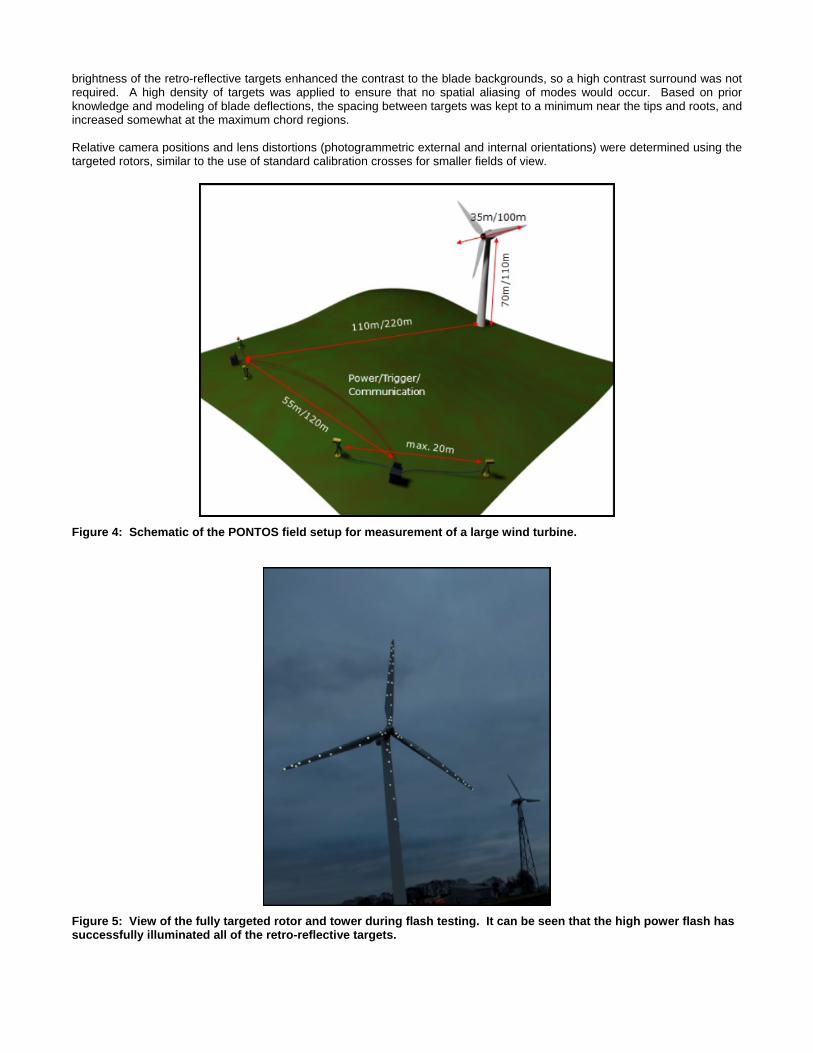
brightness of the retro-reflective targets enhanced the contrast to the blade backgrounds, so a high contrast surround was not required. A high density of targets was applied to ensure that no spatial aliasing of modes would occur. Based on prior knowledge and modeling of blade deflections, the spacing between targets was kept to a minimum near the tips and roots, and increased somewhat at the maximum chord regions. Relative camera positions and lens distortions (photogrammetric external and internal orientations) were determined using the targeted rotors, similar to the use of standard calibration crosses for smaller fields of view.
Figure 4: Schematic of the PONTOS field setup for measurement of a large wind turbine.
Figure 5: View of the fully targeted rotor and tower during flash testing. It can be seen that the high power flash has successfully illuminated all of the retro-reflective targets.

The tower targets are momentarily occluded each time a blade passes in front of it, but these dropouts are of very short duration compared to the complete rotation time, and are therefore acceptable. The camera tripods and also the flashes and computers had to be placed on ploughed land, which was far from the ideal of stable concrete pads. There were changes in soil softness between setup and testing due to rain and frost. The primary concern was that relative shifts between the two cameras could cause de-calibration and reduction in accuracy, particularly for the coordinates representing out-of-plane motion. The PONTOS software monitors the intersection deviation for every target in every image, and it was found that de-calibration did not occur. In general, the bigger the field of view, the more robust the stereo sensor is, because a much larger relative movement is required before allowable limits are exceeded. The major practical problem that occurred was, ironically, a lack of strong wind during the available test periods. It was extremely unfortunate that normal operating conditions could not be reproduced for detailed study, although this certainly did not detract from the success of the measurement capability feasibility study. The low and shifting wind speed was below the threshold for steady operation of the turbine, which is normally required for application of modal analysis processing. The less energetic loading from low wind is also known to affect the operating deflection shapes and can cause mode shifts due to the light damping of the structure. In order to proceed with the feasibility study and to acquire some useful data, the asynchronous generator was forced to act as a motor, thereby increasing the rotor speed. The motor was then idled at various speeds, while the available wind acted on the blades. In addition, an emergency stop simulating grid loss such as from a lightning strike or downed transmission cable was performed, starting from a condition near normal operating speed. The 500 kW Nordtank turbine used for this test is equipped with a fail-safe brake mechanism whereby the outermost 1.7 meters of the blades will be released and automatically act as aerodynamic brakes, quickly reducing the rotational speed. In addition, the dynamic equilibrium between the rotor and gearbox and generator is lost, so the rotor becomes a free-rotating mass, which is a significant change in boundary conditions. TRADITIONAL INSTRUMENT RESULTS Figure 6 shows a comparison of measured spectral load responses (PSD) from strain gauges indicating the edgewise blade bending on each of the three blades, rotor shaft torsion and tower bending near the base.
Figure 6: Power spectral density (PSD) of edge-wise bending moments for the three blades (gray trace and two similar ones), tower base bending moment (TB-dashed trace) and rotor shaft torsion (ST-bottom trace).
Here at this atypical operating condition, the turbine is rotating slowly at a speed of 0.17-0.29 Hz, demonstrating the edgewise blade vibration and in the rotor shaft. Furthermore, the blade masses rotating with the rotor plane excite the tower natural frequency at about 0.8 Hz, and the first symmetrical mode of the edgewise blade frequency at around 3.0 Hz. The wind power spectrum is a straight sloping line following the main trend of the signals in the Figure 6. A similar explanation on the influence of this ambient excitation is applicable for Figure 7, which also reveals a similar result as in Figure 6 on the coupled vibrations in the structure, with a major flap-wise motion correlated to the tower bending response and rotor shaft bending.
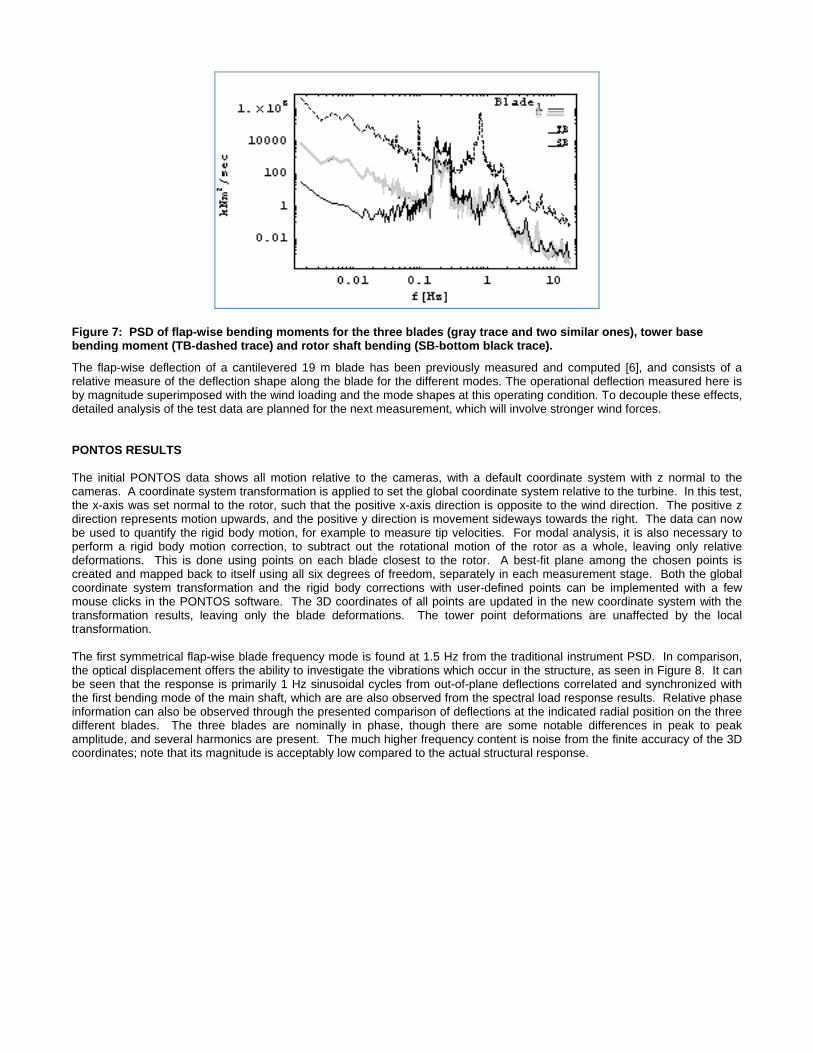
Figure 7: PSD of flap-wise bending moments for the three blades (gray trace and two similar ones), tower base bending moment (TB-dashed trace) and rotor shaft bending (SB-bottom black trace).
The flap-wise deflection of a cantilevered 19 m blade has been previously measured and computed [6], and consists of a relative measure of the deflection shape along the blade for the different modes. The operational deflection measured here is by magnitude superimposed with the wind loading and the mode shapes at this operating condition. To decouple these effects, detailed analysis of the test data are planned for the next measurement, which will involve stronger wind forces. PONTOS RESULTS The initial PONTOS data shows all motion relative to the cameras, with a default coordinate system with z normal to the cameras. A coordinate system transformation is applied to set the global coordinate system relative to the turbine. In this test, the x-axis was set normal to the rotor, such that the positive x-axis direction is opposite to the wind direction. The positive z direction represents motion upwards, and the positive y direction is movement sideways towards the right. The data can now be used to quantify the rigid body motion, for example to measure tip velocities. For modal analysis, it is also necessary to perform a rigid body motion correction, to subtract out the rotational motion of the rotor as a whole, leaving only relative deformations. This is done using points on each blade closest to the rotor. A best-fit plane among the chosen points is created and mapped back to itself using all six degrees of freedom, separately in each measurement stage. Both the global coordinate system transformation and the rigid body corrections with user-defined points can be implemented with a few mouse clicks in the PONTOS software. The 3D coordinates of all points are updated in the new coordinate system with the transformation results, leaving only the blade deformations. The tower point deformations are unaffected by the local transformation. The first symmetrical flap-wise blade frequency mode is found at 1.5 Hz from the traditional instrument PSD. In comparison, the optical displacement offers the ability to investigate the vibrations which occur in the structure, as seen in Figure 8. It can be seen that the response is primarily 1 Hz sinusoidal cycles from out-of-plane deflections correlated and synchronized with the first bending mode of the main shaft, which are are also observed from the spectral load response results. Relative phase information can also be observed through the presented comparison of deflections at the indicated radial position on the three different blades. The three blades are nominally in phase, though there are some notable differences in peak to peak amplitude, and several harmonics are present. The much higher frequency content is noise from the finite accuracy of the 3D coordinates; note that its magnitude is acceptably low compared to the actual structural response.

Figure 8: Blade deflections in the windward direction.
Figure 9 is an example of the usefulness of the initial PONTOS data, before movement correction is applied, quantifying the beginning of the emergency stop, in which the turbine is slowed down from 27 rpm to standstill. The decrease in rotational frequency is evident in the right side of the upper graph. The middle graph is tip velocity, which can be seen to decrease rapidly, leading to significant lateral tower deformations that are visible in the lower graph. The blade passing frequency is clearly dominating the tower response.
Figure 10 uses a combination of the original and rigid-body corrected data to further explore the effects of the beginning of the emergency stop. Tip velocity is again shown for reference. Note the higher order harmonics appearing and increasing in amplitude.
Figure 9: PONTOS data without movement correction quantifies the beginning of the emergency stop. The middle graph is tip velocity, which can be seen to decrease rapidly, leading to significant tower deformations. The decrease in rotational frequency is evident in the upper graph.

Figure 10: Phase angle analysis provides further insight into the beginning of the emergency stop. Tip velocity is again shown for reference. Note the higher frequency response appearing and increasing in amplitude.
Figure 11 is a comparison between the tower and blade deformations, showing the relative amplitudes and phases. When the two blades are at the upside position, as indicated on the image, they bend downwards, causing an elongation of the distance between the markers. At the opposite position the situation has reversed to a shortening of the distance between the markers. Knowledge of these magnitudes (~25 mm in this case) and the bending shape can be used for stress analysis. At the beginning of the emergency stop, the rotor is pitching back and forth due to backlash in the gearbox. This motion was analyzed by monitoring the distance between the markers on two blades, thus providing insight into the coupling of the multi-body system. Further post-processing is planned to better understand these interactions.
Figure 12 shows an example of 3D resultant displacement vector plots for similar points on all three blades. These can be animated during review of the captured data, and are part of the standard PONTOS analysis tools. Here it can be seen that the phases are very orderly, with some amplitude variations.

Figure 11: Tower versus blade deflection during an emergency stop.
Figure 12: Vector plots that can be animated during review of captured data show 3D resultant displacements for three similar points on each blade. The phases are very orderly, with some amplitude variations.

CONCLUSIONS The operating deflection shapes of a 41 meter diameter wind turbine were successfully measured during motoring representing normal operation, and also during an emergency stop. This had never been done before at this size scale, and the calibration, measurement and analysis techniques that were developed for the PONTOS full-field optical system are applicable for even larger turbines, up to at least 100 meters. PONTOS provides unique capability for measurements on extremely large objects and rotating components, with sufficient bandwidth and accuracy to capture and quantify 3D displacements, operating deflection shapes, blade torsion, tower deformation, etc. The PONTOS data compared well with traditional data acquisition in terms of frequency response, but provided dynamic deformation data at numerous locations along the length and chord of all blades as well as the tower. The success of these measurements is extremely encouraging regarding future modal analysis efforts on even bigger turbines as well as other large civil structures. ACKNOWLEDGMENTS Jeppe Herbsgaard Laursen, Zebicon A/S is greatly appreciated for bringing people from GOM and RISØ DTU together, and for his valuable, practical and encouraging support and input into success. GOM is gratefully acknowledged for support, to participate in the experiment and assisting with analysis, in particular Dirk Behring, Oliver Erne, Markus Klein, Gunther Sanow and Theodor Moeller. Thanks also to Hagen Berger, now working at the GOM representative Trilion Quality Systems in the USA, for sharing his own wind turbine testing and data post-processing experience. The technical staff at RISØ DTU campus (BAS), especially Anders B. Møller and Oluf Høst are acknowledged for their technical assistance before, during and after the tests. Thanks to Kirsten A. Frydensberg for valuable help with necessary approvals concerning air traffic safety and car traffic issues. We appreciate the special interest in this topic from the Society for Experimental Mechanics. Thanks to Paul Gloeckner of the Applications Committee for making us aware of it. Finally, the wind energy division, test and measurement program at RISO DTU is gratefully acknowledged for financial support. REFERENCES
1) Andersen, P., Brincker, R., The Stochastic Subspace Identification Techniques.www.svibs.com. 2) Overschee, E. and de Moor, P. Subspace Identification for Linear Systems: Theory, Implementation, Applications.
Kluwer Academic Publishers, 1996. 3) Ventura C. E. and Gade, S., IOMAC Pre-Course. IOMAC 2005. Copenhagen, Denmark, April 2005. 4) Andersen, P. Identification of Civil Engineering Structures Using ARMA Models, Ph.D. Thesis, Aalborg University,
Denmark, 1997. 5) Gade, S., Modal Parameters from a Wind Turbine Wing by Operational Modal Analysis. Internoise, Korea, 2003. 6) Larsen, G.C. et al. Modal Analysis of Wind Turbine Blades. Risø-R-1181(EN), 2002. 7) Døssing, Ole, Structural Stroboscopy -Measurement of Operational Deflection Shapes, Brüel & Kjær Application Note
(BO 0212). 8) Gatzwiller, K. B&K Application Note, Measuring Torsional Operational Deflection Shapes of Rotating Shafts. BO
0402. www.BKSV.com. 9) Bendat, J. et al. Random Data: Analysis and Measurement Procedures. Wiley – Interscience, 1971. 10) McHargue, P. L., Richardson, M.H. Operating Deflection Shapes from Time versus Frequency Domain
Measurements. 11th IMAC Conference Florida USA, 1993. 11) Richardson, M.H. Is It a Mode Shape or an Operating Deflection Shape? Sound & Vibration, 1997. 12) Helgesen, K.O.et al, Wind Turbine Measurement Technique-an Open Laboratory for Educational Purposes, Wind
Energy 11 pp.281-295 Wiley Interscience, 2006. 13) Paulsen. S., Preliminary Results with A Novel Drive Train Measurement System, EWEC2008, Brussels, Belgium,
2007. 14) Erne, O, Friebe, H., and Galanulis, K., Is it possible to replace conventional displacement and acceleration sensor
technology? Solution methods using optical 3D measuring technology, GOM white paper, 2007. 15) Schmidt, T., Tyson, J., Some Common and Not So Common Applications of 3D Image Correlation, Proceedings of
the GOM International User Meeting, Braunschweig, Germany, Sept 25, 2007. 16) Helfrick, M., Niezrecki, C., and Avitabile, P., “Optical Non-contacting Vibration Measurement of Rotating Turbine
Blades,” Proceedings of IMAC-XXVII, Orlando, FL, February 2009. 17) Helfrick, M., Niezrecki, C., Avitabile, P., and Schmidt, T., “3D Digital Image Correlation Methods for Full-Field
Vibration Measurement,” Proceedings of IMAC-XXVI, Orlando, FL, February 2008. 18) Niezrecki and Avitable, Digital Image Correlation Applied to Structural Dynamics, Proceedings of IMAC-XXVII,
Orlando, FL, February 2009. 19) Pickrel, C.R., A Possible Hybrid Approach for Modal Testing of Aircraft, Proceedings of IMAC-XXVII, Orlando, FL,
February 2009.